Report on Kilauea (United States) — July 2015
Bulletin of the Global Volcanism Network, vol. 40, no. 7 (July 2015)
Managing Editor: Edward Venzke.
Edited by A. Elizabeth Crafford.
Kilauea (United States) Lava lake in Halema'uma'u Crater overflows its rim; lava front from Pu'u 'O'o stalls near Pahoa village
Please cite this report as:
Global Volcanism Program, 2015. Report on Kilauea (United States) (Crafford, A.E., and Venzke, E., eds.). Bulletin of the Global Volcanism Network, 40:7. Smithsonian Institution. https://doi.org/10.5479/si.GVP.BGVN201507-332010
Kilauea
United States
19.421°N, 155.287°W; summit elev. 1222 m
All times are local (unless otherwise noted)
Activity at Kīlauea during 27 June-31 December 2014 focused on lava flowing from fissures on Pu'u O'o's NE flank (the June 27th lava flow) and advancing toward Pahoa village (BGVN 39:12). Scattered breakouts upslope of the flow front continued into 2015. This report, taken primarily from Hawaiian Volcano Observatory (HVO) quarterly reports, covers activity of the ongoing eruption from 1 January through 30 June 2015.
Two noteworthy events occurred at Kīlauea during the first half of 2015. In late April, the lava lake in Halema'uma'u Crater overflowed from its vent onto the floor of the crater for the first time since the current eruption began, building up a new vent rim and sending explosions of small bombs and spatter onto the Overlook parking lot. The advancement of the June 27th flow toward the town of Pahoa ceased in early March and new flows initiated from several breakouts much closer to Pu'u 'O'o' crater, adding significant areas of coverage to the June 27th flow.
Activity at Halema'uma'u. The lava lake in Halema'uma'u rose and fell in its normal patterns during the first quarter of 2015, closely mimicking short-term changes in summit tilt. The lava level fluctuated about 40-50 m below the vent rim (the floor of Halema'uma'u) during January and February. A large DI (deflation-inflation) event during the first week of March, however, caused the lake to drop to a low of about 75 m below the vent rim. This drop saw the collapse of the inner ledge that has long bounded the southern edge of the lava lake. The lava level recovered thereafter and was back up to around 35-40 m below the rim by the end of March.
For the first three weeks of April, the lava lake behaved in typical fashion, with north-to-south circulation, and frequent transitions between periods of spattering and calm. The lava level rose early in the month as the summit recovered from a DI event, but then the volcano entered a period without DI events and the lava level remained steady (figure 245).
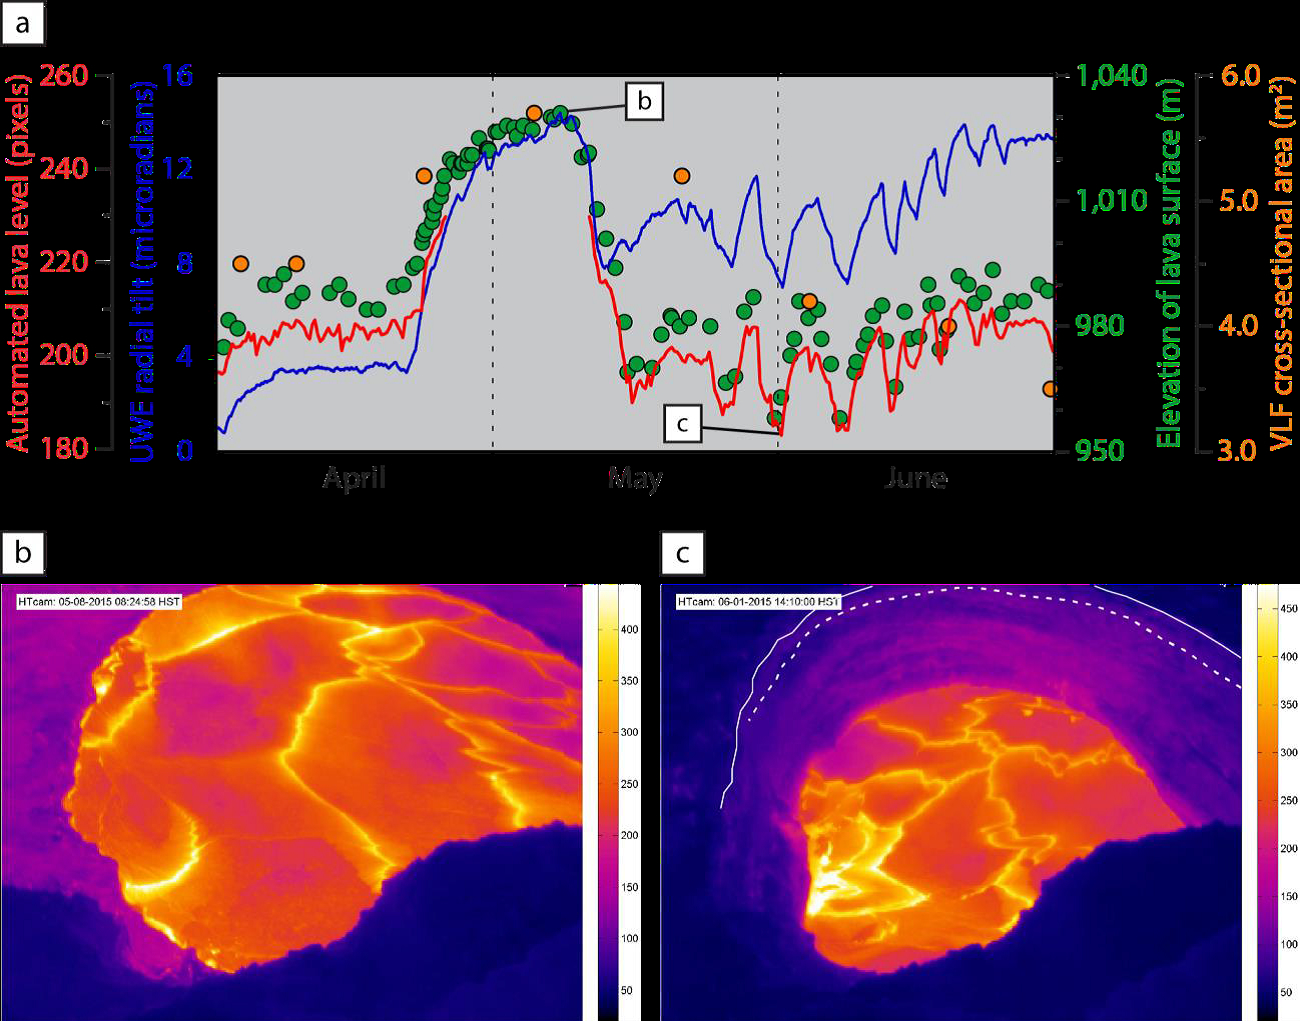 |
Figure 245. Activity at the Halema'uma'u lava lake of Kīlauea, April-June 2015. (a) Summary plot of radial UWE (Uwekahuna tiltmeter, on the northwest rim of Kīlauea's caldera) tilt (blue) and lava level (red) at Halema'uma'u during the second quarter of 2015. The lava level rose above the field of view of the camera during late April-early May, resulting in no data for that period. Green dots show field measurements of lava level via laser rangefinder. Orange dots show VLF measurements of lava tube cross-sectional area near Pu'u 'O'o. Position along time series for images shown in panels b and c is indicated. (b) Thermal image showing the lava level on 8 May 2015, when near highest level. (c) Thermal image showing the lava level on 1 June 2015, when near lowest level; the solid white line shows the newly constructed vent rim; the dashed white line shows the original rim. Courtesy of HVO. |
On 21 April the summit began to inflate continuously, and the level of the lava lake began to climb (see figure 245a). First spatter and then the actual lava lake surface came into view from HVO on 23 and 24 April, respectively. The rising level cooked the vent walls, causing a sharp increase in the frequency of loud pops and booms as the walls began to crack. This led to rockfalls into the lava lake, which triggered small explosive events at 0520 on 24 April, at 0157 and 0200 on 25 April, at 1020 on 28 April, and at 1320 on 3 May.
The 24 April event was a collapse of the NW vent rim that threw tephra onto the adjacent floor of Halema'uma'u. No significant amounts of tephra reached the rim. The back-to-back events on 25 April were caused by rockfalls from the S and E corners of the vent, where the crater floor meets the wall. Lapilli and bombs ~30 cm across were tossed onto the Halema'uma'u rim around the Overlook, and finer particles were carried downwind over the parking lot.
The Overlook was struck again on 28 April, when an explosion triggered by the collapse of the crater wall at the SE edge of the vent, threw small bombs and finer material into the parking lot and plastered the ground around and E of the Overlook with enormous, lacework gobs of spatter up to a few meters long. Lithic fragments up to 2 cm were embedded in the spatter, some of which were fairly glassy and quite heavy. The Overlook has been closed to visitors for some time.
Finally, the 3 May event was triggered by a rockfall from the underside and upper face of the overhanging S wall of the vent, below the Overlook. Fist-sized bombs were thrown as far as the Halema'uma'u parking lot, along with finer material.
The lava lake reached the vent rim early on 28 April and overflowed onto the floor of Halema'uma'u for the first time since appearing in 2008, late that night. The following days saw more overflows as the lava level continued to rise, with each overflow coating the vent rim and building it up layer by layer, adding 8 m to the rim's height (figure 246). The longer-lived overflows sent lava up to several hundred meters to the NNE and SW, eventually covering about 1.5 x 10⁵ m2 at the SE edge of Halema'uma'u, or about 30% of the crater floor (not counting the area of the vent opening) (figure 246).
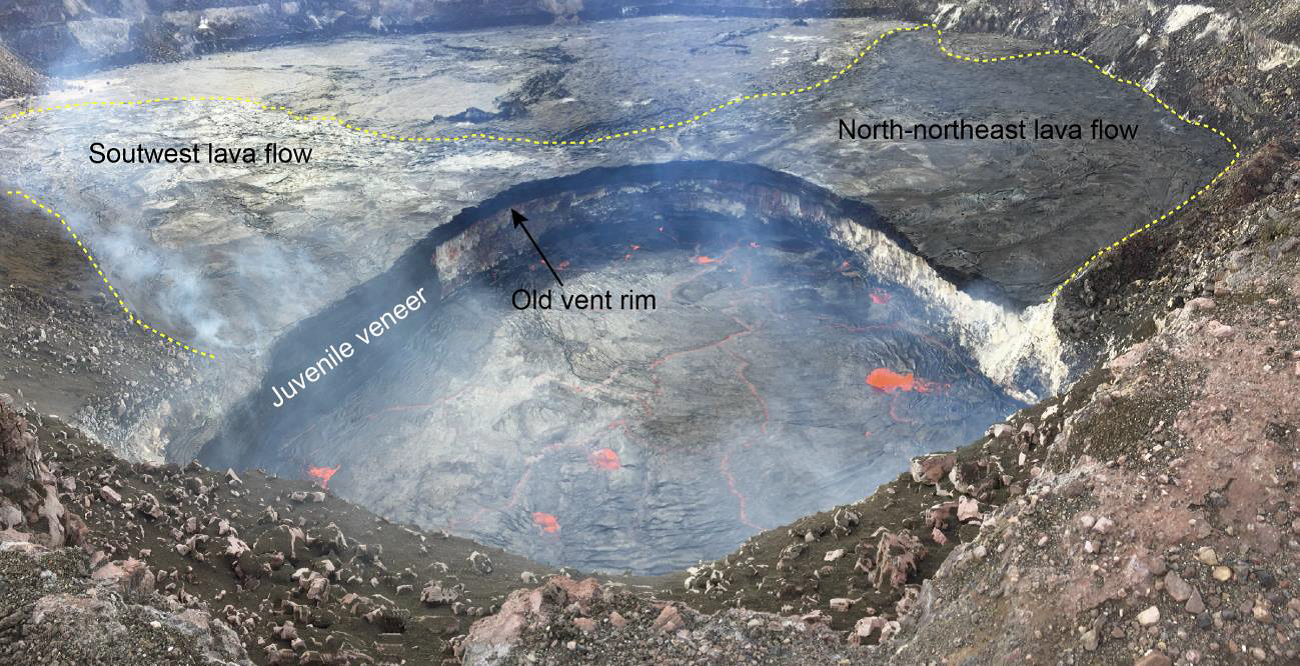 |
Figure 246. Panoramic photo showing the Halema'uma'u lava lake on 15 May 2015. Note the dark, 8-m-thick layer of overflows that define the new vent rim, visible where the juvenile veneer has fallen away. Photo courtesy HVO. |
The high lava level continued until 9 May, when it began to drop along with deflation related to the intrusion of magma beneath the S part of the caldera. Deflation rolled back into inflation on 13 May, but the lava level continued to fall until the 16th, reaching a depth of about 62 m below the new vent rim (54 m below the old rim).
The rest of May and June presented more typical behavior with frequent DI events and a lava lake level that fluctuated accordingly. The level dropped to as low as about 72 m below the new vent rim at the end of May and as high as about 39 m below the rim during the 3rd week of June. The low lava levels through this interval saw the shedding of the juvenile veneer from the walls of the vent as well as one larger collapse involving the E wall and rim of the vent at the end of June.
Activity along the East Rift Zone (ERZ). The June 27th flow remained active throughout this period (figure 247), with a widening of the flow field in several places, and the locus of activity changing substantially during this time. The most distant activity (~20 km NE of the Pu'u 'O'o vent) was scattered across the flow field within about 3.5 km of the Pahoa Marketplace through early March, when all surface flows near Pahoa shut down. The flow's farthest push downslope was in late January, when it reached to within about 500 m of Highway 130 (figure 248).
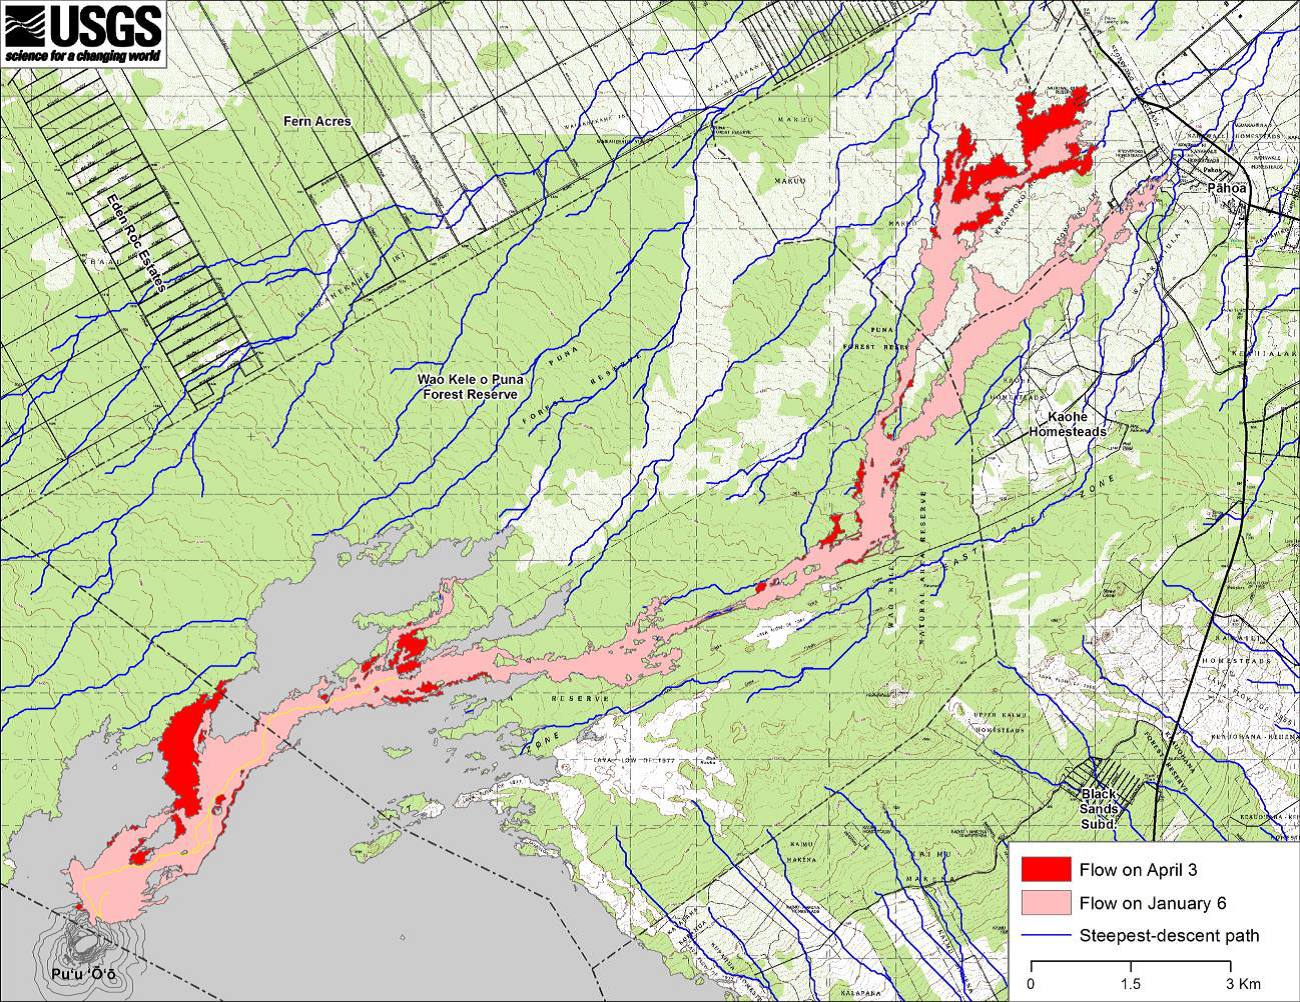 |
Figure 247. Map of the NE flank of Kīlauea showing widening of the June 27th flow field from 6 January to 3 April 2015. Courtesy of HVO. |
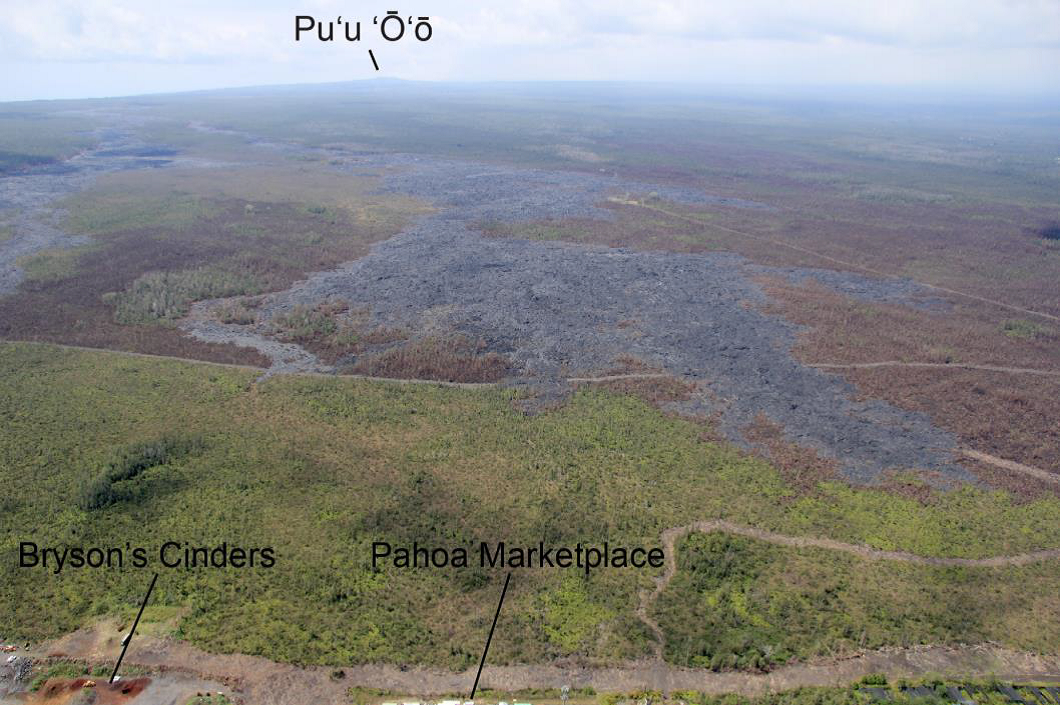 |
Figure 248. Photo showing the Kīlauea lava flow immediately upslope from the Pahoa Marketplace on 13 March 2015, the day after the surface flow in that area shut down. The lobe near lower right is that which reached to within about 500 m of Highway 130. Courtesy of HVO. |
In January and February, small breakouts occurred near the Kaohe Homesteads (figure 247). Beginning in late January through early March, a breakout north of Kahauale'a headed N reaching the forest on the N side of the Pu'u 'O'o flow in mid-February (figures 247, 249).
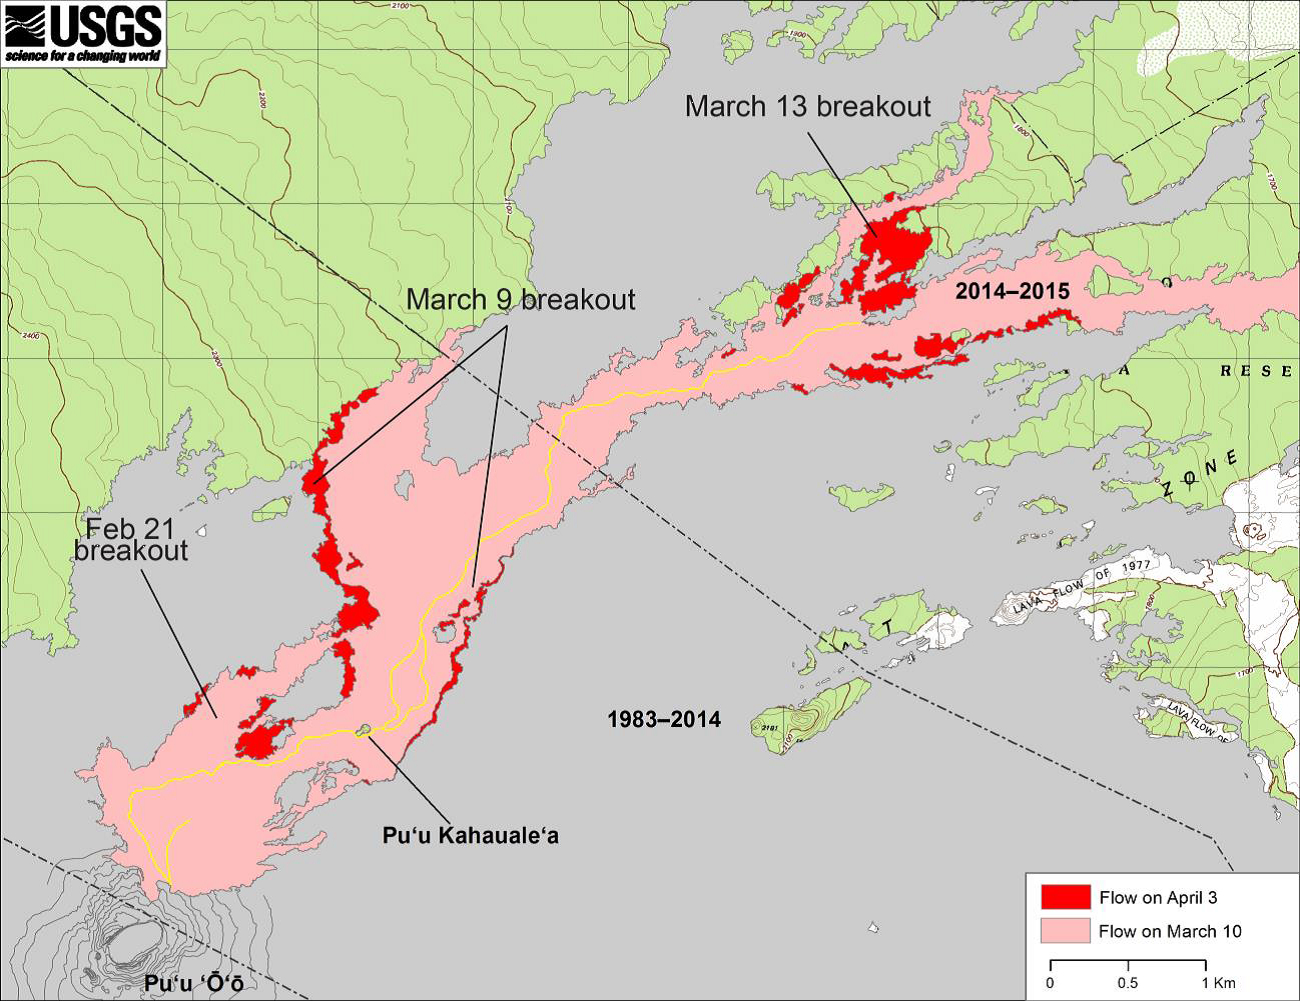 |
Figure 249. Map showing changes to the June 27th flow field near Pu'u 'O'o between 10 March and 3 April 2015. Courtesy of HVO. |
On 21 February a large breakout occurred (figure 249) near the head of the June 27th flow tube system, close to the fissure C vent, within a kilometer of Pu'u 'O'o Crater. The breakout sent lava N along the E side of the original June 27th tube and began to spread out at the base of Pu'u 'O'o in early March. Another large breakout near the S base of Kahauale'a was observed on 10 March (figure 249). This breakout was followed by the complete shutdown of the flow near Kaohe Homesteads and the Pahoa marketplace to the NE. Another breakout about 3 km downslope from Kahauale'a began on 13 March. The change in location of flowing lava from near the Pahoa marketplace, 20 km from Pu'u 'O'o Crater, to the sites within 9 km of the crater (the breakouts of 21 February, 9 March, and 13 March) is noticeable in MIROVA graphs (figure 250).
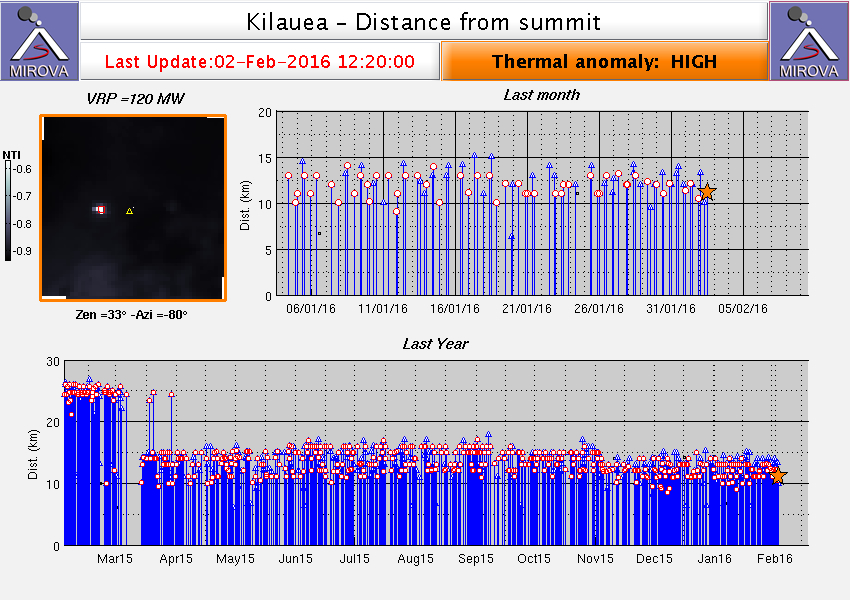 |
Figure 250. Infrared MODIS data from MIROVA showing change in distance from summit of the Kīlauea thermal anomaly occurring at the end of March 2015. This is reflecting the cessation of lava flowing near Pahoa and the increases in flow from the 21 February, 9 March, and 13 March breakouts closer to the Pu'u 'O'o fissure C vent. Courtesy of MIROVA. |
Surface activity associated with these new breakouts, extending over a broad area between about 1 and 8 km NE of Pu'u 'O'o, continued through the end of June and was joined by a few additional breakouts (figure 251) in the same area. With activity spread over such a large area, no single breakout was able to capture the majority of the discharge, and so the June 27th flow did not advance substantially in one direction. Pu'u Kahauale'a was repeatedly impacted by lava flows during this period, and by the end of June, little of it remained above the rising lava deposits.
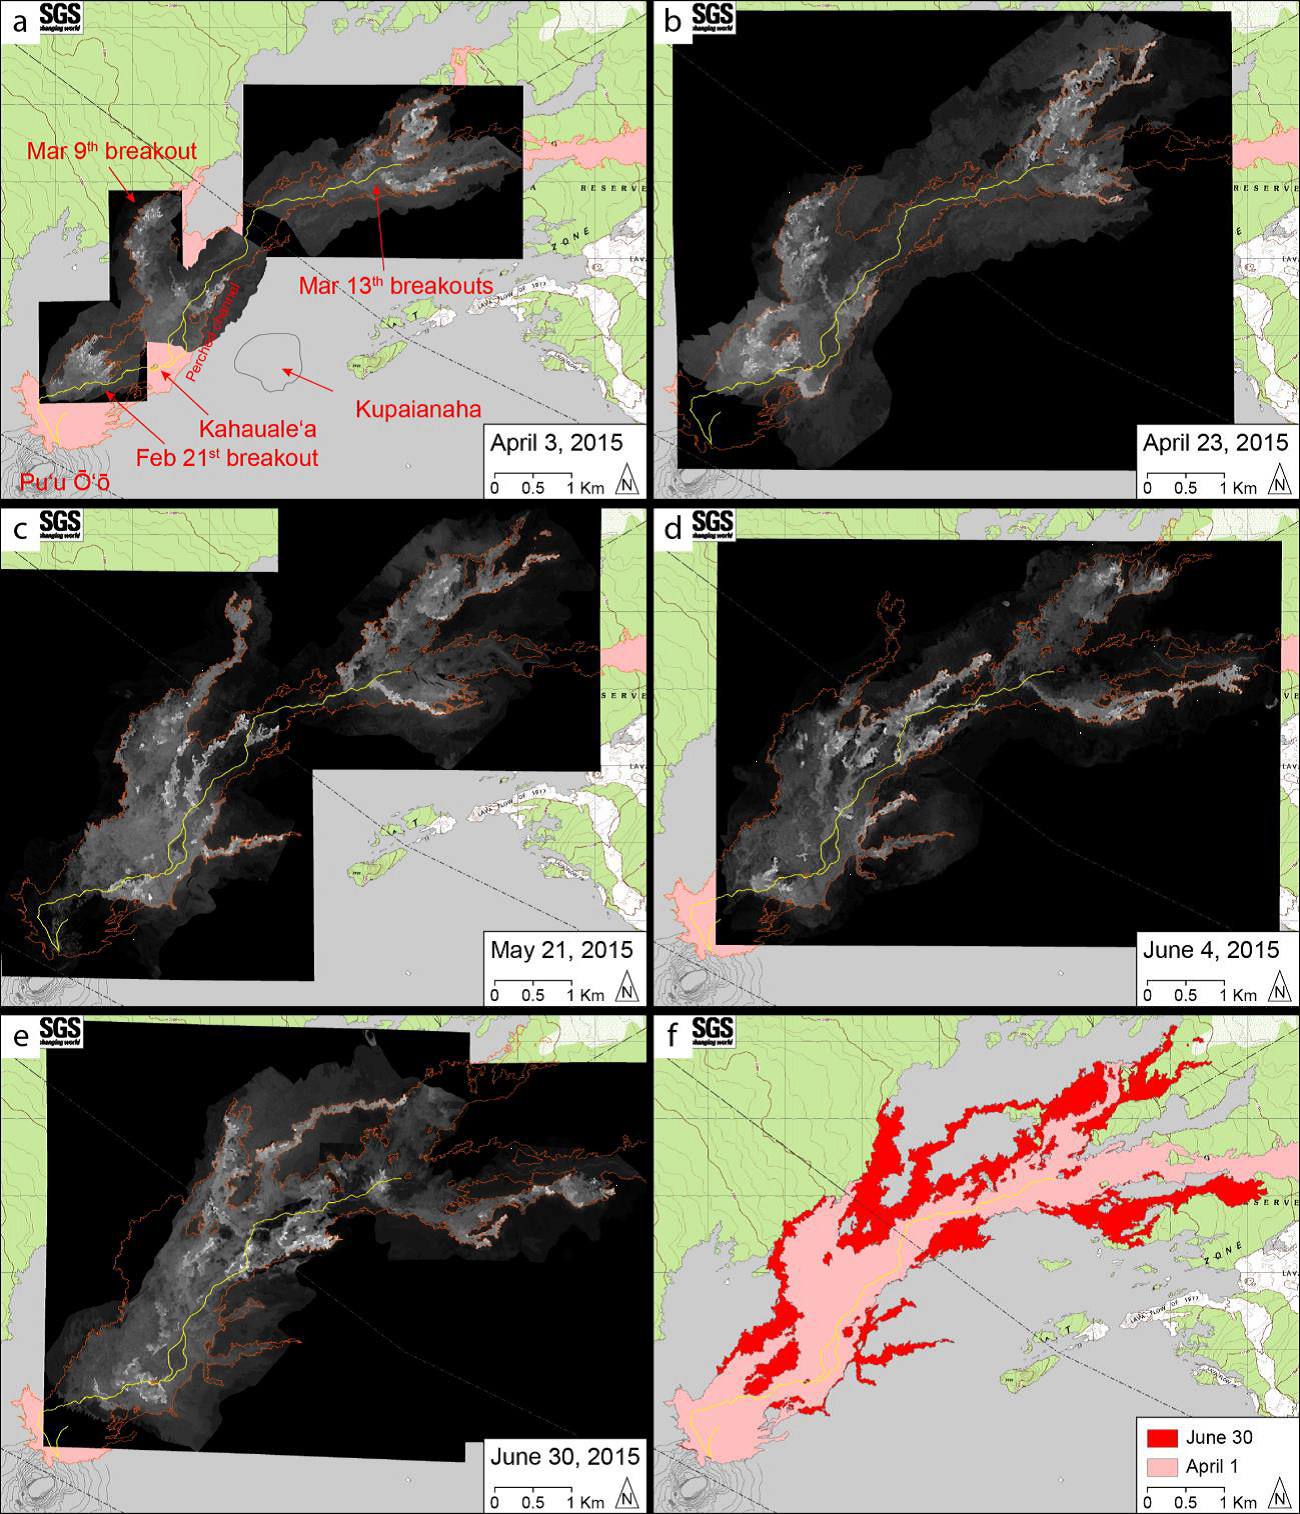 |
Figure 251. Map showing lava flow field changes between 1 April and 30 June 2015. Courtesy of HVO. |
Activity at Pu'u 'O'o. Starting with the onset of the 21 February breakout, the floor and W wall of the current Pu'u 'O'o crater began to subside, presumably as the underlying storage body was partly emptied. Subsidence was accompanied by several small collapses within the crater, revealing small lava ponds at the crater's N and S pits. The subsidence ended in early March.
Small lava flows, fed from nearly all vents in the crater, erupted onto the crater floor during April and May. These flows occurred during the inflationary period, uninterrupted by DI events, leading up to the mid-May summit intrusion.
On 21 April, during the start of one of these periods of crater activity (21-23 April), the W end of the current crater dropped several meters. This period coincided roughly with the start of the rapid summit inflation which preceded the intrusion. The most vigorous period of eruptive activity occurred near the peak in the inflation, just before the intrusion, and resulted in lava filling the entire bottom of the crater.
The crater was relatively quiet after the summit intrusion, and only a few small, short-lived flows erupted into the crater in June. No further subsidence occurred after the April event.
In early April, a new collapse pit on the W side of the old crater floor was observed. The pit was about 27 m across at the rim and held a small lava pond about 24 m down. The pit widened over the following three months, and by 30 June was about 40 m across. Despite this widening, the pit was still overhung on its W end by about 20 m.
Seismicity. Seismicity at the summit and Southwest Rift Zone (SRZ) during the first quarter of 2015 was characterized by swarms of volcano-tectonic (VT) earthquakes and inflation within the rift zone, and long-period (LP) swarms at the summit.
Seismic activity in the SRZ was significantly above background in the first quarter of 2015. Seismicity began rising in early February with increases in rate generally tied to increases in tilt. Earthquake rates were dramatically higher between 10-17 February, with up to 45 located events/day. The maximum magnitude during this phase was M 2.6. Tilt initially recorded inflation until 14 February, corresponding with the peak in event rates, then recorded deflation until 17 February.
In the caldera, a swarm of moderate-depth long period earthquakes occurred beginning on 24 February and persisting into early March. On 10 March another shallow long-period (LP) swarm occurred in the caldera during two bursts from 0930 to 1319 UTC. A third swarm occurred a couple days later on 13 March.
The second quarter of 2015 was characterized by a surge in seismicity, deformation, and lava-lake activity within the summit region. Beginning in late April, earthquake activity throughout the summit region intensely increased and deformation data similarly reflected magma movement at the summit and upper rift zones.
At Halema'uma'u Crater, the lake-level drop in early May was accompanied by a change from inflation of the summit area to deflation centered near the crater. In addition, on 13 May, the focus of deformation changed to the S part of Kīlauea's summit caldera and upper Southwest Rift Zone (SWRZ), where rapid and localized inflationary tilt was recorded. Seismicity shifted from the summit and the upper East Rift Zone (ERZ) to the S part of the summit; seismicity at the upper SWRZ continued. The number of earthquakes increased on 15 May. The data suggest that magma had moved into a shallow area beneath the S part of the caldera and upper SWRZ. During 16-18 May, rates of tilting slowed and seismicity at the summit and SWRZ had decreased, although remaining above background levels. By 19 May seismicity rates at the summit were normal and the tilt had decreased slightly.
Deformation. Deformation of the summit area during the first quarter of 2015 was dominated by the episode of inflation in the S caldera area that started in early February and continued through the end of March. Tilt data at the summit show a similar number of short deflation-inflation (DI) events as in the recent past; a particularly large one occurred during the first week of March. General summit tilt trends were mimicked at Pu'u 'O'o.
During the second quarter, there was a series of events that culminated in an intrusion in the S caldera in mid-May. Strong inflation of the shallow reservoir near Halema`uma`u Crater was observed beginning on 22 April. Inflation was accompanied by elevated seismicity in the caldera and especially in the upper East Rift Zone. Sustained deflation of the reservoir started in the afternoon of 9 May. The rate increased two days later (11 May), as the lake level dropped and earthquakes in the S caldera increased in rate and magnitude. This was followed by rapid inflation in the S caldera which continued until 16 May. Preliminary modelling by HVO scientists suggested that the volume lost from the Halema`uma`u reservoir and lava lake was comparable to that gained in the S caldera. This was followed by slight deflation of the S caldera for about 10 days before it returned to normal short deflation-inflation (DI) events which were recorded by summit tiltmeters in May and June.
SO2 emission rates. During January through June 2015 East Rift SO2 emission rates ranged from 200 to 590 tons/day. A linear increase was observed from the beginning of the year until the summit intrusion activity. This is in contrast to the steady decline that was measured with the onset of the 27 June 2014 Pu'u 'O'o breakout. SO2 emissions at the summit crater did not change significantly during the overflow of the lava lake at Halema`uma`u Crater.
Geological Summary. Kilauea overlaps the E flank of the massive Mauna Loa shield volcano in the island of Hawaii. Eruptions are prominent in Polynesian legends; written documentation since 1820 records frequent summit and flank lava flow eruptions interspersed with periods of long-term lava lake activity at Halemaumau crater in the summit caldera until 1924. The 3 x 5 km caldera was formed in several stages about 1,500 years ago and during the 18th century; eruptions have also originated from the lengthy East and Southwest rift zones, which extend to the ocean in both directions. About 90% of the surface of the basaltic shield volcano is formed of lava flows less than about 1,100 years old; 70% of the surface is younger than 600 years. The long-term eruption from the East rift zone between 1983 and 2018 produced lava flows covering more than 100 km2, destroyed hundreds of houses, and added new coastline.
Information Contacts: Hawaiian Volcano Observatory (HVO), U.S. Geological Survey, PO Box 51, Hawai`i National Park, HI 96718, USA (URL: https://volcanoes.usgs.gov/observatories/hvo/)