Report on Erebus (Antarctica) — June 2017
Bulletin of the Global Volcanism Network, vol. 42, no. 6 (June 2017)
Managing Editor: Edward Venzke.
Edited by A. Elizabeth Crafford.
Erebus (Antarctica) Phonolitic lava lakes remain active during 2011-2016
Please cite this report as:
Global Volcanism Program, 2017. Report on Erebus (Antarctica) (Crafford, A.E., and Venzke, E., eds.). Bulletin of the Global Volcanism Network, 42:6. Smithsonian Institution. https://doi.org/10.5479/si.GVP.BGVN201706-390020
Erebus
Antarctica
77.53°S, 167.17°E; summit elev. 3794 m
All times are local (unless otherwise noted)
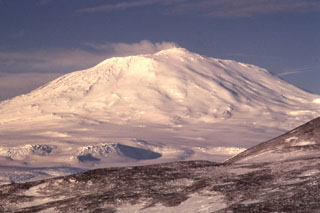
The existence of an anorthoclase phonolite lava lake in the summit crater of Mount Erebus was first reported in 1972, and it has been thought to be continuously active since that time. Antarctica's best known volcano is located on Ross Island, 90 km E of the continent, offshore of the Scott Coast. McMurdo station, run by the United States Antarctic Program, is about 40 km S on the tip of Ross Island (figure 16). During the history of observations, lava lake(s) have generally persisted, although changes in size and shape over time reflect variations in volcanic activity.
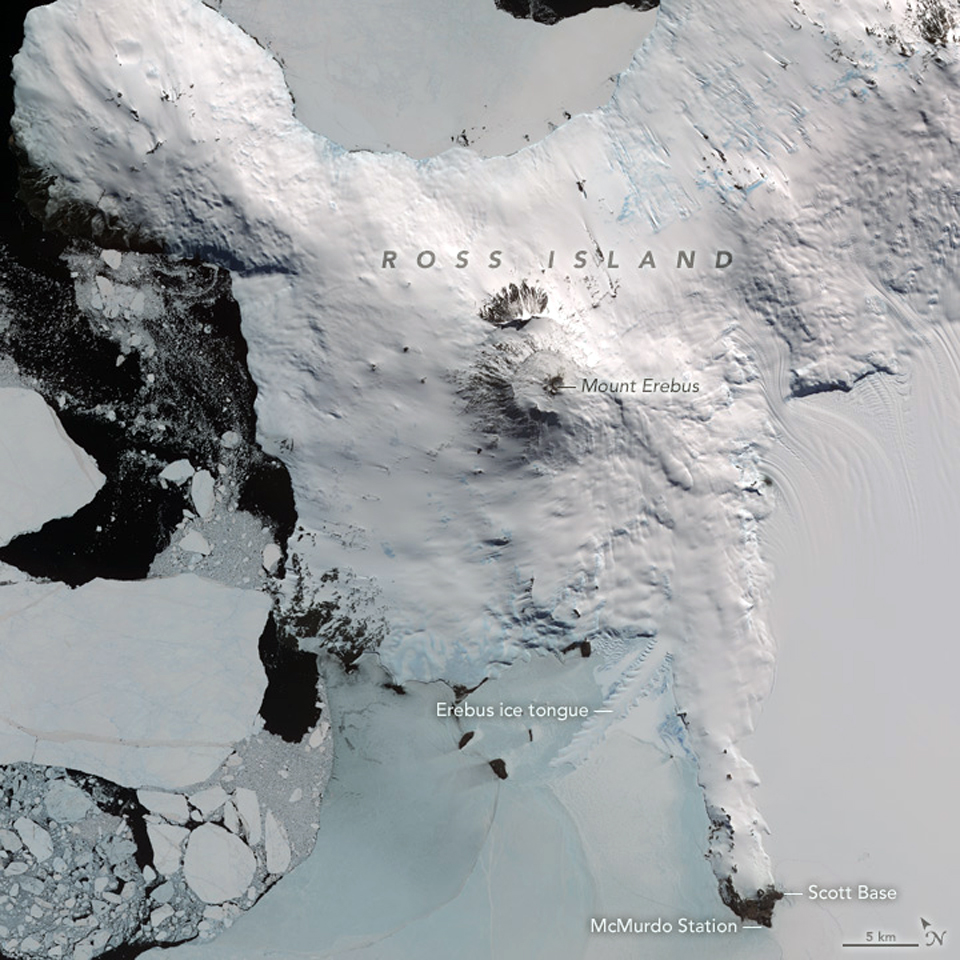 |
Figure 16. On 31 December 2013, the Advanced Spaceborne Thermal Emission and Reflection Radiometer (ASTER) on NASA's Terra satellite acquired visible near-infrared images of the western end of Ross Island in austral mid-summer. McMurdo Station is about 40 km S of the summit of Mount Erebus. Courtesy of NASA Earth Observatory. |
This report briefly summarizes research activity at Mount Erebus, and volcanic activity observed since 1972. Photographs from expeditions between 2010 and 2016 show more recent activity at the volcano. Observations from MODVOLC data collected from 2000 through 2016 are also discussed.
Summary of research activity. For most years since the 1970's, scientists have visited Erebus during the austral summer (November-February) and gathered samples, taken SO2 and other geochemical measurements, collected GPS data, and made observations and overflights to evaluate the condition of the volcano.
Seismometers were initially installed by a joint project of United States, New Zealand, and Japanese scientists in 1980-1981. Between 1980 and 2016 as many as 10 seismic stations were recording activity at Erebus; they were monitored by the Mount Erebus Volcano Observatory (MEVO) run by the New Mexico Institute of Mining and Technology (New Mexico Tech). During the early 2000s MEVO also used infrasonic recordings to capture data on the frequency of eruptions. Researchers from New Mexico Tech, the University of Cambridge, and University College London made yearly expeditions there between 2003 and 2016.
The Mount Erebus Volcano Observatory closed in 2016. A final report was submitted to the National Science Foundation (NSF) on the past research and ideas for future research (Mattioli and LaFemina, 2016), and includes a comprehensive list of scientific publications about Erebus. One area of ongoing volcanology research relates to studying the behavior of the lava lake with a variety of on-site monitoring equipment (figure 17).
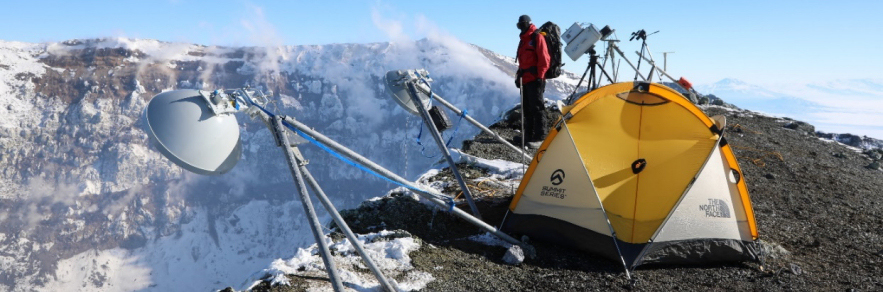 |
Figure 17. Radar altimeter installed at the crater rim of Erebus in December 2016. There are two dishes, to both transmit and receive data. Several other devices are seen in the background, all trained on the lava lake on the floor of the crater. Courtesy of the University of Cambridge Department of Geography. |
Summary of activity, 1972-2009. During the 1970's, the lava lake was observed to be about 130 m long and oval shaped, producing occasional Strombolian explosions. Bombs up to 10 m in in diameter were ejected near the vent, and ones up to 30 cm in diameter were thrown out over the main crater. Oscillations of the lake level of up to 2 m were observed.
During a period of increased activity between September 1984 and January 1985, several large explosions were recorded by the seismic network, and there were reports of mushroom-shaped clouds rising as much as 2 km above the summit. During September 1984, numerous large explosions sent ejecta as high as 600 m above the summit, and incandescence was visible from 70 km away. Ash also covered the NW flank down to 3,400 m elevation. Observations in October 1984 indicated that much of the lava lake had solidified, and that the surface was covered with ejecta from the recent explosions. Seismicity remained above average through January 1985. During this period of increased activity, bombs averaging 2 m in diameter (but some as large as 10 m in diameter) were ejected up to 1.2 km from within the inner crater. The eruptions were witnessed from 60 km away and explosions could be heard up to 2 km from the volcano (SEAN 11:03). A small lava lake about 15 m in diameter reappeared late in 1985.
Two primary lakes of phonolitic lava, and a third transient lake, were present inside the crater during the late 1980s (see figure 9, SEAN 13:02), and infrequent Strombolian eruptions with small bombs were captured by a remote video camera mounted on the crater rim. Small ash eruptions were observed from an active vent near the lava lakes in January 1991. On 19 October 1993, two moderate phreatic eruptions created a new crater ~80 m in diameter on the main crater floor and ejected debris over the northern crater rim. These were the first known phreatic eruptions at Erebus, and probably resulted from steam build-up associated with melting snow in the crater (BGVN 20:11).
Vent and lava lake eruptions were recorded by MEVO during the late 1990s and early 2000s. The largest peaks in terms of numbers of eruptions were during 1995, 1997, 1998, 2000, and a broad peak beginning in late 2005 that continued into late 2006 (BGVN 31:12).
Activity during 2010-2016. The two primary lava lakes remained active at Erebus. The one in the NE sector of the inner crater has been persistent almost continuously since first reported in 1972. The second lake is more in the center of the main crater and is intermittently active. During a visit in 2010, only the NE sector lake was active (BGVN 36:09). During clear weather, a steady steam plume is often observed (figure 18).
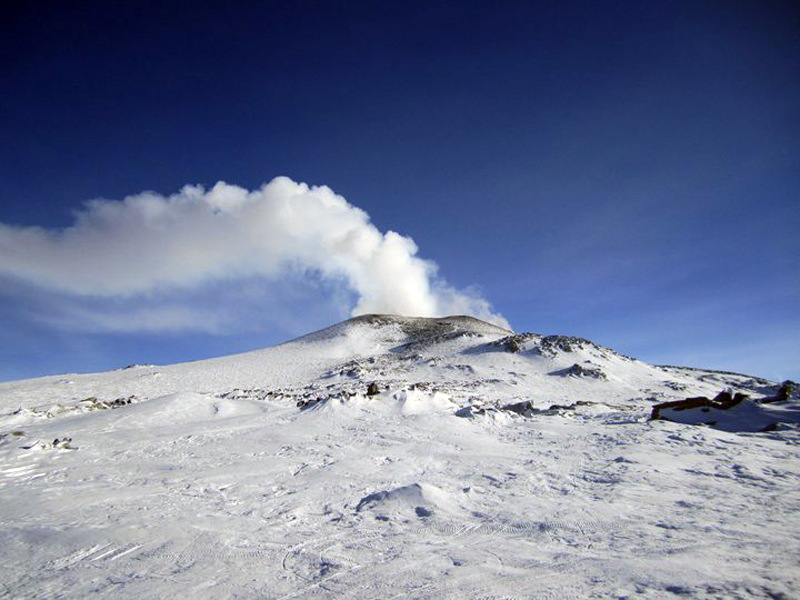 |
Figure 18. Mount Erebus with a steam plume rising from the summit crater, viewed from the Lower Erebus Hut (LEH), 6 December 2010. Courtesy of Mount Erebus Volcano Observatory. |
Visits during 2011-2016 have confirmed the ongoing Strombolian activity and convection at the lava lakes nearly every year. During 2011 the glowing lava lake emitted steam and magmatic gases from the bottom of a vent at the main crater (figure 19). An eruption on 2 January 2012 at the lava lake was captured by the remote video cameras managed by MEVO (figure 20). Several bombs were ejected on 18 December 2013 and landed close to monitoring equipment run by MEVO. Researchers were able to open a hot bomb and see the molten interior (figure 21).
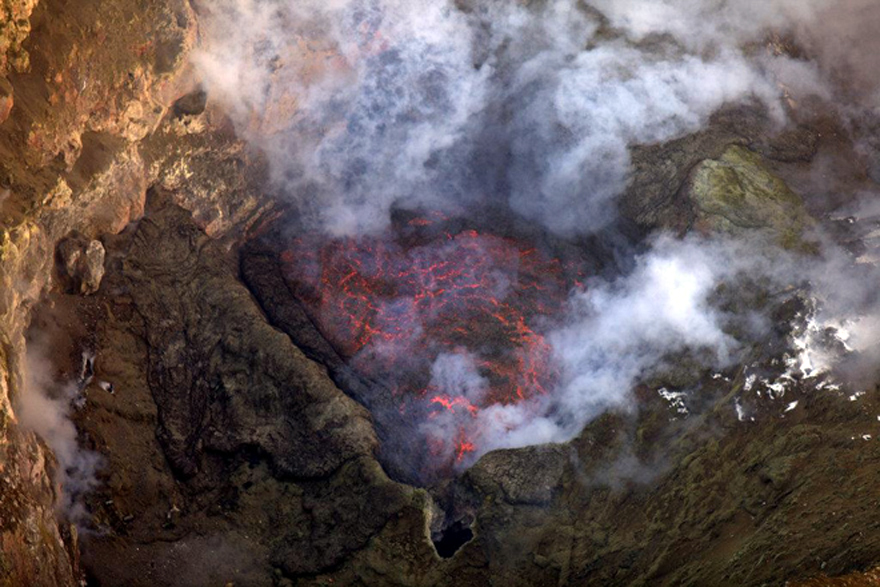 |
Figure 19. The lava lake at Erebus, photographed in December 2011. Image by Clive Oppenheimer/Volcanofiles; courtesy of Erik Klemetti. |
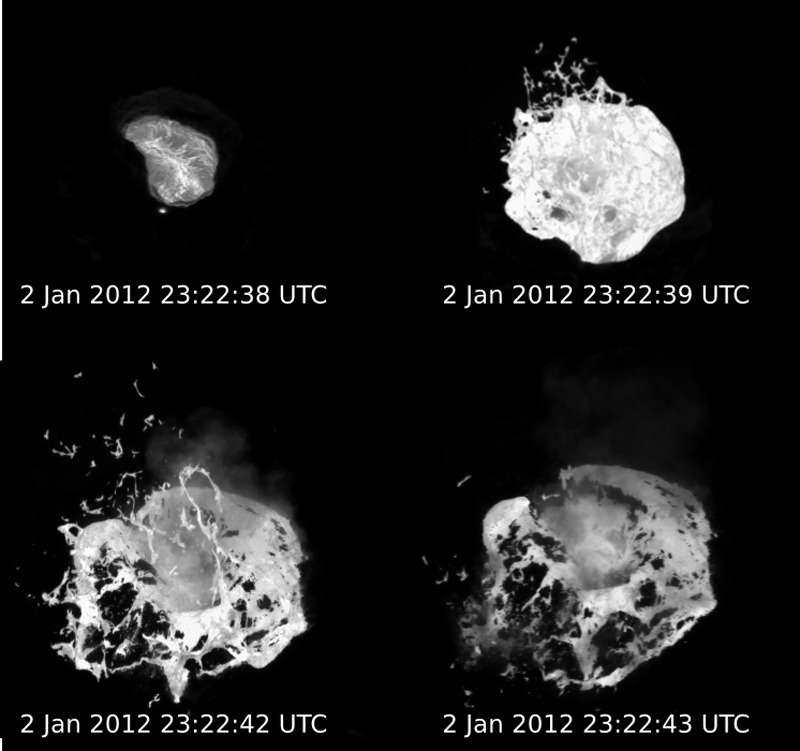 |
Figure 20. An eruption from the lava lake at Erebus, captured on the MEVO video cameras on 2 January 2012. Courtesy of MEVO and Volcano Discovery. |
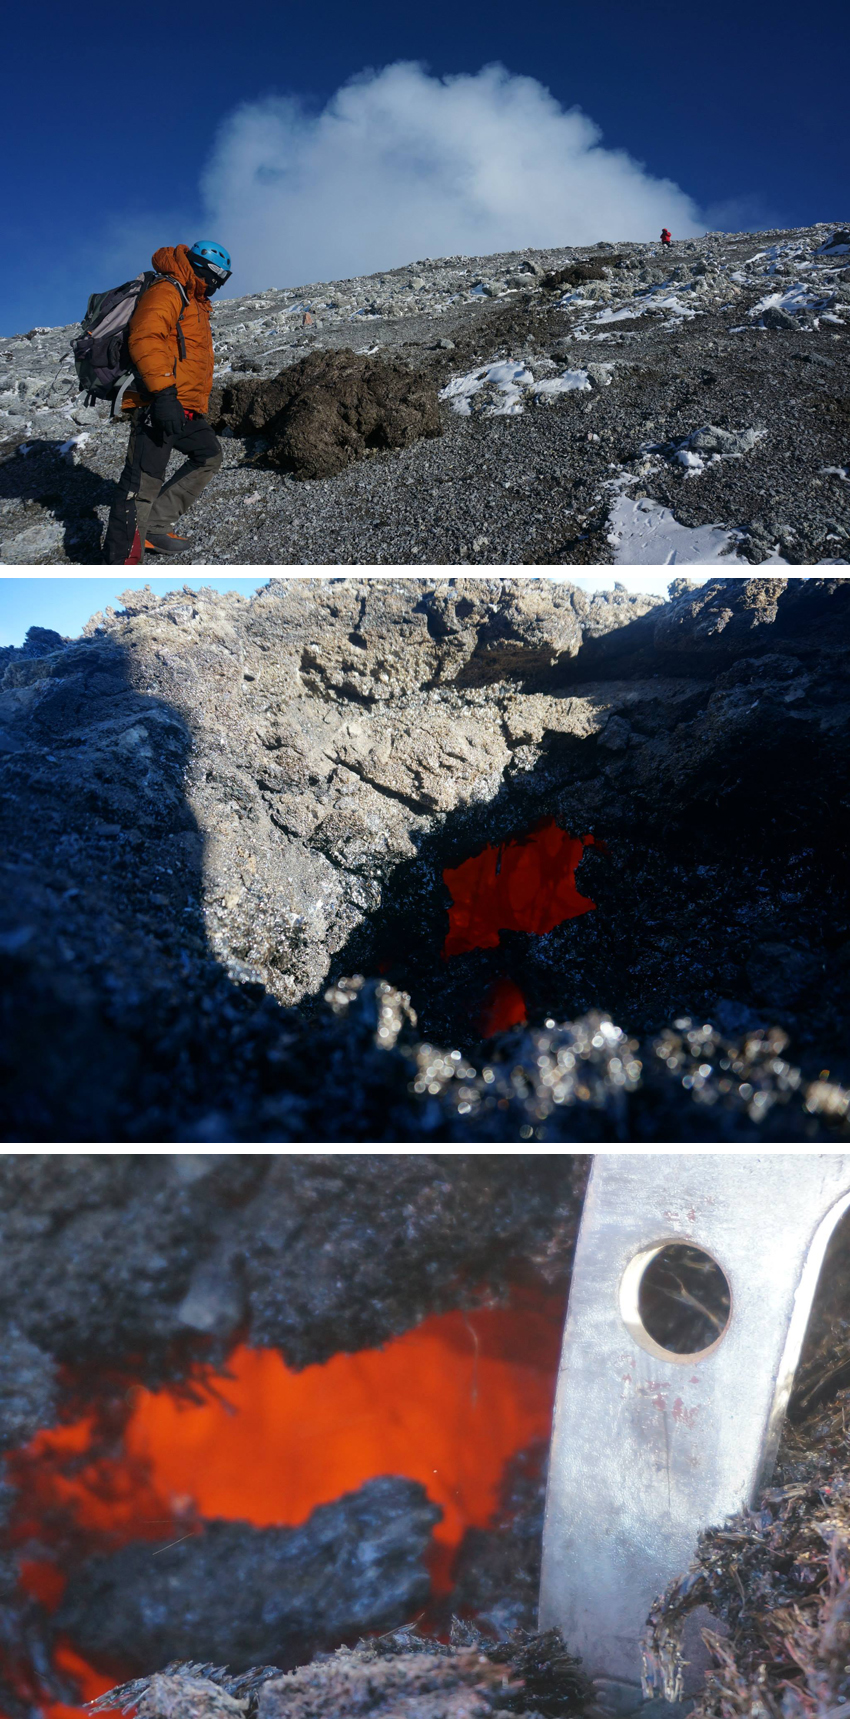 |
Figure 21. Several bombs erupted from Erebus on 18 December 2013 and landed close to monitoring equipment run by MEVO. Researchers were able to open a hot bomb and see the molten interior. Images courtesy of Aaron Curtis, MEVO, 18 December 2013 (posted on Facebook). |
When UNAVCO (a non-profit university-governed consortium) flew over Erebus in December 2015, steam and magmatic gas plumes indicated that both lava lakes were active (figure 22). The two incandescent crater vents at were observed in greater detail during January 2016 by researchers associated with the University of Cambridge (figure 23).
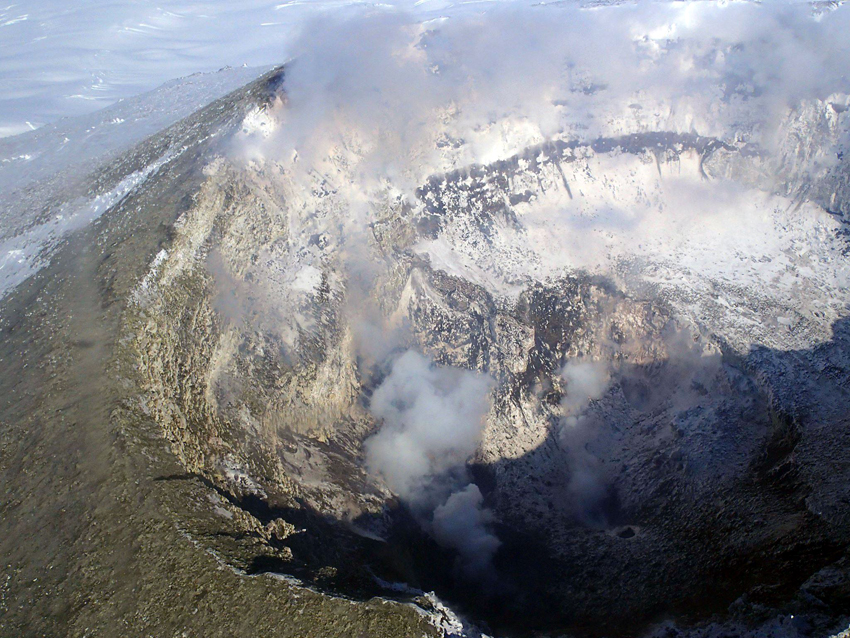 |
Figure 22. The crater of Erebus, with active steam plumes from two lava lakes on 7 December 2015, photographed during an overflight by UNAVCO (a non-profit university-governed consortium). Photo by Annie Zaino, UNAVCO (posted on Facebook). |
 |
Figure 23. Two lava lakes at Erebus were observed on 14 January 2016 by researchers associated with the University of Cambridge. Lower image is a close-up of the right vent in the upper image. Courtesy of Kayla Iacovino and Tehnuka Ilanko (posted on Facebook). |
MODVOLC data, 2000-2016. With the remoteness of Erebus, satellite imagery serves as one of the few year-round tools currently available to assess longer-term activity. The University of Hawaii's MODVOLC thermal alert system has been processing MODIS infrared satellite data since 2000. Mount Erebus has had a strong and nearly continuous MODVOLC signature throughout 2000-2016 (table 3), confirming its ongoing eruptive activity.
Table 3. Number of MODVOLC thermal alert pixels recorded per month from 1 January 2000 to 31 December 2016 by the University of Hawaii's thermal alert system for Erebus. Table compiled by GVP from data provided by MODVOLC. Spurious data from 25 October 2014 was omitted.
| Year | Jan | Feb | Mar | Apr | May | Jun | Jul | Aug | Sep | Oct | Nov | Dec | SUM |
| 2000 | 0 | 6 | 16 | 3 | 10 | 7 | 8 | 12 | 7 | 4 | 1 | 0 | 74 |
| 2001 | 2 | 16 | 90 | 70 | 78 | 24 | 70 | 71 | 57 | 30 | 1 | 5 | 514 |
| 2002 | 1 | 19 | 53 | 71 | 96 | 133 | 148 | 122 | 188 | 62 | 28 | 28 | 949 |
| 2003 | 19 | 41 | 103 | 125 | 168 | 231 | 195 | 213 | 121 | 62 | 30 | 19 | 1327 |
| 2004 | 40 | 48 | 143 | 90 | 131 | 279 | 133 | 288 | 113 | 67 | 39 | 131 | 1502 |
| 2005 | 125 | 98 | 217 | 158 | 159 | 212 | 256 | 191 | 209 | 91 | 30 | 21 | 1767 |
| 2006 | 12 | 27 | 78 | 89 | 131 | 85 | 145 | 30 | 39 | 36 | 11 | 32 | 715 |
| 2007 | 18 | 42 | 142 | 268 | 243 | 178 | 184 | 199 | 118 | 98 | 10 | 33 | 1533 |
| 2008 | 91 | 116 | 199 | 267 | 286 | 180 | 269 | 458 | 149 | 148 | 95 | 141 | 2399 |
| 2009 | 86 | 114 | 386 | 162 | 436 | 270 | 341 | 208 | 253 | 116 | 76 | 66 | 2514 |
| 2010 | 53 | 58 | 207 | 132 | 185 | 154 | 89 | 100 | 142 | 62 | 10 | 2 | 1194 |
| 2011 | 3 | 23 | 81 | 112 | 36 | 1 | 1 | 0 | 4 | 25 | 0 | 0 | 286 |
| 2012 | 0 | 24 | 52 | 56 | 31 | 93 | 27 | 1 | 1 | 0 | 0 | 0 | 285 |
| 2013 | 0 | 1 | 11 | 11 | 11 | 20 | 56 | 85 | 28 | 19 | 0 | 1 | 243 |
| 2014 | 2 | 1 | 0 | 9 | 49 | 62 | 78 | 10 | 28 | 3 | 0 | 1 | 243 |
| 2015 | 1 | 17 | 14 | 4 | 15 | 2 | 7 | 12 | 2 | 3 | 0 | 0 | 77 |
| 2016 | 0 | 4 | 13 | 34 | 46 | 33 | 19 | 1 | 3 | 0 | 0 | 0 | 153 |
| SUM | 453 | 655 | 1805 | 1661 | 2111 | 1964 | 2026 | 2001 | 1462 | 826 | 331 | 480 |
The MODVOLC thermal alert data show that thermal activity at Erebus has waxed and waned several times during the 2000-2016 interval (figure 24). Activity was very low during 2000, but increased steadily through mid-2005 to more than 20 times as many annual thermal alert pixels since 2000. Activity dropped off substantially from late 2005 and remained low through early 2007, when another increase began that peaked at an even higher level (2514 pixels during 2009) in mid-2009. Another drop in activity occurred during 2010, and since 2011 there have been fewer than 300 pixels per year, with numbers below 200 for 2015 and 2016.
 |
Figure 24. The number of MODVOLC thermal alert pixels per year, colored by month, reported for Erebus from 2000 through 2016. Activity was very low during 2000, but increased steadily through mid-2005. Activity dropped off substantially from late 2005 through early 2007, when another increase began that peaked at an even higher level in mid-2009. Another drop in activity occurred during 2010, and since 2011, there have been fewer than 300 pixels per year. Data courtesy of MODVOLC. |
Another trend in the MODVOLC data is also apparent when the number of pixels are plotted by month, as opposed to year, for this time period (figure 25). From November through February, during the austral summer, the number of pixels per month never exceeds 150 (see table 3, highest value is 125). From March through October, during the Austral winter, the number of pixels recorded per month can be much higher (the highest value is 458). The average number of 'summer' pixels per month (November-February, 2000-2016) is 30. The average number of 'winter' pixels per month for the same period (March-October) is 108, more than three times greater.
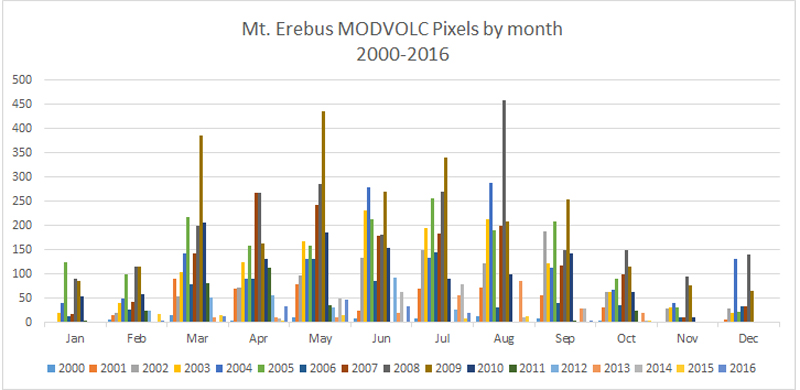 |
Figure 25. The number of MODVOLC thermal alert pixels per month for the period 2000-2016, colored by year. The total average number of pixels per month from 1 March through 31 October (1732) is three times the average total number of pixels per month from 1 November through 28 February (480). Data courtesy of MODVOLC. |
References: Mattioli, G.S., and LaFemina, P.C., 2016, Final Report submitted to the National Science Foundation, Community Workshop: "Scientific Drivers and Future of Mount Erebus Volcano Observatory (MEVO)" (URL: https://www.unavco.org/community/meetings-events/2016/mevo/2016-MEVO-Final-Report.pdf)
Geological Summary. Mount Erebus, the world's southernmost historically active volcano, overlooks the McMurdo research station on Ross Island. It is the largest of three major volcanoes forming the crudely triangular Ross Island. The summit of the dominantly phonolitic volcano has been modified by one or two generations of caldera formation. A summit plateau at about 3,200 m elevation marks the rim of the youngest caldera, which formed during the late-Pleistocene and within which the modern cone was constructed. An elliptical 500 x 600 m wide, 110-m-deep crater truncates the summit and contains an active lava lake within a 250-m-wide, 100-m-deep inner crater; other lava lakes are sometimes present. The glacier-covered volcano was erupting when first sighted by Captain James Ross in 1841. Continuous lava-lake activity with minor explosions, punctuated by occasional larger Strombolian explosions that eject bombs onto the crater rim, has been documented since 1972, but has probably been occurring for much of the volcano's recent history.
Information Contacts: Mt. Erebus Volcano Observatory (MEVO), New Mexico Institute of Mining and Technology, Socorro, NM 87801, USA; Hawai'i Institute of Geophysics and Planetology (HIGP), MODVOLC Thermal Alerts System, School of Ocean and Earth Science and Technology (SOEST), Univ. of Hawai'i, 2525 Correa Road, Honolulu, HI 96822, USA (URL: http://modis.higp.hawaii.edu/); The University of Cambridge Department of Geography (URL: http://www.geog.cam.ac.uk/research/projects/lavalakes/); Erik Klemetti, Eruptions Blog, Wired (URL: https://www.wired.com/author/erikvolc/); Tom Pfeiffer, Volcano Discovery (URL: http://www.volcanodiscovery.com/); UNAVCO, 6350 Nautilus Drive, Boulder, CO 80301-5394 (URL: http://www.unavco.org/); Kayla Iacovino and Tehnuka Ilanko, The Volcanofiles (URL: http://www.volcanofiles.com/).