Report on Cleveland (United States) — December 2017
Bulletin of the Global Volcanism Network, vol. 42, no. 12 (December 2017)
Managing Editor: Edward Venzke.
Edited by A. Elizabeth Crafford.
Cleveland (United States) Dome growth and destruction multiple times during January-November 2017
Please cite this report as:
Global Volcanism Program, 2017. Report on Cleveland (United States) (Crafford, A.E., and Venzke, E., eds.). Bulletin of the Global Volcanism Network, 42:12. Smithsonian Institution. https://doi.org/10.5479/si.GVP.BGVN201712-311240
Cleveland
United States
52.825°N, 169.944°W; summit elev. 1730 m
All times are local (unless otherwise noted)
Dome growth and destruction accompanied by small ash explosions has been typical behavior at Alaska's Cleveland volcano in recent years (figures 20, 21, and 22). Located on Chuginadak Island in the Aleutians, slightly over 1,500 km SW of Anchorage, it has historical activity, including three large (VEI 3) eruptions, recorded back to 1893. The Alaska Volcano Observatory (AVO) and the Anchorage Volcanic Ash Advisory Center (VAAC) are responsible for monitoring activity and notifying air traffic of aviation hazards associated with Cleveland. This report provides a summary table of dome growth and destruction since 2013 (table 8), and details of continued activity from January through November 2017.
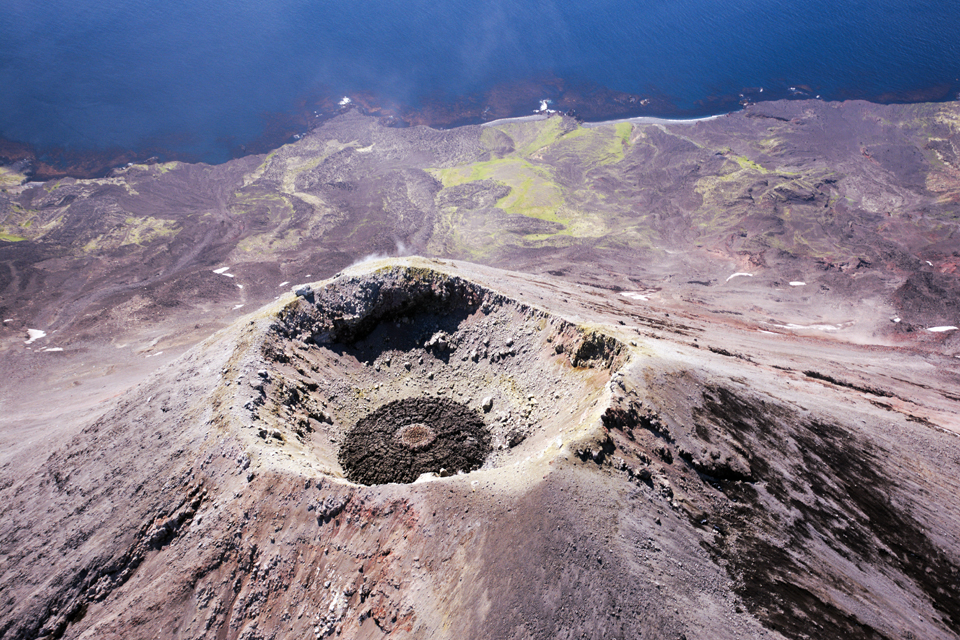 |
Figure 20. A lava dome was growing at the summit of Cleveland on 4 August 2015. Concentric rings and radial fractures in the dome surface surrounded an elevated hot dome. Photo taken during the 2015 field season of the Islands of Four Mountains multidisciplinary project, work funded by the National Science Foundation, the USGS/AVO, and the Keck Geology Consortium. Courtesy of AVO. |
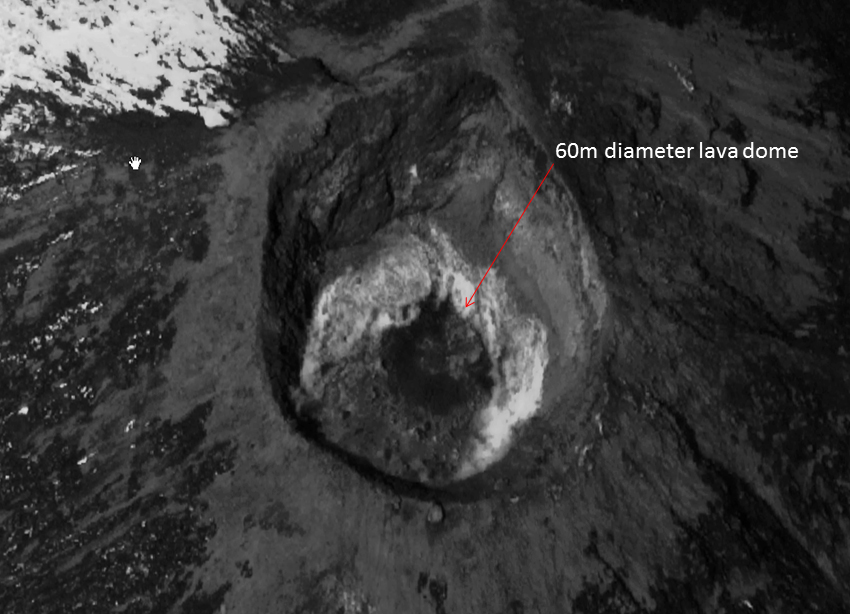 |
Figure 21. A 60-m-diameter lava dome was seen in this WorldView-1 satellite image from 25 May 2016 of Cleveland's summit crater. Image created by Rick Wessels, USGS. Image data copyright 2016 Digital Globe, NextView License. Courtesy of AVO. |
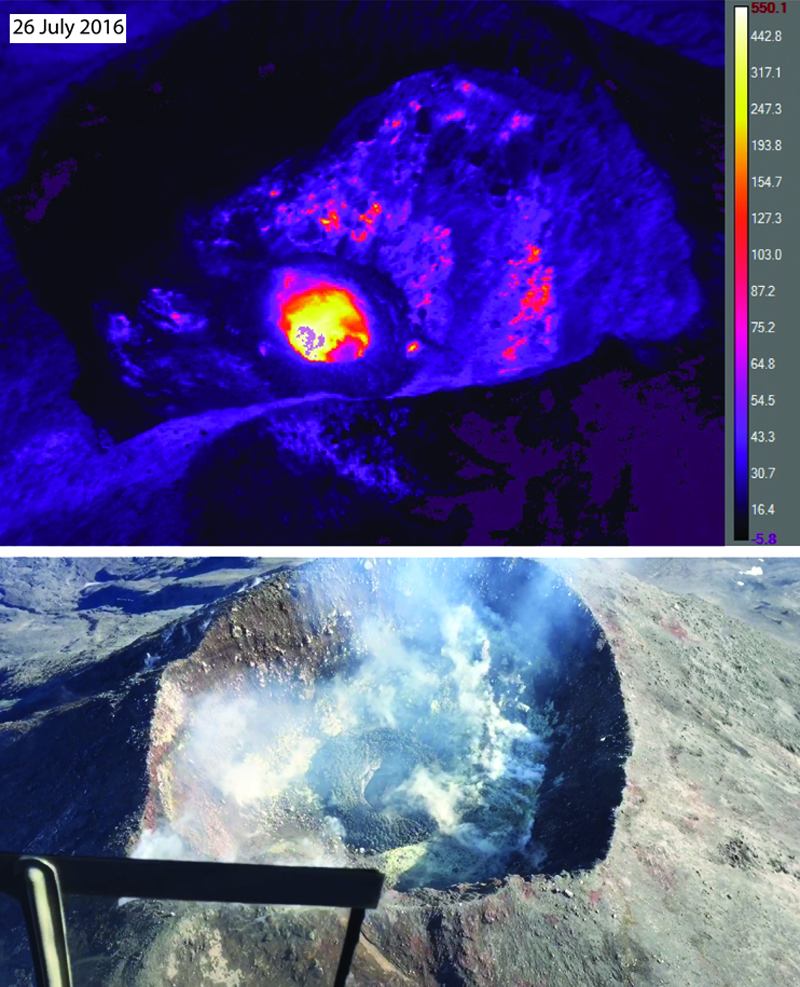 |
Figure 22. Thermal and photographic images of the lava dome that was growing in the summit crater of Cleveland on 26 July 2016. Top image is from a FLIR (Forward Looking InfraRed) camera, where warmer colors indicate hotter temperatures (scale is in Celsius); bottom image is a photograph of the summit crater, lava dome, and active fumaroles. AVO crew observed incandescence from the summit crater vent during this overflight. Courtesy of AVO. |
Table 8. Observations of dome growth and other crater activity at Cleveland, 2013-2017. Data extracted from AVO reports.
| Date | Dome Observations |
| Jan-Feb 2013 | New lava flow observed multiple times, 100 m across |
| 4-6 May 2013 | Explosions, ash cloud |
| Jun-Jul 2013 | Elevated temperatures, satellite imagery |
| 2-5 Oct 2013 | Explosions |
| 13 Nov 2013 | Elevated surface temperatures near summit |
| 25 Nov 2013 | Explosion |
| 28 Dec 2013 | Strongly elevated surface temperature near summit |
| 30 Dec 2013, 2 Jan 2014 | Small ash cloud visible; explosion with ash plume |
| Jan-25 Feb 2014 | Elevated surface temperatures near summit multiple times |
| 25 Feb 2014 | Two small explosions and ash clouds |
| 7 Mar-4 Jun 2014 | No detected activity |
| 5 Jun 2014 | Explosion |
| 7 Jul 2014-Aug 2014 | Intermittent weakly elevated surface temperatures at summit, vigorous steam plume, incandescence at summit during field visit |
| Late Aug-early Sep 2014 | Elevated surface temperatures in satellite data |
| 14, 24 Nov 2014 | Vigorous steaming observed in webcam; Satellite image shows small lava dome in summit crater |
| 5 Dec 2014-9 Jan 2015 | Minor steaming and weakly elevated surface temperatures at summit |
| 25, 28 Feb 2015 | Weakly elevated surface temperatures at summit, low level steam plume observed |
| 26 Mar 2015 | Small steam plume, no further activity until 14 June |
| 14 Jun 2015 | Ash cover on upper flanks |
| 17 Jun-21 Jul 2015 | Elevated surface temperatures at summit |
| 21 Jul 2015 | Explosion |
| 31 Jul, 4 Aug 2015 | Strongly elevated surface temperatures at summit, photograph (figure 20) of lava dome in summit crater |
| 6 Aug 2015 | Small explosion |
| Aug-Oct 2015 | Intermittent elevated surface temperatures at summit |
| 29 Aug 2015 | Seismic swarm |
| Sep-Nov 2015 | No Reported Activity |
| Dec 2015 | Elevated surface temperatures at summit |
| 22-23 Dec 2015 | Increased frequency of small VT events |
| Jan 2016 | Elevated surface temperatures at summit |
| 28 Feb 2016 | Brief burst of small local earthquakes |
| Mar-1 April 2016 | Elevated surface temperatures at summit |
| 16 April 2016 | Explosion |
| 6 and 10 May 2016 | Explosions |
| 17-25 May 2016 | Small lava dome observed (figure 21) |
| Jun-Jul 2016 | Elevated surface temperatures at summit |
| 26 Jul 2016 | Lava dome observed (figure 22) |
| Aug-21 Oct 2016 | Intermittent degassing, steam plumes, and elevated surface temperatures at summit |
| 24, 28 Oct 2016 | Explosion, ashfall observed |
| 5 Nov 2016-23 Mar 2017 | Elevated surface temperatures and intermittent steam emissions at summit. 3 Feb 2017 Satellite observation of lava dome |
| 24 Mar 2017 | Small explosion |
| Late Mar -15 May 2017 | Elevated surface temperatures at summit crater; Dome observed 15 April |
| 16 May 2017 | Explosion |
| 6-29 Jun 2017 | Small, low-frequency earthquakes on 6 Jun, elevated surface temperatures at summit crater several times during June |
| 4 Jul 2017 | Explosion |
| 7 Jul-21 Aug 2017 | Elevated surface temperatures at summit crater; satellite (July 14-21) and photographic (July 25-26) observations of lava dome at summit (figure 23) |
| 22 Aug 2017 | Explosion |
| Late Aug-24 Sep 2017 | Sporadic observations of elevated surface temperatures at summit crater |
| 26, 28 Sep 2017 | Explosions |
| 28 Sep-Oct 2017 | Elevated surface temperature at crater; lava effusion observed throughout October |
| 28, 30 Oct 2017 | Explosions |
| Early Nov 2017 | Elevated surface temperatures at crater |
| 14, 16 Nov 2017 | Explosions |
Lava dome extrusion may have been ongoing since early December 2016, when weakly elevated surface temperatures reappeared after the 24 October 2016 explosion. The lava dome was first observed in satellite imagery on 3 February 2017. Elevated surface temperatures were recorded throughout February and March 2017, and there was a small explosion on 24 March. Growth of a new dome was first observed on 15 April; it continued until being destroyed by an explosion on 16 May. Seismic data on 6 June and elevated temperatures on 7 June indicated growth of another dome, which continued until an explosion on 4 July 2017. There were multiple satellite and photographic observations of the growing dome during July and August; it was destroyed in an explosion on 22 August. Elevated surface temperatures were sporadically observed in early September. The next explosion took place on 26 September followed by two weaker ones on 28 September. Lava effusion was observed in satellite imagery throughout October. Small explosions on 28 and 30 October partly destroyed the lava dome. Elevated surface temperatures were recorded in early November along with small explosions on 14 and 16 November.
Activity during January-April 2017. While no activity was detected in infrasound or seismic data during January 2017, weakly elevated surface temperatures continued to be observed in infrequent clear satellite views (8 and 9 January), just as they were during 8-10 December and in infrared thermal data at the end of December (BGVN 42:04, figure 19). Low-level steam plumes were seen in clear views of the summit from the webcam during 15-19 and 21 January. Moderately elevated surface temperatures were observed in satellite data on 31 January 2017.
Satellite observations on 3 February 2017 confirmed the presence of a new lava dome at the bottom of the summit crater. The dome was about 70 m in diameter at that time, similar in size to previous domes. Observations in satellite imagery of weakly elevated surface temperatures at the summit continued during 7-9 February and during the last few days of the month. Minor steaming was seen in clear webcam images on 8 February. AVO noted that these observations were consistent with the presence of an active lava dome.
Minor steaming from the summit visible in clear webcam views, and slightly elevated surface temperatures in nighttime infrared satellite images, were present on several days during the first half of March. By the third week, surface temperatures were weakly to moderately elevated. At 0815 AKST (1615 UTC) on 24 March, a small explosion was detected in both seismic and infrasound (pressure sensor) data. This event was short-lived and similar to, if not smaller than, recent explosions. Cloud cover obscured observations by satellite. Slightly elevated surface temperatures were observed at the summit again during the last week of March.
No significant activity was detected in seismic, infrasound, or satellite data during the first two weeks of April 2017. A satellite image on 15 April, however, showed the presence of a small (less than 10-m-diameter) mound deep in the crater; the previous 75-m-diameter lava dome had been destroyed by the 24 March explosion. Satellite observations over the next several days indicated continued dome growth. Slightly elevated surface temperatures again appeared in a satellite view on 18 April. A satellite image on 23 April showed the dome partially filling the crater.
Activity during May-August 2017. Satellite images on 2 May showed that the lava dome was still active and had grown from about 15 m to more than 20 m in diameter. No further surface changes were evident on 8 May, indicating a pause or termination to the lava effusion. A short explosive eruption on 16 May at 1917 AKDT (17 May at 0317 UTC) was detected by local seismic instruments and lasted about 11 minutes. The resulting ash cloud rose to around 3.7-4.6 km altitude and was seen in satellite images to drift SW for about 5 hours. Satellite observations in the following days showed that the lava dome, built after the 24 March explosion, had been completely destroyed. Occasional clear webcam views showed steam emissions in the week following the 16 May explosion. Satellite imagery from 25 May suggested possible elevated surface temperatures at the summit while images from 26 May showed no change in the crater morphology since 16 May. No significant activity was detected in seismic or infrasound data for the remainder of May.
Evidence of possible lava effusion within the summit crater next appeared during the first week of June 2017. Small low-frequency earthquakes were detected on 6 June and elevated surface temperatures were observed in night-time satellite images on 7 June. Weakly elevated surface temperatures were observed in satellite images on 13, 19-23, and 29 June, and occasional clear webcam views of the summit showed light steaming. No activity was observed in seismic or infrasound data during the remainder of June.
A moderate explosive eruption lasting about ten minutes occurred early on the morning of 4 July at 0319 AKDT (1119 UTC). Elevated surface temperatures at the summit were visible after that on 7 and 14 July in satellite images, and occasional clear webcam views of the summit showed minor steaming. Satellite observations during 14-21 July revealed that a new dome, about 30 m in diameter and 10 m in height, had appeared at the bottom of the summit crater. Elevated surface temperatures were again observed on 22-24 July. New satellite observations between 21 and 28 July showed that the lava dome had reached about 42 m in diameter, with a slight inflation of its approximate height of 10 m. Minor steaming from the crater was seen in the webcam on 25 and 29-30 July; elevated surface temperatures were identified in satellite data on 30 July and 1 August. No activity was observed in seismic or infrasound data after the 4 July explosion for the remainder of the month.
Slow growth of the lava dome in the summit crater continued during the first few days of August 2017. Satellite observations showed that the dome surface area increased by about 75%, and covered an area of approximately 2,100 m2 (45 x 50 m) by 4 August. The height of the dome also increased due to intrusion of new lava. Elevated surface temperatures were observed in satellite data along with steam emissions from the summit crater seen in webcam images during periods of clear weather for the first few days of August, and again during 7-8 August. The small lava dome was observed during an overflight on 17 August (figure 23).
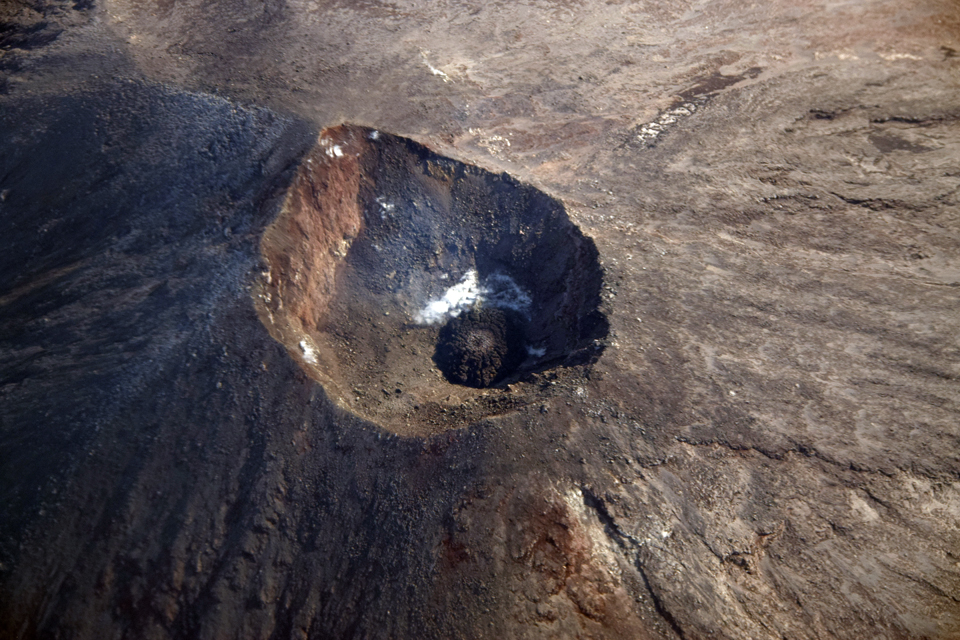 |
Figure 23. A small lava dome grew inside the summit crater of Cleveland on 17 August 2017. Photo by Janet Schaefer, courtesy of AVO/ADGGS (Alaska Volcano Observatory/Alaska Division of Geological & Geophysical Surveys). |
Minor degassing from the summit was seen in satellite and webcam images during 20-21 August. No explosive (ash-producing) activity was detected in seismic, infrasound, or webcam data in August until a 1-minute-long explosion on 22 August 2017 at 1043 AKDT (1843 UTC). Satellite data from 24 August indicated that the explosion destroyed the lava flow on the crater floor that had effused during July-August 2017. Explosion debris was evident on the crater floor, but no other changes to the summit area or flanks were noted. The 22 August explosion was detected by seismic and infrasound (air pressure) sensors, but no ash clouds were seen in satellite data. Nothing unusual was detected in seismic, infrasound, or satellite data for the remainder of August, except that elevated surface temperatures were observed sporadically in satellite data, suggesting that lava was present within the crater. A weak vapor plume was also sometimes visible at the summit in webcam images.
Activity during September-November 2017. Weakly elevated surface temperatures were observed in satellite data on 5 and 14 September 2017, along with minor steaming reported on 11, 17-19, and 22-24 September. These observations suggested to AVO the continued presence of lava in the crater. A small, short (three-minute-long) explosion was detected on local seismic and infrasound sensors at 1747 AKDT on 25 September (0147 on 26 September UTC) that produced a small volcanic cloud visible in satellite data about 30 minutes later with a height estimated at below 4.6 km altitude. Two weaker explosions were subsequently detected in infrasound and seismic data on 28 September (0516 and 0558 AKDT, 1319 and 1358 UTC), although no visible ash clouds were associated with these events. Weakly elevated surface temperatures during 28-30 September suggested that lava was present in the summit crater; a weak plume emanating from the crater could be seen when the summit was cloud-free.
Lava effusion in the crater was again noted in satellite data beginning on 30 September, forming a low dome that covered an area of about 4,200 m2 by 1 October 2017. Low-resolution satellite data from 6 October showed highly elevated surface temperatures, suggesting that slow growth of the dome continued. The dome doubled in size between 1 and 11 October when it appeared to cover an area of about 8,300 m2 and had approximate dimensions of 95 x 115 m. The number and intensity of elevated surface temperatures seen in satellite imagery declined during 7-13 October.
Satellite data from 15 October showed that the lava dome covered an area of about 9,500 m2 with dimensions of 100 x 125 m. There was no significant change in the size of the lava dome between 15 and 19 October based on satellite image analysis. On 16 October, satellite imagery revealed moderately elevated surface temperatures, and the webcam provided views of a small steam plume. Satellite data showed that the lava dome had grown further to about 110 x 140 m by 23 October and that surface temperatures were moderately elevated on 22 and 24 October. Small steam plumes were seen in webcam views during 22- 24 October. Small explosions on 28 and 30 October partly destroyed the dome within the summit crater. This was followed by slightly to moderately elevated surface temperatures occasionally observed in satellite imagery through the end of the month.
Moderately elevated surface temperatures were consistently observed in satellite imagery throughout the first half of November, suggesting new lava at or near the surface. Seismic and infrasound sensors detected a signal associated with low-level emissions shortly after midnight on 12 November. Two small explosions were also detected by the sensors on 14 and 16 November. These events were less energetic than those seen previously, and no volcanic cloud was observed following either explosion. A number of small earthquakes were detected on 14 November. Satellite observations of the summit indicated that a dome remained in the crater, and that the explosions were sourced from a vent in the middle of the dome. The satellite data showed no significant changes for the second half of November; although the volcano was obscured by cloud cover much of the time.
The infrared MIROVA thermal data for 2017 provided evidence that generally coincided with the satellite thermal observations of persistent heat production from dome growth throughout the year (figure 24).
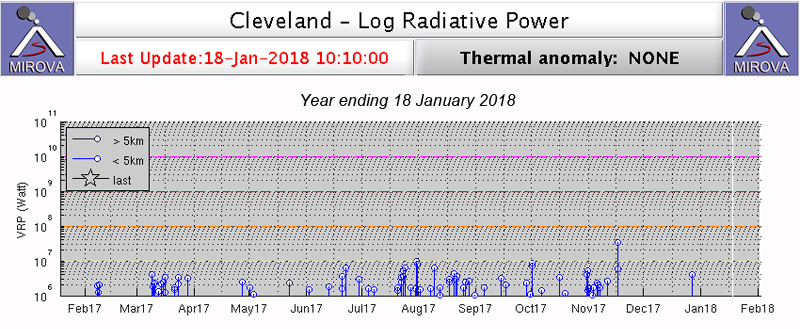 |
Figure 24. Infrared MODIS satellite data plotted with the MIROVA system shows intermittent thermal pulses from Cleveland for the year ending on 18 January 2018. Many of the spikes in thermal energy correspond to periods of satellite and photographic observation of dome growth. Courtesy of MIROVA. |
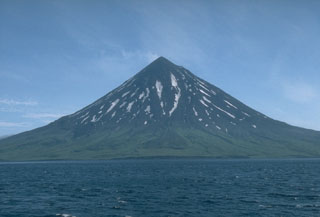
Geological Summary. The beautifully symmetrical Mount Cleveland stratovolcano is situated at the western end of the uninhabited Chuginadak Island. It lies SE across Carlisle Pass strait from Carlisle volcano and NE across Chuginadak Pass strait from Herbert volcano. Joined to the rest of Chuginadak Island by a low isthmus, Cleveland is the highest of the Islands of the Four Mountains group and is one of the most active of the Aleutian Islands. The native name, Chuginadak, refers to the Aleut goddess of fire, who was thought to reside on the volcano. Numerous large lava flows descend the steep-sided flanks. It is possible that some 18th-to-19th century eruptions attributed to Carlisle should be ascribed to Cleveland (Miller et al., 1998). In 1944 it produced the only known fatality from an Aleutian eruption. Recent eruptions have been characterized by short-lived explosive ash emissions, at times accompanied by lava fountaining and lava flows down the flanks.
Information Contacts: Alaska Volcano Observatory (AVO), a cooperative program of a) U.S. Geological Survey, 4200 University Drive, Anchorage, AK 99508-4667 USA (URL: https://avo.alaska.edu/), b) Geophysical Institute, University of Alaska, PO Box 757320, Fairbanks, AK 99775-7320, USA, and c) Alaska Division of Geological & Geophysical Surveys, 794 University Ave., Suite 200, Fairbanks, AK 99709, USA (URL: http://www.dggs.alaska.gov/); Anchorage Volcanic Ash Advisory Center (VAAC), Alaska Aviation Weather Unit, NWS NOAA US Dept of Commerce, 6930 Sand Lake Road, Anchorage, AK 99502-1845 USA (URL: http://vaac.arh.noaa.gov/); MIROVA (Middle InfraRed Observation of Volcanic Activity), a collaborative project between the Universities of Turin and Florence (Italy) supported by the Centre for Volcanic Risk of the Italian Civil Protection Department (URL: http://www.mirovaweb.it/).