Report on Sabancaya (Peru) — December 2017
Bulletin of the Global Volcanism Network, vol. 42, no. 12 (December 2017)
Managing Editor: Edward Venzke.
Edited by A. Elizabeth Crafford.
Sabancaya (Peru) Continuous pulses of ash emissions for ten months, February-November 2017
Please cite this report as:
Global Volcanism Program, 2017. Report on Sabancaya (Peru) (Crafford, A.E., and Venzke, E., eds.). Bulletin of the Global Volcanism Network, 42:12. Smithsonian Institution. https://doi.org/10.5479/si.GVP.BGVN201712-354006
Sabancaya
Peru
15.787°S, 71.857°W; summit elev. 5960 m
All times are local (unless otherwise noted)
Activity that began in 1986 at Sabancaya was the first recorded in over 200 years. During the last period of substantial ash eruptions between 1990 and 1998 ashfall deposits up to 4 cm thick were reported 8 km E of the volcano. Intermittent seismic unrest and fumarolic emissions characterized activity from late 2012 through October 2016, with a few possible minor ash emissions unconfirmed during this period, and probable SO2 plumes.
Hybrid seismic events, related to the movement of magma, and SO2 emissions increased noticeably during September and October 2016. An explosive eruption period with numerous ash plumes began on 6 November 2016 and has continued throughout 2017. Continuous ash emissions with plume heights exceeding 10 km altitude were often recorded through February 2017. Thermal anomalies were first measured in satellite data in early November 2016, along with numerous significant SO2 plumes (BGVN 42:05). Details of the continuing eruptive activity at Sabancaya from February-November 2017 are discussed in this report with information from the two Peruvian observatories that monitor the volcano: Instituto Geofisico del Peru - Observatoria Vulcanologico del Sur (IGP-OVS), and Observatorio Volcanologico del INGEMMET (Instituto Geológical Minero y Metalúrgico) (OVI-INGEMMET). Aviation reports and notices come from the Buenos Aires Volcanic Ash Advisory Center (VAAC), and satellite data is reported from several sources.
Images from December 2016. An expedition to Sabancaya during 9-18 December 2016 by photographer Martin Rietze recorded numerous ash emissions and the impacts of the ongoing eruption on the region (figures 31-36). Similar activity continued throughout 2017.
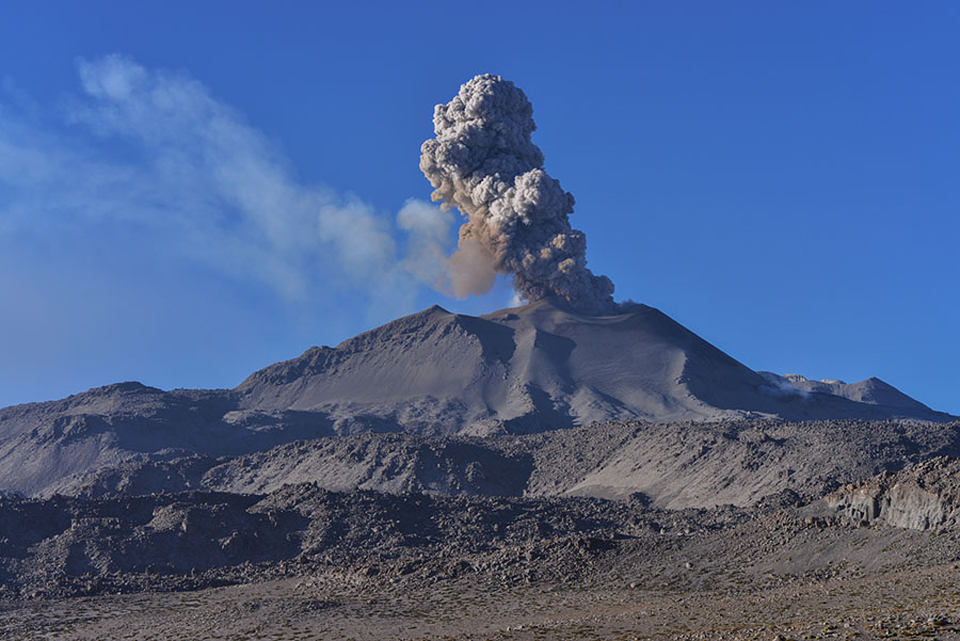 |
Figure 31. Gas and a dense ash plume rose above Sabancaya during 12-15 December 2016 in this view taken 6.5 km NNE of the volcano. Photo copyright by Martin Rietze, used with permission. |
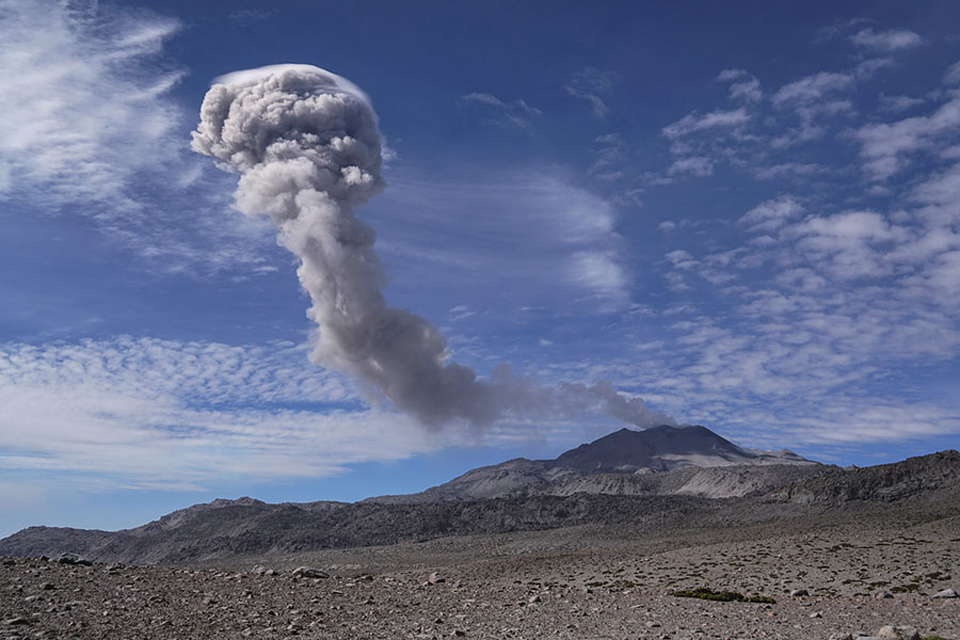 |
Figure 32. A column of ash drifted E from Sabancaya during 12-15 December 2016 while a cloud cap condensed on top of the plume. Image taken from 6.5 km NNE of the summit. Photo copyright by Martin Rietze, used with permission. |
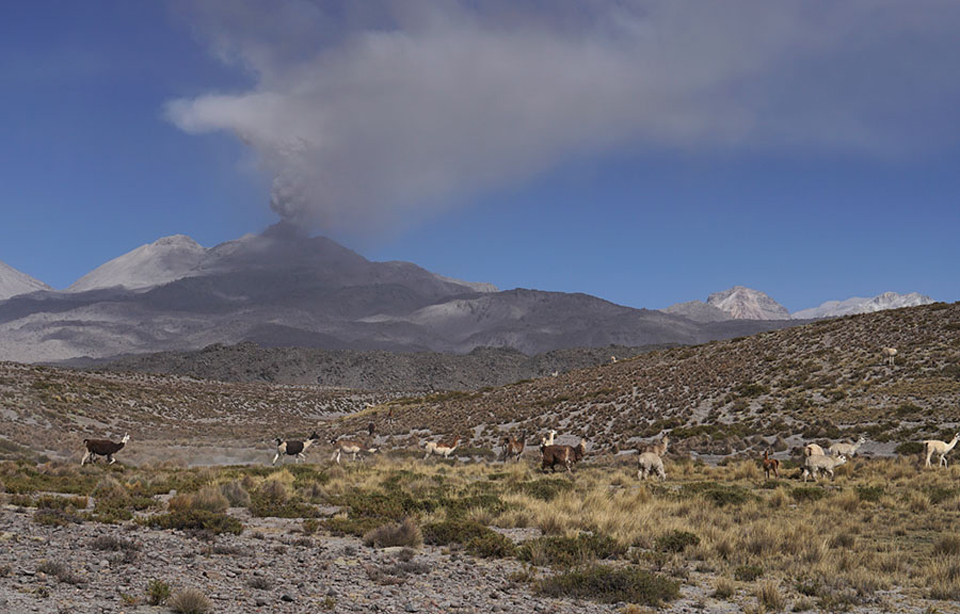 |
Figure 33. An ash plume fanned out to the E from Sabancaya during 12-15 December 2016. Image taken from 15 km E. Photo copyright by Martin Rietze, used with permission. |
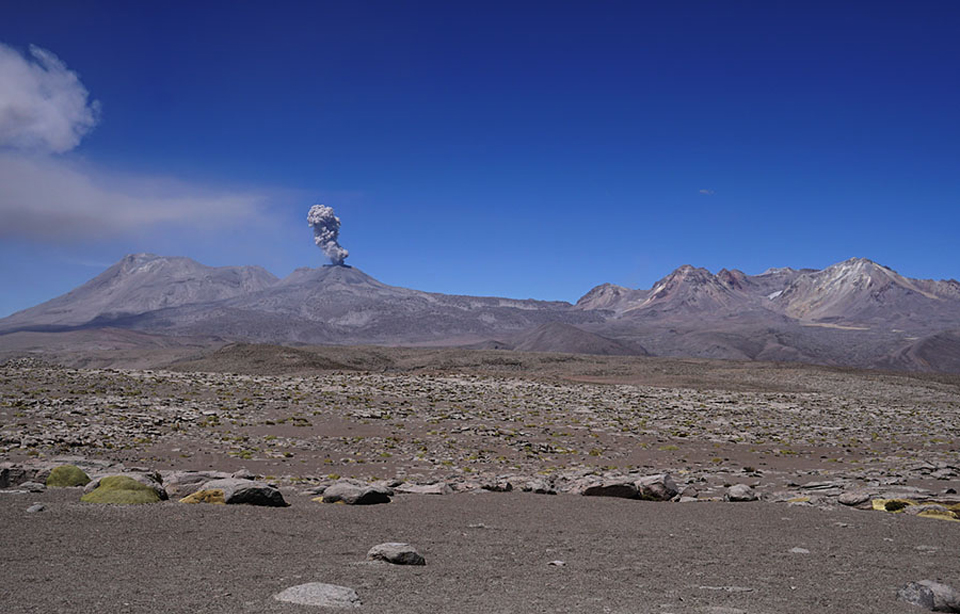 |
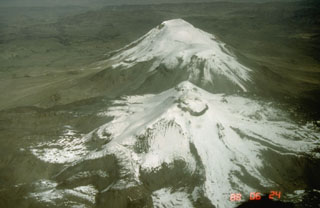
Figure 34. Sabancaya lies in the saddle between the older volcanic complexes of Ampato to the S (left) and Hualca Hualca to the N (right) in this view taken from 15 km E. It is the only one of the three to have erupted during the Holocene. An ash plume rose from Sabancaya during 12-15 December 2016, while ash from an earlier pulse is visible drifting S over Ampato. Photo copyright by Martin Rietze, used with permission. |
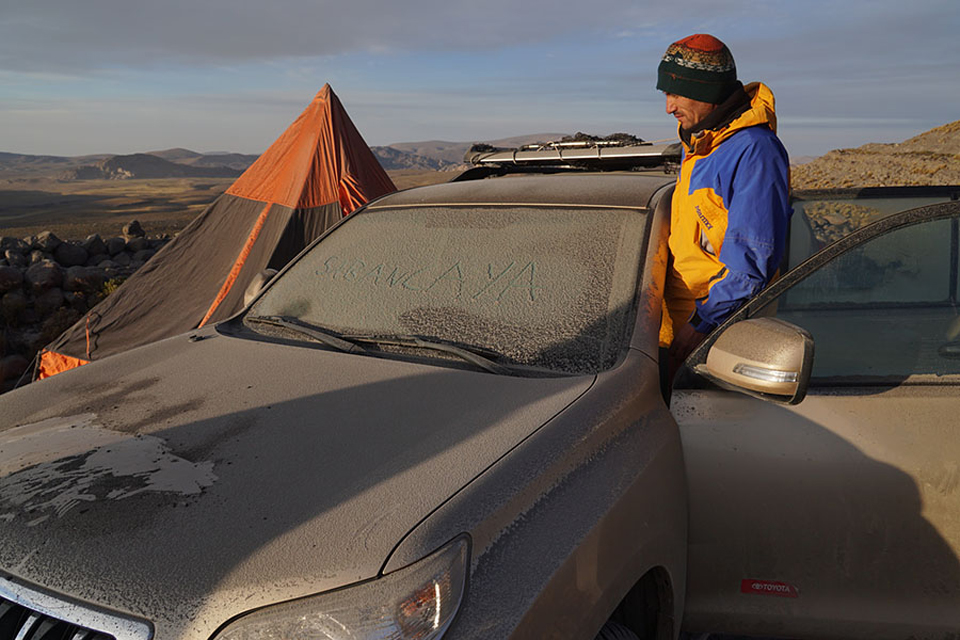 |
Figure 35. Trace amounts of ashfall from Sabancaya covered the region 10 km W of the volcano during 12-15 December 2016. Photo copyright by Martin Rietze, used with permission. |
 |
Figure 36. An ash-and-steam plume rose vertically from Sabancaya during 12-15 December 2016 while a meteor streaked across the nighttime sky in this image taken 6.5 km NNE of the summit. Photo copyright by Martin Rietze, used with permission. |
Summary of activity, February-November 2017. The persistent eruptive activity during February-November 2017 can be visualized by the continuous MIROVA plot of Log Radiative Power during this time (figure 37). The Buenos Aires VAAC issued 1,174 VAAC reports for Sabancaya during February-November 2017, with over 100 recorded each month (table 1). Tens of explosions were reported daily by OVI-INGEMMET and IGP-OVS throughout the period. Ash plumes usually rose to the 9-11 km altitude range (3,000-5,000 m above the summit), and drifted 30-50 km in many directions before dissipating. MODVOLC thermal alerts were reported between 2 and 16 times every month, and satellite data registered SO2 plumes with values greater than two Dobson Units multiple days each month (figure 38).
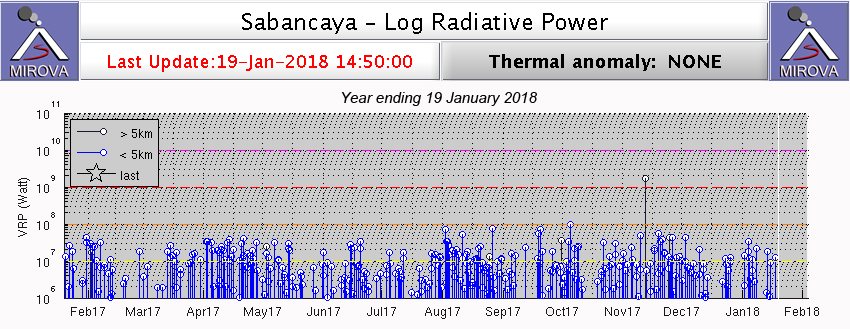 |
Figure 37. MODIS infrared satellite data plotted by MIROVA for the 12 months ending 19 January 2018 show the continuous signature of thermal activity from Sabancaya during that time. Courtesy of MIROVA. |
Table 1. Eruptive activity at Sabancaya, February-November 2017. Compiled using data from IGP-OVS/OVI-INGEMMET reports, the Buenos Aires VAAC, HIGP, and NASA GSFC.
| Month | VAAC Reports | Avg Daily Explosions by week | Max Plume Heights (m above crater) | Plume Drift | MODVOLC Alerts | Days with SO2 over 2 DU |
| Feb 2017 | 108 | 58, 23, 19, 42 | 3,000-4,300 | 40 km, NW, N, S, SE, SW | 6 | 12 |
| Mar 2017 | 122 | 44, 36, 36, 37, 41 | 2,500-4,800 | 30-40 km, S, NW, SW, N | 4 | 8 |
| Apr 2017 | 113 | 27, 37, 36, 33 | 3,000-3,200 | 40 km NW, NE, SE, W, N | 16 | 11 |
| May 2017 | 117 | 41, 38, 39, 41 | 2,800-4,200 | 30-40 km NE, E, SE | 4 | 3 |
| Jun 2017 | 104 | 47, 31, 26, 15, 5 | 1,500-3,700 | 30-40 km E, SE, SW, S | 4 | 5 |
| Jul 2017 | 127 | 10, 19, 24, 40 | 3,500-5,500 | 40-50 km NW, S, E, N, SE | 2 | 13 |
| Aug 2017 | 124 | 65, 41, 46, 44 | 3,200-4,200 | 30-50 km N, SE, NW, S | 12 | 10 |
| Sep 2017 | 118 | 38, 29, 45, 45 | 2,500-3,500 | 30-40 km SE, E, NE | 6 | 5 |
| Oct 2017 | 120 | 42, 41, 47, 43 | 3,100-3,900 | 35-60 N, NW, W, S, SE, NE, E | 9 | 8 |
| Nov 2017 | 121 | 57, 66, 82, 78, 69 | 3,300-4,200 | 40-50 km N, NE, E, SE, NW, SW | 11 | 10 |
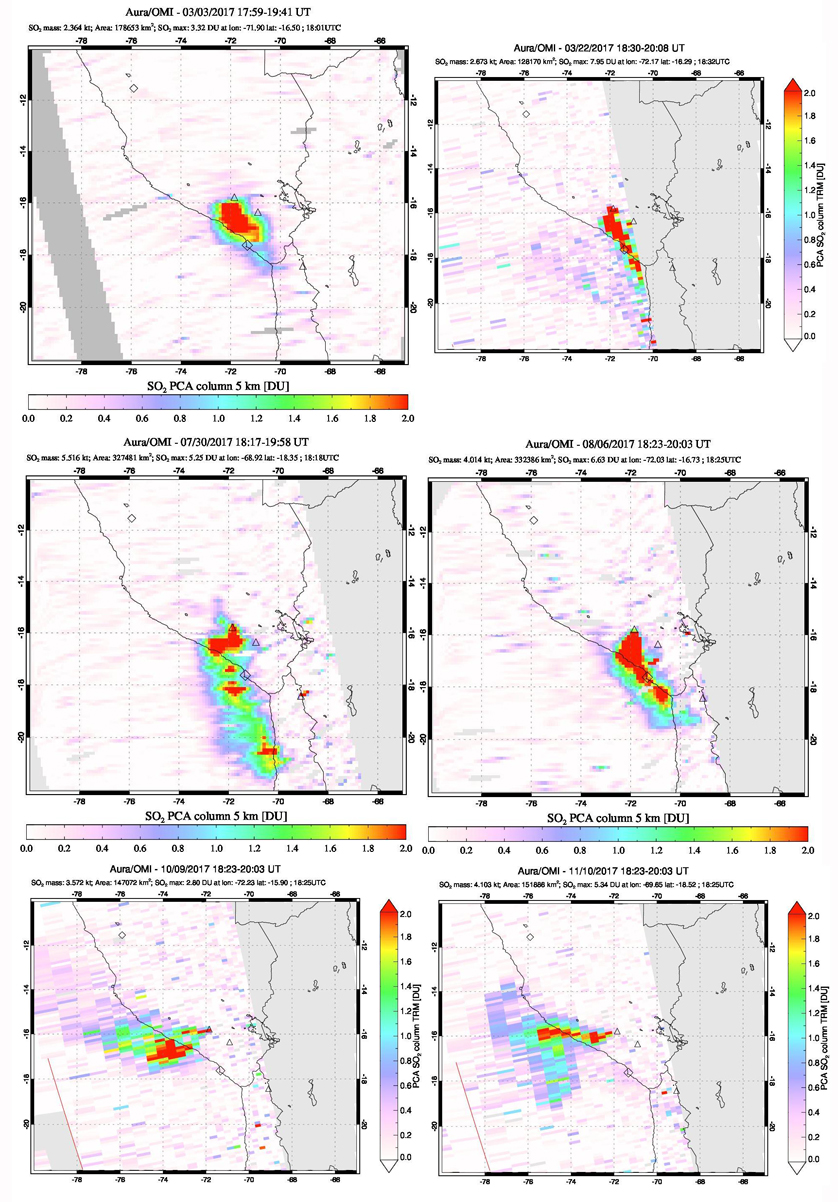 |
Figure 38. Numerous significant SO2 plumes were captured by the OMI instrument on the Aura satellite for Sabancaya during February-November 2017. Plumes drifted SSE on 4 March, 22 March, 30 July, and 6 August 2017 (top four images), and SW and W on 9 October and 10 November 2017 (bottom two images). The red pixels indicate values of Dobson Units (DU) greater than 2. Courtesy of NASA Goddard Space Flight Center. |
Activity during February-November 2017. IGP-OVS and OVI-INGEMMET monitor seismicity, inflation and deflation, SO2 emissions, and visual activity with webcams from several locations around Sabancaya (figure 39). Ash plumes during February 2017 rose to heights of 3,000-4,300 m above the summit (figure 40). The average number of daily explosions decreased from 53 the first week to 19 the third week, and then increased to 42 during the last week. Ash plumes drifted up to 40 km in numerous directions.
 |
Figure 39. Stations where IGP-OVS and OVI-INGEMMET monitor seismicity (red), inflation and deflation (green), SO2 emissions (orange), and their webcam locations (yellow) for Sabancaya. Courtesy of IGP-OVS and OVI-INGEMMET weekly reports. |
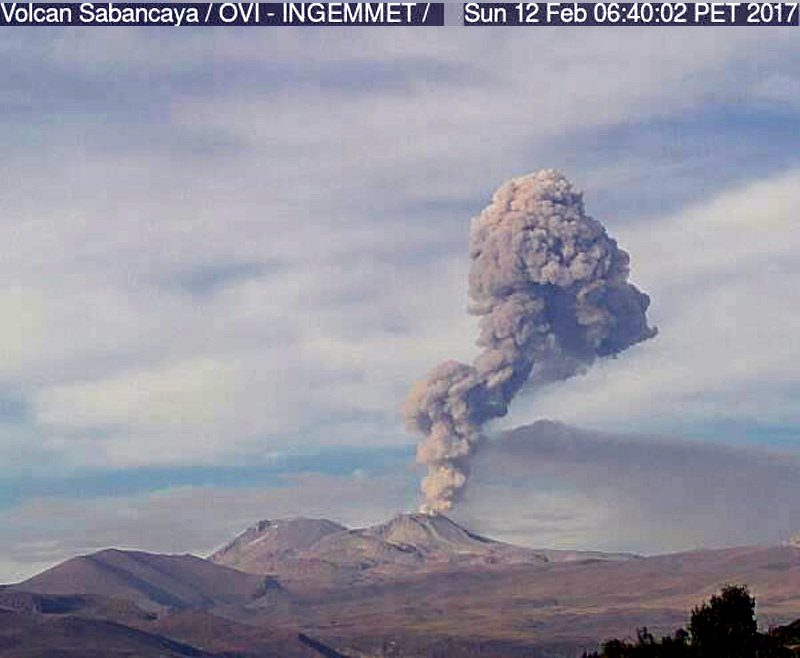 |
Figure 40. Ash emission from Sabancaya, 12 February 2017. View from the OVI-INGEMMET webcam located near Coporaque, about 30 km NE. Courtesy of OVI-INGEMMET (Reporte Semanal de Monitoreo de la Actividad del Volcan Sabancaya, Semana del 06 al 12 de febrero de 2017). |
During March 2017 the number of daily explosions was very consistent averaging each week between 36 and 44 events. Maximum ash plume heights ranged from 2,500 to 4,800 m and drifted 30-40 km to either the NW or SW (figure 41). Ash fell in Pinchollo (20 km N) and Cabanaconde (22 km NW) during the last few days of the month.
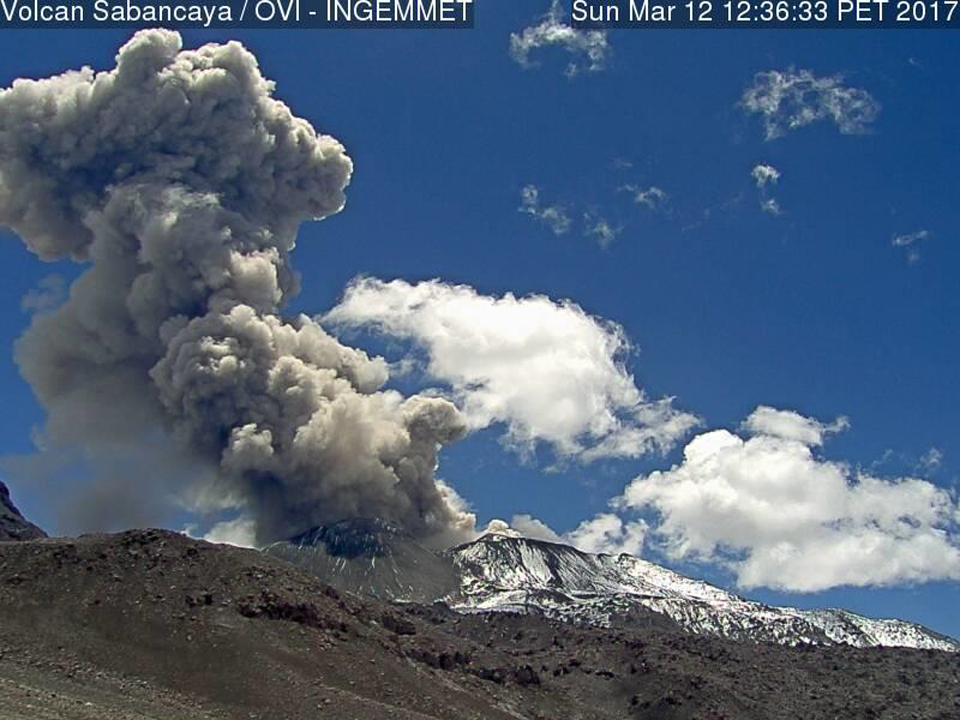 |
Figure 41. Ash emission from Sabancaya, 12 March 2017. Taken from OVI-INGEMMET webcam located about 4 km NE. Courtesy of OVI-INGEMMET (Reporte Semanal de Monitoreo de la Actividad del Volcan Sabancaya, Semana del 06 al 12 de marzo de 2017). |
Ash fell during the first week of April in Pinchollo, Maca (20 km NE) and Chivay (32 km NE). Plume heights during the month were slightly lower, ranging from 3,000-3,200 m and drifted 40 km in several directions. The frequency of daily explosions decreased slightly from March to an average each week ranging from 27 to37. The Buenos Aires VAAC reported that diffuse ash plumes drifted 100 km E on 9 April.
The frequency of daily explosions increased slightly during May; weekly averages ranged from 38 to 41. Plume heights were somewhat higher, at 2,800-4,200 m, and drifted 30-40 km in many directions (figure 42). There was a notable decrease during June 2017 in the number of daily explosions from an average during the first week of 47 to an average of only five at the end of the month. Deflation was observed in the GPS data after 21 June. Plume heights ranged from 1,500 to 3,700 m.
 |
Figure 42. On 20 May 2017 the Moderate Resolution Imaging Spectroradiometer (MODIS) on NASA's Terra satellite captured this image of repeated puffs of ash rising from Sabancaya and drifting E. Courtesy of NASA Earth Observatory. |
Activity increased steadily during July 2017. Daily explosions rose from an average of 10 during the first week to 40 the last week; ash plume heights were up to 5,000 m during those weeks (figures 43, 44) and drifted 50 km or more generally NW and SE. Ash plumes during the third week affected communities N of the volcano, including the villages of Cabanaconde, Pinchollo, Lari (20 km NE), Madrigal (20 km NE), Ichupampa (23 km NE), Maca and Achoma (21 km NE). Winds changed to the S on 22 July, so ashfall then affected Lluta (30 km SW), Huanca (75 km SSE), and some parts of Arequipa (80 km SSE).
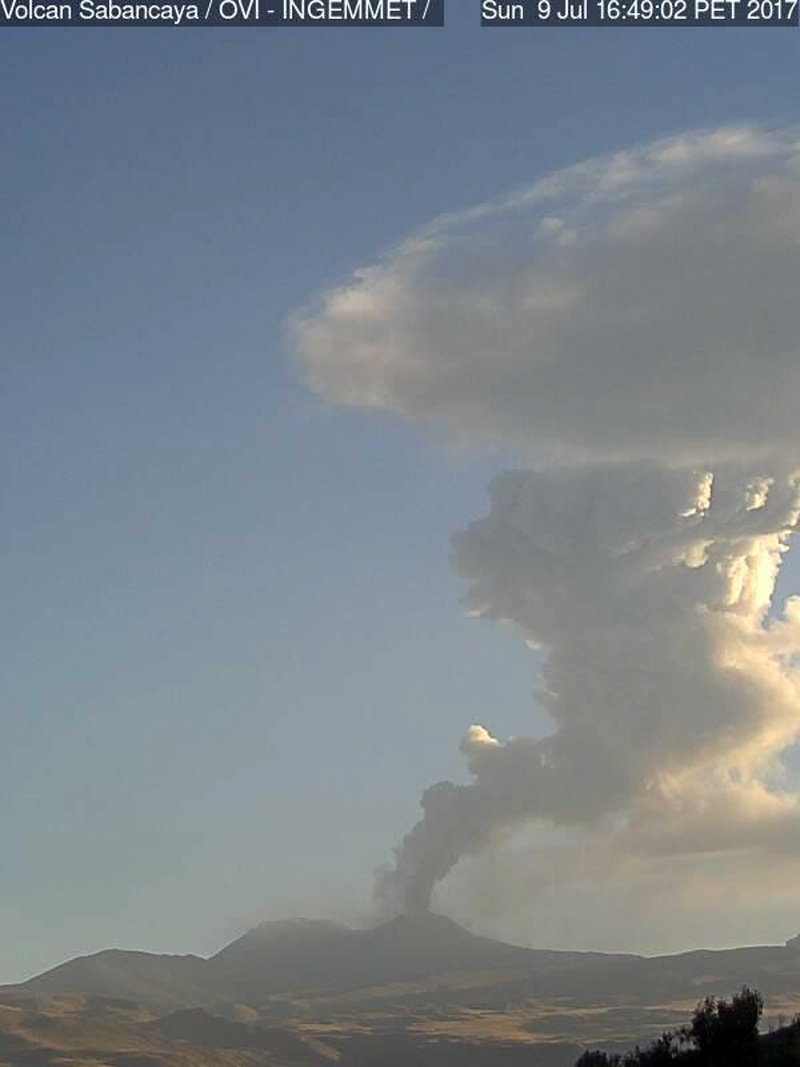 |
Figure 43. Ash and gas emission from Sabancaya rose several kilometers above the summit on 9 July 2017 in this OVI-INGEMMET image from their webcam located near Coporaque, about 30 km NE. Courtesy of OVI-INGEMMET (Reporte Semanal de Monitoreo de la Actividad del Volcan Sabancaya, Semana del 03 al 09 de julio de 2017). |
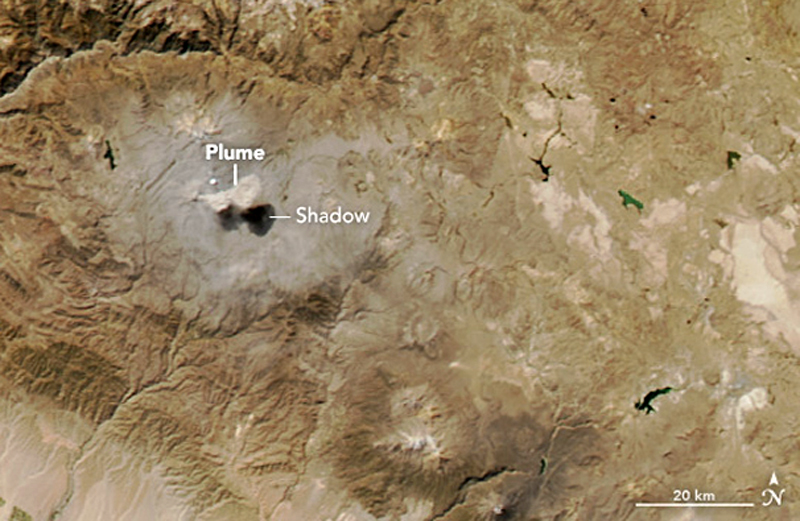 |
Figure 44. On 26 July 2017, the Moderate Resolution Imaging Spectroradiometer (MODIS) on NASA's Aqua satellite captured this natural-color image of an ash plume drifting E from Sabancaya. The rising ash cast a shadow on the ground below. Courtesy of NASA Earth Observatory. |
After averaging 65 explosions per day during the first week of August 2017, activity declined slightly to weekly averages of 41-46 explosions per day for the rest of the month. Plume heights ranged from 3,200 to 4,200 m and drifted generally 30-50 km NW or SE. During September 2017 activity was much the same. Plume heights ranged from 2,500-3,500 m, and drifted 30-40 km SE or NE. The weekly averages of daily explosion frequency varied between 29 and 45 events.
A noteworthy difference in activity occurred during October 2017, when there were tremors with ash emissions lasting for more than three hours per day during the last two weeks of the month. Daily explosion frequency averaged from 41 to 47 each week, and plume heights ranged from 3,100 to 3,900 m (figure 45). A few plumes drifted as far as 60 km during the third week of the month.
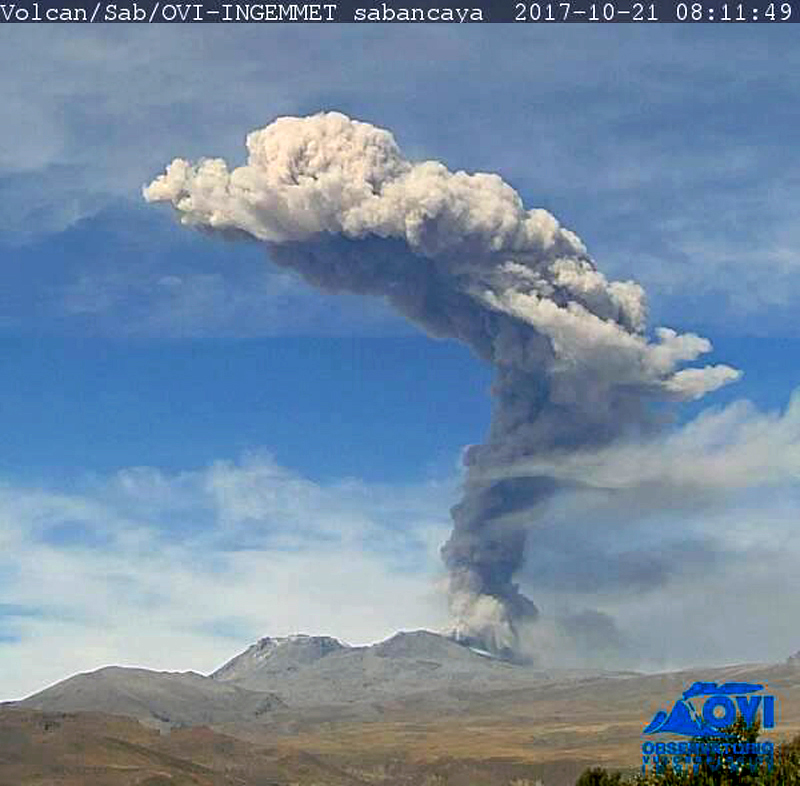 |
Figure 45. A large ash and gas plume rose from Sabancaya on 21 October 2017 in this view from the OVI-INGEMMET webcam located near Coporaque, about 30 km NE. Courtesy of OVI-INGEMMET (Reporte Semanal de Monitoreo de la Actividad del Volcan Sabancaya, Semana del 16 al 22 de octubre de 2017). |
During November 2017 the number of daily explosions increased from an average of 57 the first week to 82 by the third week, decreasing to 69 at the end of the month. Plume heights remained at 3,300-4,200 m, drifting 40-50 km in several directions. Tremors with ash emissions lasted 1-2 hours most days.
Geological Summary. Sabancaya, located in the saddle NE of Ampato and SE of Hualca Hualca volcanoes, is the youngest of these volcanic centers and the only one to have erupted in historical time. The oldest of the three, Nevado Hualca Hualca, is of probable late-Pliocene to early Pleistocene age. The name Sabancaya (meaning "tongue of fire" in the Quechua language) first appeared in records in 1595 CE, suggesting activity prior to that date. Holocene activity has consisted of Plinian eruptions followed by emission of voluminous andesitic and dacitic lava flows, which form an extensive apron around the volcano on all sides but the south. Records of historical eruptions date back to 1750.
Information Contacts: Observatorio Volcanologico del INGEMMET, (Instituto Geológical Minero y Metalúrgico), Barrio Magisterial Nro. 2 B-16 Umacollo - Yanahuara Arequipa (URL: http://ovi.ingemmet.gob.pe); Instituto Geofisico del Peru, Observatoria Vulcanologico del Sur (IGP-OVS), Arequipa Regional Office, Urb La Marina B-19, Cayma, Arequipa, Peru (URL: http://ovs.igp.gob.pe/); NASA Earth Observatory, EOS Project Science Office, NASA Goddard Space Flight Center, Goddard, Maryland, USA (URL: http://earthobservatory.nasa.gov/); MIROVA (Middle InfraRed Observation of Volcanic Activity), a collaborative project between the Universities of Turin and Florence (Italy) supported by the Centre for Volcanic Risk of the Italian Civil Protection Department (URL: http://www.mirovaweb.it/); Hawai'i Institute of Geophysics and Planetology (HIGP), MODVOLC Thermal Alerts System, School of Ocean and Earth Science and Technology (SOEST), Univ. of Hawai'i, 2525 Correa Road, Honolulu, HI 96822, USA (URL: http://modis.higp.hawaii.edu/); NASA Goddard Space Flight Center (NASA/GSFC), Global Sulfur Dioxide Monitoring Page, Atmospheric Chemistry and Dynamics Laboratory, Goddard, Maryland, USA (URL: https://so2.gsfc.nasa.gov/); Martin Rietze (URL: http://www.mrietze.com/).