Report on Sangeang Api (Indonesia) — February 2020
Bulletin of the Global Volcanism Network, vol. 45, no. 2 (February 2020)
Managing Editor: Edward Venzke.
Edited by Janine B. Krippner.
Sangeang Api (Indonesia) Ash emissions and lava flow extrusion continue during May 2019 through January 2020
Please cite this report as:
Global Volcanism Program, 2020. Report on Sangeang Api (Indonesia) (Krippner, J.B., and Venzke, E., eds.). Bulletin of the Global Volcanism Network, 45:2. Smithsonian Institution. https://doi.org/10.5479/si.GVP.BGVN202002-264050
Sangeang Api
Indonesia
8.2°S, 119.07°E; summit elev. 1912 m
All times are local (unless otherwise noted)
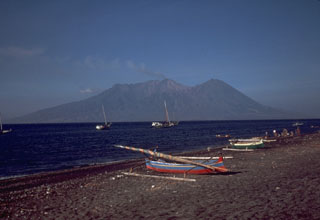
Sangeang Api is located in the eastern Sunda-Banda Arc in Indonesia, forming a small island in the Flores Strait, north of the eastern side of West Nusa Tenggara. It has been frequently active in recent times with documented eruptions spanning back to 1512. The edifice has two peaks – the active Doro Api cone and the inactive Doro Mantori within an older caldera (figure 37). The current activity is focused at the summit of the cone within a horseshoe-shaped crater at the summit of Doro Api. This bulletin summarizes activity during May 2019 through January 2020 and is based on Darwin Volcanic Ash Advisory Center (VAAC) reports, Pusat Vulkanologi dan Mitigasi Bencana Geologi (PVMBG, or CVGHM) MAGMA Indonesia Volcano Observatory Notice for Aviation (VONA) reports, and various satellite data.
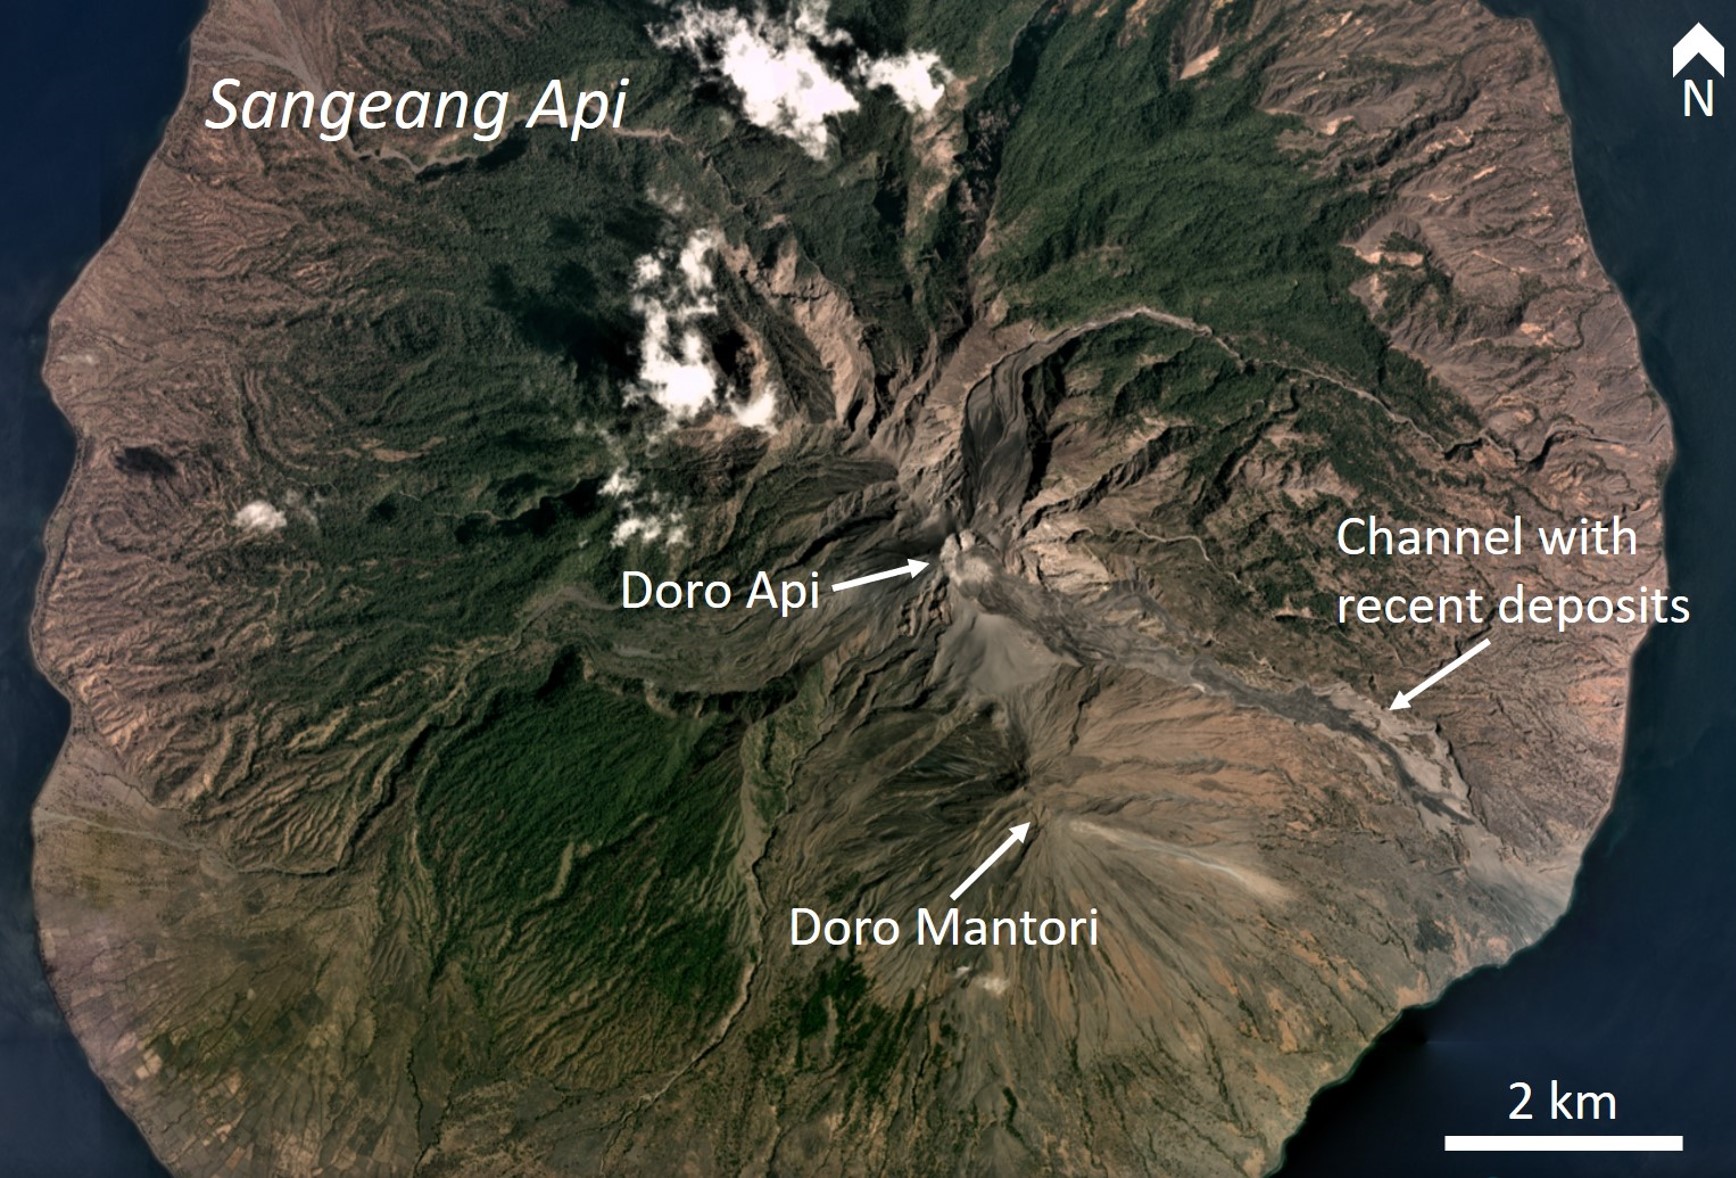 |
Figure 37. A PlanetScope satellite image of Sangeang Api with the active Doro Api and the inactive Doro Mantori cones indicated, and the channel SE of the active area that contains recent lava flows and other deposits. December 2019 monthly mosaic copyright of Planet Labs 2019. |
Thermal anomalies were visible in Sentinel-2 satellite thermal images on 4 and 5 May with some ash and gas emission visible; bright pixels from the summit of the active cone extended to the SE towards the end of the month, indicating an active lava flow (figure 38). Multiple small emissions with increasing ash content reached 1.2-2.1 km altitude on 17 June. The emissions drifted W and WNW, and a thermal anomaly was also visible. On the 27th ash plumes rose to 2.1 km and drifted NW and the thermal anomaly persisted. One ash plume reached 2.4 km and drifted NW on the 29th, and steam emissions were ongoing. Satellite images showed two active lava flows in June, an upper and a lower flow, with several lobes descending the same channel and with lateral levees visible in satellite imagery (figure 39). The lava extrusion appeared to have ceased by late June with lower temperatures detected in Sentinel-2 thermal data.
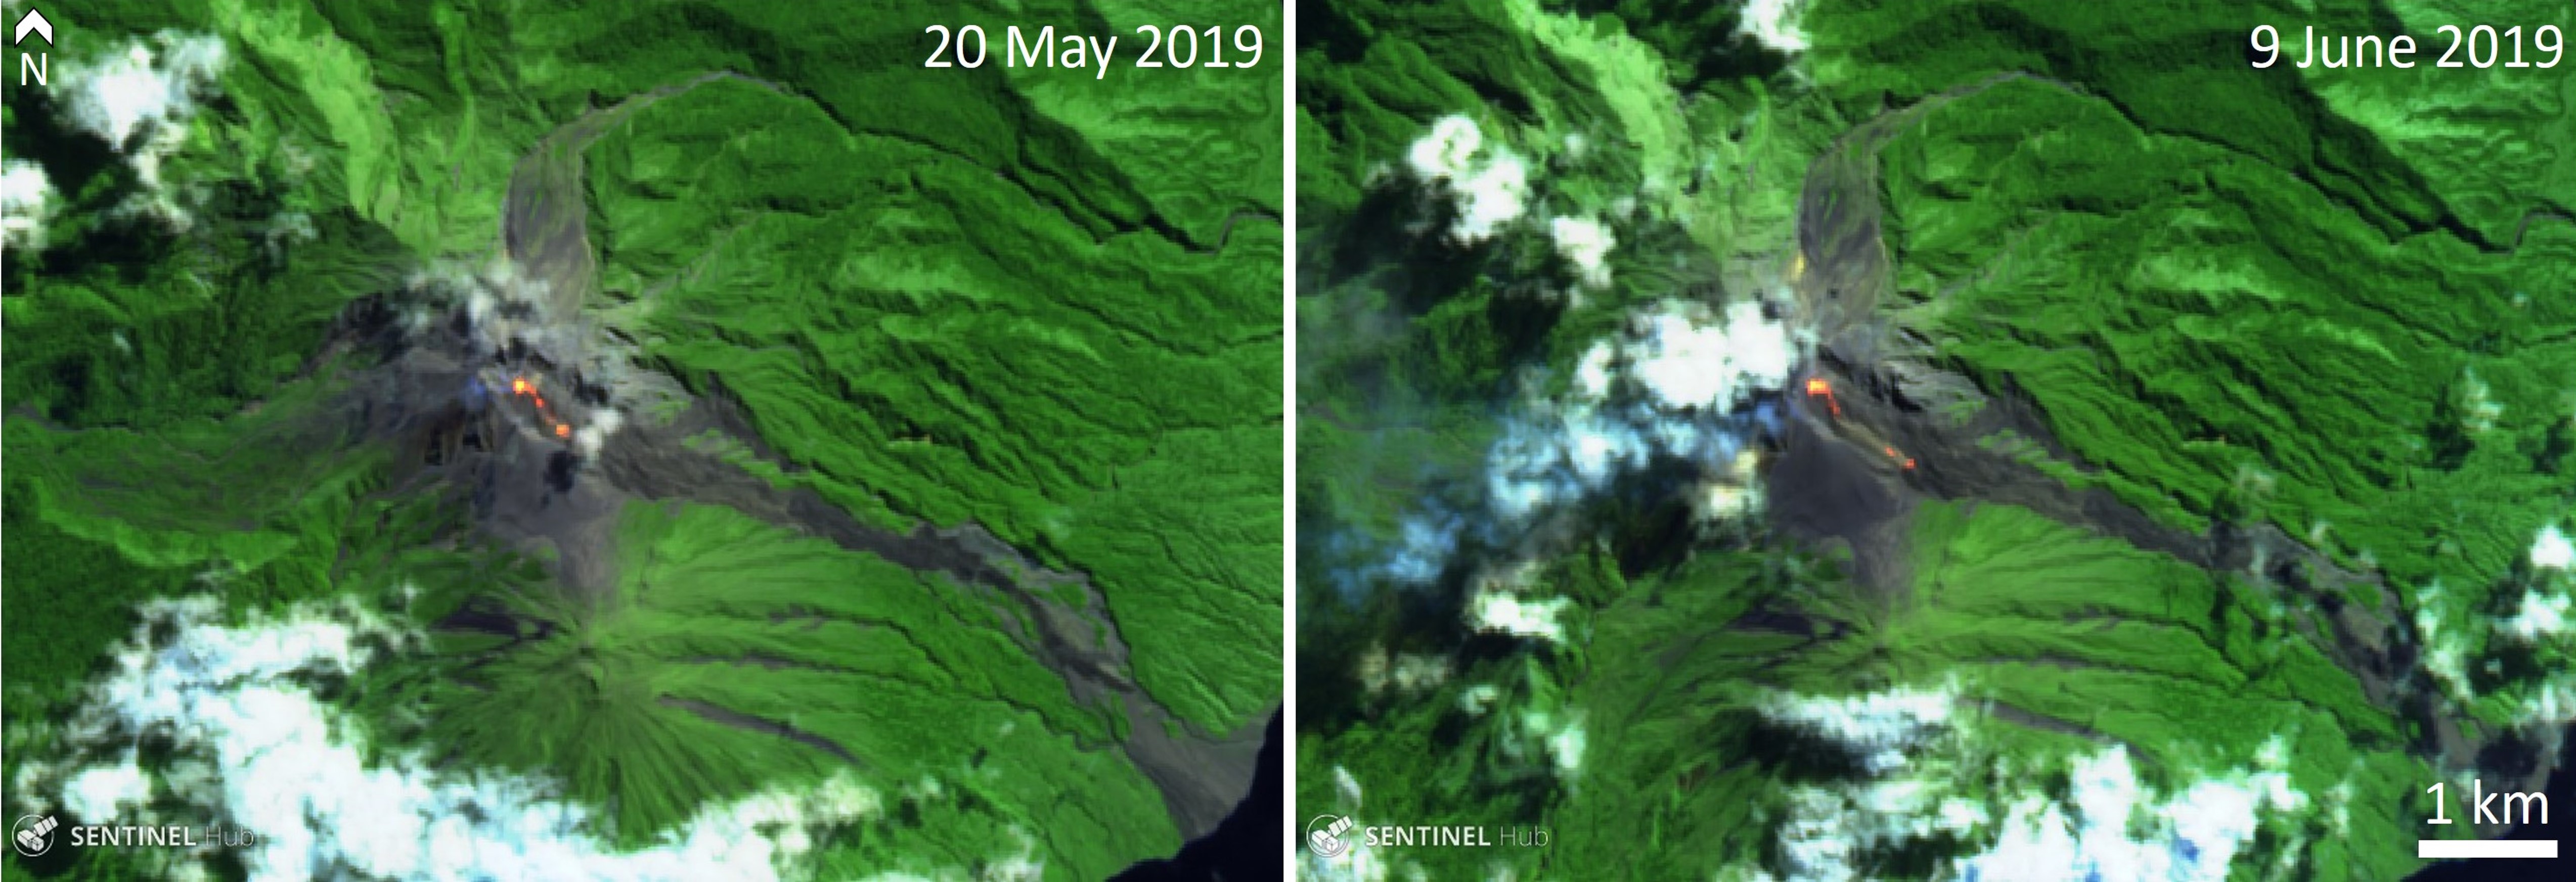 |
Figure 38. Sentinel-2 satellite thermal images of Sangeang Api on 20 May and 9 June 2019 show an active lava flow from the summit, traveling to the SE. False color (urban) image (bands 12, 11, 4) courtesy of Sentinel Hub Playground. |
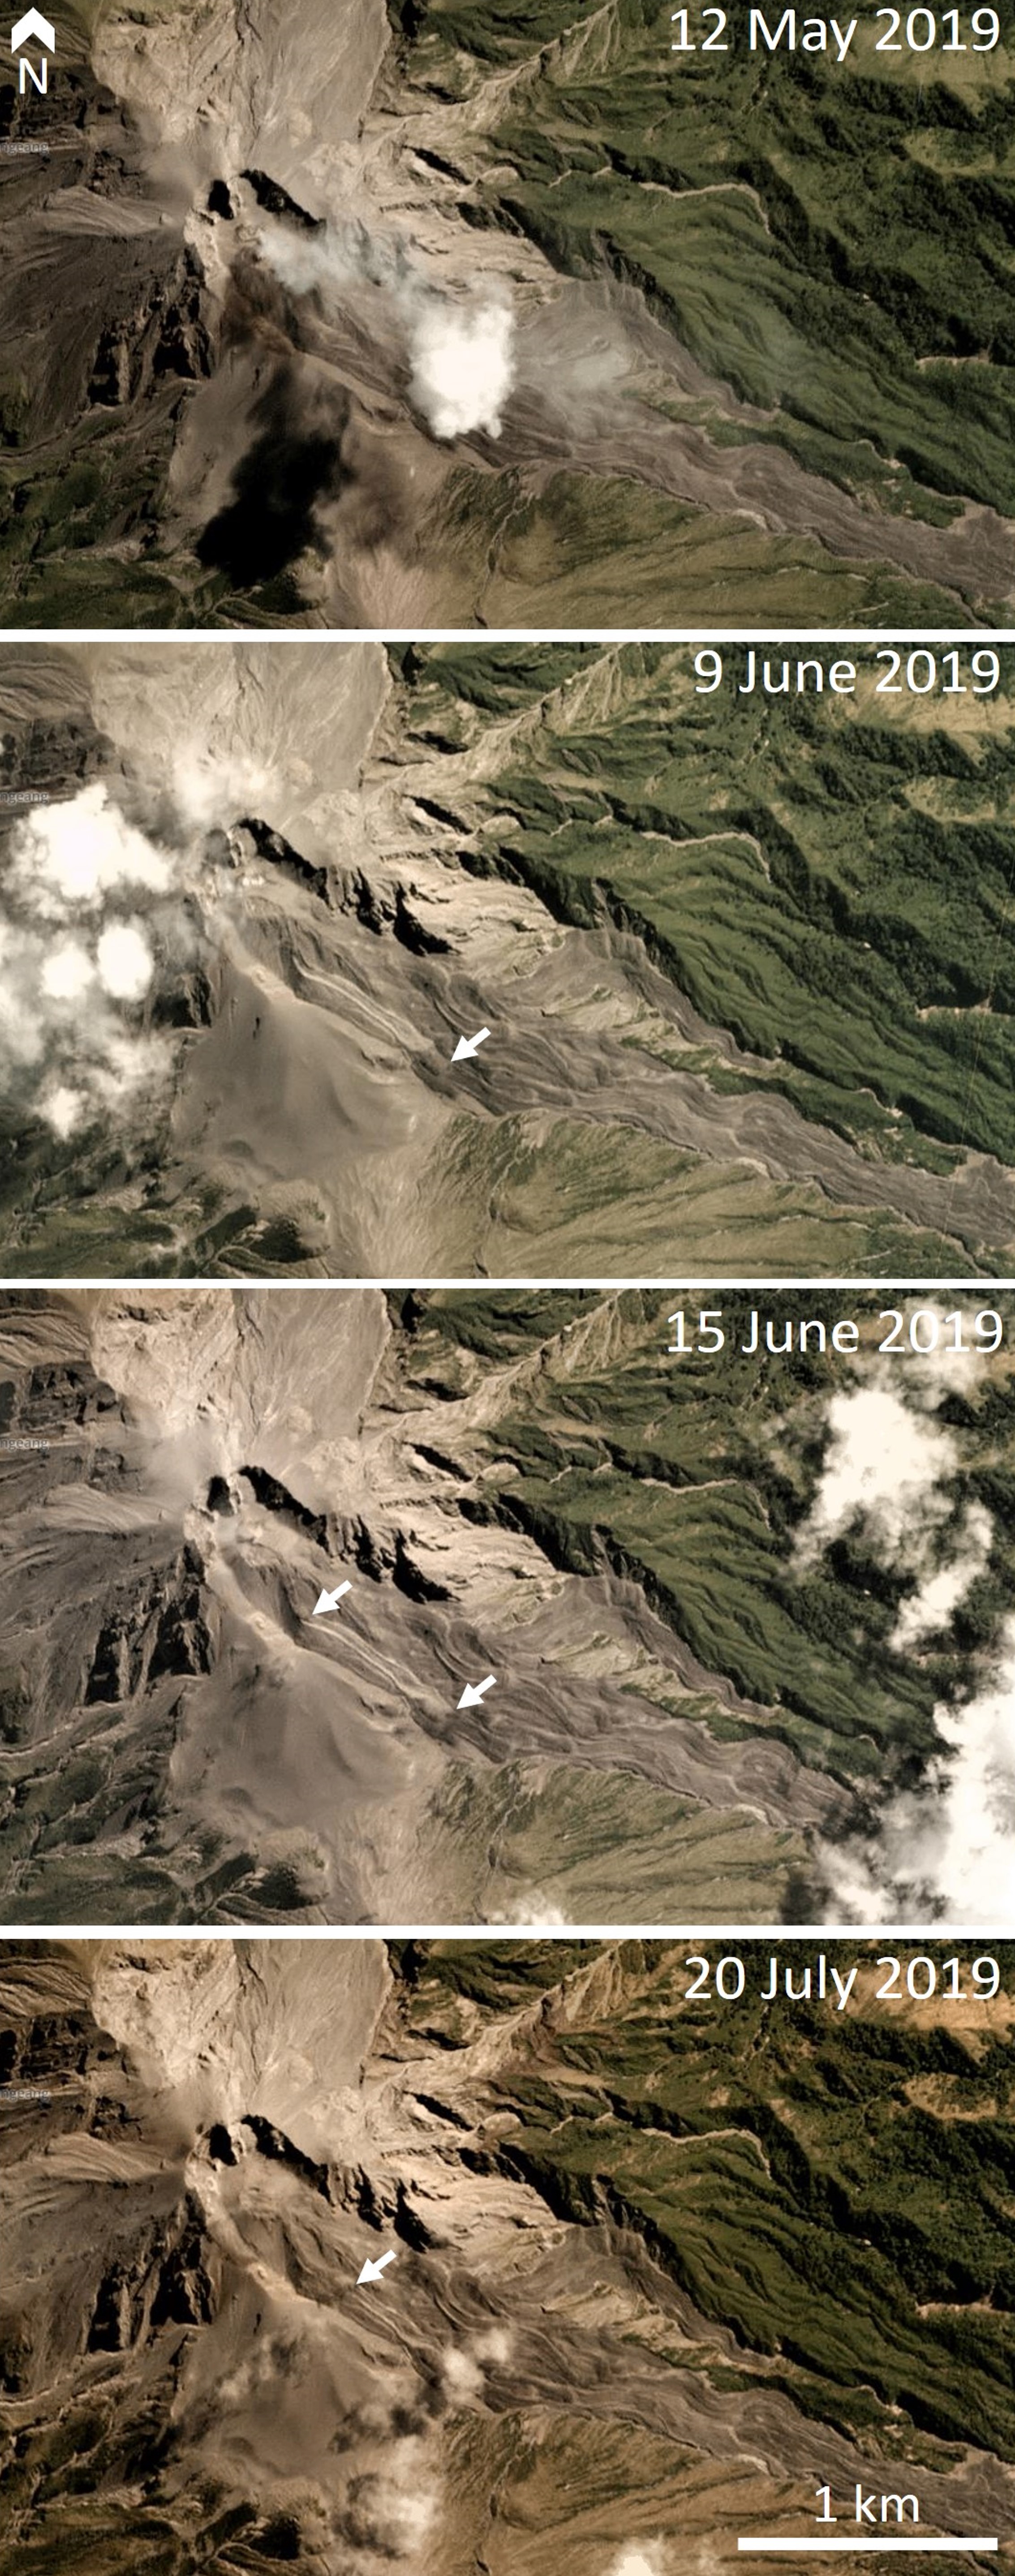 |
Figure 39. PlanetScope satellite images of Sangeang Api show new lava flows during June and July, with white arrows indicating the flow fronts. Copyright Planet Labs 2019. |
During 4-5 July the Darwin VAAC reported ash plumes reaching 2.1-2.3 km altitude and drifting SW and W. Activity continued during 6-9 July with plumes up to 4.6 km drifting N, NW, and SW. Thermal anomalies were noted on the 4th and 8th. Plumes rose to 2.1-3 km during 10-16th, and to a maximum altitude of 4.6 km during 17-18 and 20-22. Similar activity was reported during 24-30 July with plumes reaching 2.4-3 km and dispersing NW, W, and SW. The upper lava flow had increased in length since 15 June (see figure 39).
During 31 July through 3 September ash plumes continued to reach 2.4-3 km altitude and disperse in multiple directions. Similar activity was reported throughout September. Thermal anomalies also persisted through July-September, with evidence of hot avalanches in Sentinel-2 thermal satellite imagery on 23 August, and 9, 12, 22, and 27 September. Thermal anomalies suggested hot avalanches or lava flows during October (figure 40). During 26-28 October short-lived ash plumes were reported to 2.1-2.7 km above sea level and dissipated to the NW, WNW, and W. Short-lived explosions produced ash plumes up to 2.7-3.5 km altitude were noted during 30-31 October and 3-4 November 2019.
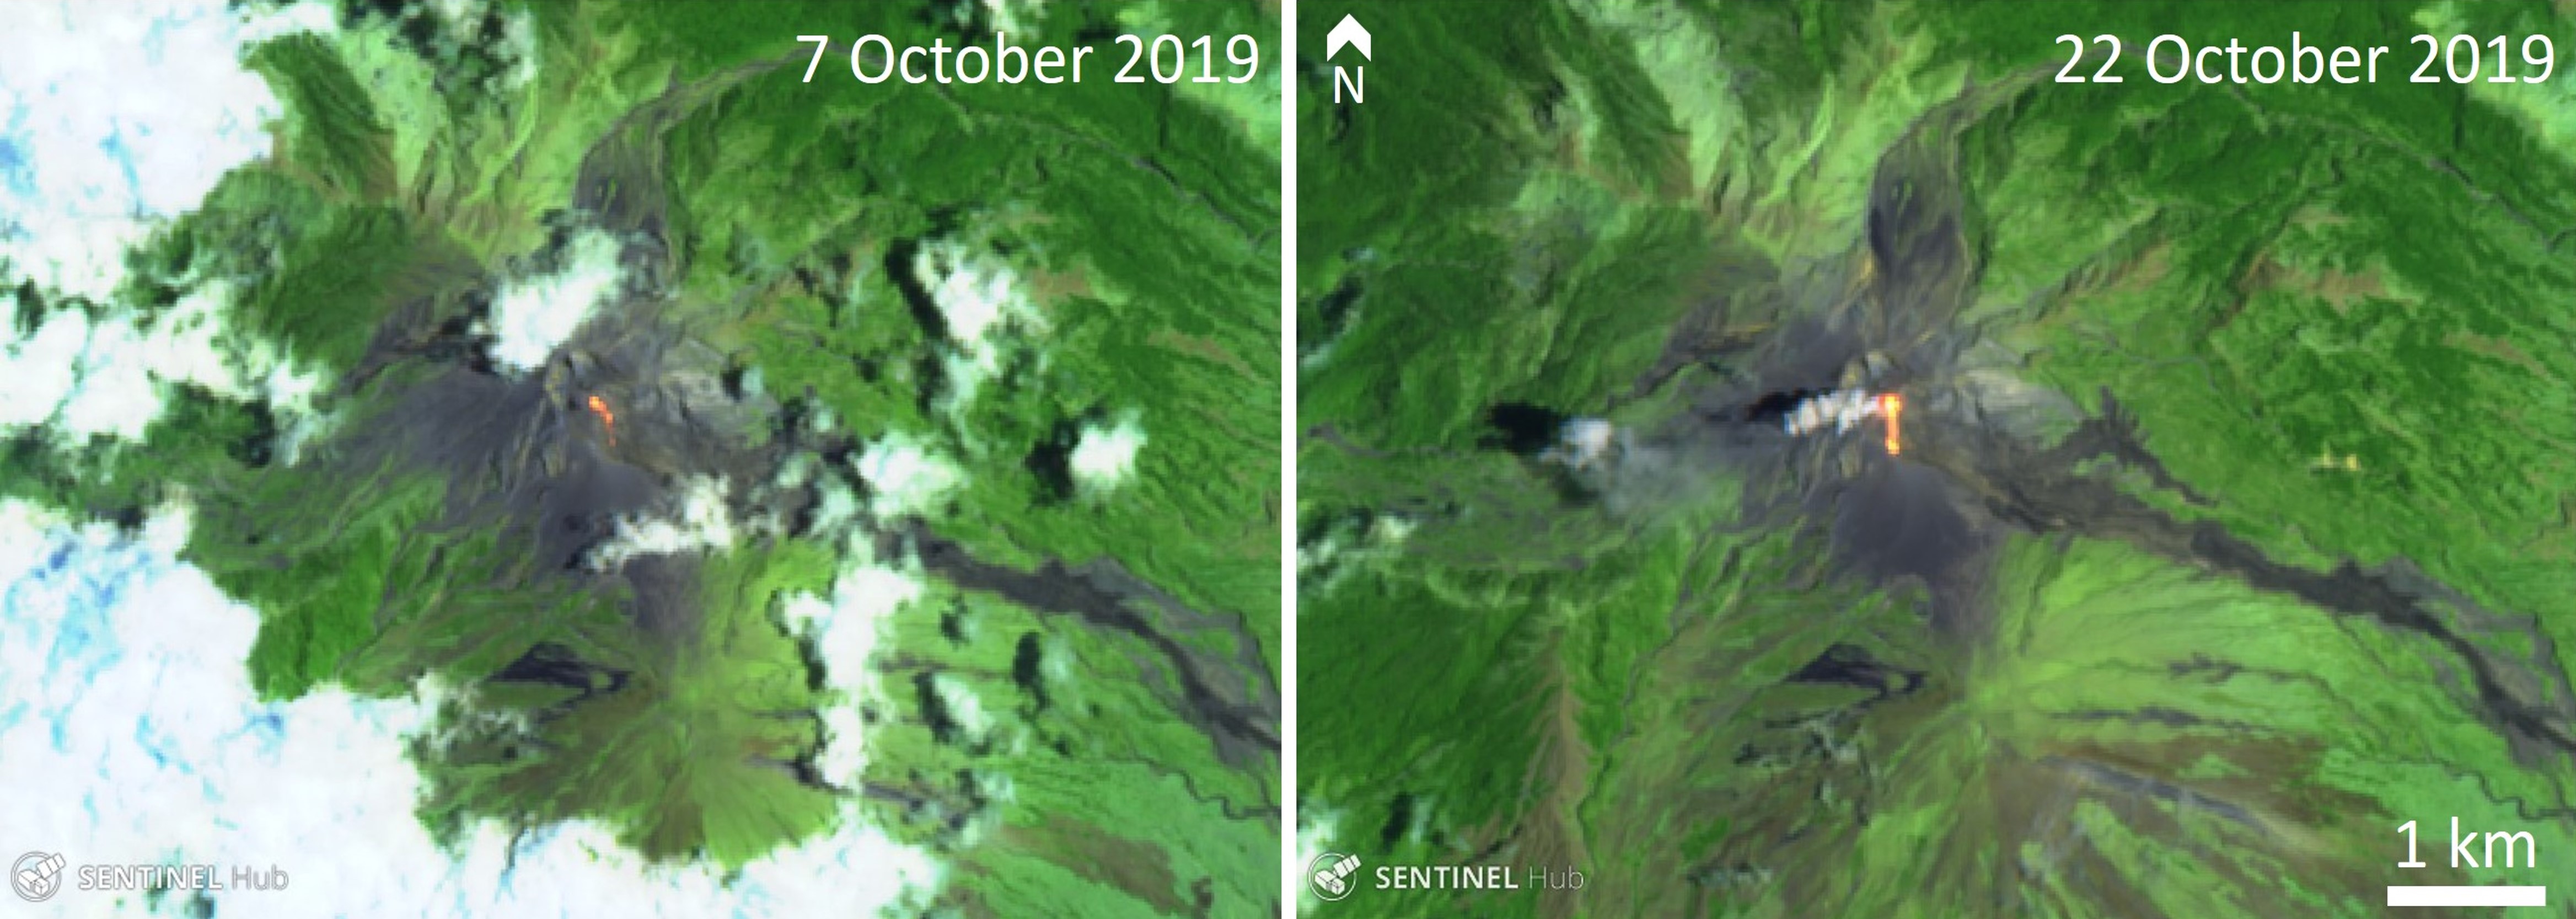 |
Figure 40. Sentinel-2 satellite thermal images of Sangeang Api on 7 and 22 October 2019 show an area of elevated temperatures trending from the summit of the active cone down the SE flank. False color (urban) image rendering (bands 12, 11, 4) courtesy of Sentinel Hub Playground. |
Discrete explosions produced ash plumes up to 2.7-3.5 km altitude during 3-4 November, and during the 6-12th the Darwin VAAC reported short-lived ash emissions reaching 3 km altitude. Thermal anomalies were visible in satellite images during 6-8 November. A VONA was released on 14 November for an ash plume that reached about 2 km altitude and dispersed to the west. During 14-19 November the Darwin VAAC reported short-lived ash plumes reaching 2.4 km that drifted NW and W. Additional ash plumes were observed reaching a maximum altitude of 2.4 km during 20-26 November. Thermal anomalies were detected during the 18-19th, and on the 27th.
Ash plumes were recorded reaching 2.4 km during 4-5, 7-9, 11-13, and 17-19 December, and up to 3 km during 25-28 December. There were no reports of activity in early to mid-January 2020 until the Darwin VAAC reported ash reaching 3 km on 23 January. A webcam image on 15 January showed a gas plume originating from the summit. Several fires were visible on the flanks during May 2019 through January 2020, and this is seen in the MIROVA log thermal plot with the thermal anomalies greater than 5 km away from the crater (figure 41).
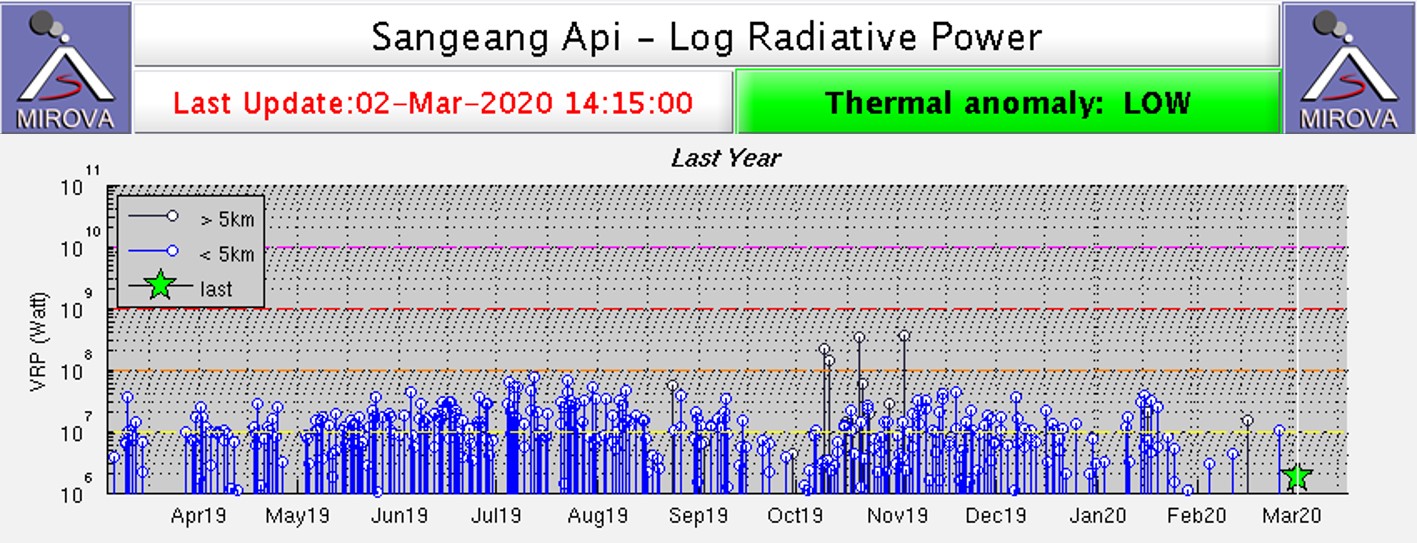 |
Figure 41. MIROVA log plot of radiative power indicates the persistent activity at Sangeang Api during April 2019 through March 2020. There was a slight decline in September-October 2019 and again in February 2020. Courtesy of MIROVA. |
Geological Summary. Sangeang Api volcano, one of the most active in the Lesser Sunda Islands, forms a small 13-km-wide island off the NE coast of Sumbawa Island. Two large trachybasaltic-to-tranchyandesitic volcanic cones, Doro Api and Doro Mantoi, were constructed in the center and on the eastern rim, respectively, of an older, largely obscured caldera. Flank vents occur on the south side of Doro Mantoi and near the northern coast. Intermittent eruptions have been recorded since 1512, most of them during in the 20th century.
Information Contacts: Pusat Vulkanologi dan Mitigasi Bencana Geologi (PVMBG, also known as Indonesian Center for Volcanology and Geological Hazard Mitigation, CVGHM), Jalan Diponegoro 57, Bandung 40122, Indonesia (URL: http://www.vsi.esdm.go.id/); MIROVA (Middle InfraRed Observation of Volcanic Activity), a collaborative project between the Universities of Turin and Florence (Italy) supported by the Centre for Volcanic Risk of the Italian Civil Protection Department (URL: http://www.mirovaweb.it/); Sentinel Hub Playground (URL: https://www.sentinel-hub.com/explore/sentinel-playground); Planet Labs, Inc. (URL: https://www.planet.com/).