Report on St. Helens (United States) — May 1981
Scientific Event Alert Network Bulletin, vol. 6, no. 5 (May 1981)
Managing Editor: Lindsay McClelland.
St. Helens (United States) Deformation rates and SO2 emissions increase; eruption expected soon
Please cite this report as:
Global Volcanism Program, 1981. Report on St. Helens (United States) (McClelland, L., ed.). Scientific Event Alert Network Bulletin, 6:5. Smithsonian Institution. https://doi.org/10.5479/si.GVP.SEAN198105-321050
St. Helens
United States
46.2°N, 122.18°W; summit elev. 2549 m
All times are local (unless otherwise noted)
Small steam explosions, some ejecting a little ash, occurred intermittently through May. Explosions correlated with emergent low-frequency seismic signals occurred on 6 May at 1414; 11 May at 2140; 13 May at 0810 and 1059; 20 May at 0615; 22 May at 0247; 25 May at 2206; and 29 May at 1229. However, increased seismicity did not accompany an increase in steaming at 1040 on 13 May, or three ash puffs ejected between 1425 and 1431 the same day. Furthermore, seismic signals produced by steam explosions are often indistinguishable from those generated by rockfalls in the crater, so the seismic record alone cannot confirm the occurrence of either.
Rates of ground displacement within the crater and the volume of SO2 emitted by the volcano both began to increase in late May. Until about 20 May, only very slow changes were noted in the position of the N crater rampart and in thrust faults surrounding the dome (figure 16). Measurements 27 May showed an acceleration in the rate of displacement, and reoccupation of rampart stations 5 June showed outward movement of about 1 cm/day. The rate of rampart movement had increased to about 2 cm/day between 11 and 15 June, and the S thrust fault (SE of the dome) moved 8.3 cm/day during the same period. Data telemetered 29 May-9 June by a newly installed bubble tiltmeter just NE of the dome showed substantial uplifts consistent with other deformation data.
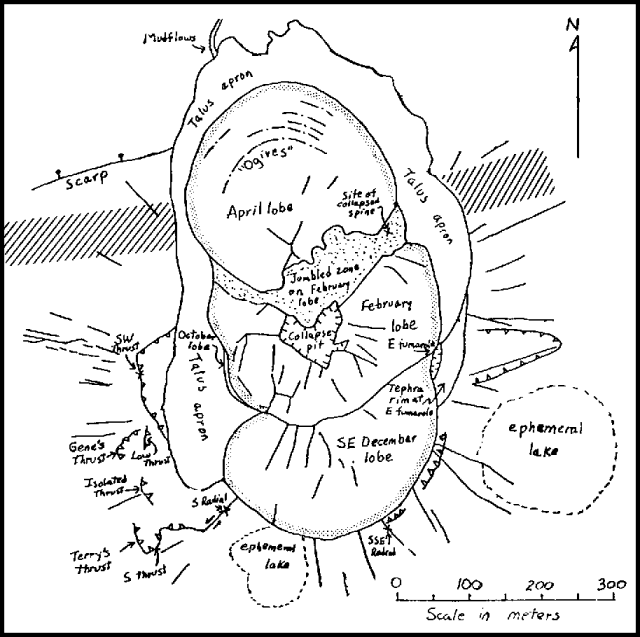 |
Figure 16. Map of the May 1981 composite lava dome in the crater of Mt. St. Helens, prepared by D. Swanson. The margins of the dome are outlined by a stipple pattern. The approximate position of the crest of the N crater rampart is shown by a pattern of diagonal lines on each side of the April lobe. The base station for deformation measurements is located several kilometers to the N, off the map. |
The rate of SO2 emission was measured by COSPEC from fixed-wing aircraft flying under the plume. Between 1 and 16 May, the three-day moving average of SO2 output decreased from 450 to 150 t/d. This trend reversed in late May, with emission rates rising from 190 t/d on 22 May to about 500 t/d by 11 June.
The USGS and the University of Washington Geophysics Program issued a joint advisory 12 June stating that an eruption, probably of the dome-building type, was likely to begin within the next 1-2 weeks if ground deformation and gas emission trends continued.
Geological Summary. Prior to 1980, Mount St. Helens was a conical volcano sometimes known as the Fujisan of America. During the 1980 eruption the upper 400 m of the summit was removed by slope failure, leaving a 2 x 3.5 km breached crater now partially filled by a lava dome. There have been nine major eruptive periods beginning about 40-50,000 years ago, and it has been the most active volcano in the Cascade Range during the Holocene. Prior to 2,200 years ago, tephra, lava domes, and pyroclastic flows were erupted, forming the older edifice, but few lava flows extended beyond the base of the volcano. The modern edifice consists of basaltic as well as andesitic and dacitic products from summit and flank vents. Eruptions in the 19th century originated from the Goat Rocks area on the N flank, and were witnessed by early settlers.
Information Contacts: T. Casadevall, D. Dzurisin, C. Newhall, and D. Swanson, USGS, Vancouver, WA; C. Boyko, S. Malone, E. Endo, and C. Weaver, University of Washington; R. Tilling, USGS, Reston, VA; UPI.