Report on Atmospheric Effects (1980-1989) — December 1987

Atmospheric Effects (1980-1989)
Scientific Event Alert Network Bulletin, vol. 12, no. 12 (December 1987)
Managing Editor: Lindsay McClelland.
Atmospheric Effects (1980-1989) 1985-87 aerosol data from Hawaii summarized
Please cite this report as:
Global Volcanism Program, 1987. Report on Atmospheric Effects (1980-1989) (McClelland, L., ed.). Scientific Event Alert Network Bulletin, 12:12. Smithsonian Institution.
Atmospheric Effects (1980-1989)
All times are local (unless otherwise noted)
A long-term decline in integrated backscattering measured at Mauna Loa, Hawaii persisted through the end of 1987. Aerosols from the 1982 eruption of El Chichón declined rapidly through the first half of 1985, followed by a sharp increase from a source that remains unknown, then a renewed decline until the arrival of Ruiz aerosols in December 1985. After a slow increase through much of 1986, aerosol concentrations have generally declined again through 1987. At low aerosol concentrations, data are sensitive to normalization effects, which probably accounts for many of the small changes plotted in 1987. However, a minor peak in mid-1987 may reflect the effects of large forest fires in China.
Altitudes of peak backscattering over Fukuoka, Japan were slightly higher in the autumn than during the summer but peak backscattering ratios changed little (figure 51). Values were similar at Garmisch-Partenkirchen, West Germany in November and December.
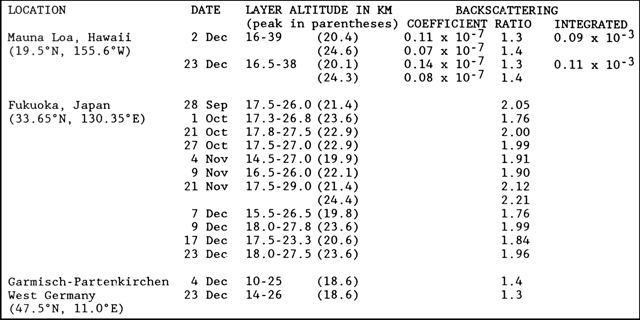 |
Figure 51. Lidar data from various locations, showing altitudes of aerosol layers during October-December 1987. Note that some layers have multiple peaks. Backscattering ratios from Fukouka, Japan, are for the Nd-YAG wavelength of 1.06 µm; all others are for the ruby wavelength of 0.69 µm. Integrated values show total backscatter, expressed in steradians-1, integrated over 300-m intervals from 16-33 km at Mauna Loa and from the tropopause to 30 km at Hampton, Virginia. Altitudes of maximum backscattering ratios and coefficients are shown for each layer at Mauna Loa. |
Information Contacts: Thomas DeFoor, Mauna Loa Observatory, P. O. Box 275, Hilo, HI 96720 USA; Motowo Fujiwara, Physics Department, Kyushu University, Fukuoka 812, Japan; Horst Jäger, Fraunhofer-Institut für Atmosphärische Umweltforschung, Kreuzeckbahnstrasse 19, D-8100 Garmisch-Partenkirchen, West Germany.