Report on Atmospheric Effects (1980-1989) — January 1988

Atmospheric Effects (1980-1989)
Scientific Event Alert Network Bulletin, vol. 13, no. 1 (January 1988)
Managing Editor: Lindsay McClelland.
Atmospheric Effects (1980-1989) High latitude aerosols similar; 1982-87 values shown
Please cite this report as:
Global Volcanism Program, 1988. Report on Atmospheric Effects (1980-1989) (McClelland, L., ed.). Scientific Event Alert Network Bulletin, 13:1. Smithsonian Institution.
Atmospheric Effects (1980-1989)
All times are local (unless otherwise noted)
The following is a report from William Fuller. "NASA Langley Research Center conducted a SAM II, Polar Stratospheric Cloud (PSC), and CHEOPS II (Chemistry of Ozone in the Polar Stratosphere) airborne mission 10-31 January. Stratospheric lidar measurements were conducted from Wallops flight facility (38°N, 76.3°W) to Andoya, Norway (69.3°N, 16°E) by way of Goose Bay, Canada and Iceland. The aerosol measurements showed very little change in the stratospheric profiles during the transit flight from Wallops to Andoya, and during the SAM II mission, as the data indicate (figure 52). The SAM II, CHEOPS II, and PSC missions were conducted from Andoya. A PSC mission was flown to 84°N, 15°W, to a low stratospheric temperature region where there was a high probability of the occurrence of PSCs. The early formation of PSCs was detected, peaking at 23 km with a scattering ratio of 1.22, but was much weaker than the PSC measurements of the 1984 and 1986 Arctic missions."
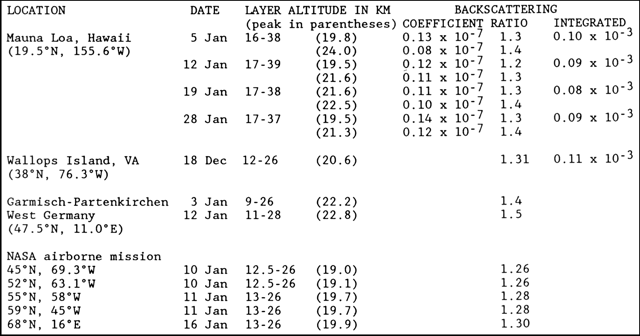 |
Figure 52. Lidar data from various locations, showing altitudes of aerosol layers during December 1987-January 1988. Note that some layers have multiple peaks. Backscattering ratios are for the ruby wavelength of 0.69 µm. Integrated values show total backscatter, expressed in steradians-1, integrated over 300-m intervals from 16-33 km at Mauna Loa. Altitudes of maximum backscattering ratios and coefficients are shown for each layer at Mauna Loa. |
Concentrations of stratospheric aerosols over Hawaii continued to decline slowly, reflecting a long-term trend at other Northern Hemisphere sites (figure 53). Peak backscattering over Germany occurred at a somewhat higher altitude in January than in December.
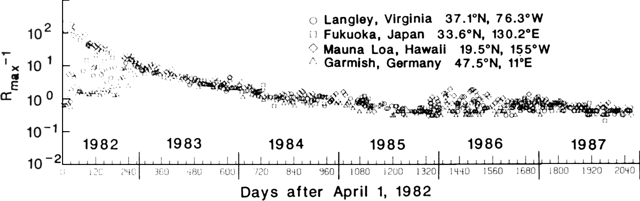 |
Figure 53. Peak aerosol backscatter, normalized to ruby values, from four lidar sites, 1 April 1982 (just after the first major explosion of El Chichón) through 1987. Courtesy of M.P. McCormick and William Fuller. |
Information Contacts: William Fuller, NASA Langley Research Center, Hampton, VA 23665 USA; Thomas DeFoor, Mauna Loa Observatory, P. O. Box 275, Hilo, HI 96720 USA; Horst Jäger, Fraunhofer-Institut für Atmosphärische Umweltforschung, Kreuzeckbahnstrasse 19, D-8100 Garmisch-Partenkirchen, West Germany.