On 6 October RVO raised the Alert Level for Rabaul to Stage 1 (the lowest level on a four-stage scale) due to ongoing deformation and recent increases in seismicity. During the month of September, the seismic network detected a total of 22 high-frequency volcano-tectonic earthquakes, which was more than the 12 recorded in August. The earthquakes were distributed in the Beehives, Vulcan, Greet Harbour, and Namanula areas. Deformation data from a GPS station located at the S part of Matupit Island showed a continuing trend of uplift, with 39 mm/month in August and 35-39 mm/month in September. Diffuse white fumarolic plumes rose from the crater floor and inner walls.
Source: Rabaul Volcano Observatory (RVO)
Details of 29 August 2014 Strombolian eruption; update through 2016
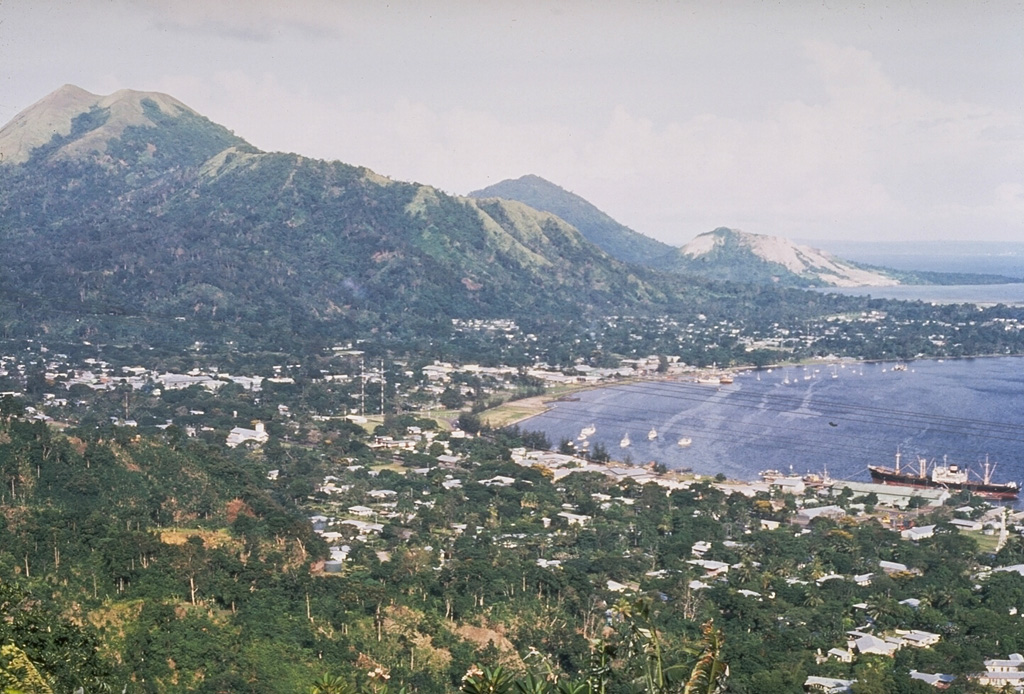
The large eruption of 29 August 2014 at the Tavurvur stratovolcano of Rabaul caldera, on the NE tip of New Britain Island in Papua New Guinea, followed a period of minor ash eruptions earlier in the year (BGVN 39:08). The volcano has been intermittently active since a major eruption in September 1994, which was its first eruption in over 50 years. During the 1994 eruption, a lava flow, tephra ejection, and an ash plume rising to 18 km caused the evacuation of over 50,000 people from the surrounding area, significant damage to nearby Rabaul Town, several deaths, and disrupted air traffic for several days (BGVN 19:08, 19:09). Additional information for the 2014 eruption, and subsequent activity covered in this report, was compiled by the Rabaul Volcano Observatory (RVO) and issued by the Department of Mineral Policy and Geohazards Management of Papua New Guinea (DMPGM). Aviation alerts for Rabaul are issued by the Darwin Volcanic Ash Advisory Center (VAAC). A number of news outlets also covered the eruption with photographs, videos, and interviews of local residents.
A Strombolian eruption at Tavurvur began shortly after 0330 local time on 29 August 2014. This was followed by an ash plume rising to 18 km altitude. Smaller explosions at irregular intervals continued through 0641 on 30 August. After this, plumes of white vapor and slightly bluish gas returned, except for an ash plume reported on 12 September and a small explosion on 18 September. The volcano remained quiet after this and through 2016, although ground deformation data indicated a gradual inflation of about 6 cm over the period.
Activity during August-December 2014. Prior to August 2014, DMPGM reported that ground deformation measurements from the GPS station on Matupit Island (3 km W) had been showing increasing inflation, first detected in March 2014 (figure 67). In the days immediately before the 29 August 2014 eruption, Tavurvur had been emitting a diffuse plume of white vapor. An explosion occurred on 6 August, and an inspection of the summit crater on 8 August revealed an incandescent area covered by debris.
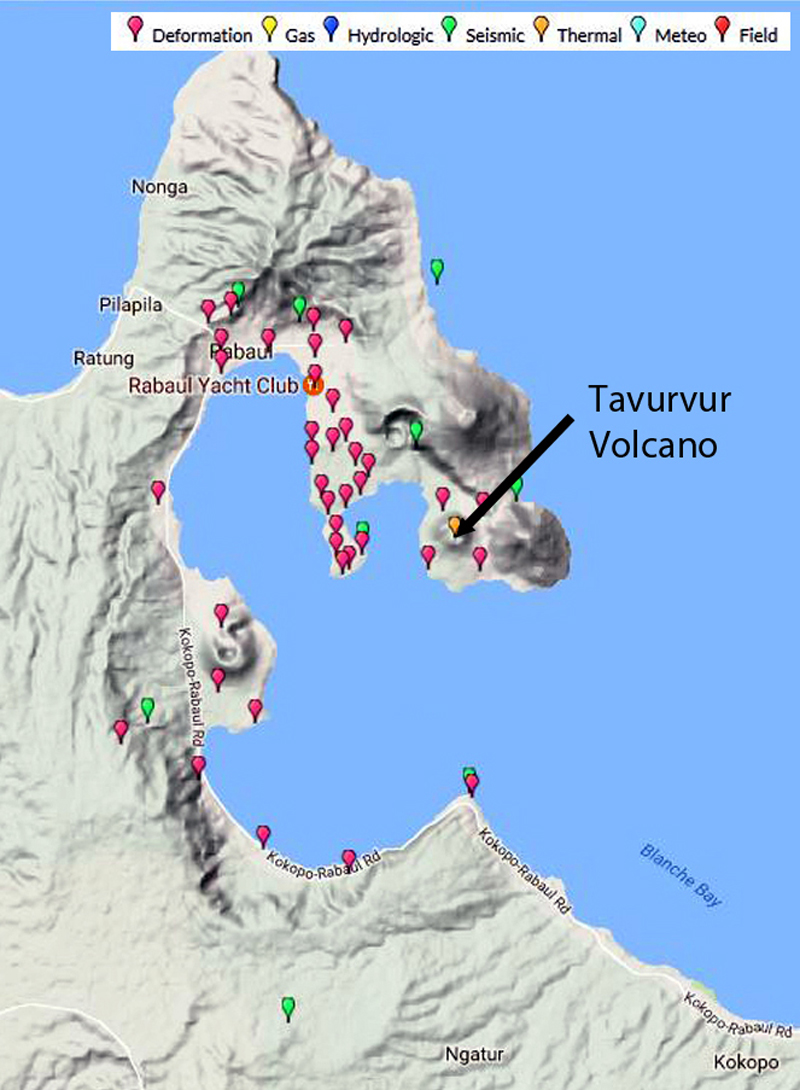 |
Figure 67. Locations of ground deformation (red), seismic (green) and thermal (orange) monitoring stations around Tavurvur volcano at Rabaul Caldera, New Britain Island, Papua New Guinea. Matupit Island is the peninsula immediately W of Tavurvur. Image courtesy WOVOdat. |
The activity on 29 August 2014 started slowly between 0330 and 0400 local time and then developed into a Strombolian eruption accompanied by loud explosions, roaring, and rumbling. The stronger explosions generated shockwaves which rattled windows and doors in the area. At dawn, the eruption plume could be seen blowing W over the Malguna villages, about 8 km NW, at an altitude of 3,000 m (figure 68). Rabaul Town, 7 km NW of Tavurvur, was initially affected by ash, as was Volavolo (20 km W), but a shift in wind direction sent the plume in a more WNW direction by mid-morning. Villages to the E and S were not affected by ash, but ashfall was reported in Keravat, about 25 km SW. High levels of seismic tremor were recorded during the eruption.
 |
Figure 68. Eruption of Mt. Tavurvur, the active stratovolcano of Rabaul caldera, on 29 August 2014. The ash plume rose to 18 km altitude and dispersed ash to the W and NW of the volcano. Courtesy of OLIVER BLUETT/AFP/Getty Images, printed in The Washington Post. |
DMPGM reported that the Strombolian eruption had begun to subside around 0645, and by 0700 only a diffuse white plume was being emitted and seismicity had decreased. Another report at 1600 noted that strong explosions continued throughout the day at irregular intervals, producing ash plumes that rose rapidly to 1,000 m above the summit before drifting NW. The explosions also ejected lava fragments of various sizes in all directions 500 to 1,000 m from the summit crater (figure 69). Shock waves accompanied the loud explosions and rattled buildings within several kilometers of the volcano. Intermittent explosions at increasing intervals continued into the following night generating incandescent lava fragments around the summit. Seismicity was dominated by discrete events that were associated with the explosions. The strong explosions ceased at 0641 on 30 August, and no incandescence was observed after that. By the morning of 31 August, seismicity had decreased from 80 events/hour to 15/hour. According to DMPGM, the eruption deposited a significant amount of ash and scoria on the hillsides of Rabaul Town and Malaguna Villages to the NW.
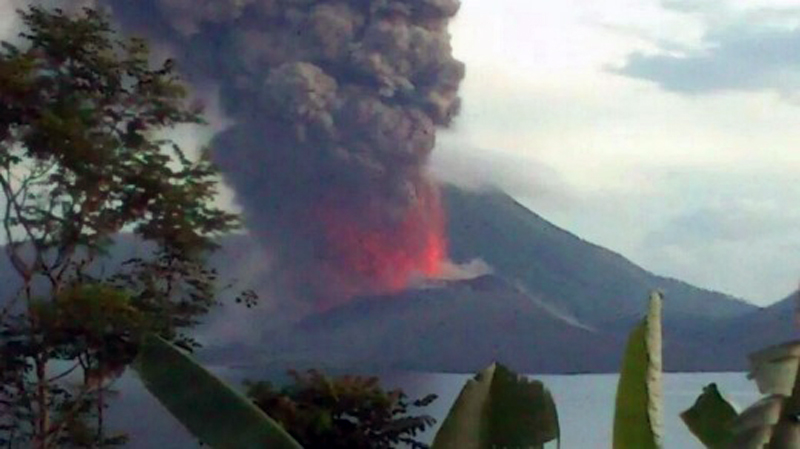 |
Figure 69. Incandescent lava exploding from Tavurvur (Rabaul Caldera) on 29 August 2014. Courtesy of Emma Edwards, reported at Traveller.com. |
The initial ash plume from the eruption was first observed in satellite imagery by the Darwin VAAC around 0900 local time on 29 August, and rose to over 18 km altitude. The upper part of the plume was originally drifting SW, then changed to NW, and the lower part at 4.3 km altitude was moving NW. By late morning, the plume was moving in three directions at different altitudes; NW at 4.3 km, S at 16.7 km, and W at 18.3 km. The high-level ash from the original eruption had dissipated by the evening on 30 August, but low-level plumes to 2.1 km were still reported.
A substantial SO2 plume was recorded by the OMI Instrument on the Aura Satellite on 29 August, and was still measurable a day later (figure 70) drifting S. The MODVOLC thermal anomaly system recorded anomalous pixels at Rabaul captured by MODIS satellite data between 29 August and 1 September 2014.
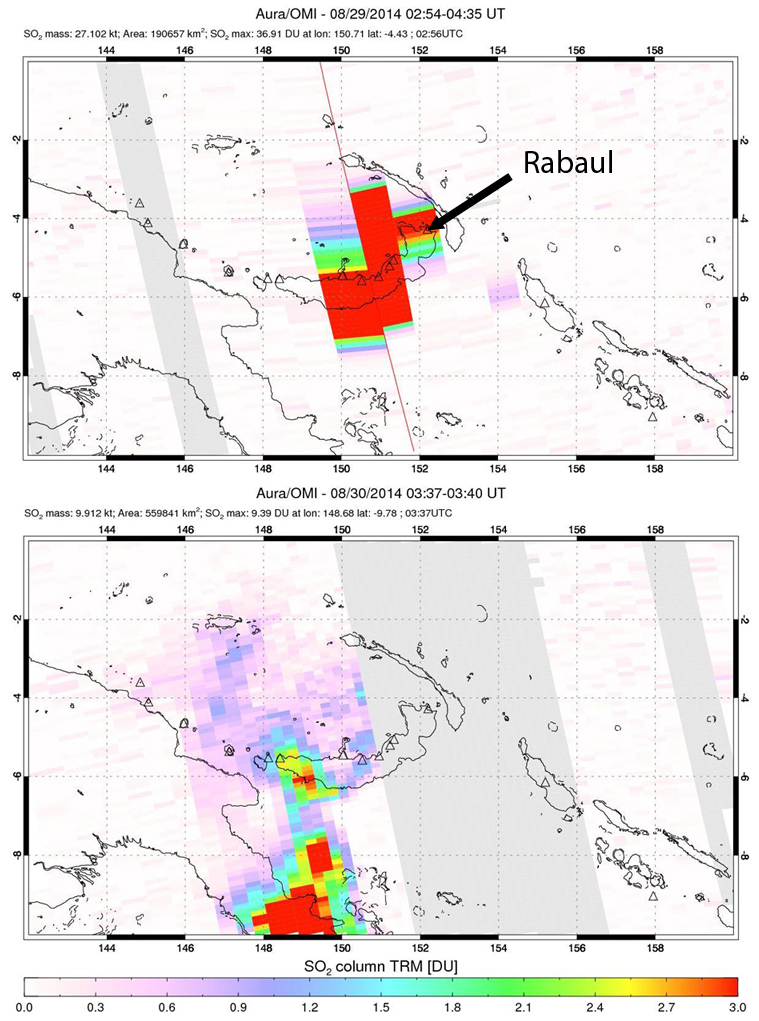 |
Figure 70. SO2 plumes captured by the OMI instrument on the AURA satellite from Rabaul on 29 and 30 August 2014. Rabaul is the triangle at the top right corner of the crescent shaped island of New Britain at the center of the image. Courtesy of NASA/GSFC. |
From 1 to 17 September emissions consisted of variable amounts of diffuse to dense white vapor and small traces of diffuse blue vapor. Southeast winds were recirculating significant amounts of fine ash back into the atmosphere. A plume was reported by the Darwin VAAC on 12 September at 3 km altitude, drifting NW. Seismicity had decreased to very low levels with only 10-30 events recorded per day during the first half of September. A single small explosion occurred at 1242 on 18 September according to DMPGM that produced a small, light-gray ash plume that rose a few hundred meters above the summit crater before dissipating to the NW.
A site inspection of Tavurvur crater was conducted by DMPGM on 23 September 2014, and they observed significant changes in the crater since the 29 August eruption. The crater floor was filled with blocky lavas, and thus much shallower than when last observed prior to the eruption. Three or four areas of active emissions were present within the crater, and the rim was covered with large blocks of lava. By the end of September, seismicity had dropped to less than 10 low-frequency earthquakes per week. In mid-October DMPGM observed that the ground deformation data from the Matupit GPS station indicated that there had been an inflation of about 4 cm since the benchmark reached on 29 August during the eruption. Ground deformation was stable during November. During a field inspection of the summit crater on 9 December 2014, scientists measured a temperature of 310°C at a hot spot on the upper flank. Numerous patches of diffuse white vapor emissions were present at different places on the inner walls of the crater, and the crater floor seemed to have subsided slightly since the prior visit.
Activity during 2015 and 2016. A report by DMPGM from March 2015 noted that Tavurvur remained quiet with the summit crater releasing various amounts of diffuse white vapor, which was slightly denser during periods of rain. There was no observed incandescence or noise, and seismicity was low, with only a small number of both high-frequency and volcano-tectonic earthquakes recorded on 10 and 13 February. Ground deformation data indicated a general inflationary trend since September 2014 of about 5 cm. Monthly reports issued by DMPGM in March and April indicated little activity at Tavurvur, and stability of the ground deformation data. On 17 May 2015 a strong, earthquake of M 5.1 originating NE of Rabaul Caldera 1-2 km offshore from Korere and Nodup (about 9 km NW of Tavurvur) generated a swarm of aftershocks in the same area. They occurred at a depth of about 9 km and caused several small landslides in various places on the N flank of Kombiu, another stratovolcano at Rabaul about 2.5 km NE of Tavurvur.
Tavurvur remained quiet from September through November with occasional diffuse white vapor plumes rising from the summit caldera, and no volcanic earthquakes reported. While a long-term inflationary trend continued through November, shorter term fluctuations up and down of a few centimeters in the ground deformation data were also observed. The trend of vertical uplift between January 2015 and December 2016 showed an increase of approximately 6 cm during the period (figure 71).
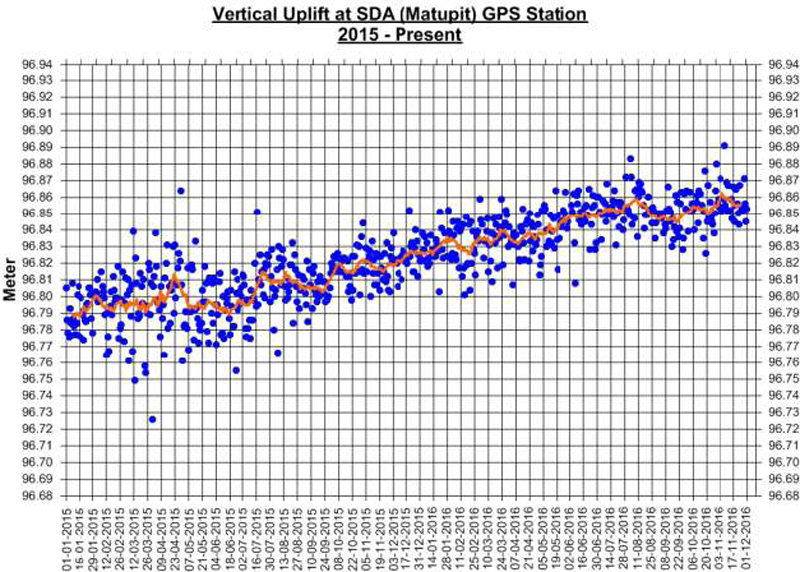 |
Figure 71. Vertical uplift at the Matupit GPS station for Rabaul between 1 January 2015 and 1 December 2016. The trend shows a gradual inflation of about 6-7 cm. Courtesy of DMPGM (Volcano Information Bulletin No. 12-122016, 4 December 2016). |
Information Contacts: Department of Mineral Policy and Geohazards Management (DMPGM), Volcano Observatory, Geohazards Management Division, PO Box 3386, KOKOPO, East New Britain Province, Papua New Guinea; Darwin Volcanic Ash Advisory Centre (VAAC), Bureau of Meteorology, Northern Territory Regional Office, PO Box 40050, Casuarina, NT 0811, Australia (URL: http://www.bom.gov.au/info/vaac/); Hawai'i Institute of Geophysics and Planetology (HIGP), MODVOLC Thermal Alerts System, School of Ocean and Earth Science and Technology (SOEST), Univ. of Hawai'i, 2525 Correa Road, Honolulu, HI 96822, USA (URL: http://modis.higp.hawaii.edu/, http://modis.higp.hawaii.edu/cgi-bin/modisnew.cgi); NASA Goddard Space Flight Center (NASA/GSFC), Global Sulfur Dioxide Monitoring Page, Atmospheric Chemistry and Dynamics Laboratory, Goddard, Maryland, USA (URL: https://so2.gsfc.nasa.gov/); World Organization of Volcano Observatories (WOVOdat), hosted by Earth Observatory of Singapore, Nanyang Technological University, 50 Nanyang Avenue, Singapore 639798 www.wovodat.org; The Washington Post, http://www.washingtonpost.com/news/morning-mix/wp/2014/08/29/photos-in-papua-new-guinea-mount-tavurvur-explodes-in-spectacular-style/); Traveller.com, http://www.traveller.com.au/qantas-reroutes-flights-as-pngs-rabaul-volcano-erupts-109utz .
2021: October
2014: January
| February
| March
| August
| September
2013: January
| February
| March
| April
| May
| June
| July
| August
| September
| November
| December
2012: May
| November
2011: March
| June
| July
| August
2010: January
| April
| July
2009: January
| February
| March
| April
| May
| June
| July
| August
| September
| October
| November
| December
2008: January
| February
| March
| April
| May
| June
| July
| August
| September
| October
| November
| December
2007: January
| February
| March
| April
| May
| June
| July
| August
| September
| October
| December
2006: January
| February
| August
| October
| November
| December
2005: January
| February
| March
| June
| July
| August
| September
| October
| November
2004: March
2003: January
| March
| June
| August
2002: February
| October
| November
| December
2001: August
| September
| October
On 6 October RVO raised the Alert Level for Rabaul to Stage 1 (the lowest level on a four-stage scale) due to ongoing deformation and recent increases in seismicity. During the month of September, the seismic network detected a total of 22 high-frequency volcano-tectonic earthquakes, which was more than the 12 recorded in August. The earthquakes were distributed in the Beehives, Vulcan, Greet Harbour, and Namanula areas. Deformation data from a GPS station located at the S part of Matupit Island showed a continuing trend of uplift, with 39 mm/month in August and 35-39 mm/month in September. Diffuse white fumarolic plumes rose from the crater floor and inner walls.
Source: Rabaul Volcano Observatory (RVO)
RVO reported that Rabaul caldera's Tavurvur cone was mostly quiet during 13-19 September. Variable amounts of white vapor and small amounts of diffuse blue vapor rose from the summit crater. A small explosion at 1242 on 18 September produced a light gray ash plume that rose a few hundred meters above the crater and drifted NW.
Source: Rabaul Volcano Observatory (RVO)
During 31 August-5 September, Rabaul caldera’s Tavurvur cone remained quiet and no nighttime incandescence was observed. Variable amounts of white vapor were visible rising from the summit as well as traces of blue vapor. A few short-duration rumbling noises were heard during 30-31 August, and seismicity remained very high and dominated by small, low-frequency earthquakes. However, earthquakes decreased from 80 events per hour to 15 events per hour at 0300 on 31 August. Less than 10 earthquakes were detected during 1-2 September; a slight increase in low-frequency earthquakes was detected during 4-5 September.
Source: Rabaul Volcano Observatory (RVO)
On 29 August the Darwin VAAC changed the Aviation Color Code to Red after ash plumes from Rabaul caldera's Tavurvur cone rose to 18.3 km (60,000 ft) a.s.l. On 30 August the ash plume rose to 2.1 km (7,000 ft) a.s.l., and the Aviation Color Code was lowered to Orange. On 29 August ABC News reported evacuations of communities near the volcano.
Sources: Darwin Volcanic Ash Advisory Centre (VAAC); ABC News - American Broadcasting Corporation
RVO reported that explosions from Rabaul caldera's Tavurvur cone were detected during 1-11 March, notably during 1 and 6-11 March, and generated ash plumes that rose 1 km and drifted E and SE. Mild ash emissions on other days during 1-15 March also drifted E and SE. Gases from Tavurvur caused browning vegetation on Turangunan (South Daughter) since early January.
Source: Rabaul Volcano Observatory (RVO)
RVO reported that Rabaul caldera's Tavurvur cone was quiet during 26 January-11 February. A pale gray/brown plume rose 50-100 m above the vent and dispersed on 12 February.
Source: Darwin Volcanic Ash Advisory Centre (VAAC)
RVO reported that Rabaul caldera's Tavurvur cone was quiet during 16-31 December. White and occasionally blue vapor plumes rose from the crater. An explosion at 0732 on 22 December generated an ash-poor plume. Weak fluctuating glow was visible at night on 31 December.
Source: Rabaul Volcano Observatory (RVO)
RVO reported that Rabaul caldera's Tavurvur cone was quiet during 1-15 December. White and occasionally blue vapor plumes rose from the crater, An explosion at 1850 on 15 December generated an ash-poor plume.
Source: Rabaul Volcano Observatory (RVO)
RVO reported that Rabaul caldera's Tavurvur cone was generally quiet during 16-30 November. A few explosions during 15-18 November generated ash plumes that rose to low altitudes (no more than 1 km) and drifted E, SE, and NW. Small amounts of fine-grained ash fell around Rabaul town (3-5 km NW). White-to-light-gray emissions rose from the crater the remainder of the month.
Source: Rabaul Volcano Observatory (RVO)
RVO reported that Rabaul caldera's Tavurvur cone was quiet during 1-12 November. At 0516 on 13 November a moderate explosion generated a dense billowing ash cloud that rose 1 km above the crater and drifted NW. A few more explosions continued after that, at irregular intervals; notably on 14 November at 0738, 0851, 1308, 2044, and on 15 November at 1903. Ash plumes from these events also drifted NW. During 1-15 November seismicity was very low, except for events associated with the explosions. Deformation measurements showed slight inflation of the central part of the caldera; the long-term inflationary trend continued.
Source: Rabaul Volcano Observatory (RVO)
RVO reported that during 1-31 August low-level activity at Rabaul caldera's Tavurvur cone consisted of pale gray plumes with variable but mostly minor ash content. Intervals between emissions ranged from tens of seconds to hours. Ash plumes rose as high as 1 km and drifted NW, causing ashfall mainly in a narrow band between the E part of old Rabaul town (3-5 km NW) and Namanula Hill, and further downwind towards Nonga area. Malaguna No. 1 and other parts of Rabaul town were also affected. Most noises were associated with forceful emissions and were short in duration. Seismicity was high and dominated by ash-emission events.
Ash plume characteristics were similar during 1-5 September, although the interval time between emissions ranged from tens of seconds to tens of minutes. Plumes rose 50 m and were immediately blown NW by strong winds which re-suspended older ash deposits in widespread areas including Rabaul town. Residents of Rabaul town reported a chlorine odor; RVO noted that the odor, although uncommon, did not represent an increase in activity.
Source: Rabaul Volcano Observatory (RVO)
Based on observations of satellite imagery and wind data analyses, the Darwin VAAC reported that on 29 August ash plumes from Rabaul caldera's Tavurvur cone rose to an altitude of 2.1 km (7,000 ft) a.s.l. and drifted almost 40 km NW.
Source: Darwin Volcanic Ash Advisory Centre (VAAC)
Based on observations of satellite imagery and wind data analyses, the Darwin VAAC reported that on 25 August ash plumes from Rabaul caldera's Tavurvur cone rose to an altitude of 1.8 km (6,000 ft) a.s.l. and drifted almost 150 km NW.
Source: Darwin Volcanic Ash Advisory Centre (VAAC)
RVO reported that during 22-31 July low-level activity consisted of discrete emissions of pale gray ash plumes occurring at short intervals. Some emissions were explosive and generated plumes that rose 2 km above the crater. Plumes drifted E, NE, N, NW, W, and SW, and deposited minor amounts of fine white and gray ash in areas downwind mainly between Namanula and Malaguna No. 1 (with Rabaul Town, 3-5 km NW, in between), and to a lesser extent between the Vulcan area and Malaguna No. 2. Roaring and rumbling noises also continued, often in conjunction with explosions.
Source: Rabaul Volcano Observatory (RVO)
RVO reported that during 15-21 July low-level activity consisted of discrete emissions of pale gray ash plumes occurring at short intervals. Some emissions were explosive and generated plumes that rose 2 km above the crater. Plumes drifted E, NE, N, NW, W, and SW, and deposited minor amounts of ash in areas downwind mainly between Nodup and Rapolo (with Rabaul Town, 3-5 km NW, in between), and to a lesser extent in the Vulcan area. Roaring and rumbling noises also continued, often in conjunction with explosions.
Source: Rabaul Volcano Observatory (RVO)
RVO reported that during 16 June-14 July white-to-light-gray plumes sometimes containing fine ash rose at most 2 km from Rabaul caldera's Tavurvur cone and drifted NW and SE. Roaring and rumbling noises also continued, and seismicity was low. Ashfall was reported in areas downwind including Rabaul town (3-5 km NW) during 16-30 June. The lava dome on the crater floor of Tavurvur continued to glow; on 26 June and 4 July observers near the dome noted brief incandescence at the vent associated with strong and rapid venting. Explosions during 10-14 July generated dense gray ash clouds that drifted NW, causing ashfall between Namanula Hill (3 km W) and Malaguna No.1 (NW), and Pilapila and Tavui Point.
Source: Rabaul Volcano Observatory (RVO)
RVO reported that during 1-15 June white vapor plumes sometimes containing fine ash rose at most 800 m from Rabaul caldera's Tavurvur cone and drifted NW and SE. Ashfall was reported in areas downwind including Rabaul town (3-5 km NW). Roaring and rumbling noises also continued, and seismicity was low. Photographers observed a 1-m-high lava dome on the crater floor on 12 June.
Source: Rabaul Volcano Observatory (RVO)
RVO reported that during 17-31 May white vapor plumes sometimes containing fine ash rose at most 800 m from Rabaul caldera's Tavurvur cone and drifted NW and SE. Ashfall was reported in areas downwind including Rabaul town (3-5 km NW). Roaring and rumbling noises also continued. Seismicity was low, and slight inflation was detected at a station on Matupit Island (2 km W).
Source: Rabaul Volcano Observatory (RVO)
RVO reported that during 29 April-16 May white vapor plumes sometimes containing fine ash rose at most 200 m from Rabaul caldera's Tavurvur cone and drifted NW. Ashfall was reported in areas downwind including Rabaul town (3-5 km NW). Roaring and rumbling noises also continued. Seismicity was low.
Source: Rabaul Volcano Observatory (RVO)
RVO reported that during 24-28 April white vapor plumes sometimes containing ash rose at most 200 m from Rabaul caldera's Tavurvur cone and drifted SE. Roaring and rumbling noises also continued but the intensity was low.
Source: Rabaul Volcano Observatory (RVO)
RVO reported that during 15-23 April white vapor plumes containing some ash rose at most 100 m from Rabaul caldera's Tavurvur cone and drifted SE. Roaring and rumbling noises were less intense than during previous weeks. Based on analyses of satellite imagery, the Darwin VAAC reported that on 18 April an ash plume rose to an altitude of 4.6 km (15,000 ft) a.s.l. and drifted more than 35 km E. Satellite images later that day showed that the plume had dispersed.
Sources: Rabaul Volcano Observatory (RVO); Darwin Volcanic Ash Advisory Centre (VAAC)
RVO reported that roaring and rumbling noises from Rabaul were heard during 1-14 April, especially at night. White vapor plumes with ash rose at most 100 m above the main crater and drifted NW, causing ashfall in Rabaul town (3-5 km NW).
Source: Rabaul Volcano Observatory (RVO)
RVO reported that ash emissions increased at Rabaul on 3 March and were mainly brownish. Emissions again increased the next day, occurring almost every minute. Billowing brown ash clouds slowly rose from the crater then quickly dispersed to the SE. The emissions decreased to about every hour on 7 March.
Seismicity was very high during 4-6 March and then declined in the evening of 7 March. Three regional earthquakes felt during this period ranged in magnitude from 5.1-5.5, and occurred SSE from Rabaul offshore outside the Wide Bay area at depths ranging between 50 and 60 km. They were felt in Rabaul town with intensities of III-IV. Emissions were absent during 8-11 March.
Activity resumed on 12 March at 1108. An explosion ejected tephra and a gray-to-black billowing ash plume rose 300 m and drifted SE. The forcefulness and color lessened over at least the next 40 minutes; ash plumes rose 100 m, but were carried to 1 km with the wind. Seismicity remained low.
Source: Rabaul Volcano Observatory (RVO)
RVO reported that during 4-5 February pale gray ash plumes rose from Rabaul caldera's Tavurvur cone. On 5 February the ash plumes slowly rose 2 km a.s.l. and drifted E and ENE. On 6 February only white plumes rose from the crater during most of the day. In the evening a gray billowing ash cloud was followed by a sequence of "gentle puffs" of white to light gray ash emissions at irregular intervals into the night and through the morning of 7 February. Fine ashfall was reported in Rabaul town (3-5 km NW) in the late evening of 6 February.
Source: Rabaul Volcano Observatory (RVO)
According to a news report from 31 January, Tokua airport (20 km SE) reopened after being closed due to ash from Rabaul.
RVO reported that during 1-3 February Rabaul was mostly quiet, although occasional explosions produced light gray ash plumes that rose as high as 500 m above sea level and drifted E and ESE. At 1151 on 3 February an explosion produced a dense, dark ash plume that slowly rose 2 km above sea level and drifted ENE. Ash was observed falling on South Daughter (Turangunan, ~2 km to the E) and to the N of it. Dark gray ash emissions continued for the next 15-20 minutes. During the afternoon of 3 February through the morning of 4 February light gray ash emissions rose at irregular intervals and drifted E and ESE. White vapor plumes rose from the crater in between the ash emissions.
Sources: Rabaul Volcano Observatory (RVO); Radio Australia
RVO reported that during 23-24 January variable emissions at Rabaul mostly consisted of white vapor plumes, although following explosions gray plumes rose 600 m above the crater. Some roaring and rumbling noises were noted. Five explosions were detected between 0656 and 0859 on 24 January; these explosions produced light gray ash plumes that rose as high as 1 km above sea level. After the explosion at 0656 white plumes also rose from the crater. All plumes drifted E and ESE. Several explosions were detected between 1630 on 24 January and 0232 on 25 January, although seismicity remained at a low level. White vapor plumes and occasional light gray ash plumes rose from the crater and drifted E and SE.
About five explosions occurred between 1947 on 26 January and 0414 on 27 January, producing plumes that drifted ESE. An explosion at 1000 on 27 January produced a dense, billowing, light gray ash plume that rose a few hundred meters above sea level and drifted ESE. Ash emissions continued until 1500, followed by white vapor emissions. Six explosions were detected overnight, possibly generating ash plumes that drifted E and ESE.
During the morning of 28 January white vapor plumes rose from the crater. At 1003 an explosion produced a dense, billowing, gray ash plume; ash emissions continued from the next hour and then turned to white vapor. Two explosions occurred at 1323 and 1816, generating ash plumes and sub-continuous emissions for one hour and 15-20 minutes, respectively. Plumes again drifted E and ESE. White plumes rose from the crater afterwards through 29 January, but an explosion at 1723 generated a dense, billowing ash plume followed by a short period of sub-continuous emissions.
Source: Rabaul Volcano Observatory (RVO)
RVO reported that roaring and rumbling noises from Rabaul caldera's Tavurvur cone began at 2128 on 19 January and lasted for about 15 minutes. Darkness prevented visual observations but the next day ash emissions were evident. On 20 January small discrete explosions generated ash clouds that rose up to 500 m above the crater and drifted E and SE. A few days before the eruption an observer noticed that vegetation on the N flanks of South Daughter (Turangunan, ~2 km to the E) had browned, and on 18 January a climber reported a strong sulfur dioxide odor.
A loud explosion at 2325 on 20 January was followed by a few minutes of continuous roaring and rumbling. During 20-22 January light gray ash emissions occurred at irregular intervals; the color of the plumes suggested mostly water vapor with low ash content. Plumes rose 200 m and drifted ESE on 20 January, and SW, S, and SSE on 21 January. Activity increased during 21-22 January with more frequent ash emissions occurring for extended periods. According to a news article, flights to Tokua airport were cancelled on 21 January.
Emissions subsided in the afternoon of 22 January but small-to-moderate explosions continued. A large explosion at 2147 ejected incandescent fragments, and produced an ash plume that rose 2 km and drifted SE and ESE. Explosions were heard through the night. Ash plumes that rose from the crater on 23 January drifted SE.
Sources: adelaidenow; Rabaul Volcano Observatory (RVO)
RVO reported that during 16-19 November diffuse white plumes from Rabaul caldera's Tavurvur cone rose 300 m above the crater; plume volume increased during times of high humidity. Seismicity continued at very low level. Measurements two weeks prior showed continuing low levels of gas emissions.
Source: Rabaul Volcano Observatory (RVO)
RVO reported that observations of Rabaul caldera's Tavurvur cone during 1-31 May revealed some periods of white emissions. Seismic activity was very low; however, several high-frequency volcano-tectonic earthquakes were recorded.
Source: Rabaul Volcano Observatory (RVO)
RVO reported that white vapor plumes rose from Rabaul caldera's Tavurvur cone during 15-19 August. No volcano-related seismicity was recorded. The rate of uplift from GPS measurements on Matupit Island had increased from the end of July.
Source: Rabaul Volcano Observatory (RVO)
RVO reported a decline in frequency of ash emission from Rabaul caldera's Tavurvur cone during 9-12 August, and no distinct explosions were detected. Ash-rich plumes rose 1 km above the crater and drifted NW, causing ashfall in Rabaul town (3-5 km NW) and in areas between Toliap (10 km NW) and Tavui. Seismicity was very low, consisting of sub-continuous volcanic tremor associated with the ash emissions and some small discrete low-frequency earthquakes. Ash emissions ceased on 12 August. During 13-15 August white vapor plumes rose from the crater.
Source: Rabaul Volcano Observatory (RVO)
RVO reported that white vapor plumes rose from Rabaul caldera's Tavurvur cone during 1-3 August. An explosion on 3 August produced a gray ash plume that rose 1 km above the crater and drifted NNW. Sustained emissions of pale-gray ash continued for about an hour afterwards. In addition, ash deposited at the former airport was re-suspended and blown NW into the E part of Rabaul town (3-5 km NW) and towards Namanula hill (3 km W). Seismicity was very low, although two periods of harmonic tremor on 2 August and the explosion and ash emissions on 3 August were detected.
During 4-5 August gray ash emissions periodically continued, punctuated by a few large and notable explosions. Ash plumes from the explosions rose 1 km above the crater and drifted N and NW producing fine ashfall in the E part of Rabaul town, Namanula Hill, and further downwind towards Tavui Point. Moderate seismicity consisting of low-frequency earthquakes, explosions, and volcanic tremors with variable durations was detected. During 5-9 August activity increased, characterized by an increased frequency and duration of ash emissions and more explosions. About 34 explosions were recorded between 5 and 8 August. Ash-rich clouds that rose 1.5 km above the crater drifted NW causing ashfall in most parts of Rabaul town and in areas between Toliap and Nonga (10 km NW). GPS measurements on Matupit Island continued to show long-term inflation; about 10-11 cm of uplift had been recorded since August 2010.
Source: Rabaul Volcano Observatory (RVO)
RVO reported that white vapor occasionally tinted blue rose from Rabaul caldera's Tavurvur cone during 1-28 July. Dull incandescence emanated from a small caved-in vent on the floor of the crater. The start of an ash eruption on 29 July was marked by an emergent low-frequency tremor and slowly rising gray ash plumes. One explosion on 30 July possibly produced light ashfall to the NW. Seismic data indicated forceful degassing on 1 August.
Source: Rabaul Volcano Observatory (RVO)
RVO reported that variable amounts of white vapor plumes rose from Rabaul caldera's Tavurvur cone during 1-31 May and were occasionally tinted brown. During 19-21 May thick white plumes rose 2-3 km above the crater.
Source: Rabaul Volcano Observatory (RVO)
Based on analyses of satellite imagery, the Darwin VAAC reported that on 29 March an ash plume from Rabaul caldera's Tavurvur cone rose to an altitude of 3 km (10,000 ft) a.s.l. and drifted more than 53 km NW.
Source: Darwin Volcanic Ash Advisory Centre (VAAC)
RVO reported that GPS data measurements showed deflation of Rabaul caldera's Tavurvur cone after the eruption that took place during 23-25 July. Seismicity was very low, and diffuse white plumes were emitted during 26-30 July.
Source: Rabaul Volcano Observatory (RVO)
RVO reported an eruption from Rabaul caldera's Tavurvur cone on 23 July, after increased seismicity likely beneath Tavurvur cone was detected the previous day. The eruption was preceded by a few small hybrid earthquakes at 1034 followed by small low-frequency earthquakes and later continuous volcanic tremor. Diffuse white plumes were initially emitted at 1320, and then pink-gray fumes with low ash content were seen. A strong odor of hydrogen sulfide was noted, and a diffuse cloud rose 1 km and drifted NW. Billowing gray clouds a few hours later (at 1600) indicated a higher ash content and increased activity. They were also accompanied by roaring and rumbling noises. Discrete explosions commenced at 1730. Ashfall was reported in areas to the NW and NNW.
During 23-25 July seismicity was variable. Ash emissions and ashfall in areas to the NW continued. Visibility was poor in Rabaul town (3-5 km NW) due to re-suspended ash from moving vehicles. Ash emissions stopped at about 1430 on 25 July. Later that day and into 26 July only diffuse brown-tinted vapor plumes were emitted and seismicity was very low.
Source: Rabaul Volcano Observatory (RVO)
RVO reported on 9 April that deformation measurements at Rabaul caldera during the previous 3-4 months showed an inflationary trend with a total of 4 cm of uplift. During 2-8 April seismicity was low and variable amounts of white vapor rose from Tavurvur cone.
Source: Rabaul Volcano Observatory (RVO)
Based on a Port Moresby Met Office notice, the Darwin VAAC reported that on 18 January an ash plume from Rabaul caldera's Tavurvur cone rose 2.4 km (8,000 ft) a.s.l.
Source: Darwin Volcanic Ash Advisory Centre (VAAC)
RVO reported that activity from Rabaul caldera's Tavurvur cone was at a low level during 1-10 January. No emissions from the crater were observed on most days, but white steam plumes accompanied by blue plumes were occasionally seen. On 8 January, ash emissions rose less than 200 m above the cone.
Source: Rabaul Volcano Observatory (RVO)
RVO reported that activity from Rabaul caldera's Tavurvur cone was at a low level during 21-31 December; no emission from the crater was observed on most days. White steam plumes accompanied by blue plumes were occasionally emitted. On 23 December, ash emissions rose less than 200 m above the cone. Based on analyses of satellite imagery, the Darwin VAAC reported that on 31 December an ash plume rose to an altitude of 2.4 km (8,000 ft) a.s.l. and drifted less than 30 km SE.
Sources: Rabaul Volcano Observatory (RVO); Darwin Volcanic Ash Advisory Centre (VAAC)
RVO reported that activity from Rabaul caldera's Tavurvur cone consisted of a few strong explosions towards the beginning of the 4-10 December reporting period, and emissions of gray ash afterwards. Diffuse white vapor was emitted during quieter intervals. Ash plumes rose 1 km above the summit and drifted SE towards Tokua and the Tokua airport, causing suspension of some flights. Based on analyses of satellite imagery, the Darwin VAAC reported that on 14 December an ash plume rose to an altitude of 2.1 km (7,000 ft) a.s.l. and drifted 35 km SE.
Sources: Rabaul Volcano Observatory (RVO); Darwin Volcanic Ash Advisory Centre (VAAC)
RVO reported that during 27 November-3 December dense white plumes and gray ash plumes rose from Rabaul caldera's Tavurvur cone. Strong explosions produced ash plumes that rose 1.5 km above the summit and showered the flanks with lava fragments that were incandescent at night. Shock waves rattled windows in the Kokopo area, about 20 km SE. Incandescence from the summit crater was occasionally noted. During 2-4 December, ash fell in Rabaul town (3-5 km NW) and other villages downwind. Based on analyses of satellite imagery, the Darwin VAAC reported that during 5 and 7-8 December ash plumes rose to an altitude of 2.4 km (8,000 ft) a.s.l. and drifted 45-55 km E.
Sources: Rabaul Volcano Observatory (RVO); Darwin Volcanic Ash Advisory Centre (VAAC)
RVO reported that during 20-26 November thick white plumes and gray ash plumes rose from Rabaul caldera's Tavurvur cone. Strong explosions produced ash plumes that rose 1.5 km above the summit and showered the flanks with lava fragments that were incandescent at night. Shock waves rattled windows in the Kokopo area, about 20 km SE. Occasionally, incandescence from the summit crater was noted.
Source: Rabaul Volcano Observatory (RVO)
Based on analyses of satellite imagery, the Darwin VAAC reported that on 19 November ash plumes from Rabaul caldera's Tavurvur cone rose to an altitude of 2.1 km (7,000 ft) a.s.l. and drifted 35-90 km NW.
Source: Darwin Volcanic Ash Advisory Centre (VAAC)
Based on analyses of satellite imagery, the Darwin VAAC reported that during 11-14 November ash plumes from Rabaul caldera's Tavurvur cone rose to an altitude of 2.4 km (8,000 ft) a.s.l. and drifted 75-150 km NW and W.
Source: Darwin Volcanic Ash Advisory Centre (VAAC)
Based on analyses of satellite imagery, the Darwin VAAC reported that on 9 November an ash plume from Rabaul caldera's Tavurvur cone rose to an altitude of 1.8 km (6,000 ft) a.s.l. and drifted 110 km NW.
Source: Darwin Volcanic Ash Advisory Centre (VAAC)
Based on analyses of satellite imagery, the Darwin VAAC reported that during 28-29 October ash plumes from Rabaul caldera's Tavurvur cone rose to an altitude of 2.4 km (8,000 ft) a.s.l. and drifted 35-45 km N, E, and SE.
Source: Darwin Volcanic Ash Advisory Centre (VAAC)
RVO reported that during 16-22 October diffuse white plumes and gray ash plumes rose from Rabaul caldera's Tavurvur cone; ash plumes rose 700 m above the crater. Ashfall was reported in areas to the NW.
Source: Rabaul Volcano Observatory (RVO)
Based on analyses of satellite imagery, the Darwin VAAC reported that on 15, 18, and 20 October ash plumes from Rabaul caldera's Tavurvur cone rose to altitudes of 2.7-3 km (9,000-10,000 ft) a.s.l. and drifted 25-85 km NW, W, and NE.
Source: Darwin Volcanic Ash Advisory Centre (VAAC)
RVO reported that during 2-8 October gray ash plumes from Rabaul caldera's Tavurvur cone rose 2 km above the crater. Ashfall was reported in Rabaul town (3-5 km NW) and surrounding areas. Incandescence from the summit crater was occasionally visible. Based on analyses of satellite imagery, the Darwin VAAC reported that on 9 October an ash plume rose to an altitude of 2.4 km (8,000 ft) a.s.l. and drifted 75 km NW.
Sources: Rabaul Volcano Observatory (RVO); Darwin Volcanic Ash Advisory Centre (VAAC)
RVO reported that during 25 September-1 October gray ash plumes from Rabaul caldera's Tavurvur cone rose 2 km above the crater. Ashfall was reported in Rabaul town (3-5 km NW) and surrounding areas. Occasionally, incandescence from the summit crater was seen at night and incandescent lava fragments were ejected from the crater. Based on analyses of satellite imagery, the Darwin VAAC reported that on 6 October an ash plume rose to an altitude of 3 km (10,000 ft) a.s.l. and drifted 55 km NW.
Sources: Rabaul Volcano Observatory (RVO); Darwin Volcanic Ash Advisory Centre (VAAC)
RVO reported that during 18-24 September gray ash plumes from Rabaul caldera's Tavurvur cone rose 1.5 km above the crater. Ashfall was reported in Rabaul town (3-5 km NW) and surrounding areas. Occasionally, incandescence from the summit crater was seen at night, and incandescent lava fragments were ejected from the crater. Rumbling and roaring noises were reported, although less frequently than during 11-17 September. Based on analyses of satellite imagery, the Darwin VAAC reported that on 29 September an ash plume rose to an altitude of 2.4 km (8,000 ft) a.s.l. and drifted 75 km NW.
Sources: Rabaul Volcano Observatory (RVO); Darwin Volcanic Ash Advisory Centre (VAAC)
RVO reported that during 11-17 September gray ash plumes from Rabaul caldera's Tavurvur cone rose 1.5 km above the crater. Ashfall was reported in Rabaul town (3-5 km NW) and surrounding areas. Occasionally, incandescence from the summit crater was seen at night, and incandescent lava fragments were ejected from the crater. Rumbling and roaring noises were reported. Several strong explosions occurred on 11, 16, and 17 September, but were few or absent on other days. Based on analyses of satellite imagery, the Darwin VAAC reported that during 21-22 September ash plumes rose to an altitude of 2.4 km (8,000 ft) a.s.l. and drifted 65-110 km NW.
Sources: Rabaul Volcano Observatory (RVO); Darwin Volcanic Ash Advisory Centre (VAAC)
RVO reported that during 4-10 September gray ash and white plumes from Rabaul caldera's Tavurvur cone rose 1.5 km above the crater. Ashfall was reported in Rabaul town (3-5 km NW) and surrounding areas. Occasionally, incandescence from the summit crater was seen at night, and incandescent lava fragments were ejected from the crater. Rumbling and roaring noises were reported. Several large explosions occurred during an eight-hour period one unspecified evening. Based on analyses of satellite imagery, the Darwin VAAC reported that during 11-13 and 15 September ash plumes rose to an altitude of 2.4 km (8,000 ft) a.s.l. and drifted 35-130 km N and NW.
Sources: Rabaul Volcano Observatory (RVO); Darwin Volcanic Ash Advisory Centre (VAAC)
RVO reported that during 28 August-3 September white and gray ash plumes from Rabaul caldera's Tavurvur cone rose 1.5 km above the crater and produced ashfall in Rabaul town (3-5 km NW) and surrounding areas. Occasionally, incandescence from the summit crater was seen at night, and incandescent lava fragments were ejected from the crater. Rumbling and roaring noises were reported. Based on analyses of satellite imagery, the Darwin VAAC reported that on 5 and 8 September ash plumes rose to altitudes of 2.1-2.4 km (7,000-8,000 ft) a.s.l. and drifted 55-90 km N and NE.
Sources: Rabaul Volcano Observatory (RVO); Darwin Volcanic Ash Advisory Centre (VAAC)
Based on analyses of satellite imagery, the Darwin VAAC reported that during 28-29 August ash plumes from Rabaul caldera's Tavurvur cone rose to an altitude of 2.4 km (8,000 ft) a.s.l. and drifted 90-260 km NW and W.
Source: Darwin Volcanic Ash Advisory Centre (VAAC)
Based on analyses of satellite imagery, the Darwin VAAC reported that on 14 August ash plumes from Rabaul caldera's Tavurvur cone rose to an altitude of 3 km (10,000 ft) a.s.l. and drifted 25-280 km NW.
Source: Darwin Volcanic Ash Advisory Centre (VAAC)
Based on analyses of satellite imagery, the Darwin VAAC reported that during 5-11 August ash plumes from Rabaul caldera's Tavurvur cone rose to altitudes of 2.1-3 km (7,000-10,000 ft) a.s.l. and drifted 25-185 km in multiple directions.
Source: Darwin Volcanic Ash Advisory Centre (VAAC)
RVO reported that during 22-30 July incandescence from Rabaul caldera's Tavurvur cone was occasionally visible at night. Steam plumes rose 1.5 km above the crater. During 28-30 July, ash plumes also rose 1.5 km above the crater, and rumbling and roaring noises were reported. On 30 July, incandescent lava fragments were ejected from the crater. Ashfall was reported in areas to the NW. Based on analyses of satellite imagery, the Darwin VAAC reported that on 2 August ash plumes rose to an altitude of 3 km (10,000 ft) a.s.l. and drifted 55-90 km SW and S.
Sources: Rabaul Volcano Observatory (RVO); Darwin Volcanic Ash Advisory Centre (VAAC)
RVO reported that during 10-21 July white and occasionally blue tinted plumes from Rabaul caldera's Tavurvur cone rose less than 1 km above the crater. Pale-gray ash accompanied the emissions on 13 and 15 July. Ashfall affected Rabaul town (3-5 km NW), Ratavul (20 km SSE), and Nonga (10 km NW). Incandescence was visible at night and roaring was heard during 14-18 July.
Source: Rabaul Volcano Observatory (RVO)
RVO reported that during 3-9 July incandescence from Rabaul caldera's Tavurvur cone was visible at night. Steam plumes rose 1.5 km above the crater. Based on analysis of satellite imagery, the Darwin VAAC reported that during 9-10 July ash plumes rose to an altitude of 2.4 km (8,000 ft) a.s.l. and drifted 20-40 km NW, N, and NE.
Sources: Rabaul Volcano Observatory (RVO); Darwin Volcanic Ash Advisory Centre (VAAC)
Based on analysis of satellite imagery, the Darwin VAAC reported that on 3 July an ash plume from Rabaul caldera's Tavurvur cone rose to an altitude of 4.3 km (14,000 ft) a.s.l. and drifted 45 km N. On 7 July, an ash plume rose to an altitude of 2.1 km (7,000 ft) a.s.l. and drifted less than 30 km SE.
Source: Darwin Volcanic Ash Advisory Centre (VAAC)
RVO reported that during 19-25 June gray ash plumes from Rabaul caldera's Tavurvur cone rose 1.5 km above the crater and produced ashfall in Rabaul town (3-5 km NW) and surrounding areas. Incandescence from the summit crater was seen at night. Based on analysis of satellite imagery, the Darwin VAAC reported that during 26-28 June ash plumes rose to an altitude of 1.5 km (5,000 ft) a.s.l. and drifted 35-75 km NW and W.
Sources: Rabaul Volcano Observatory (RVO); Darwin Volcanic Ash Advisory Centre (VAAC)
An RVO report for 12-18 June noted that the Tavurvur cone at Rabaul produced pale gray ash plumes during 16-17 June. Activity after that consisted primarily of dense white steam plumes, with occasional ash emissions. Continuous glow was seen at night.
Source: Rabaul Volcano Observatory (RVO)
RVO reported that during 7-11 June white and occasionally blue plumes from Rabaul caldera's Tavurvur cone rose 1.5 km above the crater. Incandescence from the summit crater was seen at night. Based on analysis of satellite imagery, the Darwin VAAC reported that during 11-12 and 16 June ash plumes rose to altitudes of 1.5-2.1 km (5,000-7,000 ft) a.s.l. and drifted 25-45 km SE, E, and NE.
Sources: Rabaul Volcano Observatory (RVO); Darwin Volcanic Ash Advisory Centre (VAAC)
RVO reported that during 29 May-6 June white and occasionally blue plumes from Rabaul caldera's Tavurvur cone rose 1 km above the crater. Incandescence from the summit crater was seen at night. On 5 June, an ash plume drifted NW and caused ashfall in Rabaul town (3-5 km NW) and surrounding areas.
Source: Rabaul Volcano Observatory (RVO)
RVO reported that during 21-28 May white and occasionally blue plumes from Rabaul caldera's Tavurvur cone rose 1 km above the crater. Incandescence from the summit crater was seen at night.
Source: Rabaul Volcano Observatory (RVO)
RVO reported that during 14-20 May white and occasionally blue plumes from Rabaul caldera's Tavurvur cone rose 1 km above the crater. Incandescence from the summit crater was seen at night. Based on analysis of satellite imagery, the Darwin VAAC reported that during 20-21 May ash plumes rose to an altitude of 2.4 km (8,000 ft) a.s.l. and drifted 30-40 km SE and SW.
Sources: Rabaul Volcano Observatory (RVO); Darwin Volcanic Ash Advisory Centre (VAAC)
Based on analysis of satellite imagery, the Darwin VAAC reported that on 9 May ash plumes from Rabaul caldera's Tavurvur cone rose to an altitude of 3 km (10,000 ft) a.s.l. and drifted about 35 km E.
Source: Darwin Volcanic Ash Advisory Centre (VAAC)
RVO reported that on 27 April white and occasionally gray plumes from Rabaul caldera's Tavurvur cone rose 0.5-1 km above the crater. Ashfall was reported in Kokopo, about 20 km SE, along with infrequent roaring noises. Activity decreased during 28 April-2 May; white and, less frequently blue, plumes were emitted. Incandescence from the summit crater was seen at night. Based on analysis of satellite imagery, the Darwin VAAC reported that during 3-4 May ash plumes rose to an altitude of 2.4 km (8,000 ft) a.s.l. and drifted about 35 km NE.
Sources: Rabaul Volcano Observatory (RVO); Darwin Volcanic Ash Advisory Centre (VAAC)
RVO reported that during 18-25 April white and gray plumes from Rabaul caldera's Tavurvur cone rose 0.5-1.5 km above the crater. Plumes drifted E and SE. Incandescence from the summit crater was seen at night and occasional roaring noises were reported. Ashfall was reported in Kokopo, about 20 km SE, and surrounding areas. Based on analysis of satellite imagery, the Darwin VAAC reported that on 27 and 28 April ash plumes rose to an altitude of 3 km (10,000 ft) a.s.l. and drifted 55 km S and 35 km SW.
Sources: Rabaul Volcano Observatory (RVO); Darwin Volcanic Ash Advisory Centre (VAAC)
RVO reported that during 10-17 April white and gray plumes from Rabaul caldera's Tavurvur cone rose 1-2 km above the crater. Plumes drifted SE and NW. Occasionally, incandescence from the summit crater was seen at night and roaring noises were reported. Ashfall was reported in Rabaul town (3-5 km NW) and surrounding areas.
Source: Rabaul Volcano Observatory (RVO)
RVO reported that during 3-9 April white and gray plumes from Rabaul caldera's Tavurvur cone rose 1 km above the crater. Plumes drifted SE and NW. Occasionally, incandescence from the summit crater was seen at night and roaring noises were reported. Light ashfall was reported in Kokopo, about 20 km SE. Based on analysis of satellite imagery, the Darwin VAAC reported that during 11-12 April ash plumes rose to an altitude of 2.4 km (8,000 ft) a.s.l. and drifted up to 75 km NW. On 14 April, ash plumes rose to an altitude of 3 km (10,000 ft) a.s.l. and drifted W and up to 120 km NW.
Sources: Rabaul Volcano Observatory (RVO); Darwin Volcanic Ash Advisory Centre (VAAC)
RVO reported that during 27 March-2 April white and occasionally gray or brown plumes from Rabaul caldera's Tavurvur cone rose 1 km above the crater. Plumes drifted SE and NW. Incandescence from the summit crater was seen at night and roaring noises were reported. On 2 April, light ashfall was reported in Rabaul town (3-5 km NW) and surrounding areas. Based on analysis of satellite imagery, the Darwin VAAC reported that on 5 April an ash plume rose to an altitude of 2.4 km (8,000 ft) a.s.l. and drifted about 37 km NE. On 7 April, ash plumes rose to an altitude of 3 km (10,000 ft) a.s.l. and drifted NW.
Sources: Rabaul Volcano Observatory (RVO); Darwin Volcanic Ash Advisory Centre (VAAC)
RVO reported that during 21-26 March white and occasional gray ash plumes from Rabaul caldera's Tavurvur cone rose 500 m above the crater and drifted in variable directions. Incandescence from the summit crater was seen at night. Light ashfall was reported S of Duke of York Islands, about 20 km E.
Source: Rabaul Volcano Observatory (RVO)
RVO reported that during 16-20 March gray ash plumes from Rabaul caldera's Tavurvur cone rose to a maximum altitude of 1.7 km (5,600 ft) a.s.l. and drifted E. Blue vapor was visible during intervals between ash cloud emissions. Incandescence from the summit crater was seen at night, and incandescent tephra was occasionally ejected from the crater during periods of heightened activity. Light ashfall was reported in areas downwind, including in the Duke of York Islands about 20 km E.
Source: Rabaul Volcano Observatory (RVO)
RVO reported that during 9-15 March gray ash plumes from Rabaul caldera's Tavurvur cone rose to a maximum altitude of 2.7 km (8,900 ft) a.s.l. Incandescence was seen at night and incandescent tephra was occasionally ejected from the crater during periods of heightened activity. Light ashfall was reported in areas to the NW and SE.
Source: Rabaul Volcano Observatory (RVO)
RVO reported that during 2-8 March white plumes and gray ash plumes from Rabaul caldera's Tavurvur cone rose a few hundred meters above the crater to 1.7 km (5,600 ft) a.s.l. and drifted NW and SE. Incandescence was seen most nights and incandescent tephra was ejected from the crater. Rumbling and roaring noises were reported during 4-6 March, and ashfall was reported in areas downwind. Based on analysis of satellite imagery, the Darwin VAAC reported that on 10 March an ash plume rose to an altitude of 3 km (10,000 ft) a.s.l. and drifted N.
Sources: Rabaul Volcano Observatory (RVO); Darwin Volcanic Ash Advisory Centre (VAAC)
Based on analysis of satellite imagery, the Darwin VAAC reported that during 22-23 February ash plumes from Rabaul caldera's Tavurvur cone rose to altitudes of 1.8-3 km (6,000-10,000 ft) a.s.l. and drifted S, W, and NW.
Source: Darwin Volcanic Ash Advisory Centre (VAAC)
Based on analysis of satellite imagery, the Darwin VAAC reported that during 13-14 February ash plumes from Rabaul caldera's Tavurvur cone rose to an altitude of 2.4 km (8,000 ft) a.s.l. and drifted SE and W. On 17 February, a low-level ash plume drifted SE.
Source: Darwin Volcanic Ash Advisory Centre (VAAC)
Based on analysis of satellite imagery, the Darwin VAAC reported that on 9 February an ash plume from Rabaul caldera's Tavurvur cone rose to an altitude of 3 km (10,000 ft) a.s.l. and drifted SE.
Source: Darwin Volcanic Ash Advisory Centre (VAAC)
Based on analysis of satellite imagery, the Darwin VAAC reported that during 28-30 January ash plumes from Rabaul caldera's Tavurvur cone rose to altitudes of 1.8-4.3 km (6,000-14,000 ft) a.s.l. and drifted ESE and SE.
Source: Darwin Volcanic Ash Advisory Centre (VAAC)
Based on analysis of satellite imagery and information from RVO, the Darwin VAAC reported that during 22-25 January ash plumes from Rabaul caldera's Tavurvur cone rose to an altitude of 3 km (10,000 ft) a.s.l. and drifted NW and W. On 27 January, an ash plume at an altitude of 4.3 km (14,000 ft) a.s.l. was visible on satellite imagery.
RVO reported that during 23-26 January gray ash plumes rose to an altitude of 1.7 km (5,600 ft) a.s.l. and drifted in multiple directions. White plumes were also emitted. Occasional low rumbling noises were heard throughout the period and weak incandescence was visible at night. Forceful emissions sometimes ejected incandescent lava fragments. Ashfall affected areas downwind, including Rapolo and Malaguna (NW), Kokopo (SE), and Tokua airport (SE).
Sources: Rabaul Volcano Observatory (RVO); Darwin Volcanic Ash Advisory Centre (VAAC)
Based on analysis of satellite imagery, the Darwin VAAC reported that during 14-18 January ash plumes from Rabaul caldera's Tavurvur cone rose to an altitude of 3 km (10,000 ft) a.s.l. and drifted N, NE, SE, and SW. On 16 January, RVO reported that gray ash plumes rose above the crater and dispersed slowly to the E.
Sources: Rabaul Volcano Observatory (RVO); Darwin Volcanic Ash Advisory Centre (VAAC)
RVO reported that during 3-14 January gray ash plumes from Rabaul caldera's Tavurvur cone rose several hundred meters above the crater to 1.7 km (5,600 ft) a.s.l. and drifted SW and SE. Explosions or forceful emissions sometimes ejected incandescent lava fragments that fell back into the crater and occasionally onto the slopes. Ashfall affected areas downwind; Air Niugini suspended all its flights to Tokua airport (about 20 km SE) during 5-9 January. According to a news article, a local shipping company offered to take passengers to a nearby airport in New Ireland Province, an area not affected by the ash plumes. Based on analysis of satellite imagery, the Darwin VAAC reported that during 11-12 January ash plumes rose to an altitude of 2.4 km (8,000 ft) a.s.l. and drifted SE, E, and NE.
RVO reported that on 11 January two small vents opened on the SW flank of Tavurvur (one-quarter of the way up the flank) and emitted strong fumaroles. During 11-13 January, the vents ejected ash. On 13 January, two explosions produced dull booms and sounds resembling falling rocks. Ash plumes rose 200-500 m above the vents and drifted SE. Later that day, diffuse white plumes were emitted. Air Niugini flights into Tokua airport remained suspended on 13 January.
Sources: Rabaul Volcano Observatory (RVO); Darwin Volcanic Ash Advisory Centre (VAAC); ABC News - Australian Broadcasting Corporation
Based on analysis of satellite imagery and pilot observations, the Darwin VAAC reported that on 31 December, 1 January, and 3-5 January, ash plumes from Rabaul caldera's Tavurvur cone rose to an altitude 2.4 km (8,000 ft) a.s.l. and drifted W, NW, NNW, and SE.
Source: Darwin Volcanic Ash Advisory Centre (VAAC)
RVO reported that during 20-26 December gray ash plumes from Rabaul caldera's Tavurvur cone rose to altitudes of 1.7-2.2 km (5,600-7,200 ft) a.s.l. and drifted SE and W. Ashfall was reported in areas downwind, including Kokopo Town (SE). Rumbling and roaring noises were reported on some days. Explosions or forceful emissions sometimes ejected incandescent lava fragments that fell back into the crater and occasionally onto the slopes.
Based on analysis of satellite imagery and pilot observations, the Darwin VAAC reported that on 30 December an ash plume rose to altitudes of 1.8-2.4 km (6,000-8,000 ft) a.s.l. and drifted N and NW.
Sources: Rabaul Volcano Observatory (RVO); Darwin Volcanic Ash Advisory Centre (VAAC)
RVO reported that during 13-19 December gray ash plumes from Rabaul caldera's Tavurvur cone rose to altitudes of 1.7-2.2 km (5,600-7,200 ft) a.s.l. and drifted in multiple directions. Ashfall was reported in areas downwind, including Rabaul town (3-5 km NW). Rumbling and roaring noises were reported on some days. Explosions or forceful emissions sometimes ejected incandescent lava fragments.
Based on analysis of satellite imagery and information from RVO, the Darwin VAAC reported that on 22 and 23 December ash plumes rose to an altitude of 3 km (10,000 ft) a.s.l. and drifted ENE.
Sources: Rabaul Volcano Observatory (RVO); Darwin Volcanic Ash Advisory Centre (VAAC)
RVO reported that during 6-12 December gray ash plumes from Rabaul caldera's Tavurvur cone rose to an altitude of 1.7 km (5,600 ft) a.s.l. and drifted in multiple directions. Ashfall was reported in areas downwind, including Rabaul town (3-5 km NW). Rumbling and roaring noises were reported on some days. Explosions or forceful emissions sometimes ejected incandescent lava fragments.
Based on analysis of satellite imagery and information from RVO, the Darwin VAAC reported that during 14-16 December ash plumes rose to an altitude of 3 km (10,000 ft) a.s.l. and drifted SE, ESE, and NE.
Sources: Rabaul Volcano Observatory (RVO); Darwin Volcanic Ash Advisory Centre (VAAC)
Based on analysis of satellite imagery and information from RVO, the Darwin VAAC reported that during 3-5, 7, and 9 December ash plumes from Rabaul caldera's Tavurvur cone rose to altitudes of 2.1-3 km (7,000-10,000 ft) a.s.l. and drifted E, NE, NNW, WNW, and W.
Source: Darwin Volcanic Ash Advisory Centre (VAAC)
RVO reported that during 21-27 November light gray ash plumes and white steam plumes from Rabaul caldera's Tavurvur cone rose to an altitude of 1.7 km (5,600 ft) a.s.l. and drifted SE, S, SW, and W. Ashfall was reported in areas downwind. Incandescence from the vent was observed, and rumbling and roaring noises were reported on some days. Explosions or forceful emissions sometimes ejected incandescent lava fragments.
Based on analysis of satellite imagery, the Darwin VAAC reported that during 30 November-1 December ash plumes rose to an altitude of 3 km (10,000 ft) a.s.l. and drifted W and WSW.
Sources: Rabaul Volcano Observatory (RVO); Darwin Volcanic Ash Advisory Centre (VAAC)
Based on analysis of satellite imagery, the Darwin VAAC reported that during 12 and 19-25 November ash plumes from Rabaul caldera's Tavurvur cone rose to an altitude of 3 km (10,000 ft) a.s.l. and drifted mainly N, NW, and W.
Source: Darwin Volcanic Ash Advisory Centre (VAAC)
Based on analysis of satellite imagery, the Darwin VAAC reported that during 12 and 16-18 November ash plumes from Rabaul caldera's Tavurvur cone rose to altitudes of 2.4-3 km (8,000-10,000 ft) a.s.l. and drifted NW and NNW.
Source: Darwin Volcanic Ash Advisory Centre (VAAC)
RVO reported that during 3-6 November ash plumes from Rabaul caldera's Tavurvur cone rose to altitudes of 1.7-2.2 km (5,600-7,200 ft) a.s.l. and drifted NW. Ashfall was reported in areas downwind. Sub-continuous incandescence from the vent was observed, and rumbling and roaring noises were reported on some days. Explosions or forceful emissions sometimes ejected incandescent lava fragments.
Based on analysis of satellite imagery, the Darwin VAAC reported that during 7 and 9-12 November ash plumes rose to an altitude of 2.4 km (8,000 ft) a.s.l. and drifted N and NW.
Sources: Rabaul Volcano Observatory (RVO); Darwin Volcanic Ash Advisory Centre (VAAC)
RVO reported that during 27 October-2 November ash plumes from Rabaul caldera's Tavurvur cone rose to an altitude of 1.7 km (5,600 ft) a.s.l. and drifted NW and SE. Ashfall was reported in areas downwind. Sub-continuous incandescence from the vent was observed and rumbling and roaring noises were reported on some days. Explosions or forceful emissions sometimes ejected incandescent lava fragments.
Based on analysis of satellite imagery, the Darwin VAAC reported that on 3 November ash plumes rose to an altitude of 2.4 km (8,000 ft) a.s.l.
Sources: Rabaul Volcano Observatory (RVO); Darwin Volcanic Ash Advisory Centre (VAAC)
RVO reported that during 21-26 October ash plumes from Rabaul caldera's Tavurvur cone rose to an altitude of 2.7 km (8,900 ft) a.s.l. and drifted NW and W. During 21-24 October ashfall was reported in areas downwind, continuous incandescence from the vent was observed, and loud rumbling and roaring noises were reported. During 24-25 October ash plumes drifted to the NW area between Namanula Hill and Rabaul town. On 26 October, ash plumes rose to an altitude of 1.7 km (5,600 ft) a.s.l. and drifted NW, creating hazy conditions in Rabaul town (3-5 km NW).
Source: Rabaul Volcano Observatory (RVO)
RVO reported that during 12-20 October ash plumes from Rabaul caldera's Tavurvur cone rose to an altitude of 0.9-2.7 km (3,000-8,900 ft) a.s.l. and drifted N, NW, S, and SE. Ashfall was reported in areas downwind. During 20-21 October, large explosions occurred and ash plumes rose to altitudes of 1.7-3.7 km (5,600-12,100 ft) a.s.l. A significant amount of ash fell in the area of Rabaul town (3-5 km NW). Continuous incandescence from the vent was observed and loud roaring noises were reported.
Source: Rabaul Volcano Observatory (RVO)
RVO reported that during 7-12 October steam and ash plumes from Rabaul caldera's Tavurvur cone rose to an altitude of 2.7 km (8,900 ft) a.s.l. and drifted N, NW, and W. During 11-12 October, ash emissions increased in frequency; ashfall was reported in areas downwind, including Namanula Hill (3 km W). Continuous incandescence from the vent was observed. Loud roaring noises were reported on 9 October.
Based on analysis of satellite imagery and information from RVO, the Darwin VAAC reported that during 13-14 October ash plumes rose to an altitude of 2.4 km (8,000 ft) a.s.l. and drifted NW and WNW.
Sources: Rabaul Volcano Observatory (RVO); Darwin Volcanic Ash Advisory Centre (VAAC)
RVO reported that during 30 September-6 October ash plumes from Rabaul caldera's Tavurvur cone rose to altitudes of 1.7-2.7 km (5,600-8,900 ft) a.s.l. and drifted E, W, and NW. Ashfall was reported in areas downwind, including Rabaul town (3-5 km NW) and Namanula Hill (3 km W). Continuous incandescence from the vent was observed. Loud roaring noises were reported on 6 October.
Based on analysis of satellite imagery and information from RVO, the Darwin VAAC reported that on 7 October ash plumes rose to an altitude of 2.4 km (8,000 ft) a.s.l. and drifted NW.
Sources: Rabaul Volcano Observatory (RVO); Darwin Volcanic Ash Advisory Centre (VAAC)
RVO reported that ash plumes from Rabaul caldera's Tavurvur cone continued to be emitted during 15-29 September. Plumes drifted in multiple directions. Ashfall was reported in areas downwind, including Rabaul town (3-5 km NW), Namanula Hill (3 km W), and Kokopo (20 km SE). Flights to Tokua airport (20 km SW) were canceled on 24 September due to ashfall. During 28-29 September, ash plumes rose to altitudes of 2.7-3.2 km (8,900-10,500 ft) a.s.l. Continuous incandescence at the summit was observed and roaring noises were heard.
Source: Rabaul Volcano Observatory (RVO)
Based on analysis of satellite imagery and information from RVO, the Darwin VAAC reported that during 17-23 September ash plumes from Rabaul caldera's Tavurvur cone rose to altitudes of 1.8-2.4 km (6,000-8,000 ft) a.s.l. and drifted WSW, W, NW, and NE.
Source: Darwin Volcanic Ash Advisory Centre (VAAC)
RVO reported that ash plumes from Rabaul caldera's Tavurvur cone continued to be emitted during 9-14 September. Ashfall was reported in areas to the S, SW, and NW. Sub-continuous incandescence at the summit was observed, and roaring and rumbling noises were heard. Explosions also ejected incandescent lava fragments.
Based on analysis of satellite imagery, pilot reports, and information from RVO, the Darwin VAAC reported that during 10-16 September ash plumes rose to altitudes of 1.8-3 km (6,000-10,000 ft) a.s.l. and drifted S, SW, and NW.
Sources: Rabaul Volcano Observatory (RVO); Darwin Volcanic Ash Advisory Centre (VAAC)
RVO reported that ash plumes from Rabaul caldera's Tavurvur cone continued to be emitted during 1-8 September. Ashfall was reported in areas downwind. Ash accumulation in Rabaul Town was significant in mid-to-late July and in August; fresh ashfall and re-suspended ashfall due to winds and cars caused "unpleasant" conditions. During 1-6 September, conditions improved due to decreased ashfall, changes in wind patterns, and light rains that inhibited ash re-suspension. Continuous incandescence at the summit was observed, and roaring and rumbling noises were heard. Explosions also ejected incandescent lava fragments.
Based on analysis of satellite imagery and information from RVO, the Darwin VAAC reported that during 4-6 and 8-9 September ash plumes rose to altitudes of 1.8-3 km (6,000-10,000 ft) a.s.l. and drifted W and NW.
Sources: Rabaul Volcano Observatory (RVO); Darwin Volcanic Ash Advisory Centre (VAAC)
RVO reported that ash plumes from Rabaul caldera's Tavurvur cone continued to be emitted during 29-31 August. The plumes drifted NW and caused ashfall in areas downwind. Continuous incandescence at the summit was observed and roaring noises were heard. Explosions also ejected incandescent lava fragments.
Source: Rabaul Volcano Observatory (RVO)
RVO reported that ash plumes from Rabaul caldera's Tavurvur cone continued to be emitted during 18-22 August, although less so than during 16-18 August. Some prolonged ash-free intervals were immediately followed by explosions that produced ash plumes. The plumes drifted NW and caused ashfall in areas downwind. Occasionally incandescence at the summit was observed and roaring noises were heard. Explosions also ejected incandescent lava fragments.
Based on analysis of satellite imagery, the Darwin VAAC reported that on 23 August ash plumes rose to an altitude of 2.4 km (8,000 ft) a.s.l. and drifted NW.
Sources: Rabaul Volcano Observatory (RVO); Darwin Volcanic Ash Advisory Centre (VAAC)
Based on analysis of satellite imagery and reports from RVO, the Darwin VAAC reported that during 13-19 August, low-level plumes from Rabaul caldera's Tavurvur cone rose to altitudes of 1.5-2.4 km (5,000-8,000 ft) a.s.l. and drifted WNW and NW. During 16-18 August, RVO reported ashfall in areas downwind. Occasionally incandescence at the summit was observed and roaring noises were heard. Explosions also ejected incandescent lava fragments.
Sources: Rabaul Volcano Observatory (RVO); Darwin Volcanic Ash Advisory Centre (VAAC)
RVO reported that ash plumes from Rabaul caldera's Tavurvur cone continued to be emitted during 4-10 August. Ashfall was reported in areas NW. Occasionally incandescence at the summit was observed and roaring noises were reported. Incandescent lava fragments were ejected along with some of the more forceful ash emissions. Based on observations of satellite imagery and information from RVO, the Darwin VAAC reported that during 11-12 August, low-level ash plumes rose to an altitude of 1.5 km (5,000 ft) a.s.l. and drifted NW.
Sources: Rabaul Volcano Observatory (RVO); Darwin Volcanic Ash Advisory Centre (VAAC)
RVO reported that during 25 July-4 August, ash plumes from Rabaul caldera's Tavurvur cone rose to altitudes of 1.7-3.7 km (5,600-12,000 ft) a.s.l. and drifted W and NW. Ashfall was reported downwind in Rabaul town, Namanula Hill, Malaguna, and surrounding areas. Occasionally incandescence at the summit was observed and roaring noises were reported. During 31 July-4 August, incandescent lava fragments were ejected along with some of the more forceful ash emissions.
Based on observations of satellite imagery and reports from RVO, the Darwin VAAC reported that low-level plumes rose to altitudes of 1.8-2.4 km (6,000-8,000 ft) a.s.l. and drifted NW during 5-6 August.
Sources: Rabaul Volcano Observatory (RVO); Darwin Volcanic Ash Advisory Centre (VAAC)
Based on observations of satellite imagery and information from RVO, the Darwin VAAC reported that during 23-24 and 26-29 July ash plumes from Rabaul caldera's Tavurvur cone rose to altitudes of 1.5-3 km (5,000-10,000 ft) a.s.l. and drifted W and NW.
Source: Darwin Volcanic Ash Advisory Centre (VAAC)
RVO reported that during 12-18 July, ash plumes from Rabaul caldera's Tavurvur cone drifted NW and W. Ashfall was reported in areas downwind including significant accumulation in Rabaul town (3-5 km NW).
Source: Rabaul Volcano Observatory (RVO)
Eruptions continued from the Tavurvur cone at Rabul during 7-12 July 2008. Occasional thick gray ash clouds formed a continuous ash plume drifting NW, causing fine to moderate ashfall in Rabaul town and other villages. Occasional loud roaring noises were heard accompanying some of the emissions. Seismicity was at moderate levels, dominated by low-frequency volcanic earthquakes. The deflationary trend, identified from ground deformation measurements since July 2007, ceased between May and June 2008.
Advisories to aviators issued by the Darwin VAAC noted ash plumes to altitudes of 2.1 km (7,000 ft) a.s.l. extending 90 km downwind to the NW during 14-15 July.
Sources: Rabaul Volcano Observatory (RVO); Darwin Volcanic Ash Advisory Centre (VAAC)
RVO reported that during 1-7 July, ash-and-steam plumes from Rabaul caldera's Tavurvur cone rose to altitudes up to 1.7 km (5,600 ft) a.s.l. and drifted W and NW. Ashfall was reported downwind in Rabaul town, Namanula Hill, Malaguna, and surrounding areas, and was heavy during 2-3 July. Incandescence at the summit was noted at night during 1-2 July; plumes blocked views of the summit during 3-7 July. During 4-7 July, roaring noises were reported. Based on observations of satellite imagery, the Darwin VAAC reported that on 8 July an ash plume rose to an altitude of 1.8 km (6,000 ft) a.s.l. and drifted NW.
Sources: Rabaul Volcano Observatory (RVO); Darwin Volcanic Ash Advisory Centre (VAAC)
RVO reported that during 20-26 June, ash plumes from Rabaul caldera's Tavurvur cone rose to altitudes less than 1.7 km (5,600 ft) a.s.l. and drifted W and NW. Roaring noises were reported. During 26-30 June, steam-and-ash plumes rose to altitudes of 0.9-1.7 km (3,000-5,600 ft) a.s.l. and drifted NW. Nighttime incandescence was noted. During 23-30 June, ashfall was reported in areas downwind, including in Rabaul and surrounding towns.
Source: Rabaul Volcano Observatory (RVO)
RVO reported that during 10-18 June white plumes from Rabaul caldera's Tavurvur cone rose to altitudes less than 1.7 km (5,600 ft) a.s.l. and drifted SW. During 10-12 June, intermittent roaring and incandescence at the summit were reported. On 17 June, ash plumes rose to an altitude of 1.7 km (5,600 ft) a.s.l. and drifted N and NW. White plumes with a small amount of ash were seen the next day.
Source: Rabaul Volcano Observatory (RVO)
RVO reported that during 2-5 June periodic explosions from Rabaul caldera's Tavurvur cone were followed by short-lived ash plumes and steam plumes. During 5-10 June, plumes with little to no ash were emitted, loud roaring was almost continuous, and nighttime incandescence was noted.
Source: Rabaul Volcano Observatory (RVO)
RVO reported steam plumes and roaring noises from Rabaul caldera's Tavurvur cone during 28 May-2 June. Based on observations of satellite imagery and information from RVO, the Darwin VAAC reported that an ash plume rose to an altitude of 2.1 km (7,000 ft) a.s.l. on 2 June and drifted NW.
Sources: Rabaul Volcano Observatory (RVO); Darwin Volcanic Ash Advisory Centre (VAAC)
RVO reported that during 21-28 May ash plumes from Rabaul caldera's Tavurvur cone rose to an altitude of 1.2 km (3,900 ft) a.s.l. and drifted N. Intermittent roaring noises were heard and ashfall was reported in Rabaul Town (3-5 km NW). During 25-27 May, ash and steam plumes drifted N, NW, and W, resulting in almost continuous ashfall in nearby areas. Occasional roaring noises were again reported.
Source: Rabaul Volcano Observatory (RVO)
RVO reported that during 13-15 May gas plumes from Rabaul caldera's Tavurvur cone produced a haze to the W and NE. During 15-21 May, ash plumes rose to altitudes of 1.7-2.7 km (5,600-8,900 ft) a.s.l. and drifted NE, N, and NW. Ashfall was reported in areas downwind, including Rabaul Town (3-5 km NW). Occasional roaring noises and incandescence at the base of the plume was noted.
Source: Rabaul Volcano Observatory (RVO)
RVO reported that during 7-13 May ash-and-steam plumes from multiple places inside Rabaul caldera's Tavurvur cone rose to an altitude of 2.2 km (7,200 ft) a.s.l. and drifted S. Intermittent roaring and rumbling noises were reported. Incandescent tephra was occasionally visible at night. Based on observations of satellite imagery and reports from RVO, the Darwin VAAC reported that low-level ash plumes rose to an altitude of 3 km (10,000 ft) a.s.l. and drifted SE during 8-9 May. Low-level plumes drifted NE during 10-11 May.
Sources: Rabaul Volcano Observatory (RVO); Darwin Volcanic Ash Advisory Centre (VAAC)
RVO reported that during 30 April-7 May ash plumes from multiple places inside Rabaul caldera's Tavurvur cone rose to altitudes of 1.2-2.2 km (3,900-7,200 ft) a.s.l. and drifted N, E, and SE. Intermittent roaring and rumbling noises and occasional explosions were reported. Ashfall was reported in nearby areas. Ash in Rabaul Town (3-5 km NW) suspended by wind and traffic was problematic. During 5-7 May, incandescent tephra was occasionally visible at night.
Source: Rabaul Volcano Observatory (RVO)
RVO reported that during 23-29 April ash and ash plumes from Rabaul caldera's Tavurvur cone rose to altitudes of 1.7-2.7 km (5,600-8,900 ft) a.s.l. and drifted N, NE, E, SE, and SW. Incandescence at night at the summit, intermittent roaring noises, and occasional explosions were reported. Ashfall measured over 1 cm thick nearby and E of Tavurvur during 23-24 April and was noted in other areas downwind during 25-29 April. Incandescent fragments were propelled from the summit at night during 27-28 April.
Source: Rabaul Volcano Observatory (RVO)
During 18-19 April, the Darwin VAAC reported that low-level ash-and-steam plumes from Rabaul were observed on satellite imagery drifting ESE. According to the VAAC, RVO advised that ash eruptions continued and rocks were expelled during explosions. RVO reported several explosions on 21 April. Billowing ash plumes drifted W and SE during 21-23 April, and caused ashfall about 2 km away in N Matupit on 22 April and areas downwind on 23 April.
Sources: Rabaul Volcano Observatory (RVO); Darwin Volcanic Ash Advisory Centre (VAAC)
RVO reported that during 9-13 April ash and steam-and-ash plumes rose to altitudes of 1.7-2.2 km (5,600-7,200 ft) a.s.l. and drifted W and NW. Ashfall was reported in areas downwind, including Rabaul Town (3-5 km NW). Incandescence at night at the summit and intermittent roaring noises were reported. A large explosion on 10 April showered the flanks with lava fragments and produced a shockwave that rattled windows in Rabaul Town.
Source: Rabaul Volcano Observatory (RVO)
RVO reported that during 1-9 April ash and steam-and-ash plumes rose to altitudes of 0.9-1.7 km (3,000-5,600 ft) a.s.l. and drifted E and SE. Ashfall was reported in Kokopo (about 20 km SE) on 2 April and in areas downwind during 4-7 April. Incandescence at night at the summit and occasional explosions were reported. Roaring noises were reported and sometimes rhythmic during 2-3 and 8-9 April.
Source: Rabaul Volcano Observatory (RVO)
During 26 March-1 April, RVO reported that ash and steam-and-ash plumes rose to altitudes of 1.2-2.7 km (3,900-8,900 ft) a.s.l. and drifted SW, W, NW, and N. Incandescent material was propelled above the crater rim and explosive roaring noises were occasionally heard.
Source: Rabaul Volcano Observatory (RVO)
RVO reported that ash plumes from Rabaul caldera's Tavurvur cone rose to altitudes of 1.7-3.2 km (5,600-10,500 ft) a.s.l. and drifted in almost all directions during 19-26 March. Ashfall was reported daily in areas downwind, including Rabaul Town (3-5 km NW), Matupit Island (2 km W), and Kokopo (20 km SE). Incandescence at the summit was observed and roaring noises were occasionally heard. An explosion produced lava fragments that showered the flanks on 20 March. Shockwaves rattled windows in Rabaul Town. Another explosion showered the flanks with lava fragments on 22 March. During 25-26 March, ashfall affected flights into Tokua (about 20 km SE of Rabaul).
Source: Rabaul Volcano Observatory (RVO)
RVO reported that ash plumes from Rabaul caldera's Tavurvur cone rose to altitudes of 2.7-3.2 km (8,900-10,500 ft) a.s.l. and drifted N, NW, W, SW, and S during 12-19 March. Ashfall was reported in areas downwind, including Rabaul Town (3-5 km NW) and Matupit Island (2 km W). Incandescence at the summit was observed and roaring noises were occasionally heard.
Source: Rabaul Volcano Observatory (RVO)
RVO reported that during 4-7 March white plumes rose from Rabaul caldera's Tavurvur cone and incandescence at the summit was noted. Ash was emitted on 6 March. A slight smell of hydrogen-sulfide gas was reported in areas to the S on 5 March. During 8-11 March, ash plumes rose to altitudes of 1.2-1.7 km (3,900-5,600 ft) a.s.l. and drifted NW, W, SW, S, and SE. Ashfall was reported in areas downwind, including Kokopo town (SE) during 8-10 March, and Rabaul town (NW) on 11 March.
Source: Rabaul Volcano Observatory (RVO)
RVO reported that ash and steam plumes from Rabaul caldera's Tavurvur cone rose to altitudes of 0.9-2.2 km (3,000-7,200 ft) a.s.l. and drifted W during 27 February-4 March. Ashfall was reported in areas downwind, including Matupit, during 27 February-1 March. A smell of hydrogen-sulfide gas was reported in Rabaul Town and roaring noises were heard during 1-3 March. On 3 March, incandescence at the summit was observed.
Source: Rabaul Volcano Observatory (RVO)
RVO reported that ash plumes from Rabaul caldera's Tavurvur cone rose to altitudes of 1.7-2.7 km (5,600-8,900 ft) a.s.l. and drifted E, SE, S, and SW during 20-27 February. Roaring noises were occasionally heard. Ashfall was reported in areas mainly downwind, including Kokopo Town (SE), Takubar (SW), and Tokua (SE), during 21-25 February. Incandescence at the summit was noted during 22-24 February. On 25 February an explosion showered the flanks with lava fragments. On 26 February a large explosion was accompanied by a thick billowing ash plume that rose to an altitude of 3.7 km (12,100 ft) a.s.l. and drifted SE and E. The flanks were again showered with lava fragments. Ashfall was reported in Kokopo and surrounding areas.
Source: Rabaul Volcano Observatory (RVO)
RVO reported that ash plumes from Rabaul caldera's Tavurvur cone rose to an altitude of 2.2 km (7,200 ft) a.s.l. and drifted NW, N, E, SE, and S during 12-15 and 17-20 February. Ashfall was reported in Barovon, Lalakua, Raluana, Kokopo, and surrounding villages downwind. During 19-20 February, incandescence at the summit was accompanied by projections of lava fragments. Roaring noises were sometimes heard.
Source: Rabaul Volcano Observatory (RVO)
RVO reported that ash plumes from Rabaul caldera's Tavurvur cone rose to altitudes of 1.2-1.7 km (3,900-5,600 ft) a.s.l. and drifted NW, W, SW, S, SE, and E during 6-11 February. Ashfall was reported everyday in areas downwind, including Matupit, Kokopo, and Rabaul Town, and surrounding areas. During 6-7 February, incandescence at the summit was noted and incandescent material was propelled from a vent on the inner E wall of the crater.
Source: Rabaul Volcano Observatory (RVO)
RVO reported that gray and brown ash plumes and steam plumes from Rabaul caldera's Tavurvur cone rose to altitudes of 0.9-2.7 km (3,000-8,900 ft) a.s.l. and drifted E and SE during 31 January-5 February. Incandescence from the center of the crater was visible almost every night. On 1 February, ashfall was reported in Kokopo, about 20 km SE. Roaring noises were heard from near-by areas during 1-3 February. On 4 February, a strong smell of hydrogen sulfide gas was reported from Rabaul Town (3-5 km NW).
Source: Rabaul Volcano Observatory (RVO)
RVO reported that white plumes from Rabaul caldera's Tavurvur cone rose to an altitude of 1.5 km (4,900 ft) a.s.l. and drifted E and NE during 24-25 January. Incandescence at the summit was seen at night. On 26 January, ash plumes that were emitted about every 10-20 minutes rose to an altitude of 1.7 km (5,600 ft) a.s.l. and drifted NE. Slight ashfall was reported in areas on the E coast. Deformation-monitoring instruments indicated that uplift started on 23 January and peaked during 25-26 January with 2 cm of inflation. On 28 January, white plumes rose to an altitude of 1.7 km (5,600 ft) a.s.l. and drifted W. On 29 and 30 January, ash-and-gas plumes rose to the same altitude as the previous day but drifted SW, W, and E.
Source: Rabaul Volcano Observatory (RVO)
RVO reported that ash plumes from Rabaul caldera's Tavurvur cone rose to altitudes of 0.8-1 km (2,600-3,300 ft) a.s.l. and drifted E and SE during 17-20 and 22-23 January. On 17 January ashfall was reported in Tokua, about 20 km SE, prompting Air Niugini to cancel some flights. During 18-20 January, the ash plumes were released at 10-20 minute intervals. White plumes were emitted on 21 and 22 January. Incandescence from the center of the crater was visible at night during 17-22 January.
Source: Rabaul Volcano Observatory (RVO)
RVO reported that intermittent ash and vapor plumes from Rabaul caldera's Tavurvur cone were observed during 8-15 January. On 11 January, a small explosion produced an ash plume that rose to altitudes of 1.2-1.5 km (3,900-4,900 ft) a.s.l. and drifted SE. During 11-15 January, ash and vapor plumes rose to altitudes of 0.9-1.2 km (3,000-3,900 ft) a.s.l. and drifted SE, E, NE, N, and W. Slight ashfall was reported about 20 km SE in Tokua on 11 and 12 January. Data from deformation-monitoring instruments indicated no deformation. Incandescence from the lava dome on the crater floor was occasionally visible at night.
Source: Rabaul Volcano Observatory (RVO)
RVO reported that white plumes from Rabaul caldera's Tavurvur cone were observed during 28 December-3 January. Incandescence at the summit was noticeable at night and loud roaring noises were often heard after rain.
Source: Rabaul Volcano Observatory (RVO)
RVO reported that ash plumes from the new vent in the NE crater of Rabaul caldera's Tavurvur cone rose to an altitude of 2.7 km (3,900 ft) a.s.l. during 10-13 December. Plumes drifted SE, W, NW, and E. Ashfall was reported in areas downwind, including Rabaul town on 11 December. Occasional incandescence at the summit was observed. During 13-18 December, white plumes were observed and a strong smell of hydrogen-sulfide gas was reported.
Source: Rabaul Volcano Observatory (RVO)
RVO reported on 10 December that after five weeks of low-level activity from Rabaul, ash was emitted from a new vent in the NE crater during 8-9 December. Resultant ash plumes rose to an altitude of 2.6 km (8,500 ft) a.s.l. and drifted S during 8-10 December. Occasional roaring noises were heard. Continuous incandescence from the lava dome on the crater floor was visible at night.
Source: Rabaul Volcano Observatory (RVO)
RVO reported that white plumes occasionally accompanied by ash plumes from Rabaul caldera's Tavurvur cone rose to altitudes of 1.7-2.7 km (5,600-8,900 ft) a.s.l. during 2-5 November. Plumes drifted N, NW, and W. Ashfall was reported in Rabaul town and surrounding areas. A strong smell of hydrogen-sulfide gas was reported and occasional incandescence at the summit was observed.
Source: Rabaul Volcano Observatory (RVO)
RVO reported that ash plumes from Rabaul caldera's Tavurvur cone rose to altitudes of 2.7-3.7 km (3,900-15,400 ft) a.s.l. during 29-30 October. Ashfall was reported in Rabaul town. Occasional incandescence at the summit was observed.
Source: Rabaul Volcano Observatory (RVO)
RVO reported that white vapor plumes rose from Rabaul caldera's Tavurvur cone during 17-22 October. Ash plumes rose to altitudes of 1.2-4.7 km (3,900-15,400 ft) a.s.l. during 17-18 October and drifted S and NNW. Ashfall was reported from areas downwind on 17 October. The ash emissions were intermittently accompanied by roaring noises, and incandescence at the summit was observed during the reporting period.
Source: Rabaul Volcano Observatory (RVO)
RVO reported that white vapor plumes rose from Rabaul caldera's Tavurvur cone during 8-16 October. Occasional explosions produced ash plumes that rose to altitudes of 1.7-2.7 km (5,600-8,900 ft) a.s.l. The plumes drifted NNE and S. Ashfall was reported downwind, including Namanula Hill and surrounding areas. The ash emissions were intermittently accompanied by roaring noises, and incandescence at the summit was observed during the reporting period.
Source: Rabaul Volcano Observatory (RVO)
RVO reported that ash plumes from Rabaul caldera's Tavurvur cone rose to altitudes of approximately 1.7-2.7 km (5,600-8,900 ft) a.s.l. and drifted NW on 3 October. Ashfall was reported from areas downwind, including Rabaul Town. Ash plumes on 4 October drifted W and resulted in ashfall in Matupit Island, Malaguna. Incandescent fragments were ejected from the summit. On 5 October, vapor plumes with minor ash content were noted. Rumbling noises occasionally accompanied the ash emissions.
Source: Rabaul Volcano Observatory (RVO)
RVO reported that ash plumes from Rabaul caldera's Tavurvur cone rose to altitudes of approximately 1.7-2.7 km (5,600-8,900 ft) a.s.l. and drifted N, NW, W and SW during 25-27 September and 30 September-2 October. Ashfall was reported from areas downwind, including Rabaul Town and Nonga. Roaring and rumbling noises occasionally accompanied the emissions. On 27 September, a large explosion was noted. During 30 September-2 October, incandescent fragments were ejected from the summit and rolled down the flanks.
Based on observations of satellite imagery, the Darwin VAAC reported that ash plumes rose to an altitude of 2.4 km (8,000 ft) a.s.l. on 2 October.
Sources: Rabaul Volcano Observatory (RVO); Darwin Volcanic Ash Advisory Centre (VAAC)
RVO reported that ash plumes from Rabaul caldera's Tavurvur cone rose to an altitude of 1.2 km (3,900 ft) a.s.l. and drifted W and NW on 20 September. Ashfall was reported from areas downwind, including Rabaul Town. White vapor plumes containing a small amount of ash were emitted during 20-24 September. On 25 September, ash plumes rose to an altitude less than 1.7 km (5,600 ft) a.s.l. and drifted W. Roaring noises were heard. Ashfall was reported from areas downwind, including Namanula Hill.
Source: Rabaul Volcano Observatory (RVO)
RVO reported that white vapor plumes rose from Rabaul caldera's Tavurvur cone during 10-18 September. On 16, 18, and 19 September, occasional ash plumes rose to an altitude of 0.9 km (3,000 ft) a.s.l. and drifted W or NW. Slight ashfall was reported in areas downwind, including Rabaul town.
Source: Rabaul Volcano Observatory (RVO)
RVO reported that ash plumes from Rabaul caldera's Tavurvur cone rose to an altitude less than 1 km (3,300 ft) a.s.l. and drifted W on 3 September. Ashfall was reported from areas downwind. During 4-10 September, white vapor plumes rose to altitudes less than 2 km (6,600 ft) a.s.l. and drifted WNW. On 8 and 9 September, the smell of hydrogen-sulfide gas coincided with a blue tinge in the vapor plumes. During the reporting period, emissions were accompanied by roaring noises and observers saw incandescence at the summit.
Source: Rabaul Volcano Observatory (RVO)
RVO reported that ash plumes from Rabaul caldera's Tavurvur cone decreased in frequency during 30 August-1 September. Ash plumes drifted W and NW on 29 August. On 31 August, an explosion produced an ash plume that rose to an altitude of 3.7 km (12,000 ft) a.s.l. The plume drifted W and resulted in fine ashfall downwind. On 2 September, ash plumes drifted NW and ashfall was reported in Rabaul Town and surrounding areas. The ash emissions were accompanied by roaring noises. Incandescence at the summit was observed during the reporting period.
Source: Rabaul Volcano Observatory (RVO)
RVO reported that ash plumes from Rabaul caldera's Tavurvur cone rose to altitudes of 0.9-2.4 km (3,000-7,900 ft) a.s.l. during 22-29 August and drifted NW. Ashfall was reported in Rabaul Town and surrounding areas during 23-29 August. Seismic activity increased to a high level on 25 through 29 August. The ash emissions were accompanied by roaring noises. Incandescence at the summit was observed during the reporting period.
Source: Rabaul Volcano Observatory (RVO)
RVO reported that ash plumes from Rabaul caldera's Tavurvur cone rose to an altitude of 1.1 km (3,600 ft) a.s.l. on 15 August and drifted NNW. The ash emissions were accompanied by roaring noises. Ashfall was reported in Rabaul Town and surrounding areas. White vapor plumes noted during 14-20 August were occasionally accompanied by blue vapor plumes. Vapor plumes rose to an altitude of 1.7 km (5,600 ft) a.s.l. on 20 August and drifted WNW.
Source: Rabaul Volcano Observatory (RVO)
RVO reported that during 7-13 August, ash plumes from Rabaul caldera's Tavurvur cone rose to an altitude of 1.7 km (5,600 ft) a.s.l. and drifted N and NW. On 8 August, ashfall greater than 5 mm thickness was reported in Rabaul Town. During 10-13 August, ashfall was reported from areas downwind, including Rabaul Town. Rumbling and jet-like noises were heard and incandescence was seen at the crater during the reporting period.
Source: Rabaul Volcano Observatory (RVO)
RVO reported that during 22 July-1 August, white and blue vapor plumes from Rabaul caldera's Tavurvur cone rose to an approximate altitude of 0.9 km (3,000 ft) a.s.l. and drifted NNW. Roaring noises were occasionally heard and incandescence was intermittently visible at the crater rim. On 30 July, a white plume with little ash content rose to an altitude of 2.7 km (8,900 ft) a.s.l. and drifted SW. During 1-7 August, ash plumes rose to altitudes of 0.9-1.7 km (3,000-5,600 ft) a.s.l. and drifted N, NW, and W. Slight ashfall was reported at Rabaul town and surrounding areas.
Source: Rabaul Volcano Observatory (RVO)
RVO reported that during 10-11 July, ash plumes from Rabaul caldera's Tavurvur cone rose to an altitude less than 1.2 km (3,900 ft) a.s.l. and drifted N and NW. Fine ash fell in areas downwind, including Rabaul Town. During 12-14 July, white and blue vapor plumes drifted N and NW. A mild smell of sulfur gas was reported from areas downwind. On 17 July, an explosion was accompanied by a loud booming noise and an ash plume. The flanks were showered with lava fragments. The ash plume rose to an altitude less than 1.2 km (3,900 ft) a.s.l. and drifted NW. Ashfall was reported from Rabaul Town, Malaguna, and surrounding areas. White and blue vapor plumes were observed during 14-16 July. Roaring noises were heard and incandescence was visible at night.
Source: Rabaul Volcano Observatory (RVO)
RVO reported that on 30 June and 2 July, explosions from Rabaul caldera's Tavurvur cone produced shockwaves that rattled windows of houses in Rabaul Town and surrounding areas. Ash plumes rose to altitudes of 2.7-3.7 km (8,900-12,100 ft) a.s.l. and drifted N and NW. Ashfall was reported from areas downwind. Incandescence was visible at the summit.
Source: Rabaul Volcano Observatory (RVO)
RVO reported that during 20-26 June, emissions from Rabaul caldera's Tavurvur cone consisted of white vapor plumes containing little ash occasionally accompanied by blue vapor. The plumes rose to an altitude less than 1.7 km (5,600 ft) a.s.l. and drifted W, NW, N, and SSE. Fine ash fell in areas downwind, including Rabaul Town. A mild smell of hydrogen sulfide gas was reported from Rabaul Town. Weak roaring noises were heard and incandescence was visible at night.
Source: Rabaul Volcano Observatory (RVO)
RVO reported that during 19-20 June, four explosions from Rabaul caldera's Tavurvur cone produced shockwaves that rattled windows of houses in Rabaul Town and surrounding areas. The explosions showered the flanks of the volcano with lava fragments. Ash plumes rose to an altitude of 2.7 km (8,900 ft) a.s.l. and drifted NW. Ashfall was reported from Rabaul Town and surrounding areas.
Source: Rabaul Volcano Observatory (RVO)
RVO reported that during 29-30 April, ash emissions from Rabaul caldera's Tavurvur cone generated plumes that rose to an altitude of 1.2 km (3,900 ft) a.s.l. and drifted W. During 1-2 May, ash plumes drifted NNW; ashfall was reported from Rabaul town and surrounding areas. Occasional roaring noises were heard and incandescence was observed at night.
Source: Rabaul Volcano Observatory (RVO)
Based on information from RVO, the Darwin VAAC reported that explosions occasionally occurred from Rabaul on 26 April. Diffuse steam-and-ash plumes were visible on satellite imagery and rose to a few hundred meters. RVO reported that on 29 April, ash plumes rose to 2.7 km (8,900 ft) a.s.l. and drifted W. Ashfall was reported from areas downwind and occasional roaring noises were heard. Incandescence was observed at night during 25-29 April.
Sources: Rabaul Volcano Observatory (RVO); Darwin Volcanic Ash Advisory Centre (VAAC)
RVO reported that during 16-25 April, white-to-gray emissions from Rabaul caldera's Tavurvur cone generated plumes that rose a few hundred meters and drifted multiple directions. Based on reports from RVO and satellite imagery, the Darwin VAAC reported that a diffuse plume rose to an altitude of 1.5 km (5,000 ft) a.s.l. on 18 April and drifted SW. Occasionally during 18-23 April, moderately-sized explosions led to darker gray plumes. During 22-25 April, light ashfall was reported in Rabaul town. Weak roaring noises occasionally accompanied the emissions. A slight glow was seen from crater at night and small amounts of incandescent material were rarely ejected from the crater during 16-23 April.
Sources: Rabaul Volcano Observatory (RVO); Darwin Volcanic Ash Advisory Centre (VAAC)
RVO reported that during 10-17 April, Rabaul caldera's Tavurvur cone emitted steam and steam-and-ash plumes that rose to 1.1-2.7 km (3,600-8,900 ft) a.s.l. and drifted S and SE. Weak roaring noises occasionally accompanied the emissions. Small amounts of incandescent material were ejected from the crater during 13-15 April.
Source: Rabaul Volcano Observatory (RVO)
RVO reported that during 3-10 April, Rabaul caldera's Tavurvur cone emitted steam and steam-and-ash plumes that rose to 0.8-2.7 km (2,600-8,900 ft) a.s.l. and drifted W, NW, N, NE, and E. Weak roaring noises occasionally accompanied the emissions. On 3 April, explosions shook buildings in Rabaul town. Based on reports from RVO and satellite imagery, the Darwin VAAC reported that ash plumes rose to an altitude of 3 km (10,000 ft) a.s.l. during 8-9 April. Incandescent material was ejected from the crater during 9-10 April.
Sources: Rabaul Volcano Observatory (RVO); Darwin Volcanic Ash Advisory Centre (VAAC)
RVO reported that during 26 March-1 April, Rabaul caldera's Tavurvur cone emitted steam and steam-and-ash plumes that rose to 0.8 km (2,600 ft) a.s.l. and drifted E, N, and NW. Roaring noises occasionally accompanied emissions. Incandescent material was ejected to at most 100 m above the lowest part of the vent during 26-30 March. Based on reports from RVO and satellite imagery, the Darwin VAAC reported that ash plumes rose to altitudes of 1.5-3 km (5,000-10,000 ft) a.s.l. and drifted NE during 1-2 April.
Sources: Rabaul Volcano Observatory (RVO); Darwin Volcanic Ash Advisory Centre (VAAC)
RVO reported that during 21-26 March, Rabaul caldera's Tavurvur cone emitted steam and steam-and-ash plumes that rose to 1-2.7 km (3,300-8,900 ft) a.s.l. and drifted E and SE. Roaring noises occasionally accompanied emissions. Incandescent material that was expelled during explosions landed on and rolled down the flanks. On 25 March, explosions shook buildings in Rabaul town.
Source: Rabaul Volcano Observatory (RVO)
RVO reported that during 13-21 March, Rabaul caldera's Tavurvur cone emitted ash plumes that rose to 1.1-3.7 km (3,600-12,000 ft) a.s.l. and drifted E, SE, S, and W. Loud roaring noises occasionally accompanied emissions. During 16-21 March, multiple explosions occurred, some of which produced shockwaves. Summit incandescence was observed at night and lava fragments were projected onto the flanks. Ashfall was reported from areas downwind during the reporting period.
Source: Rabaul Volcano Observatory (RVO)
RVO reported that during 6-13 March, Rabaul caldera's Tavurvur cone emitted ash plumes that rose to 0.9-2.7 km (3,000-8,900 ft) a.s.l. and drifted S, SE, W, and E. Loud roaring noises occasionally accompanied emissions and ashfall was reported from surrounding villages. Multiple explosions occurred. Large explosions produced shockwaves that rattled windows in Rabaul town and surrounding areas. The flanks were showered with incandescent lava fragments during 7-13 March.
Source: Rabaul Volcano Observatory (RVO)
RVO reported that during 28 February-6 March, Rabaul caldera's Tavurvur cone emitted white vapor plumes containing a small amount of ash that rose to 1.2-1.7 km (3,900-5,600 ft) a.s.l. and drifted ENE and E. Loud roaring noises occasionally accompanied emissions. During 3-6 March, multiple explosions occurred. Larger explosions produced shockwaves that rattled windows in Rabaul town and surrounding areas on 3 and 5 March. The flanks were showered with lava fragments. On 4 and 6 March, ash plumes rose to a maximum altitude of 2.7 km (8,900 ft) a.s.l. and drifted E and SE. Ashfall was reported from areas downwind during the reporting period.
Source: Rabaul Volcano Observatory (RVO)
RVO reported that during 16-24 February, Rabaul caldera's Tavurvur cone emitted white vapor plumes that rose to 0.9-3.7 km (3,000-12,000 ft) a.s.l. and drifted N, W, and E. Ash clouds were emitted on 16, 19, 21, and 23-24 February and ashfall was reported from surrounding villages on 20 February. Loud roaring noises were occasionally heard. On 22 February, a moderate explosion produced fragments that showered the flanks. On 27 February, the Darwin VAAC reported that a diffuse plume was visible on satellite imagery. On 28 February, RVO reported a large explosion produced an ash plume that rose to an altitude of 2.7 km (8,900 ft) a.s.l. and drifted NE.
Sources: Rabaul Volcano Observatory (RVO); Darwin Volcanic Ash Advisory Centre (VAAC)
Based on satellite imagery and RVO, the Darwin VAAC reported that diffuse plumes from Rabaul rose to altitudes of 2.1 km (7,000 ft) a.s.l. and drifted ESE.
Source: Darwin Volcanic Ash Advisory Centre (VAAC)
RVO reported that on 31 January, a large explosion from Rabaul caldera's Tavurvur cone produced a shockwave. The flanks were showered with lava fragments and an ash plume rose a few hundred meters above the summit and drifted SE and E. Two more explosions occurred later that day. During 31 January-6 February, emissions of steam and of variable amounts of ash produced plumes that rose to a maximum altitude of 2.2 km (7,200 ft) a.s.l. and drifted NE, SE, and E. Roaring noises were audible on 4 February.
Source: Rabaul Volcano Observatory (RVO)
RVO reported that during 18-26 January, seismic activity at Rabaul caldera's Tavurvur cone continued at low levels. On 24 and 27-30 January, emissions of steam and a small amount of ash produced plumes that rose to a maximum altitude of 2.7 km (8,900 ft) a.s.l. and drifted N, NE, and E. Roaring noises were occasionally audible. Based on satellite imagery and information from RVO, the Darwin VAAC reported that a small plume was visible on 30 January and drifted NE.
Sources: Rabaul Volcano Observatory (RVO); Darwin Volcanic Ash Advisory Centre (VAAC)
RVO reported that during 4-10 January, Rabaul caldera's Tavurvur cone emitted steam plumes with small amounts of ash that rose to 0.9-3.2 km (3,000-10,500 ft) a.s.l. and drifted E and NE. On 10 January, a plume rose to an altitude of 2.7 km (8,900 ft) a.s.l. and drifted NE. Roaring noises were occasionally audible.
Source: Rabaul Volcano Observatory (RVO)
RVO reported that during 1-3 January, Rabaul caldera's Tavurvur cone emitted steam plumes with small amounts of ash that rose to 1.0-2.7 km (3,300-8,900 ft) a.s.l. and drifted E and N. Roaring noises accompanied emissions on 2 January.
Source: Rabaul Volcano Observatory (RVO)
RVO reported that during 24-29 December Rabaul caldera's Tavurvur cone emitted ash plumes that rose to 1.1-3.7 km (3,600-12,000 ft) a.s.l. and drifted in multiple directions. Ashfall was reported from areas downwind including Rabaul town on 25, 27, and 28 December.
Source: Rabaul Volcano Observatory (RVO)
Based on satellite imagery, the Darwin VAAC reported that diffuse plumes from Rabaul drifted mainly N and E during 15-17 December.
Source: Darwin Volcanic Ash Advisory Centre (VAAC)
RVO reported that during 6-8 December Rabaul caldera's Tavurvur cone emitted thick white-to-gray plumes that rose to 1.2-3.2 km (3,900-10,500 ft) a.s.l. and drifted NW and NE. Ashfall was reported from areas downwind (NW) on 6 and 7 December. Roaring noises were heard during 7-10 December. On 11 December, the volcano was quiet and emitted only a diffuse plume that was also visible on satellite imagery. On 12 December, a loud explosion shook houses in Rabaul Town and a gray plume rose to 1.7 km (5,600 ft) a.s.l. and drifted E. When the noise stopped on 10 December, the deformation monitoring equipment recorded an approximate 1-cm rapid uplift that subsided after the explosion on 12 December.
Sources: Rabaul Volcano Observatory (RVO); Darwin Volcanic Ash Advisory Centre (VAAC)
RVO reported that during 26-27 November Rabaul emitted weak gray ash clouds that drifted NW to W. Ashfall was reported from areas downwind. During 28 November-1 December, the emissions were forceful and plumes rose to 900 m (3,000 ft) a.s.l. and drifted E. On 2 December, emissions of white vapor and gray ash clouds produced plumes to 2.7 km (8,900 ft) a.s.l. that drifted ENE. During 3-6 December, ash plumes rose to altitudes of 1.2-2.7 km (3,900-8,900 ft) a.s.l. and drifted in multiple directions. Ashfall was again reported from areas downwind. Seismicity continued at low levels and deformation rates were low.
Source: Rabaul Volcano Observatory (RVO)
RVO reported that during 20-23 November Rabaul emitted thick white vapor accompanied by minor gray ash clouds. On 21 November, emissions created a haze around the summit. On 22 and 23 November, plumes rose to about 1.7 km (5,600 ft) a.s.l. and drifted W and E, respectively. Fine ashfall was reported from areas downwind to the W.
Source: Rabaul Volcano Observatory (RVO)
RVO reported that during 14-20 November eruptions occurred at Rabaul caldera's active Tavurvur cone. On 14 November, a large explosion produced an ash plume that rose to 2.7 km (8,900 ft) a.s.l. and drifted NW. Lava fragments fell onto the flanks and into the sea. Continuous ash emissions followed. During 15-18 and 20 November, continuous emissions of white vapor and gray ash clouds produced plumes that rose to 0.8-3.2 km (2,600-10,500 ft) a.s.l. and drifted S, E, N, and NW. On 19 November only thick white vapor clouds were emitted. Fine ashfall was reported downwind on 20 November.
Source: Rabaul Volcano Observatory (RVO)
RVO reported that during 25 October-1 November, Rabaul emitted thick white vapor and sub-continuous gray ash clouds. Fine ashfall was reported from areas N and NW, including Rabaul town. On 28 October, a large explosion produced an ash cloud that reached an altitude of 2 km (6,600 ft) a.s.l. and drifted NW. Fine ashfall was reported from areas downwind and lava fragments fell onto the flanks. Only continuous, thick, white vapor clouds were emitted during 1-7 November. Two explosive events occurred on 2 November. Ash plumes from the first explosion reached altitudes of 1.5 km (4,900 ft) a.s.l. Plumes from both explosions drifted N. During 3-10 November, occasional small-to-moderate ash emissions produced plumes that drifted SE, away from populated areas. During 11-13 November, thick white vapor and occasional gray ash clouds drifted SE, S, W, NW, and N. Fine ashfall was reported downwind on 11 November.
Source: Rabaul Volcano Observatory (RVO)
Based on satellite imagery, the Darwin VAAC reported that a diffuse plume from Rabaul drifted N on 1 November.
Source: Darwin Volcanic Ash Advisory Centre (VAAC)
Based on satellite imagery, the Darwin VAAC reported that a small ash-and-steam plume from Rabaul reached an altitude of 3.0 km (10,000 ft) a.s.l. and drifted NW on 26, 27, and 28 October. The RVO reported that mild eruptions during 29-30 October produced thick, gray ash plumes that drifted N and NW. Fine ashfall was reported from Namanula, including surrounding areas downwind, and E Rabaul town. Seismicity was at background levels and the rate of ground deformation was low.
Sources: Rabaul Volcano Observatory (RVO); Darwin Volcanic Ash Advisory Centre (VAAC)
The RVO reported that a few Vulcanian eruptions from Rabaul occurred on 18 October and produced ash plumes to 1 km (3,300 ft) a.s.l. Ashfall was reported from E Rabaul town. Seismicity was at background levels and the rate of ground deformation was low.
Source: Rabaul Volcano Observatory (RVO)
Based on information from the RVO, the Darwin VAAC reported that a brief eruption of Rabaul on 11 October produced a plume that reached an altitude of 7.6 km (25,000 ft) a.s.l. and dissipated NW. Continuous low-level emissions and Vulcanian eruptions produced plumes to 1 km (3,300 ft) a.s.l. during 12-17 October.
Source: Darwin Volcanic Ash Advisory Centre (VAAC)
The RVO reported that a large, sustained Vulcanian eruption of Rabaul began at about 0845 on 7 October. An ash column rose to over 5 km (16,400 ft a.s.l.) and had produced thunder and lightning. Sand-sized particles fell to the E. By 1200, windows rattled and doors slammed in the nearby town of Rabaul, N of Tavurvur crater, from semi-continuous air blasts that became rhythmic. Windows in the observatory, 12 km away, blew out from shockwaves. Moderately heavy ash fell in southern Rabaul town. Lapilli ~1 mm in diameter and lithics up to 3 cm in diameter fell in the S and SW parts of the caldera. Residents affected by heavier ashfall and air blasts self-evacuated. The eruption grew to sub-Plinian status throughout the day. Thick ash plumes reached 18 km (59,000 ft a.s.l.) altitude and dispersed N, NW, S, and SW. Ashfall affected the entire Gazelle Peninsula.
At 1415, the eruption style changed to Strombolian, which lasted until about 1730. During the night, moderate to bright incandescence was observed on the N rim of Tavurvur. Explosions and loud roaring noises were occasionally heard.
On 8 October, thick white and blue vapor clouds were accompanied by ash explosions and plumes that drifted N and NW. Lava flows on the W and N flanks were visible from 2 km NW in Rapindik. The lava flow on the W flank reached the sea, causing secondary explosions.
Sources: Rabaul Volcano Observatory (RVO); Times Online
RVO reported that during 11-20 August, Rabaul caldera's Tavurvur cone continued with mild eruptive activity. Variable amounts of diffuse gray ash-clouds were emitted from the summit area and rose to less than 150 m above the summit (~2,750 ft a.s.l.). The plumes drifted N and NW depositing small amounts of ash in Rabaul Town. Based on GPS and Tide Gauge measurements, an overall inflationary trend that began in mid-February continued through the reporting period.
Source: Rabaul Volcano Observatory (RVO)
RVO reported that during 30 January to 15 February, Rabaul caldera's Tavurvur cone continued to be relatively quiet. Variable amounts of gas were emitted from an active fumarole at the summit area on the upper part of the W flank. An average sulfur-dioxide flux of 200 metric tons per day was recorded and seismicity was at low levels. According to the Darwin VAAC, ash from Rabaul was visible on satellite imagery at a height of ~3.7 km (12,100 ft) a.s.l. on 17 February.
Sources: Darwin Volcanic Ash Advisory Centre (VAAC); Rabaul Volcano Observatory (RVO)
Ash emissions from Rabaul caldera's active Tavurvur cone on 10,11,12, and 15 January rose over 1.5 km above the volcano's summit and drifted E. Seismicity was at low levels during 1-15 January.
Source: Rabaul Volcano Observatory (RVO) via the Darwin Volcanic Ash Advisory Center
Rabaul caldera's active Tavurvur cone was quiet after ash emissions ceased on 20 November. During 21-27 November, only very small traces of gas were released from the eruption vent and from other spots on the summit area. Seismicity was at very low levels and a small amount of ground inflation was recorded.
Source: Rabaul Volcano Observatory (RVO) via the Darwin Volcanic Ash Advisory Center
RVO reported that during 3-9 October, eruptions occurred at Rabaul caldera's active Tavurvur cone. Irregular ash emissions rose 800-1,500 m above the volcano (or 4,900-7,200 ft a.s.l.). Incandescent volcanic bombs were visible showering the cone's sides. Seismicity at the volcano was at moderate-to-high levels, with most earthquakes associated with ash emissions and explosions. Ground-deformation measurements fluctuated since stabilizing during the previous week, however the general trend showed slight deflation. People were discouraged from venturing within 1 km of the erupting vent. According to the Darwin VAAC, ash was visible on satellite imagery on 5 October.
Sources: Darwin Volcanic Ash Advisory Centre (VAAC); Rabaul Volcano Observatory (RVO)
During 12-18 September, ash emissions continued at Rabaul caldera's active Tavurvur cone. Ash plumes rose 800-1,500 m above the volcano (or 4,900-7,200 ft a.s.l.) and drifted N and NW, depositing ash in most parts of Rabaul Town and beyond. Projections of incandescent volcanic material were visible at night during strong explosions. Seismicity was at moderate-to-high levels, with most earthquakes associated with ash emissions and explosions. The deformation trend generally reflected uplift. People were discouraged from venturing within 1 km of the erupting vent.
Source: Rabaul Volcano Observatory (RVO)
During 22-28 August, ash emissions continued at Rabaul caldera's active Tavurvur cone. Ash plumes rose 800-1,500 m above the volcano (or 4,900- 7,200 ft a.s.l.) and drifted N and NW, depositing ash on the eastern part of Rabaul Town and beyond. Seismicity was at moderate-to-high levels, with most earthquakes associated with ash emissions and explosions. The deformation trend generally reflected uplift.
Source: Rabaul Volcano Observatory (RVO) via the Darwin Volcanic Ash Advisory Center
Rabaul caldera's active Tavurvur cone continued to emit ash during 15-21 August, although there was a slight decline in the frequency of emissions in comparison to earlier weeks. Ash plumes rose 800-1,500 m above the volcano (or 4,900-7,200 ft a.s.l.) and drifted N and NW, occasionally depositing ash on the E part of Rabaul Town and in areas farther downwind. Projected incandescent lava fragments were visible at night. Seismicity was at moderate-to-high levels, with most earthquakes associated with ash emissions and explosions. Ground-deformation measurements from GPS and tide-gauge instruments fluctuated, however the general trend showed a slow rate of uplift. As a safety precaution, people were discouraged from venturing within 1 km of the erupting vent.
Source: Rabaul Volcano Observatory (RVO) via the Darwin Volcanic Ash Advisory Center
A low-level ash plume was visible on a satellite image of Rabaul on 9 August at an altitude of 1.5 km (~5,000 ft) a.s.l.
Source: Darwin Volcanic Ash Advisory Centre (VAAC)
A pilot observed an ash plume from Rabaul on 28 July at a height of 3 km (~10,000 ft) a.s.l. Ash was not visible on satellite data.
Source: Darwin Volcanic Ash Advisory Centre (VAAC)
On 27 June the Darwin VAAC received a pilot report of an ash plume 37 km (20 nautical miles) to the NW of the volcano.
Source: Darwin Volcanic Ash Advisory Centre (VAAC)
During 22-28 March, eruptions continued at Rabaul caldera's active Tavurvur cone every 10-20 minutes. These intervals were longer than during the previous weeks. Ash clouds rose several hundred meters above the summit. Moderate ash fell in Rabaul Town during 25-28 March. There were 100-200 earthquakes daily associated with the eruption. No changes were recorded in ground deformation. People were discouraged from entering within 1 km of the erupting vent.
Source: Rabaul Volcano Observatory (RVO)
Low-level eruptions continued at Rabaul caldera's active Tavurvur cone during 9-15 March. According to the Darwin VAAC, ash may affect Tokua airport, depending on the prevailing wind direction.
Source: Darwin Volcanic Ash Advisory Centre (VAAC)
Low-level eruptions continued at Rabaul caldera's active vent at Tavurvur cone during 2-8 March. According to the Darwin VAAC, monsoonal low-level NW winds were expected to continue to blow ash towards Tokua airport.
Source: Darwin Volcanic Ash Advisory Centre (VAAC)
RVO reported that Rabaul caldera's active vent at Tavurvur cone continued to erupt during 22-24 February. Ash clouds rose several hundred meters before drifting SE. Most ash fell offshore, but there were reports of fine ash reaching Tokua airport, ~45 km SW of Rabual Town. RVO stated that based on past eruptive episodes from Tavurvur between 1995 and 2004 the current episode will most likely continue indefinitely. Also, the eruption will fluctuate but is not expected to reach levels that will pose a threat to life in Rabaul Town and surrounding villages. People were discouraged from venturing within 1 km of the eruptive vent. According to a news report, several flights to and from Tokua airport were cancelled due to ashfall in the area. Many flights have been cancelled since the eruption commenced in late January 2005.
Source: Rabaul Volcano Observatory (RVO)
During 1-21 February, eruptions of ash clouds occurred fairly frequently at Rabaul caldera's Tavurvur cone. Ash clouds rose a few hundred meters, drifted SE, and deposited ash mainly offshore. Incandescent lava fragments were visible during several evenings. Between 200-350 earthquakes associated with the eruption occurred daily. During 18-21 February, ash fell in the town of Tokua.
Source: Rabaul Volcano Observatory (RVO)
Based on information from RVO, the Darwin VAAC reported that on 31 January ash was emitted from Rabaul to a height of ~1 km above the summit. Ash was not visible on satellite imagery.
Source: Darwin Volcanic Ash Advisory Centre (VAAC)
Based on information from RVO, the Darwin VAAC reported that ash emissions commenced at Rabaul on 25 January. Ash rose to ~500 m above the summit and drifted E.
Source: Darwin Volcanic Ash Advisory Centre (VAAC)
Eruptive activity, which began at Rabaul caldera's Tavurvur cone in October 2002, ceased on 17 February. During 1-17 February, emissions of "light-to-pale ash clouds" were accompanied by occasional moderate explosions that produced thick ash plumes. The ash plumes rose 1-2 km above the summit and drifted E and NE, resulting in ashfall in Duke of York, Rabaul Town, and other villages. During 18-29 February there were only weak gas emissions. Ground-deformation measurements showed a deflationary trend during the last half of February.
Source: Rabaul Volcano Observatory (RVO)
On 10 August eruptions began again at Rabaul caldera's Tavurvur cone after 2 days of very little activity. Eruptions mainly consisted of slowly emitted convoluted ash plumes at irregular intervals. On 25 August discrete explosions began to occur. Most of the ash from the eruptions was blown NW, resulting in ashfall in towns downwind, including in Rabaul and the Nonga area. During 1 July to 28 August, seismicity was at low levels and the amount of deformation was insignificant.
Source: Rabaul Volcano Observatory (RVO)
On 10 August at least three small low-intensity ash emissions were observed at Rabaul caldera's Tavurvur cone. On 13 August emissions produced ash clouds to a maximum height of ~1 km above the volcano. In August seismicity was at low levels and there were minimal ground movements. The volcano's edifice was inflated, and earthquakes occurred in the NE area of the volcano.
Source: Rabaul Volcano Observatory (RVO)
There was a noticeable decline in ash eruptions from Rabaul caldera's Tavurvur cone on 22 June through at least 30 June. Around the 19th, ash plumes drifted NW, depositing ash in Rabaul Town and nearby villages. On 19 and 21 June ash emissions occurred within several minutes of each other, but on the 22nd the interval became much longer with no ash emissions occuring for as long as an hour. Ash-laden plumes rose between several hundred and ~1,500 m above the summit. Seismicity decreased on the 22nd, with the occurance of fewer low-frequency earthquakes that are associated with eruptive activity. No significant changes in deformation were recorded.
Source: Rabaul Volcano Observatory (RVO)
On 21 June a low-level plume from Rabaul was visible on satellite imagery extending ~11 km NW of the summit.
Source: Darwin Volcanic Ash Advisory Centre (VAAC)
Activity at Rabaul caldera's Tavurvur cone during 13-19 March was low in comparison with previous months. The eruption continued to be characterized by discrete, convoluted ash plumes occurring at long irregular intervals and rising slowly to several hundred meters above the summit. Ash emissions mainly drifted E and SE. Some light ashfall occurred in the town of Rabaul on 16 March. During the report period, seismicity was at low levels and deformation measurements fluctuated.
Source: Rabaul Volcano Observatory (RVO) via the Darwin Volcanic Ash Advisory Center
The eruption at Rabaul caldera's Tavurvur cone continued during 26 February to 2 March. Activity was characterized by discrete, slow, convoluted ash plumes occurring at long, irregular intervals and rising slowly to several hundred to a thousand meters above the summit. Activity during the report period was slightly lower than activity during 17-26 February, with intervals between ash emissions becoming much longer. Ash emissions were blown to the E and SE. Seismicity remained at low levels and there were no significant changes in deformation. According to the Darwin VAAC, ash was not visible on satellite imagery.
Sources: Rabaul Volcano Observatory (RVO) via the Darwin Volcanic Ash Advisory Center; Darwin Volcanic Ash Advisory Centre (VAAC)
Eruptions of Rabaul caldera's Tavurvur cone continued during 27 January to 2 February, with steam-and-ash emissions occurring at irregular intervals and rising about a few hundred meters above the summit. Ash plumes were blown to the SE and seismicity fluctuated at low levels. Ground-deformation measurements showed a slight inflationary trend over the last couple of days in the report period.
Source: Rabaul Volcano Observatory (RVO) via the Darwin Volcanic Ash Advisory Center
Eruptions of Rabaul caldera's Tavurvur cone continued during 17-19 January, with activity from three different vents. Discrete convoluted ash plumes rose several hundred to a thousand meters above the volcano's summit. Plumes drifted N and NW, depositing small amounts of ash in Rabaul Town, and the villages of Malaguna, Matupit, Nonga, Tavai, Korere, and Rabura. During the report period, seismicity was at low levels. No significant short-term deformation was recorded, following a very slow inflationary trend during the previous 2 months.
Source: Rabaul Volcano Observatory (RVO) via the Darwin Volcanic Ash Advisory Center
Activity at Rabaul caldera's Tavurvur cone continued through 2 January, with eruptions occurring from three vents at different times. The eruptions were characterized by slow convoluted ash plumes rising several to thousands of meters above the summit. Seismicity was at low-to-moderate levels. No significant short-term deformation was recorded, following a very slow inflationary trend during the previous month.
Source: Rabaul Volcano Observatory (RVO) via the Darwin Volcanic Ash Advisory Center
During 17-20 December, the eruption of Rabaul volcano's Tavurvur cone was characterized by slow, convoluted ash plumes that rose several hundred to more than a thousand meters above the summit. Seismicity was low to moderate and no significant ground deformation was recorded.
Source: Rabaul Volcano Observatory (RVO) via the Darwin Volcanic Ash Advisory Center
During 12-16 December, the eruption of Rabaul volcano's Tavurvur cone was characterized by slow, convoluted ash plumes that rose several hundred meters above the summit. Moderate amounts of ashfall affected areas close to the cone. Seismicity was low to moderate and no significant ground deformation was recorded. Although the NE vent was still dominant, some plumes also rose from the W side of the N crater.
Source: Rabaul Volcano Observatory (RVO) via the Darwin Volcanic Ash Advisory Center
Through 11 December the eruption of Rabaul volcano's Tavurvur cone was characterized by slow, convoluted ash plumes that rose several hundred meters above the summit. There was a small amount of ash in the plumes, and minor ashfall affected areas close to the cone. Seismicity was low to moderate, and there was a ~2.5-minute-long period of harmonic tremor the morning of the 11th that was accompanied by a pulsating noise that emanated from the volcano. No ground deformation was recorded.
Source: Rabaul Volcano Observatory (RVO) via the Darwin Volcanic Ash Advisory Center
The eruption at Rabaul caldera's Tavurvur cone continued through 3 December. The intensity of ash emission changed on 30 November from very slow to slightly forceful, and the interval between eruptions increased. Occasional moderate eruptions produced ash clouds that reached heights of 1-1.5 km above the crater. Two moderate explosions on the night of the 30th emitted visible incandescent lava fragments that showered the volcano's N and NE slopes and ash plumes that rose several hundred meters above the crater. On the evening of 3 December ash plumes were blown N and NW, causing fine ashfall in parts of Rabaul Town. During the report period, seismicity was at low-to-moderate levels. GPS measurements of ground deformation showed no significant changes, but electronic tiltmeters showed minor inflation. RVO stated that the current eruption at Tavurvur is expected to continue, but an increase in eruptive activity is unlikely.
Source: Darwin Volcanic Ash Advisory Centre (VAAC)
Very heavy ash emission was observed at Rabaul caldera's Tavurvur cone on 24 November. A low-level plume was produced and no ash was visible on satellite imagery. RVO advised on 25 November that ash emissions were continuing from Rabaul, but at a reduced rate in comparison to previous weeks. Observations revealed that the ash content in the emissions was generally decreasing, and erupted ash clouds remained below ~1.5 km a.s.l.
Source: Darwin Volcanic Ash Advisory Centre (VAAC)
Based on information from the Rabaul Volcano Observatory, the Darwin VAAC reported that low-level activity continued from Tavurvur volcano at Rabaul caldera through 4 November. Ash emissions occurred at long, irregular intervals and remained below ~3 km a.s.l.
Source: Darwin Volcanic Ash Advisory Centre (VAAC)
An eruption on 20 October from Tavurvur volcano took place at Rabaul caldera. The head of RVO stated that rocks were thrown 700 m from the summit and no lava was erupted. Ash from the eruption caused Tokua airport flights to be suspended on 22 October. It reopened on the 27th, with two flights permitted during the day. Reopening the airport was possible because ash from the eruption shifted away from it. Several small explosions occurred after the 20 October eruption and sent ash clouds to 4 km a.s.l. On the 28th RVO stated that a major increase in volcanic activity seemed unlikely.
Sources: Darwin Volcanic Ash Advisory Centre (VAAC); Pacific Island Report; Reuters
According to the Darwin VAAC, a large explosion occurred at Rabaul caldera on 20 October at 1347. They did not specify whether the eruption occurred from Tavurvur or Vulcan volcano. The eruption produced a thick, dark, ash plume that rose to ~3 km before dispersing to the N and NW. No ash was visible on satellite imagery due to meteorological clouds in the vicinity. The VAAC reported that similar explosions were expected to continue for the next couple of days. On the 23rd ash was visible at a height of ~3.6 km a.s.l.
Source: Darwin Volcanic Ash Advisory Centre (VAAC)
During 11-24 February volcanic and seismic activity were low at Rabaul's post-caldera cone, Tavurvur. Only white vapor was released from Tavurvur; emissions were blown to the SE and E resulting in vegetation being killed in the town of South Daughter (~2 km to the E). The Rabaul Volcanological Observatory stated that this suggests volcanic gases such as SO2 were being emitted.
Source: Rabaul Volcano Observatory (RVO)
During 8-14 October summit activity at Tavurvur, a stratovolcano of the Rabaul Caldera, remained low and was dominated by weak-to-moderate emissions of white vapor. Low-frequency volcanic earthquakes continued to occur, but their number and size were relatively low. No significant ground deformation was detected.
Source: Rabaul Volcano Observatory (RVO)
During 10-30 September summit activity at Tavurvur, a stratovolcano of the Rabaul Caldera, was very low. During the report period very small-to-moderate amounts of steam were emitted from the active vent and low-frequency volcanic earthquakes decreased. After the 11th seismic activity was relatively low, except for a slight increase on the 16th. Very slow deflation began on 20 September.
Source: Rabaul Volcano Observatory (RVO)
On 28 August very mild ash eruptions began. The eruptions followed an increase in the number and magnitude of low-frequency volcanic earthquakes a few days earlier. Eruptions continued until at least 31 August.
Source: Rabaul Volcano Observatory (RVO) via the Darwin Volcanic Ash Advisory Center
Reports are organized chronologically and indexed below by Month/Year (Publication Volume:Number), and include a one-line summary. Click on the index link or scroll down to read the reports.
Uplift, shallow seismicity continue 10-year increase
"The results of geophysical surveillance in Rabaul caldera since the early 1970's have been forming an intriguing scenario which can be interpreted as the prelude to an eruption.
"Seismic surveillance began in Rabaul in 1940 but it was not until 1967, when a network of seismic stations was installed around the N part of Blanche Bay (figure 1), that a reasonable appreciation of local seismicity became possible. Since that time, the apparent seismicity of Rabaul caldera has consisted essentially of shallow, short-period, volcano-tectonic earthquakes originating from about 6 km to near-surface depths. Other, longer-period, harmonic events of possibly local origin are much less common.
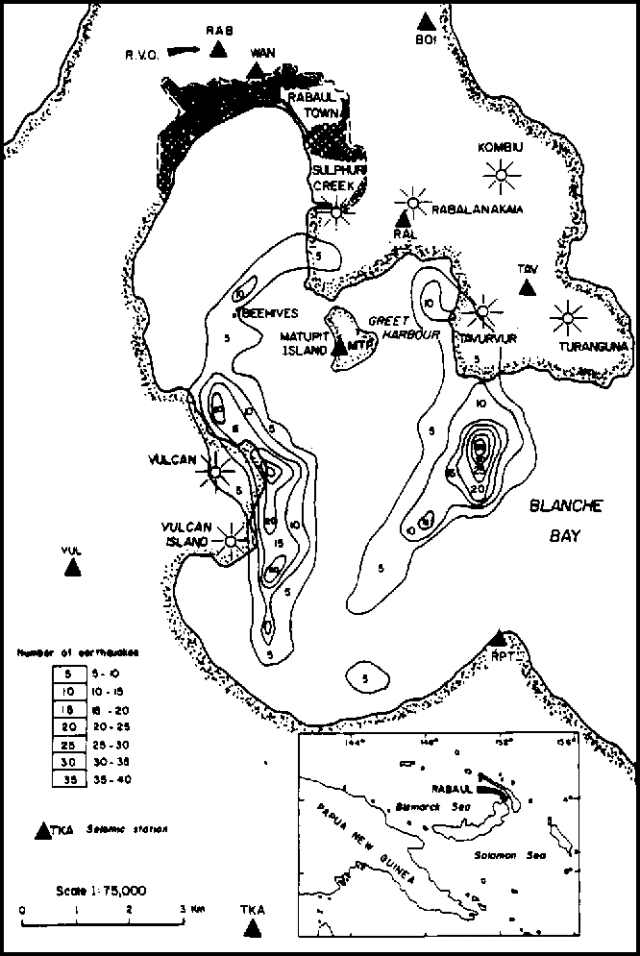 |
Figure 1. Pattern of seismicity in Rabaul Caldera, February 1977-June 1982. Solid triangles represent seismic stations (including the RVO), sunbursts represent volcanic centers. Isoseismal lines show numbers of earthquakes as listed in the table. |
"In the early 1970's, the seismic network was extended S and now consists of 9 stations. As the most sensitive stations of the present network are some of those established in 1967, a consistent appreciation of the frequency of occurence of caldera earthquakes is therefore possible. Between 1967 and 1971 seismicity of the caldera was quite stable and the rate of occurrence of local earthquakes varied from about 20 to slightly more than 100 events per month (figure 2). Since late 1971, distinctly higher numbers of earthquakes have been registered in what have come to be recognized as swarms of caldera earthquakes. Typically, these swarms last for periods of about 10 minutes to several hours in which individual earthquakes may occur at such short intervals that resolution on seismograms is commonly prevented.
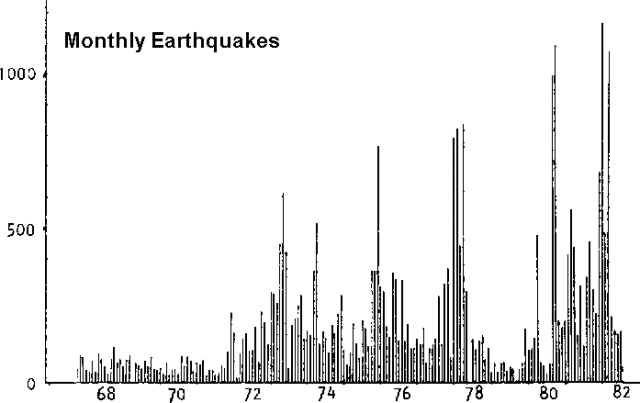 |
Figure 2. Rabaul Caldera seismicity, showing monthly numbers of earthquakes, 1967-82. |
"Figure 2 clearly shows the effects of a number of highly active periods (seismic crises) since 1971, in which sequences of seismic swarms took place. A trend of progressively higher numbers of events in successive seismic crises is discernable. In the two most recent crises, in September-October 1980 and January-March 1982, the strongest earthquakes registered at ML 5.2 and 5.1 respectively.
"A clear picture of the seismically active parts of Rabaul Caldera has emerged for the period 1977-1982, for which computer locations of caldera earthquakes have been obtained. A majority of the events located in this period have been shallow ones within about 2 km of the surface. In practice, the computer-locatable proportion of the total number of detected caldera earthquakes is about 10%, as reliable locations are only achievable when events are registered on five or more stations of the network. A further 10-15% of the total of detected events are registered by the group of three stations MTP, RAL, and TAV, (figure 1) suggesting that these (smaller) events originate from the Greet Harbour area.
"The broad pattern of Rabaul caldera seismicity is seen to be two arcuate zones, near the mouth and in the W part of Blanche Bay. A markedly elongated concentration of seismicity skirts the headland formed by the historically active Vulcan-Vulcan Island volcanoes (active 1878 and 1937), and an intense zone of seismicity lies about 3 km S of Tavurvur volcano, also active historically (1767(?), 1791, 1878, 1937, and 1941-43). Other distinct concentrations within the main seismic zones lie near the Beehives and in the Greet Harbour area. The shape of the main zones combined could be linked to a major, caldera-modifying eruption about 1300 BP; that is, the seismicity may define the fault(s) along which caldera deepening or widening took place. In addition, there appears to be an intimate relationship between the most recently active volcanoes in the caldera and some of the concentrations of seismicity. The most notable of these associations is in the Vulcan-Vulcan Island area, and weaker seismic zones appear to be related to Tavurvur (Greet Harbour) and the Beehives. The zone of strongest seismicity, near the entrance to Blanche Bay, is not closely associated with any well-known centres, although there is some evidence suggesting the possible existence of several submarine volcanoes nearby. Some clarification of these relationships and interpretations is provided by the results of deformation studies.
"The methods used to monitor deformation in Rabaul caldera include routine tiltmetry, optical levelling, gravity measurements, and sea level monitoring. Remarkable deformation in the Sulphur Creek-Matupit Island area has been monitored closely since 1973, principally by optical levelling and gravity techniques. Since 1973, the S end of Matupit Island has been uplifted almost 1 m. Figure 3 shows the results of optical levelling surveys carried out since 1973 along a line from a stable bench mark (BM 21) near Rabaul Observatory to Matupit Island. It appears that along this level line, elevation changes are only significant S of Sulphur Creek. Other incomplete levelling data on stations immediately N and 1-2 km E and SE of Greet Harbour indicate that over the same time interval, minor uplift, probably less than 10 cm, has occurred in these areas. However, significant uplift is believed to have taken place at the SW coast of Tavurvur volcano. Partial contours defining these changes indicate that the focus of uplift probably lies S of the entrance to Greet Harbour. Results from dry tiltmetry around Greet Harbour since early 1981 and measurements from a spirit level tiltmetry at TAV seismometer site since early 1972 confirm the existence of an uplift source in this area. Dry tilt data from a station on the S end of Matupit Island indicate a current rate of uplift (to the SE) of about 4-8 µrad per month. Level and gravity results from the W and S shores of Blanche Bay indicate relatively minor uplift there.
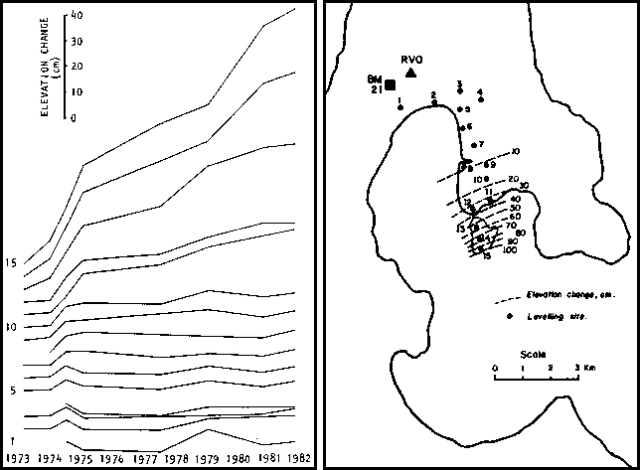 |
Figure 3. Elevation changes at Rabaul, 1973-82, S of RVO. left Map showing gravity network stations used as leveling sites and partial contour lines of elevation changes relative to stable benchmark BM 21. right Results of optical levelling on gravity network stations. Elevation changes for each station are relative to the first measurement for each station (left end of each line) and can be read from the vertical scale in the upper left corner. |
"The localized nature of the strongly deformed area is indicative of a shallow source of inflation. Preliminary determinations, comparing the uplift over different time intervals, suggest a focal depth of about 1-3 km. A noteworthy feature of the level changes shown in figure 3 is the steady rate of deformation. These aspects of the uplift suggest that the focus of the deformating source is relatively static in a vertical sense and that the deformation may be due to enlargement of the source.
"The developments in seismicity and deformation in Rabaul caldera appear ominous, although the rate of change in each of these parameters is steady, indicating a slowly evolving situation. It appears that uplift of Matupit Island was taking place before the regular program of gravity and levelling surveys commenced in 1973, but the time of onset of this effect is not known. A tiltmeter at Rabaul Observatory underwent a net change of about 40 µrad of southwards uplift between 1964 and 1981, but a tiltmeter at Sulphur Creek, much closer to the present focus of deformation, has shown a complex record of SW uplift since its installation in 1972. The seismicity has a much clearer history, with unequivocal changes commencing in late 1971.
"Significantly, the centroid of the two arcuate seismic zones has a similar location to the epicentre of the deformation. It could be concluded that the seismic zones outline a rising area in agreement with the known deformation. A possible cause for this apparently related activity could be accumulation of magma at shallow depth beneath the centre of Blanche Bay. This may eventually lead to an eruption."
Further Reference. Cooke, R.J.S, 1977, Rabaul Volcanological Observatory and geophysical surveillance of the Rabaul volcano: The Australian Physicist, Feb. 1977, p. 27-30.
Information Contacts: C. McKee, RVO.
Earthquake swarms and uplift at intracaldera cone
An exponential increase in seismic activity in Rabaul caldera began in late August and culminated in an intense crisis with 621 earthquakes on 19 September. The strongest event had an ML of 4.2. Since then seismicity has remained high at 40-120 events per day and has included several minor crises. The total number of caldera earthquakes in September was 2,135, a significant increase over the previous highest monthly totals of 1,170 and 1,079 in January and March 1982.
"The earthquakes have been concentrated at depths of 0-3 km near Tavurvur Volcano, a small post-caldera cone on the E section of the elliptical caldera bounding fault, but other sections of this fault have also been seismically active (07:8-9).
"Tilt measurements showed distinct uplift centered 1.5 km S of Tavurvur. Uplift commenced in early September in relation to increasing seismicity. A sharp tilt change of up to 49 µrad accompanied the seismic crisis of 19 September, but tilt rates have since returned to normal. The depth and increase in volume of the source of ground deformation are estimated to be about 1.7 km and 1.9 x 10² m3."
Information Contacts: C. McKee, RVO.
Large increases in seismicity and ground deformation
"Further dramatic increases in seismicity and ground deformation rates took place in October. The total number of caldera earthquakes for the month was 5198, about 2.5 times the total for September and about 35 times the average monthly total since the last peak of activity in March 1982. A large proportion of events occurred in seismic crises on 15-16 October (daily earthquake totals of 868 and 305) and 28-29 October (daily totals of 338 and 513 events). The strongest earthquakes had magnitudes (ML) of about 4, and subterranean rumblings accompanied many of the felt events. The earthquakes continued to be concentrated in the E and NE parts of the caldera at depths of about 0-3 km.
"Tilt measurements showed maximum values around Tavurvur Cone in the NE part of the caldera. Tilts of up to about 20 µrad accumulated gradually until the seismic crisis at the end of the month, when step-wise changes of up to about 40 µrad were measured. Ground cracks were found on the W flank of Tavurvur after the seismic crisis of 28-29 October.
"Interpretation of the tilting using a point-source model indicates that the centre(s) of deformation could be immediately offshore about 1 km below the SW flank of Tavurvur. The increase in volume of the deforming source(s) is estimated to be of the order of 1 x 10⁶ m3."
Information Contacts: C. McKee, RVO.
Increased seismicity prompts stage-2 alert implying possible eruption within a few months
"A stage-2 volcano alert, implying a possible eruption within a few months, was declared by the RVO on 29 October, in response to the increased seismic activity and ground deformation in September and October.
"In November the seismic activity continued to intensify but the rate of ground deformation remained the same. The total number of caldera earthquakes for the month was 5748, an increase of 550 over October's total. Seismic crises became more common but less intense, occurring on 5, 9, 15, 17, 18, 26, 29, and 30 November. Daily totals of earthquakes on these days ranged from 220 to 538. During the month, there was a linear increase in background seismic activity from about 100-170 events per day. Early in November, earthquakes appeared to be concentrated on the NE part of the caldera, near Tavurvur, but the area around Vulcan, on the W side of the caldera, became active later in the month. The strongest earthquakes had magnitudes of about 3.5.
"The pattern of ground deformation was similar to that seen in the previous 2 months. Dry tilt stations on the NE side of the caldera continued to indicate that the centre of uplift is near the mouth of Greet Harbour. The maximum measured tilt was 43 µrad at a station on the coast of Tavurvur's SW flank. Tilts accumulated gradually during the month at most stations, although an offset of about 10 µrad was recorded at a station on Matupit Island after the seismic crisis of 5 November.
"EDM data from networks newly established in November showed that horizontal movements were near or within noise levels but that slight expansion may have been occurring within about 3 km of the inflationary centre on the NE side of the caldera."
Information Contacts: C. McKee, RVO.
More but weaker earthquakes; deformation slows
"Although the monthly total number of earthquakes was higher than in any of the previous months, the percentage of stronger earthquakes (those with sufficient energy to be recorded by five or more of the nine harbour seismic stations) was lower than in any of the previous months (table 1). The distribution of earthquakes was similar to that in November with the highest concentration in the NE part of the caldera near Tavurvur, but most of these were small, recorded by only the three closest seismic stations.
Table 1. Earthquakes at Rabaul, September-December 1983. 'Stronger' events were recorded by five or more of the nine harbour stations.
| Month | Earthquakes | % Stronger |
| Sep 1983 | 2,135 | 13.3 |
| Oct 1983 | 5,199 | 6.9 |
| Nov 1983 | 5,748 | 4.2 |
| Dec 1983 | 7,117 | 3.8 |
"The maximum measured tilt was 17 µrad, by the station on the coast, on Tavurvur's SW flank. Tilts again accumulated gradually throughout the month, and no offsets were associated with any of the minor swarms of harbour earthquakes. Ground deformation rates were less than half those in November, and indications are that there was considerably less energy release in December than in any previous month during the current crisis.
"It is still too early to determine whether the decrease of unrest in the Rabaul Caldera in December is just temporary, or marks the onset of a longer-term improvement in the situation."
Further Reference. McKee, C.O., Lowenstein, P.L., de St. Ours, P., Talai, B., Itikarai, I., and Mori, J., 1984, Seismic and ground deformation crises at Rabaul Caldera: prelude to an eruption?: BV, v. 47, p. 397-411.
Information Contacts: P. Lowenstein, RVO.
Earthquakes, tilt indicate magma intrusion; eruption more likely within next few months
"There was a marked increase in the amount of unrest in Rabaul Caldera during January, with a total of 8,372 volcanic earthquakes recorded, an increase of 1,255 over the December total.
"A major seismic crisis took place on 15 January when 942 earthquakes occurred, including several strongly felt events. The maximum magnitude earthquake (ML 4.9) was accompanied by underground rumbling sounds. This crisis was accompanied by a maximum tilt change of 32.5 µrad at [a station immediately N of Greet Harbour] . . . .
"The overall distribution of earthquakes in January was similar to that in December, with high concentrations on the NE (Greet Harbour) and W (Karavia Bay) sides of the harbour. . . . Steady inflation of the Karavia Bay and Greet Harbour magma reservoirs continued throughout the month. . . .
"As a result of the increased activity in January, a warning was issued to the authorities to the effect that the eruption, which was previously thought to be only a possibility when the Stage-2 volcanic alert was declared on 29 October, was now much more likely to occur within the next few months."
Information Contacts: P. Lowenstein, RVO.
Seismicity intensifies, tilt rates increase
"Seismicity in Rabaul caldera showed a further intensification in February. Although the total number of volcanic earthquakes recorded (8339) was slightly lower than in January (8372), there were more stronger events in February. The entire caldera seismic zone was active during the month. However, seismicity was concentrated in the NE, N, and W parts of the caldera. Seismic crises took place on 1, 5, 7, 8, 11, 12, 13, 18, and 27 February, the most energetic on the 7th, 13th, and 18th, affecting the NE, N, and W parts of the caldera, respectively. The strongest caldera earthquake in these crises was a magnitude (ML) 4.3 event on the 18th.
"An interesting development in February was the increase in rates of tilting around Vulcan cone on the W side of the caldera. The tilt change at 1 station immediately SW of Vulcan was about 40 µrad, about four times the tilting seen there in January. By contrast, tilting around Greet Harbour in the NE part of the caldera was reduced compared with that of January, and the pattern of tilts there was more complex. Relatively minor tilting occurred during seismic crises. The largest crisis-related tilts were about 15 µrad near Vulcan.
"EDM data over the last 3 months show that significant horizontal deformations are taking place at Rabaul and are most pronounced in the Greet Harbour area. Extension of about 60 µrad (change in length divided by original length x 106) has occurred across Greet Harbour in this period. There is no evidence of widespread horizontal movements."
Information Contacts: C. McKee, RVO.
Seismicity continues to intensify; deeper, stronger earthquakes; 2 seismic crises
"Seismicity continued to intensify in March. The total number of caldera earthquakes was 8,729, as compared to 8,339 in February. More significant than actual numbers of earthquakes, however, was the continued increase in the proportion of stronger earthquakes. This change appears to be related to the increased incidence of somewhat deeper (2-4 km), more energetic earthquakes in the Vulcan area. The remainder of the caldera seismic zone continued to be active, highlighted by the usual strong concentration of very shallow, relatively low-energy events under the W flank of Tavurvur.
"Major seismic crises took place on 3 and 25 March. The totals of caldera earthquakes on those days were 932 and 726, respectively. The crisis of 3 March involved the E part of the caldera seismic zone, at the mouth of Blanche Bay, and included an event of ML 5.1. Strong ground deformation was associated with this crisis. Tilts of up to about 50 µrad indicated inflation centred near Sulphur Point at the mouth of Greet Harbour. [Horizontal distance measurements near the time of the crisis were affected by movement of one of the caldera rim base stations.] After this crisis, expansion of Greet Harbour resumed at the same rate as before, about 25 microstrain per month. The crisis of 25 March was centred immediately NE of Vulcan, and the strongest earthquake was an ML 3.7. Water spouts up to about 3 m high were observed briefly near the NE shore of Vulcan during this crisis. No significant ground deformation accompanied the seismicity.
"Five levelling surveys carried out between late November 1983 and mid-March 1984 showed that the area of maximum measured uplift in the caldera is at the S end of Matupit Island. The rate of uplift in this period was steady at about [50 mm] per month. This compares with an uplift rate of about [8 mm/month] for the period 1973-1983."
Information Contacts: C. McKee, RVO.
Caldera earthquakes up 60%, two seismic crises; expansion and uplift double
"A further intensification of seismic activity took place in April. The total number of caldera earthquakes was 13,749, 60% more than in March. Seismicity was concentrated on the E side of the caldera, in Greet Harbour and at the entrance to Blanche Bay.
"Major seismic crises occurred on 21 and 22 April, when 1,011 and 1,717 events were recorded. The crisis on the 21st was centred at the mouth of Blanche Bay, and the strongest earthquake was a magnitude (ML) 3.6 event. Only minor ground deformation was associated with this crisis.
"On the 22nd at 1100 an ML 4.8 earthquake heralded the most energetic crisis to date, which was centred at the head of Greet Harbour. Structural damage in this and the Sulphur Creek area included cracking, and in one case collapse, of masonry walls, cracks in concrete floors, a burst water main, and burst household water tanks. Tilts around Greet Harbour ranged from 30 to 50 µrad, generally showing a pattern of radial inflation centred in the harbour. Measurements of horizontal deformation indicated expansion of the Greet Harbour area by 20-30 microstrain.
"The overall pattern of ground deformation in April indicated that the strongest tilting, of up to 80 µrad, was in the Greet Harbour area. Rates of horizontal deformation indicated expansion was about double that in any previous month (40-50 microstrain).
"Levelling surveys from Rabaul Township to Matupit Island and around Greet Harbour showed that between mid-March and mid-April the S end of Matupit Island rose 76 mm. Further uplifts of about 50 mm on Matupit Island and at the head of Greet Harbour accompanied the 22 April seismic crisis, making the total uplift in April about double that in any previous month."
Information Contacts: C. McKee and P. Lowenstein, RVO.
Seismicity declines; two earthquake swarms, one crisis
"Overall, a substantial decline in seismicity took place in May. The total number of earthquakes was 8,939, compared to 13,794 in April.
"Following the intense seismic and deformation crisis of 21-22 April, seismicity decayed exponentially and by mid-May the daily earthquake totals were averaging about 215. Small swarms of volcanic earthquakes that occurred on 4 and 27 May were followed by a major seismic and deformation crisis on 29 May. The earthquake swarms affected the NW part of the caldera seismic zone on the 4th and the Greet Harbour area on the 27th, but no significant ground deformation accompanied them.
"The seismic crisis of the 29th was centered near Vulcan; the main event had a magnitude (ML) of 3.8. An unusual feature of this crisis was that deflation of up to about 30 µrad accompanied the seismicity in the Vulcan area and that apparently aseismic inflation of the same magnitude took place at the head of Greet Harbour. Levelling measurements about 1 week after the crisis indicated maximum uplift of 43 mm at the S end of Matupit Island.
"The main features of ground deformation before the crisis of the 29th were mild steady inflation (10-20 µrad) immediately SE of Vulcan, deflation (up to 40 µrad) and slight subsidence (a few mm) near Rapindik at the head of Greet Harbour, and uplift of Matupit Island (about 41 mm at the SE coast). Horizontal deformation continued unchanged throughout May.
"The effects of the crisis of the 29th suggested direct interplay between different parts of the caldera. It is noteworthy that eruptions occurred simultaneously at Vulcan and Tavurvur in 1878 and 1937, and that disturbances along a line connecting these two centres were also observed at the same time."
Information Contacts: C. McKee, RVO.
Seismicity declines; deformation continues
"Overall, June was a relatively quiet month. A further decline in seismicity took place. The total number of earthquakes for the month was 5,304, and average daily earthquake totals were steady at about 160. The only perturbation to the steady rate of seismic energy release was a swarm of earthquakes in the Greet Harbour area on 25 June. The total number of earthquakes that day was 450, and the largest event had a magnitude (ML) of 2.8. No significant ground deformation accompanied this seismicity.
"Uplift continued throughout June in the Matupit Island-Greet Harbour area, but at variable rates. Between 23 May and 6 June the S end of Matupit Island rose 43 mm. From 6 to 26 June uplift in the same area was only 10 mm. Inflationary tilt around Greet Harbour persisted but at a reduced rate, with maximum changes of 20 µrad at Sulphur Point and Rapindik. Slight deflationary tilt occurred in the Vulcan-Karavia Bay area, with a maximum change of 20 µrad at Karavia. Horizontal distance measurements across Greet Harbour indicated E-W expansion at the same rate as previously, but a decline in the rate of N-S expansion."
Information Contacts: C. McKee, RVO.
Seismicity declines; deformation increases
"Seismicity continued to decline in July, but some parameters of ground deformation showed an increase after a lull in June.
"The total number of caldera earthquakes for July was 4,404, compared to 13,794 in April, 8,936 in May, and 5,304 in June (figure 4). Daily earthquake totals were fairly steady, ranging from 56-280. Two small swarms of earthquakes, including one or two felt events, took place 10 and 13 July (figure 5). The swarm on the 10th occurred in the Vulcan-Karavia Bay area, while the one on the 13th was restricted to the Vulcan area. However, the total numbers of earthquakes on these days were 193 and 280, only slightly above background. Neither of these swarms was accompanied by ground deformation.
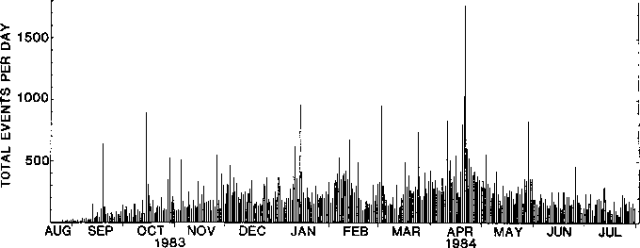 |
Figure 4. Number of earthquakes per day at Rabaul Caldera, August 1983-July 1984. |
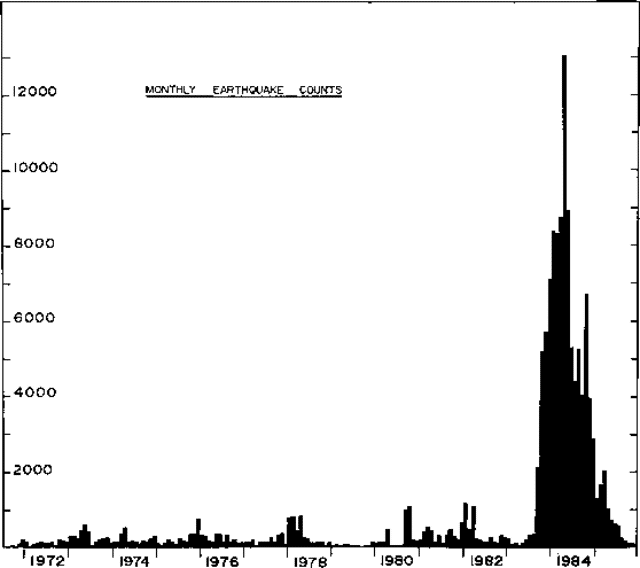 |
Figure 5. Monthly earthquakes totals at Rabaul Caldera, 1971-85. |
Although some parameters of ground deformation tended to be stronger in July than in June, none of them showed above average rates of change. Levelling measurements carried out in the last week of July indicated 38 mm of uplift at the S end of Matupit Island since late June. Only 10 mm of uplift occurred in this area 6-26 June. Horizontal distance measurements indicated a return to fairly uniform expansion across Greet Harbour, at rates of about 20-25 ppm per month. In general, tilt changes were smaller in July than in June, with most tilts less than 8 µrad. However, the station at the NW shore of Greet Harbour continued to show inflation to the SE (in Greet Harbour) at a rate of about 20 µrad per month. The pattern of tilts indicated continued weak inflation of the Vulcan and Greet Harbour areas."
Information Contacts: C. McKee, RVO.
Earthquake swarms and slow inflation continue
"The state of unrest continued in August at about the same level as in July. The total number of earthquakes for the month was 5,285, compared to 8,938 in May, 5,304 in June, and 4,404 in July. But the total [seismic energy] release was about [2.4 x 10¹⁶] ergs, compared to [1.4 x 10¹⁷] in May, [1.9 x 10¹⁵] in June, and [1.3 x 10¹⁷] in July. [These and subsequent energy release values for Rabaul have been corrected by RVO.]
"Seismicity in August was concentrated in the N half of the caldera seismic zone with a crisis consisting of 628 earthquakes, including a magnitude 3.4 event, on 3 August. Six smaller earthquake swarms took place in the Greet Harbour area, one on 11 August, and five in the period 25-27 August.
"None of the seismic activity was accompanied by any sudden ground deformation changes. Ground deformation measurements showed continuing slow inflation mainly in the Matupit-Greet Harbour area at a similar rate to that in July. The maximum measured vertical uplift at the SE end of Matupit Island was about 35 mm, and expansion across Greet Harbour amounted to about 10-20 ppm.
"Most of the evidence obtained in the past 2 months suggests that the volcano has settled into a fairly steady and linear rate of progress toward the anticipated eruption. In the absence of any unexpected changes, the situation could continue at the present rate for several months to a few years before an eruption occurs."
Information Contacts: C. McKee, RVO.
Seismicity, ground deformation rates decline
"Declining seismicity and rates of ground deformation were evident in September. The total number of caldera earthquakes for the month was 4048 and the seismic energy released amounted to about [8 x 10¹⁴] ergs (compared to 5,285 earthquakes and about [2.4 x 10¹⁶] ergs in August).
"Seismicity was concentrated in the N part of the caldera seismic zone. Measured vertical uplift continued to be greatest along the SE coast of Matupit Island. However, the maximum uplift in September was only 14 mm (compared to 35 mm in August). Tilt and horizontal distance measurements continued to indicate slow steady inflation and expansion in the Greet Harbour area."
Information Contacts: C. McKee, RVO.
Large earthquake swarm accompanied by rapid uplift
"Seismicity and rates of ground deformation reintensified in October. The total number of caldera earthquakes for the month was 6749, and seismic energy released was [5.5 x 10¹⁸] ergs.
"The increased level of activity was due mainly to a seismic and ground deformation crisis on 18 October. The seismicity was concentrated in the Blanche Bay area and included four moderate-to-strong earthquakes (ML 4.9, 3.6, 3.35, and 3.3). The seismic energy released during the crisis amounted to . . . about 90% of the month's total seismic energy. Tilt changes measured soon after the crisis indicated a deformation source immediately offshore (W) from Sulphur Point, at the N edge of Blanche Bay. The maximum measured tilt change was about 90 µrad. Using a point-source model, the deformation source was calculated to be about 1.2 km deep, and the volume change at the source about 1 x 10⁶ m3. The uplift at Sulphur Point was about 100 mm. The ground deformation associated with the crisis was very localized. At the SE coast of Matupit Island, about 1.5 km from the deformation source, the uplift was only 33 mm; at the N shore of Greet Harbour, about 2.5 km away, it was only 5 mm. No marked horizontal deformation took place in association with the crisis.
"In addition to the crisis on the 18th, there were a number of seismic swarms and a few moderate-to-strong discrete earthquakes. The most notable was a swarm at Greet Harbour on 8 October (maximum ML 3.8), a moderate-to-strong earthquake (ML 3.8) at the entrance to Blanche Bay about 10 hours after the crisis on the 18th, and seismic swarms from around the Vulcan headland on 24 (maximum ML 2.8) and 26 October (maximum ML 3.2).
"Most of the October ground deformation took place on the 18th, but tilting and uplift continued at a reduced rate around Greet Harbour for the remainder of the month. An offset of about 25 µrad was registered at one station on Vulcan after the seismic swarm on the 26th. The maximum ground deformation recorded for the month was 130 µrad of tilt and 100 mm of uplift at Sulphur Point. Horizontal deformation was mostly insignificant, although a distinct N-S dilation was evident at the mouth of Blanche Bay. This was due largely to a northward shift (about 50 mm) of Sulphur Point."
Information Contacts: C. McKee, RVO.
Activity declines; alert reduced to Stage 1
"The level of activity subsided again following the seismic and ground deformation crisis on 18 October. Caldera seismicity in November consisted of 3,985 earthquakes with total energy of about [6 x 10¹⁵] ergs (maximum ML, [2.9]). Most of the energy was released during small swarms on 6, 8, 10, 18, 19, and 27 November. Seismicity was concentrated in the N half of the caldera seismic zone. Meanwhile, ground deformation measurements reflected slow steady inflation at both shallow magma reservoirs, under the mouth of Greet Harbour and immediately E of Vulcan. In the Greet Harbour area, maximum uplift was 19 mm, maximum tilt was 30 µrad, and maximum horizontal strain was 20 ppm.
"In view of the general decrease in activity at Rabaul since the beginning of June 1984, the RVO advised government authorities on 22 November that the situation was considered to have returned to a stage-1 volcanological level of alert in which the anticipated eruption is not now expected to occur before several months to a few years."
Information Contacts: C. McKee and P. Lowenstein, RVO.
Seismicity decreases; moderate deformation persists
"A further decrease in activity was evident in December. Seismicity reached its lowest level since the beginning of the current crisis period in August 1983. Seismic energy release for the month was [1.3 x 10¹⁵] ergs; 2,887 earthquakes were recorded. The largest earthquake for the month was an ML 2.5 event that was part of a small seismic swarm in the Vulcan area on 22 December. The month's seismicity was concentrated in the Vulcan-Matupit Island area. A mild rate of ground deformation persisted. The greatest changes were in the Greet Harbour area, where the maximum tilts were about 20 µrad on each side of the mouth of the harbour."
Information Contacts: C. McKee, RVO.
Seismic activity, ground deformation at low levels
"Activity at Rabaul remained at a low level in January and February. Monthly caldera earthquake totals were 1,297 and 1,672, and seismic energy outputs were about [4.4 x 10¹⁴] and [3.4 x 10¹⁵] ergs. In January the strongest earthquake was an ML [2.3] event on the 25th, and only six events had magnitudes exceeding 2.0. The strongest earthquake in February was an ML 3.0 event on the 24th, and 13 events had magnitudes exceeding 2.0. January's seismicity was concentrated in the Tavurvur and Sulphur Creek-Matupit Island areas, while in February, seismicity was strongest in the Vulcan-Matupit Island area and at the head of Greet Harbour.
"Mild ground deformation continued, with changes being above uncertainty levels only in the Greet Harbour area. The largest tilt and horizontal distance changes were of the order of 15 µrad and 10 ppm per month. Levelling completed at the end of January showed maximum uplift since early December of only 15 mm at the S end of Matupit Island. This is only slightly higher than the average pre-crisis uplift rate from 1971-83."
Information Contacts: C. McKee, RVO.
Moderate seismic and deformation crisis after several months of decreased activity
"After about 4 1/2 months of relatively low activity, a moderate seismic and deformation crisis took place in Rabaul Caldera on 3 March. The part of the caldera affected was the region between Davapia Rocks and Rabalanakaia Volcano (figure 6). The strongest earthquake was an ML 3.6 event; altogether there were six earthquakes of M 3 or greater. More than 600 small earthquakes were also detected, most less than 2 km deep. Associated measured ground deformation was mild; the largest tilt change was 16 µrad at the NW shore of Greet Harbour, and no significant changes were noted in EDM lines across the affected area.
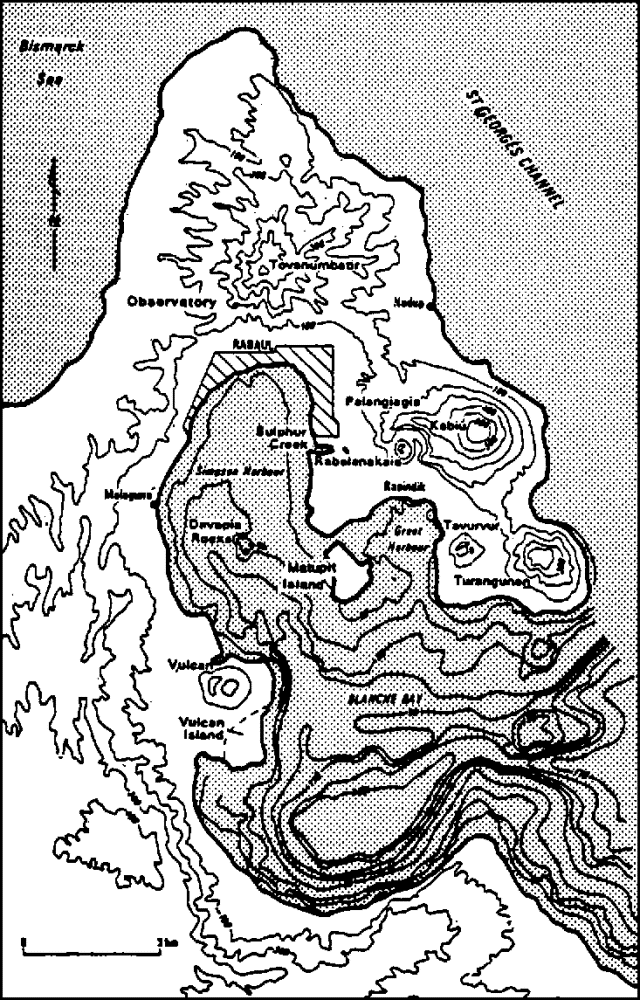 |
Figure 6. Topography and bathymetry of Rabaul Caldera, including intracaldera and satellite cones. Contours on land are in meters and isobaths are in fathoms, at about 37 m intervals. After McKee and others, 1983. |
"Apart from the crisis, activity was at low levels in March. The total number of earthquakes for the month (including the crisis of the 3rd) was 2,052, and the average background number of events was 45 per day. The seismic energy output was about [6.9 x 10¹⁶] ergs, most released during the crisis. The Matupit Island-Greet Harbour area continued to be the focus of ground deformation, with the largest tilts about 30 µrad at Sulphur Point. Levelling carried out 11-18 March indicated that since the previous survey (21-29 January) greatest uplift (45 mm) had taken place at the S end of Matupit Island. Maximum rates of horizontal deformation continued to be about 10 ppm per month."
Reference. McKee, C., and others, 1983, Rabaul Caldera, Papua New Guinea: Volcanic hazards and eruption contingency planning: Geological Survey of Papua New Guinea Report 83/17, 38 p.
Information Contacts: C. McKee, RVO.
Seismicity declines and tilt slows
"A very low level of activity prevailed in April. The total number of caldera earthquakes in April (1041) is the lowest monthly total for the whole crisis period (starting September 1983). The seismic energy output was only about 6 x 10¹³ ergs and the strongest caldera earthquake was only ML 2.1. Seismicity was concentrated in three areas within the caldera seismic zone: at the entrance to Blanche Bay, around the Vulcan headland, and in the NE part of Greet Harbour.
"Rates of ground tilt were barely above noise levels. The biggest tilt changes, about 6 µrad, were recorded at stations around Greet Harbour. Maximum rates of horizontal deformation continued to be about 10 ppm per month, near the entrance to Greet Harbour."
Information Contacts: C. McKee, RVO.
Regional earthquakes cause caldera swarm
"Generally low levels of volcano seismicity and ground deformation have prevailed since the 3 March crisis. However, two recent major regional earthquakes, both magnitude 7.1 (ML), caused strong ground movements at Rabaul: intensities were MM V on 10 May and MM VI-VII on 3 July. The 10 May event triggered a swarm of caldera earthquakes. During the following 5-hours, over 100 caldera earthquakes were recorded, mainly from the Vulcan area. The largest was a magnitude 3.7 (ML) earthquake about 1 hour after the regional event. There was little measurable ground deformation associated with this seismic swarm. No comparable caldera seismic response was detected following the 3 July regional earthquake, suggesting that rates of stress accumulation in the caldera are low. However, a close watch will be maintained for any long-term effects of the present intensified regional seismicity on the Rabaul volcano.
"Monthly caldera earthquake totals were 710 in May and 644 in June. In May, the pattern of seismicity was dominated by a broad zone of activity in the Vulcan area with a clustering of events at the E extremity of the Vulcan Headland. In June, events were scattered around the caldera seismic zone with no strong concentrations. The caldera seismic energy output for the two-month period was about [6 x 10¹⁶] ergs, most of which was related to the seismic swarm induced by the central New Britain earthquake of 10 May.
"Horizontal distance measurements have continued to show gradual rates of change, the maximum about 10 ppm per month in the Greet Harbour area. Levelling measurements carried out between 8 and 10 May showed that uplift rates were low since the previous survey in mid-March. The largest change in this two-month interval was 13 mm at the S end of Matupit Island. Since the March crisis, maximum monthly tilt rates have been generally low, ranging from about 6-17 µrad per month. The area of biggest tilt changes has continued to be around Greet Harbour. In June a higher tilt rate (30 µrad per month) was recorded at the NW shore of Greet Harbour, but the significance of this is uncertain at present."
Information Contacts: C. McKee, RVO.
3 July earthquake causes caldera deformation
"On 3 July, a major regional earthquake (ML 7.1) in S New Ireland (about 80 km from Rabaul) caused large local ground deformations in Rabaul caldera. The main effects were tilt offsets of up to several hundred µrad. Tilt changes were greatest at the mouth of Greet Harbour. At Sulphur Point and the SE end of Matupit Island, tilt on the day of the earthquake may have reached 330 and 120 µrad, respectively. The tilt vectors at these locations and those of much smaller deformations at the head of Greet Harbour appear to radiate outward from a point near the mouth of the harbour. Tilting also occured on the Vulcan headland in response to the 3 July earthquake. Tilts of about 45-50 µrad were registered at two stations in the W-central and SE parts of the headland, but other nearby tilt stations showed only minor changes, and no clear pattern of tilt was evident. Other ground deformation measurements (levelling and EDM) did not show any notable changes associated with the earthquake.
"It is uncertain what significance should be attached to the fact that the earthquake-induced tilting in the Greet Harbour area conforms to some extent with effects produced by processes purely internal to the caldera. Such large tilt changes might be expected to have been accompanied by caldera seismicity, but as far as we know the caldera did not respond seismically to the 3 July earthquake. This contrasts with the effects of the [10] May earthquake, which included a seismic swarm and minor tilt changes in the Vulcan area. The apparently aseismic nature of the deformation on 3 July may be an indication of merely local surface movements.
"Apart from the effects of the 3 July earthquake, a low level of activity prevailed in Rabaul caldera in July. The total number of caldera earthquakes for the month was 595, down from 639 in June. A decrease in the daily rate of earthquakes was noted, from about 25 per day during the first half of the month to about 8 per day in the last week of the month. Caldera earthquakes were concentrated in the Rapindik area, immediately N of Greet Harbour. There were no strong caldera earthquakes in July; the strongest events had magnitudes (ML) of less than 2.
"Levelling measurements along the line from Rabaul town to Matupit Island in late July showed that uplift in the caldera was continuing at a low rate. The greatest change since the previous survey in May was 26 mm at the SE coast of Matupit Island. This change indicates a rate of uplift probably similar to the pre-crisis rate if some of the uplift was associated with the 3 July regional earthquake.
"Horizontal distance measurements indicated continuing slow dilation in the caldera, with the greatest changes (5-10 ppm per month) occurring in the Greet Harbour area.
"Tilt changes after the 3 July earthquake were evident in the Greet Harbour area and at one station on the Vulcan headland. The largest changes were about 43 µrad about 1 km SW of the Vulcan cone and about 23-33 µrad at the mouth of Greet Harbour. These tilt changes accumulated at an exponentially decreasing rate and are believed to be related to the earthquake-induced tilting on 3 July.
Information Contacts: C. McKee, RVO.
Seismicity declines to pre-crisis levels; tilt slows
"Activity showed a further reduction in August, and appeared to be at pre-crisis levels. The total number of caldera earthquakes for the month was 236, as compared to 595 in July. The located earthquakes were mostly from the N part of the caldera seismic zone, and an unusual concentration of events was detected 1-2 km N of that zone. Tilt measurements generally showed a continuation of the exponentially decreasing tilts observed following the New Ireland earthquake of 3 July. Steady, slow dilation (up to 10 ppm per month), centred near the mouth of Greet Harbour, continued to be observed by horizontal distance measurements."
Information Contacts: C. McKee, RVO.
Seismic activity declines; deformation slows
"Seismic activity, which had returned to pre-crisis levels in August, continued to decline. A total of 176 events were recorded in the caldera in September compared to 236 in August. Tilt changes continued to show an exponential decrease following the large change at the time of a strong regional earthquake on 3 July. Levelling and horizontal distance measurements showed insignificant changes."
Information Contacts: J. Mori, RVO.
Declining seismicity and deformation
Seismicity and ground deformation continued to decline at Rabaul.
Information Contacts: P. Lowenstein, RVO.
Seismicity and deformation continue to decline
"Seismicity and ground deformation rates were in further decline from previous months. The total number of caldera earthquakes in November was 115, of which only one was locatable. On 26 November, no caldera earthquakes were recorded for the first time since 24 May 1983. Ground deformation was minimal."
Information Contacts: B. Talai, RVO.
Seismicity continues to decline
"Seismicity continued to decline in December with only 48 events of small magnitude (ML 0.5), compared to 115 events in November. Levelling 11 and 12 December showed consistent subsidence on Matupit Island for the first time since the levelling program was begun in 1973. The southern tip of Matupit Island had dropped 1.4 cm since the last levelling in early October. This may indicate the beginning of a deflationary period within the caldera. There were no significant changes in the tilt, EDM data, or sea level."
Information Contacts: J. Mori, RVO.
Slight increase in seismicity
"Seismicity, although still at a very low level, showed a slight increase in January with 72 events recorded, compared to 48 in December. The total might have been higher if two of the three seismic stations closest to Greet Harbour had been functioning. Ground deformation measurements show that the weak deflationary trend observed late in 1985 appears to have stopped, with possible local reversals."
Information Contacts: P. Lowenstein, RVO.
Seismicity increases
"Seismicity . . . increased further in February, with 317 recorded events. Ground deformation measurements, however, showed only minor uplift (up to 4 mm), with slight inflationary tilt and EDM changes in the Greet Harbour area."
Information Contacts: P. Lowenstein, RVO.
Continued moderate seismicity; tilt changes minor
"Seismicity remained at a moderate level during March, with 223 recorded events. Ground deformation measurements, however, showed only minor tilt and EDM changes in both the Greet Harbour and Vulcan areas."
Information Contacts: P. Lowenstein, RVO.
Strong increase in seismicity
"Seismicity increased markedly in April, when 1,769 events were recorded, almost an order of magnitude greater [than] March. It is the highest monthly total since March 1985 (2,042). This increase was not caused by seismic crises but by fairly consistently higher daily earthquake counts. The strongest event was a ML 2.7 earthquake on 13 April.
"Another unusual feature of Rabaul's April seismicity was the average duration of the events, which increased progressively during the second half of the month. A considerable number of events were located near the centre of the caldera, rather than on the caldera fault zone; many events were shallow. The earthquakes were previously concentrated at depths of 1-3 km, but in April ~30% of located events were <1 km deep.
"Measurements of ground deformation indicated a slight resurgence of inflation in the Matupit Island-Greet Harbour area. Tilt stations in that area showed maximum changes of ~10-12 µrad for the month. The largest horizontal distance changes, ~10-15 microstrain, were across the mouth of Greet Harbour. Levelling measurements showed that the SE part of Matupit Island was elevated 16 mm between 11 April and 7 May.
"At the end of April there was no indication whether the rate of seismic and ground deformation activity was likely to increase or subside. The change in the pattern of seismicity may be significant."
Information Contacts: P. Lowenstein, RVO.
Seismicity remains elevated; slight inflation
"Seismicity remained at a relatively high level in May with 1,532 events. As in April, all of the earthquakes were quite small, the largest being an ML 2.4. In April many shallow events occurred in the middle of the caldera, but May locations show a return to the normal pattern of ring-fault seismicity at depths of 1-3 km.
"Levelling measurements showed 9 mm of uplift at the SE tip of Matupit Island 7-28 May, about half the uplift rate measured in April. Tilt measurements showed small inflationary changes (0-10 µrad) in the Greet Harbour area. Electronic distance measurements showed no significant changes."
Information Contacts: P. Lowenstein, RVO.
Seismicity remains high until late June
"Seismicity remained at a relatively high level in June (1,570 earthquakes) although there were indications of a decline in activity in late June and early July. Ground deformation measurements in June indicated low rates of deformation.
"Despite the relatively high totals of caldera earthquakes in June, daily earthquake totals appeared to be declining during the last week of the month. During the first 3 weeks, daily totals averaged ~40-50 events, but from the 22nd, the daily average was ~20 events.
"Several small swarms of events occurred, notably in the Greet Harbour and Vulcan-Matupit Island areas. For the month as a whole, the pattern of earthquake locations shows concentrations in these areas. The strongest caldera earthquake in June was an ML 1.9 event in the Greet Harbour swarm on the 20th.
"Tilt and horizontal distance measurements indicated that small inflationary changes were continuing in the Greet Harbour area in June. The largest tilt changes, 7 and 5 µrad, took place at the N and SE shores of the harbour. The rate of horizontal deformation was 5-10 microstrain/month.
"Levelling measurements carried out on 25 June from a traditionally stable area near the E caldera wall to the eastern shore of Greet Harbour showed maximum uplift of 18 mm (at Sulphur Point) since 8 January 1986. This indicated relatively low rates of uplift (~3 mm/month) for this period. By comparison the maximum uplift rate on Matupit Island from late January to late May was ~10 mm/month, approximately equivalent to pre-crisis rates.
"Tilt measurements for the period late January to early July in the Greet Harbour area showed maximum inflationary tilts of 28 and 11 µrad at Sulphur Point and Matupit Island respectively. These tilt changes indicate rates of tilting reasonably consistent with the uplift rates."
Information Contacts: C. McKee, RVO.
Seismicity declines moderately, ground deformation low
"Seismicity was at a moderately high level in July with 1,312 events. A seismic swarm in the Sulphur Creek/Beehives/Northern Vulcan area on 12-13 July, included the largest earthquake of the month, an ML 2.5 event. The 227 events counted on the l2th yielded the highest daily total since May 1985. There was also a small swarm on the 8th, in the Beehives/Vulcan area. Toward the end of the month the seismicity appeared to be declining again with 10-20 events counted/day, compared to 20-100/day for the first half of the month.
"Levelling measurements on 29 July showed that Matupit Island continues to rise slowly. Results indicate that the southern part of the island has been uplifted ~15 mm since the last survey on 28 May. This uplift rate of ~8 mm/month is less than that measured during April and May and is approximately equivalent to pre-crisis rates. Horizontal distance measurements showed small inflationary changes of 5-10 microstrain in July. There were no significant tilt changes measured for the month. In summary, ground deformation rates in July remained low (at pre-crisis levels) and seismicity was declining."
Information Contacts: J. Mori and C. McKee, RVO.
Seismicity declines; deformation at pre-crisis level
"Seismicity returned to a low level in August, with 298 recorded events. The rate of earthquake occurrence varied between 3 and 23 events/day. Only 11 were large enough to be located, distributed in the Vulcan and Greet Harbour areas. Tilt and horizontal distance measurements indicated that rates of ground deformation were comparable to those preceding the 1983-85 crisis period."
Information Contacts: P. de Saint-Ours and C. McKee, RVO.
Seismicity and deformation remain at low levels
"Seismicity remained at a low level in September (314 earthquakes). The daily rate of earthquake occurrence varied between 2 and 23 events. Only 25 events were large enough to be located and these were distributed in the Greet Harbour, Blanche Bay, and North Vulcan areas. Ground deformation rates were low in September. Tilt and horizontal distance measurements indicated that rates of ground deformation were comparable to those preceding the 1983-85 crisis period. In summary, all parameters indicated persistence of a low level of activity."
Information Contacts: C. McKee, RVO.
Seismicity and deformation remain at low levels
"Activity remained at a low level throughout October, with 205 recorded small-magnitude earthquakes. The daily occurrence rate varied between 0 and 18 events. Only 12 were large enough to be located, distributed in the Vulcan and Greet Harbour areas.
"Tilt and horizontal distance measurements showed insignificant inflation rates. Levelling measurements showed a maximum of 7 mm uplift at Matupit Island from August to October, and 13 mm uplift at the foot of Tavurvur Cone from July to October."
Information Contacts: P. Lowenstein and P. de Saint-Ours, RVO.
Swarms with strongest earthquake since May 1985
"A small swarm of volcanic earthquakes was recorded from the Blanche Bay area on 25 and 26 November. A total of 112 and 31 events occurred on the two days. A M 3.1 earthquake, the strongest recorded since May 1985, occurred under Blanche Bay near Sulphur Point. No significant ground deformation accompanied the seismic activity. Other than the increases on 25 and 26 November, seismicity remained at a low level; 316 earthquakes were recorded in November. The number of events/day varied from 1 to 22."
Information Contacts: B. Talai and P. Lowenstein, RVO.
Seismicity at lowest level since January 1986
During December, seismicity was at the lowest level since January 1986; 173 small events were recorded. Tilt and horizontal distance measurements showed no significant changes in ground deformation.
Information Contacts: J. Mori and P. Lowenstein, RVO.
Seismicity declines; inflation continues; 1986 summary
Seismicity continued to decline during January; 78 small events were recorded. Ground deformation measurements during January indicated that the slow steady inflation in the Greet Harbour area was continuing. Inflation in 1986 was about the same as that recorded in 1985, and ~1/8 the amount recorded during the active period in 1984. The S tip of Matupit Island rose 61 mm during 1986. Deformation in other parts of the caldera did not show a clear pattern.
Information Contacts: B. Talai and P. Lowenstein, RVO.
Slight increase in seismicity; minor subsidence
"Seismicity remained at a low level in February [with] 155 recorded events. The earthquakes were concentrated at the NE and NW parts of the caldera seismic zone. Levelling surveys on 19 and 20 February from the town of Rabaul . . . to Matupit Island . . . indicated slight subsidence since October 1986 at all stations, with maximum subsidence of 11 mm on Matupit Island. Tilt showed no clear trend and most changes were <5 µrad."
Information Contacts: P. Lowenstein, RVO.
Slight deflation in NE caldera; seismicity declines
Seismicity was at a very low level in March; only 134 small events were recorded. No significant changes were noticed in horizontal distance measurements, but tilt data indicated slight deflation in the Greet Harbour area in the NE part of the caldera.
Information Contacts: B. Talai and P. Lowenstein, RVO.
Low seismicity; deflation in E part of caldera
Seismicity remained at a very low level in April with 103 events recorded. Only five events were large enough to be located. All originated from the Greet Harbour area and four were immediately N of Tavurvur . . . in the E part of the caldera. Levelling measurements on 28 April showed that Matupit Island had subsided 8 mm since the last measurement, on 19 February, and electronic distance measurements on 6 April were consistent with deflation in the Greet Harbour Area. No definite trends were evident in tilt measurements.
Information Contacts: C. McKee and P. Lowenstein, RVO.
August 1985-March 1987 summarized; May seismicity low
Seismicity continued at a very low level, with 84 events recorded in May. Of the seven events that could be located, two were outside the caldera NE of the city of Rabaul, an unusual location. Ground deformation remained low with generally <10 µrad of tilt recorded and no significant changes in electronic distance measurements.
August 1985-March 1987: Post-crisis activity. "When the 1983-85 seismo-deformation crisis ended in July 1985, it was uncertain whether Rabaul would enter a period of sustained quiescence or would continue to show signs of unrest. In the 20 months since July 1985, the caldera demonstrated that it remains restless and showed some unusual behaviour.
"The variation in the monthly totals of caldera earthquakes in the post-crisis period (figure 7) indicates intervals of both very low and moderately high seismicity. However, the seismic energy release amounted to only 7.5 x 10¹⁵ ergs (compared to 2 x 10¹⁹ ergs in the 1983-85 crisis period). The pattern of earthquake locations between August 1985 and March 1987 (figure 8) shows that most events also took place immediately S of the entrance to Greet Harbour, an area that had previously been seismically quiet.
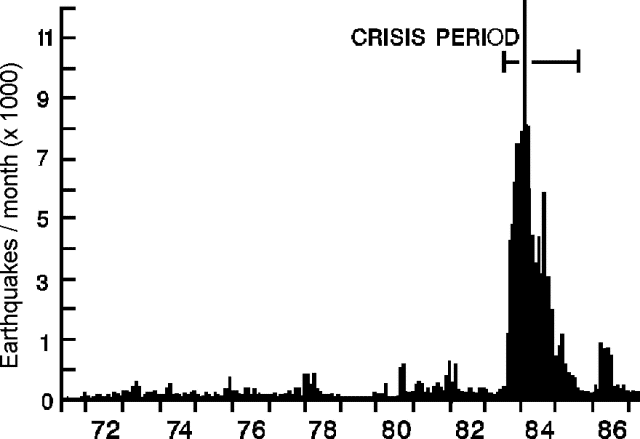 |
Figure 7. Monthly caldera earthquake totals at Rabaul, 1971-87. |
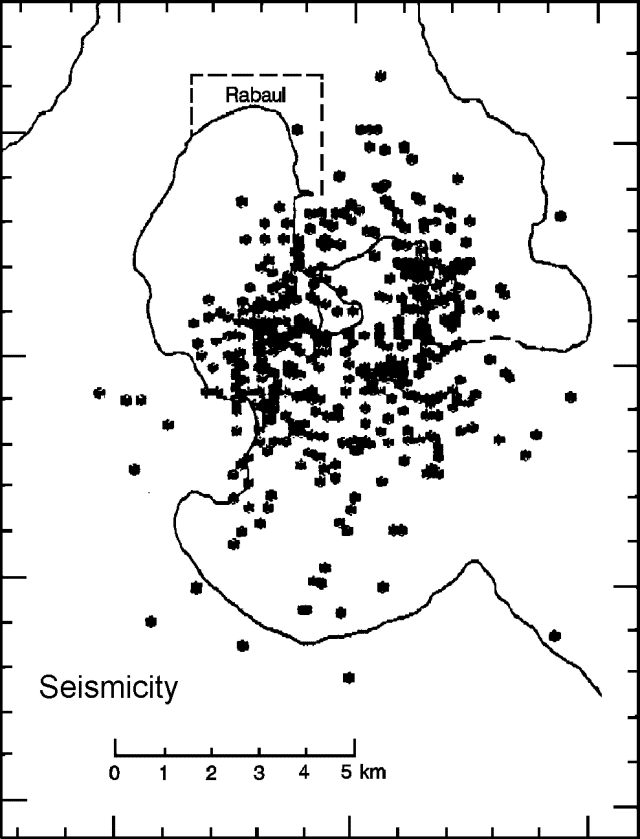 |
Figure 8. Rabaul seismicity, August 1985-March 1987. |
"The pattern of ground deformation in the post-crisis period has been dominated by events at the mouth of Greet Harbour. All monitored parameters of ground deformation indicated net inflation in the area. The greatest measured uplift was 49 mm at the S and SE coasts of Matupit Island (figure 9). Measurements of horizontal distance (figure 10) showed that the largest changes were expansions of 62 and 42 mm across the mouth of Greet Harbour. Tilt measurements (figure 5) showed a similar inflationary pattern with changes of 81 and 71 µrad in the same area. "N of Greet Harbour, subsidence occurred in the post-crisis period. Figure 4 shows that the greatest change was -13 mm on the N shore of Greet Harbour. Changes in horizontal distance and tilt vectors in the area between Sulphur Creek and the head of Greet Harbour were consistent with this subsidence (figure 5).
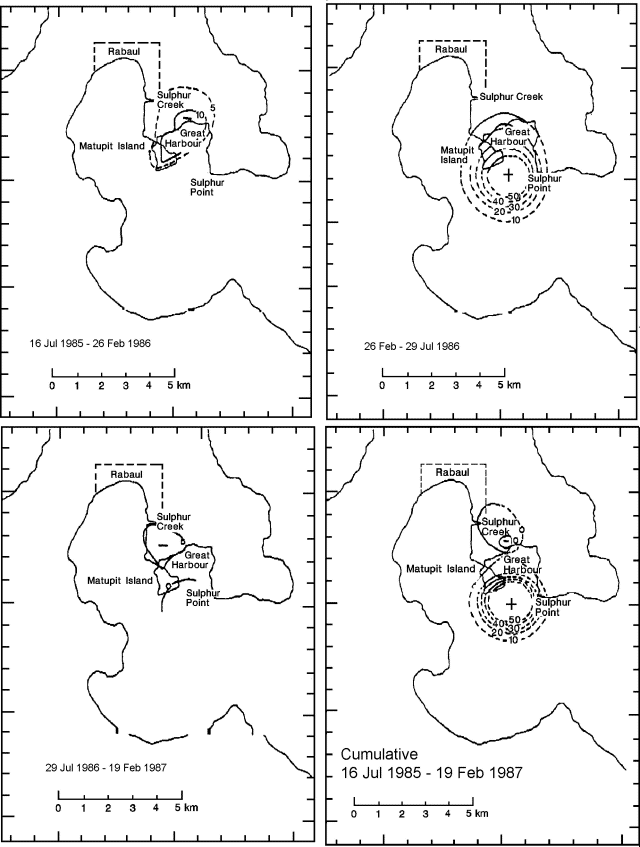 |
Figure 9. Elevation changes at Rabaul (mm) during 16 July 1985-26 February 1986 (top left), 26 February-29 July 1986 (top right), 29 July 1986-19 February 1987 (bottom left), and cumulative values fro 16 July 1985 to 19 February 1987 (bottom right). Courtesy of RVO. |
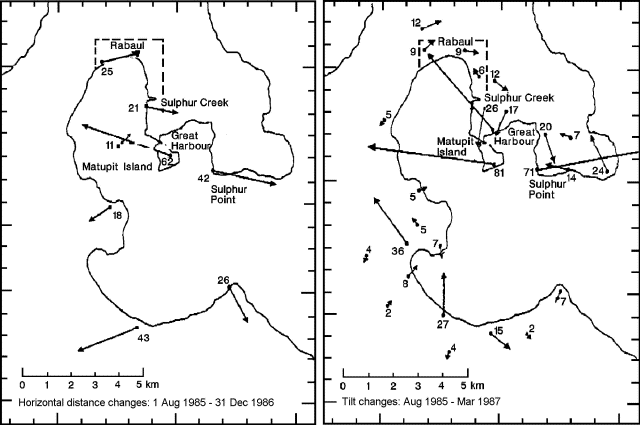 |
Figure 10. Rabaul horizontal distance changes (left, in millimeters, August 1985 to December 1986) and tilt changes (right, in µrad, August 1985 to March 1987). |
"When the post-crisis period is examined in detail, a somewhat complex pattern of activity is revealed, which can be divided into three periods: August 1985-March 1986, April-July 1986 and August 1986-March 1987.
August 1985-March 1986: Post-crisis subsidence and weak seismicity. "This was a period of generally weak activity in which monthly earthquake totals varied between 48 and 317 (average 166); 1,330 earthquakes were recorded in the 8-month period. Only a small fraction were large enough to be located. Most of these events originated from the caldera seismic zone, but no particular concentrations of activity are evident. There were no caldera earthquakes of M 2.0 or greater, and the seismic energy release was <5 x 10¹³ ergs.
"Ground deformation is indicated by levelling measurements. In contrast to previous patterns of ground deformation, between 1971 and July 1985, subsidence took place at nearly all of the benchmarks surveyed between Rabaul town and Matupit Island (figure 9). The largest falls occurred on Matupit Island (-17 mm) and near the NW shore of Greet Harbour (-13 mm).
April-July 1986: Renewed inflation and seismicity. "A significant increase in seismicity was noted in April 1986 (figure 7) when almost 1,800 caldera earthquakes were recorded. This higher level of activity persisted until July 1986, with 6,183 earthquakes recorded in this 4-month period. The average monthly totals of events from April-July 1986 was 1,456 but, unlike previous periods of increased activity, no seismic crises occurred. Most of the events were located on faults bounding the caldera, but a number occurred within the central part of the caldera block. These events appeared to be of different character than the normal caldera fault zone events in being emergent, of lower frequency, and ~50% longer duration. This may not be a real source difference but an effect of a different path from source to the seismic stations. The strongest caldera earthquake during this period was an ML 2.7 event on 13 April, and the total seismic energy release was 2.3 x 10¹⁵ ergs.
"The increased seismicity was accompanied by a new phase of inflationary ground deformation. The pattern of deformation shows progressively greater uplift southwards from the town of Rabaul to Matupit Island (figure 9). The greatest measured change was 50 mm at the S and SE coasts of Matupit Island. Other levelling measurements suggest that the Sulphur Point area was uplifted ~25-30 mm in this period. Although this pattern of deformation resembles that recorded during 1983-85, the deformation in 1986 accumulated steadily and did not include crisis-induced offsets.
"The levelling data for this period can be compared with the theoretical effect due to a point source. The best fit of calculated to observed uplift indicates a source at 1.9 km depth ~1 km SE of Matupit Island with a maximum uplift of 67 mm. If the uplift is due to a volume increase at the source, its magnitude would be ~1.5 x 10⁶ m3, assuming that the source volume change is equivalent to the volume of the surface deformation. The ratio of vertical and horizontal movements in this period is consistent with that expected from a point source of deformation.
August 1986-March 1987: Seismicity declines; irregular deformation. "Activity declined in August 1986, and a generally low level of activity persisted to the end of this period. Monthly earthquake counts (figure 7) ranged between 316 and 78 (average 209), and the total number of events was 1,673 for the 8 months. Although earthquake counts were low, there was proportionally a greater number of stronger events than in the preceding period (April-July 1986), which resulted in greater seismic energy release (5.2 x 10¹⁵ ergs). Nearly all of this energy release was due to a series of earthquakes on 25-26 November (max ML 3.0). The pattern of earthquake locations in this period resembles that of April-July 1986, in which most events originated from the E and W segments of the caldera seismic zone, but a number occurred within the central part of the caldera block.
"Rates of ground deformation were lower than in April-July 1986. Curious spatial and temporal patterns of both uplift and subsidence were recorded. Between July and October 1986, uplift took place at Matupit Island (maximum 8 mm), while subsidence of a few millimeters occurred around the NW shore of Greet Harbour. From October 1986 to February 1987, subsidence was recorded at all occupied bench marks between the town of Rabaul and Matupit Island. The overall pattern of elevation changes is shown in figure 9, where net uplift of a few centimeters is indicated at the S and SE extremities of Matupit Island, and subsidence occurred between Matupit Island and Sulphur Creek (max fall of 10 mm). The change in the trend of deformation at Matupit Island may have been associated with the 25-26 November earthquakes.
Discussion. "Post-crisis activity has shown both familiar and unusual characteristics. The magnitude of the April-July 1986 inflationary event was similar to that of many of the inflationary episodes associated with crises in the 1983-85 period. However, no seismic crises occurred April-July 1986 and no strong or moderately strong caldera earthquakes were recorded. Comparison of the April-July 1986 uplift measurements with a point source model suggests that the source of the ground deformation was the same as the one active 1971-85.
"An unusual feature of the pattern of ground deformation in the post-crisis period was subsidence of parts of the caldera. Only two other instances of subsidence in the caldera are known since 1971, in 1975 and 1982. Although the magnitudes of the post-crisis subsidence events were small, their moderating effect on the gross deformation pattern may be symptomatic of a change to significantly lower long-term rates of caldera deformation. From 1971-83, the average rate of uplift on Matupit Island was ~100 mm/year. For the post-crisis period, the average uplift rate has been ~30 mm/year.
"Another unusual feature of the post-crisis period was the change in the ratio of vertical to horizontal ground deformation. In the 1983-85 crisis period the greatest measured uplift was 767 mm at the SE coast of Matupit Island. The greatest measured horizontal distance change in this period, also on Matupit Island, was 395 mm. Thus the ratio of vertical to horizontal distance change in the period was ~2:1. Figures 9 and 10 show that for the post-crisis period, vertical and horizontal distance changes again were greatest on Matupit Island, but horizontal deformation was larger than uplift; 49 mm of uplift and 62 mm of horizontal movement yielded a ratio of 1:1.3. The significance of this change is uncertain although it could represent a change in the deformation source or mechanism. While the April-July 1986 inflationary event had the characteristics of deformation due to a point source, the preceding and following periods were marked by a peculiar combination of subsidence or minor localized uplift with expansionary horizontal movements.
"The main features of the post-crisis seismicity were the absence of seismic crises and the increase in caldera earthquake durations. This is unusual because increased earthquake durations were previously associated with seismic crises. The increase in earthquake durations took place in April 1986 when seismicity increased generally. The increased durations appear to reflect a change in the spatial distribution of seismicity. Prior to April 1986, most of the caldera earthquakes originated from movements on the faults bounding the caldera block. However, since April 1986, a larger proportion of the caldera earthquakes have occurred within the caldera block.
"In general, low rates of seismicity and ground deformation from mid-1985 indicate that the magma bodies within the caldera have stabilized considerably since the 1983-85 crisis period. However, the subtle variations in this recent activity demonstrate that the caldera is a dynamic system with behaviour that is difficult to predict, and needs to be monitored carefully even when it appears to be quiet."
Information Contacts: C. McKee, P. Lowenstein, and J. Mori, RVO.
Seismicity, deformation, and tilt low
A low level of activity continued in June with 128 caldera earthquakes recorded. Most of the 19 located events occurred on the NW part of the caldera seismic zone. Ground deformation rates remained low, although levelling measurements showed an uplift of 10 mm in the NE part of the caldera between 29 April and 23 June. Tilt changes were small with a maximum change of 5-10 µrad of inflation in the E part of the caldera (Greet Harbour area).
Information Contacts: C. McKee and P. Lowenstein, RVO.
Low level seismicity and deformation
A low level of activity continued in July with 107 caldera earthquakes recorded. About 20% were located; normally, only 5-10% of the recorded events are locatable. Most of the July events were distributed in a broad NE-trending zone linking the NE and SW parts of the caldera. Ground deformation rates remained low, although levelling measurements showed an uplift of 8 mm on the S part of Matupit Island . . . between 23 June and 27 July. Tilt changes were very small; the largest measured was 4 µrad of inflation in the NE area of the caldera (Greet Harbour).
Information Contacts: B. Talai and P. Lowenstein, RVO.
Seismicity declines; deflation in caldera
Seismicity declined to its lowest level since the 1983-85 unrest; only 34 caldera earthquakes were recorded in August, compared to 80-150/month in the last seven months. There were periods of several consecutive days with no events and only three small events were recorded 13-20 August. The six located earthquakes were in the Greet Harbour and Karavia Bay areas (NE and E parts of the caldera).
Dry tilt readings on Vulcan Headland . . . showed a steady deflation of 20 µrad since May. In Greet Harbour, usually the most active area, tilt readings remained virtually unchanged although levelling revealed a slight subsidence of 10 mm at Matupit Island since the end of June. This slight deflationary trend was consistent with EDM results.
Information Contacts: C. McKee, P. de Saint-Ours and P. Lowenstein, RVO.
Low seismicity; subsidence
Seismicity remained at a low level during September with 69 events recorded. The four located events were in the Beehives area and N Blanche Bay (E part of the caldera). Measurements on the Matupit Island level line showed subsidence in the Sulphur Creek and Matupit Island areas (N and central-NE caldera) from 23 June to 3 September. The greatest subsidence (11 mm) was recorded at the causeway leading to the island. EDM data did not show any significant horizontal changes during the month.
Information Contacts: J. Mori, C. McKee, and P. Lowenstein, RVO.
Seismicity low; slight subsidence
Seismicity remained at a very low level during October with only 33 events recorded. The 10 events large enough to be located occurred in the Greet Harbour and Vulcan areas . . . . Tilt data, EDM, levelling, and strand line measurements indicated that no ground deformation had occurred, apart from a very slight subsidence at the Vulcan Headland.
Information Contacts: J. Mori, D. Lolok, and P. Lowenstein, RVO.
Slow subsidence continues; seismicity remains low
Seismicity remained at a very low level during November; only 34 events were recorded. The eight events large enough to be located occurred in the Greet Harbour, Vulcan-Matupit Island areas . . . . Tilt measurements indicated ongoing very slow subsidence in the Greet Harbour and Vulcan areas. Seismicity has remained somewhat elevated in 1987, although from August to October seismicity has been at its lowest levels since the 1983-85 crisis.
Information Contacts: P. Lowenstein, RVO.
Seismicity continues to decline
In December, seismicity reached its lowest level since September 1979; only 24 caldera earthquakes were recorded. The single event large enough to be located was beneath Tavurvur. No significant horizontal distance changes were recorded. Small tilt changes of up to 13 µrad were measured but no clear patterns emerged. Heavy rain near the end of December may have influenced some of the tilt data.
Information Contacts: C. McKee and P. Lowenstein, RVO.
Low-level seismicity
Seismicity continued at a very low level in January with 64 recorded earthquakes. The six locatable events were in the Greet Harbour and Matupit Island areas. There were no significant changes in tilt or horizontal distance measurements.
Information Contacts: J. Mori and P. Lowenstein, RVO.
Weak seismicity; no deformation changes
Seismicity continued at a very low level, with 33 earthquakes recorded in February. There were only two locatable events in February, both in the Greet Harbour area. There were no significant changes in tilt and horizontal distance measurements.
Information Contacts: P. de Saint-Ours and C. McKee, RVO.
Increased seismicity but continued deflation
Microseismicity increased markedly after the first week in March, and the month's total [of earthquakes] reached 107 events, the highest since July 1987. All of the March events were of small magnitude (ML <2) and some occurred in swarms. The strongest concentration was in the region between Vulcan and Matupit Island, where focal depths were 1-4 km. A few shocks occurred in the Karavia Bay area S and SE of Vulcan.
There was no significant change in the trend of ground deformation. Tide gauges off Vulcan Headland and Matupit Island continued to record slow subsidence (~3 mm/month). On land, levelling between Rabaul town and Matupit Island confirmed the continuing subsidence, which has totaled as much as 15 mm on the island since October 1987. However, levelling of Vulcan Headland suggests a 3-5 mm rise since April 1986. Neither tilt nor EDM data showed any significant changes.
Information Contacts: P. de Saint-Ours and C. McKee, RVO.
Low-level seismicity; minor caldera subsidence
"Seismicity remained steady at a relatively low level in April, with a total of 107 earthquakes recorded. These events were of small magnitude (ML <2), but one event on 10 April had a magnitude of 2.8 and was felt by residents of Matupit Island. The five located earthquakes were concentrated between Vulcan and Matupit Island, under Tavurvur . . . , and under the central part of the caldera. The trend of subsidence of the central part of the caldera continued. Tide gauges off Vulcan headland and Matupit Island recorded subsidence at a rate of ~2-3 mm/month. However, no significant changes were shown by tilt and electronic distance measurements."
Information Contacts: D. Lolok, C. McKee, and B. Talai, RVO.
Seismicity increases slightly
"Seismicity increased somewhat in May, reaching a monthly total of 187 caldera earthquakes. This is the highest monthly earthquake count since late 1986. However, this total is within the range of normal inter-crisis levels and the events were all of small magnitude (ML <2). There were 25 locatable events in May, which were distributed in the N half of the caldera seismic zone.
"No significant changes were observed in tilt and electronic distance measurements. However, the trend of subsidence shown by data from tide gauges off Vulcan and Matupit Island may have flattened, and levelling results obtained on 6 and 19 May indicated slight uplift of Matupit Island (maximum of 14 mm since 10 March)."
Information Contacts: H. Patia and P. Lowenstein, RVO.
Microseismicity increases
"Microseismicity showed a further increase in June with a monthly total of 238 events. All were of small magnitude (ML <1.5) but occurred in swarms, with the highest output on 1 June (23 events) and 26-27 June (62 events). Locatable events were grouped on the NW to NE portion of the . . . caldera seismic zone (Vulcan, Beehives, Greet Harbour) at depths of 1-4 km. All measured parameters of ground deformation (EDM, tilt, levelling, and tide gauges) showed neither inflationary nor deflationary trends."
Information Contacts: P. de Saint-Ours and P. Lowenstein, RVO.
Seismicity remains at low level
"Seismicity remained at a low level during July. Caldera earthquakes totalled 185 events. The earthquakes occurred mainly on the NE and NW part of the caldera seismic zone at depths of 1-4 km and were not felt; only 14 were large enough to be located. No significant changes were detected by tilt measurements and EDM, although tide gauge data indicated continuing slight caldera deflation at a rate of 1-2 mm/month."
Information Contacts: C. McKee and P. Lowenstein, RVO.
Increased seismicity; slow inflation continues
"Seismicity increased markedly in August with 1392 mostly small, instrumentally detected events recorded. This number is . . . the highest since July 1986 when 1,312 events were recorded. Some very small swarms of larger events included three weakly felt earthquakes of M 2.1 (0055 on the 16th), 2.5 (0855 on the 30th), and 2.1 (1202 on the 30th). The increased seismicity was not due to any sudden crisis but rather to a gradual increase in background level which peaked 16 August with 170 events before returning to a low level after the 30th. The increase is considered to have been a short-term, low-energy change similar to that of April-July 1986 and is not considered to mark the onset of a significant new period of unrest in the caldera. Instead, it may indicate a longer term, slow progression toward the next eruption.
"71 events could be located, most of which were situated in the NW portion of the caldera ring fault between Vulcan and Matupit Island. Smaller concentrations of events also occurred in the NE portion near Tavurvur volcano and to the S in Karavia Bay. Depths ranged from mainly shallow (0.5-3.0 km) near Vulcan to somewhat deeper (1.5-4.5 km) near Tavurvur.
"Ground deformation measurements, which have been indicating a gradual inflationary trend of ~0.5 cm/month in the Greet Harbour area since March, showed no sudden changes. Tilt stations in this area showed inflationary changes of up to 4 µrad and electronic distance measurements detected expansion of up to 11 microstrain during the month. No consistent readings were obtained in the Vulcan-Karavia Bay area."
Information Contacts: P. Lowenstein and B. Talai, RVO.
Seismicity declines but remains above normal
"Seismicity subsided in September but was still above normal levels. A total of 353 events was recorded in September. Most days, less than ~20 events were detected, but 60 were recorded on the 29th. Twelve events could be located, distributed on the NW, NE, and SE portions of the caldera seismic zone. Levelling measurements showed slight uplift (maximum 5 mm) of SE Matupit Island between 16 August and 20 September, and slight subsidence of a few millimeters between Rabaul town and Matupit Island. EDM results indicated little change during the month except at the entrance to Greet Harbour where slight expansion (~10 microstrain) was recorded."
Information Contacts: C. McKee and P. Lowenstein, RVO.
Seismicity increases slightly; minor inflation
"Seismicity increased slightly in October with a total of 402 earthquakes recorded. Events averaged 13/day with the highest count reaching 60 on the 3rd. One weakly felt earthquake of M 2.6 occurred on the 30th and was centered in the Blanche Bay area. Most of 14 locatable events were situated in the NW caldera ring fault between Vulcan and Matupit Island. Smaller concentrations also occurred on the NE portion near Tavurvur and SW of Karavia Bay.
"Tilt measurements [and EDM results] showed no significant changes during the month. . . . Between 20 September and 4 November, levelling measurements showed a slight (12 mm) . . . uplift at the S part of Matupit Island."
Information Contacts: D. Lolok, B. Talai, and P. Lowenstein, RVO.
Seismicity declines; slight inflation
"Seismic activity continued to decrease in November with a total of 301 earthquakes. The daily number of events averaged <20 with the highest number (54 events) recorded on the l4th. Four locatable events were detected: on the E side (1) and N of (2) Greet Harbour, and on the W side of Matupit Island (1). Ground deformation rates remained low. Levelling on 3 November showed 12 mm of uplift at the S part of Matupit Island since 20 October. EDM data showed slight expansion (5 microstrain) at Greet Harbour's entrance."
Information Contacts: I. Itikarai and P. Lowenstein, RVO.
Decreasing seismicity; minor inflation
"Seismicity continued to decrease in December to a total of 131 recorded earthquakes. Events averaged 4/day with highest counts at 12 on the 22nd and 23rd. Only three events could be located; two at the SW tip of Matupit Island and one near the S part of Blanche Bay's entrance. Ground deformation rates remained low. At Greet Harbour's entrance, EDM data showed continued slight expansion (8 ppm) and tilt stations in this area showed inflationary changes of up to 6 µrad."
Information Contacts: H. Patia and P. Lowenstein, RVO.
Seismicity declines; deformation low
"Seismicity continued to decline in January. The total number of caldera earthquakes was 95. On most days only a few events were recorded, but 21 earthquakes occurred on the 31st. Only six events could be located. These occurred mainly on the NW and NE parts of the caldera seismic zone. Ground deformation rates remained low. No significant elevation or tilt changes were recorded, and EDM data showed no clear trends."
Information Contacts: C. McKee, H. Patia, and P. de Saint-Ours, RVO.
Seismicity increases; minor deformation
"Seismicity increased in February with a total of 239 caldera earthquakes. The average number of events was 6/day with the highest count 68 on the 13th. The eight events that could be located occurred in the W, NW, and E parts of the caldera seismic zone. Ground deformation rates remained low. Slight inflation was recorded in the N-central part of the caldera by dry tilt (2-10 µrad) and levelling (5 mm). Slight deflation was recorded in the W part of the caldera by dry tilt (1.5 µrad). EDM data showed no clear trends."
Information Contacts: D. Lolok and C. McKee, RVO.
Continued minor seismicity
"Activity remained at background level in March. Seismicity totaled 183 small events (ML 0.5-1.5). Only four could be located and these originated from Greet Harbour. The daily earthquake count fluctuated between 0 and 30. There was no significant change recorded in ground deformation."
Information Contacts: P. de Saint-Ours and C. McKee, RVO.
Seismicity and deformation at background level
"Activity remained at a low (background) level in April. The total number of caldera earthquakes was 146. All of the events were small (ML 0.5-1.5) and none could be located. The daily earthquake count ranged from 0 to 17. Ground deformation measurements showed no significant changes."
Information Contacts: C. McKee, RVO.
Seismicity increases slightly; inflation slows
"In general, activity remained at background level in May. Seismicity increased slightly, with a total of 164 small caldera earthquakes. The daily earthquake count fluctuated between 0 and 19. The 7 events that could be located occurred in the NW part of the caldera seismic zone.
"Levelling measurements on 26 May showed that the S and SE parts of Matupit Island had risen by ~25 mm since the previous measurements on 30 March. Over the past 1.5 years, uplift has been approximately linear at a rate of ~40 mm/year, considerably less than the 1973-83 (pre-seismo-deformational crisis) rate of ~100 mm/year. No significant tilt changes were recorded in May, and EDM data showed no clear trends."
Information Contacts: H. Patia and C. McKee, RVO.
Activity remains at background levels
"Activity remained at background levels throughout June. There were 152 small earthquakes recorded in the caldera. The daily count fluctuated between 0 and 15. Only two events were large enough to be accurately located, originating 1 km under Greet Harbour. Monthly levelling measurements to Matupit Island show a steady (or slightly subsiding) trend since December 1988. Neither tilt nor EDM data have shown any significant trend."
Information Contacts: P. de Saint-Ours and B. Talai, RVO.
Seismicity continues 3-month decline
"Activity continued at a low level. A total of 119 caldera earthquakes was recorded. The average daily number of events was four, with the highest count (15) on the 16th. Only four events were large enough to be located, and they occurred within the Greet Harbour area. No significant changes were observed on the deformation networks."
Information Contacts: B. Talai and C. McKee, RVO.
Seismicity remains at background
"Activity remained at background level in August. The total number of caldera earthquakes was 202. All of these events were small (ML <1.5). The 14 that could be located occurred in two clusters; one in the Matupit Island/Greet Harbour area, and the other in the S part of the caldera seismic zone. Ground deformation measurements showed no significant trends."
Information Contacts: I. Itikarai and C. McKee, RVO.
Annual level survey shows changes to 34 mm
"Background-level activity continued in September. The total number of caldera earthquakes was 99, compared with 202 in August and 119 in July. All of the events were small (ML <1.5), and none were large enough to be located.
"The annual survey of the complete Rabaul Caldera level network began in August and was still in progress at the end of September. Compared with the 1988 annual survey, the 1989 results indicate slight subsidence in the N part of the caldera (5 mm) and between Rabaul township and Matupit Island (9 mm). On Matupit Island, uplift has continued, with the S part of the island rising ~34 mm. Around the N and E shores of Greet Harbour, there was subsidence of between 9 and 30 mm."
Information Contacts: C. McKee, RVO.
Seismicity increases slightly; no new deformation
"Seismicity increased slightly in October. A total of 346 events was recorded, compared to monthly totals of 100-200 in the last 10 months. The largest daily event total was 83, recorded on the 24th, when earthquakes occurred in rapid succession for ~2 hours. A similar swarm with a total of 67 events occurred 20-21 October, all with ML <2. No events were felt, and only five were large enough be recorded by the entire network and located. Two events occurred in the NW and one in the S part of the caldera seismic zone. The remaining two events appeared to originate from the E part of the region bounded by the caldera fault. Ground deformation readings in October showed no significant change."
Information Contacts: C. McKee, RVO.
Seismicity increases; felt earthquakes
"There was a further increase in seismicity in November, with a total of 546 recorded events. Half of the recorded events occurred in swarms of low-frequncy earthquakes on the 12th (36 events), 17th-18th (138), 20th (39) and 24th (84). The first two swarms originated from the Greet Harbour-Beehives area (NW part of the caldera seismic zone), with 4-5 felt earthquakes on the 17th. A couple of earthquakes were felt locally on the 20th (the largest, ML 2.3), originating from the Karavia Bay and Blanche Bay areas (S and W caldera seismic zones). The swarm on the 24th also originated from the Greet Harbour area. Levelling carried out before and after the swarms of felt earthquakes showed no significant ground deformation."
Information Contacts: D. Lolok and P. de Saint-Ours, RVO.
Increase in seismicity; inflation
"December showed both a relative increase in seismicity and an accelerated rate of inflation in the central part of the caldera. The moderate rise in seismicity observed since October continued, with 886 caldera events (ML <=2.3) recorded in December. Background seismicity fluctuated between 10 and 40 events/day. Minor swarms occurred on 12 (52 events), 13 (121), 18 (45), and 24 (76) December, alternately from the NW (Beehives), N (Greet Harbour), and E (Blanche Bay) areas of the well-established annular seismic zone.
"Renewed inflation in the central part of the caldera was suggested by rise of the S tip of Matupit Island . . . of 3 mm/month from September to November. Uplift of 20 mm was recorded in December. Only six tilt stations around Greet Harbour and on the Vulcan Headland showed a significant inflationary trend (3-10 µrad/month since mid-October)."
Information Contacts: P. de Saint-Ours, RVO.
Seismicity and deformation decline; unrest since October summarized
"January marked the end of a period of minor, short-term unrest that started in October 1989 and was comparable to August-November 1988 activity. Seismicity in January (401 recorded events) had declined markedly since December (table 2). The background level ranged from 1 to 15 events/day, compared to 5-40/day in December. Three small earthquake swarms occurred January 1-2 (69 events), 13 (39), and 23 (79) from the N (Greet Harbour) and E (Blanche Bay) sides of the caldera (table 2 and figure 11). The increased rate of ground deformation recorded in December apparently stabilized in January, although a complete survey is required to assess the amount of caldera-wide elevation and tilt change (table 2)."
Table 2a. Summary of monthly seismicity during the October 1989-January 1990 period of unrest at Rabaul. Courtesy of RVO.
| Date | Events/Month | Swarms | Magnitude (ML) |
| Jan-Sep 1989 | 100-200 | 0 | less than 1.5 |
| Oct 1989 | 346 | 2 | less than 2.0 |
| Nov 1989 | 546 | 4 | 2.3 and 3.0 |
| Dec 1989 | 886 | 4 | 2.1 and 2.3 |
| Jan 1990 | 401 | 3 | 3.1 |
Table 2b. Summary of local earthquake swarms during the October 1989-January 1990 period of unrest at Rabaul. Courtesy of RVO.
| Date | Number of Events (felt) | Location | Magnitude (ML) |
| 20-21 Oct 1989 | 67 | Greet Harbour | less than or = 2.0 |
| 24 Oct 1989 | 83 | Greet Harbour | less than or = 2.0 |
| 12 Nov 1989 | 36 | Greet Harbour | less than or = 2.0 |
| 17-18 Nov 1989 | 138 (5) | Sulphur Creek - Beehive | 2.3 |
| 20 Nov 1989 | 39 (3) | Karavia Bay and Blanche Bay | 3.0 |
| 24 Nov 1989 | 84 | Greet Harbour | less than or = 2.0 |
| 12 Dec 1989 | 52 | Vulcan | less than or = 2.0 |
| 13 Dec 1989 | 121 | Greet Harbour and Blanche Bay | less than or = 2.0 |
| 18 Dec 1989 | 45 (1) | Vulcan | 2.1 |
| 24 Dec 1989 | 76 (1) | Greet Harbour | 2.3 |
| 01-02 Jan 1990 | 69 (2) | Greet Harbour | 3.1 |
| 13 Jan 1990 | 39 | Greet Harbour | less than or = 2.0 |
| 23 Jan 1990 | 79 (1) | Greet Harbour and Blanche Bay | less than or = 2.5 |
Table 2c. Summary of ground deformation at at Matupit Island during the October 1989-January 1990 period of unrest at Rabaul. Courtesy of RVO.
| Date | Location | Description |
| Jan-Jul 1989 | Matupit Island | less than or = 10 mm subsidence |
| Jul-Sep 1989 | Matupit Island | no change |
| Sep-Dec 1989 | Matupit Island | less than or = 10 mm uplift |
| Dec-Jan 1990 | Matupit Island | greater than or = 20 mm uplift |
Table 2d. Summary of tilt changes during the October 1989-January 1990 period of unrest at Rabaul. Courtesy of RVO.
| Date | Location | Description |
| Jan-Sep 1989 | Greet Harbour | no significant changes |
| Jan-Sep 1989 | Vulcan | less than or = 20 µrads deflation |
| Oct-Nov 1989 | Matupit Island & Vulcan | less than or = 10 µrads inflation |
| Dec 1989 | Sulphur Point and Baluan | 10-20 µrads inflation |
| Jan 1990 | Greet Harbour | greater than or = 10 µrads inflation |
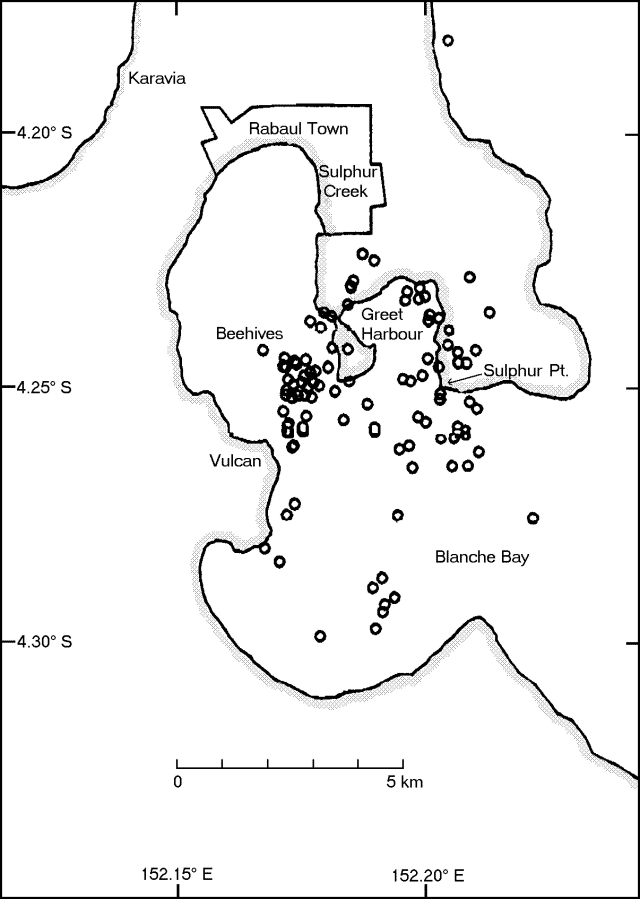 |
Figure 11. Epicenters of seismic events at Rabaul, October 1989-January 1990. Courtesy of RVO. |
Information Contacts: I. Itikarai and P. de Saint-Ours, RVO.
Seismicity continues to decline; no significant deformation
"A further decline in activity was evident in February. The total number of caldera earthquakes recorded in February was 161. Daily earthquake totals ranged between 0 and 17. The earthquakes occurred on the NE and NW-SW parts of the caldera seismic zone. The strongest was an ML 3.1 event from the SW part of the zone on the 28th. Levelling measurements on the Rabaul Town-Matupit Island line carried out on 20 February indicated little or no change since the previous measurements (9 January)."
Information Contacts: C. McKee, RVO.
Seismicity remains relatively low; minor deflation
"Activity remained at a low level in March. A total of 265 caldera earthquakes was recorded. Daily earthquake totals ranged from 0 to 24, with the highest daily total recorded in a small Greet Harbour swarm on 18 March that included two felt events (ML 2.8 and 2.6). During the month, seismicity was broadly distributed within the caldera seismic zone. Levelling measurements on 26 March indicated deflation of 2 mm at the S tip of Matupit Island since previous measurements on 20 February."
Information Contacts: I. Itikarai, P. de Saint-Ours, and C. McKee, RVO.
Fewer earthquakes; no significant deformation
"Activity was at very low level throughout April, with only 69 recorded earthquakes. There were several days without any recorded events, and the highest daily total was 9 events. Only three earthquakes could be located - one in each of the E, S, and NW parts of the caldera seismic zone. Levelling measurements carried out on 25 April indicated no significant changes from the previous measurements (26 March)."
Information Contacts: P. de Saint-Ours, and C. McKee, RVO.
Slight increase in seismicity; minor deformation near center of caldera
"Seismicity was [moderate] in May, with 234 caldera earthquakes recorded. Most located events originated from the N part of the annular caldera seismic zone. Levelling measurements on 31 May showed that the S part of Matupit Island . . . had been uplifted ~17 mm since the previous measurements (25 April). However, there were no significant changes in tilt and EDM measurements."
Information Contacts: P. de Saint-Ours and C. McKee, RVO.
CO2 kills six at Tavurvur; seismicity remains low
"Activity was at a very low level in June. Only 90 caldera earthquakes were recorded, and during one 6-day period there were no recorded caldera events. Located events originated from the N part of the annular caldera seismic zone.
"Levelling radial to the center of the caldera showed only minor uplift (<=4 mm) since last month's measurement, and there were no significant changes in tilt and EDM measurements.
"A release of CO2 in a pit crater on Tavurvur caused the death of six persons. The accident occurred in a crater 25 m deep with lateral dimensions of 130x90 m, at an elevation of 40 m on the S flank of Tavurvur (Fisher, 1976, Fig. 2). The crater is a nesting place for Megapode birds (Johnson, 1985).
"Three people who ventured into the crater on 24 June to collect Megapode eggs were overcome by CO2. Early on 25 June, 3 other people unsuspecting of the danger also died when trying to rescue them. The release of CO2 responsible for the casualties would have started only a couple of days earlier as the same people were unaffected when collecting eggs at the same place a week earlier.
"Recovery of the bodies and subsequent explorations of the crater were carried out with the aid of SCUBA equipment. An emission vent was found at the foot of the NW crater wall with a temperature of 48°C. The thickness of the CO2 layer at the bottom of the pit crater was found to fluctuate between 1.7 and 4.8 m in the following days, although on windy days the crater was either free of gas or the CO2 was mixed with air in a non-lethal concentration. It is uncertain whether other gases were released with the CO2. Gas samples await laboratory analysis for the identification of all species present. It is also hoped that laboratory work will determine whether the CO2 is of volcanic origin or has a biogenic source in the thermal decomposition of coral reefs buried under the products erupted by Tavurvur in the last few centuries (Fisher, 1939, p. 37).
"The occurrence of CO2 in this crater has been identified once previously, in October 1981, after villagers had reported finding dead animals there. There is no evidence of CO2 being released in Tavurvur's summit craters."
References. Fisher, N.H., 1939, Geology and vulcanology of Blanche Bay, and the surrounding area, New Britain: Territory of New Guinea Geol. Bull. 1, 68 p.
Fisher, N.H., 1976, 1941-1942 Eruption of Tavurvur volcano, Rabaul, Papua New Guinea: in Johnson, R.W., ed., Volcanism in Australasia, Elsevier, Amsterdam, p. 201-210.
Johnson, R.W., 1985, Megapodes, feathered volcano monitors?: Volcano News, no. 19-20, p. 6.
Information Contacts: P. de Saint-Ours and C. McKee, RVO.
Continued CO2 discharge from pit crater; seismicity remains at background
"Seismicity remained at a background level in July. The total number of caldera earthquakes recorded during the month was 213, compared to an average of 220/month since 1986. Daily earthquake totals ranged between 2 and 82 with the highest daily total recorded in a small swarm at the SW end of Matupit Island on the 31st (including one felt event of ML 3.5). Over the month, seismicity was distributed on the NW and NE parts of the annular caldera seismic zone. No significant changes were observed in levelling, tilt, and EDM measurements.
"CO2 was still being discharged throughout the month in a pit crater on the S flank of Tavurvur where six people suffocated on 24 and 25 June (15:06). The CO2 is being released from a small vent at the foot of the NW crater wall. The thickness of the CO2 layer at the bottom of the pit crater fluctuated between 0 and 4.8 m (<=60,000 m3) but was dissipated in the atmosphere on windy days (most days during the current trade wind season)."
Information Contacts: H. Patia and C. McKee, RVO.
Seismicity remains at background
"Seismic activity remained at background level in August. A total of 113 caldera earthquakes was recorded (compared to 213 in July and an average of 215/month since mid-1986). The located events originated from the NW part of the annular caldera seismic zone. All events were of small magnitude (ML <=1.5). No significant changes were observed in levelling, tilt, EDM, and gravity measurements."
Information Contacts: I. Itikarai and C. McKee, RVO.
Seismicity remains at background
"Seismicity remained at a low level in September. The total number of caldera earthquakes recorded was 101 (compared to 113 in August, 213 in July, and an average of 215/month since mid-1986). There was a tight clustering of events below the NE part of Greet Harbour, and a broadly scattered group between Vulcan and Matupit Island. All events were of small magnitude (ML <=1.5). No significant changes were observed in levelling, tide gauge, tilt, EDM, and gravity measurements."
Information Contacts: I. Itikarai and C. McKee, RVO.
Seismicity remains low; no significant deformation
"Seismicity remained at a low level in October. The total number of events recorded was 101 . . . . All events were of ML <=1. Only two were locatable, on the N and W sides of the caldera seismic zone. No significant changes were observed from levelling, EDM, tilt, tide gauge, and gravity measurements."
Information Contacts: C. McKee and I. Itikarai, RVO.
Seismicity remains weak; deformation unchanged
"Seismicity remained at a low level in November. The total number of caldera earthquakes increased slightly to 160, from 101 in October. All events were of small magnitude (ML <1). Of the three events that could be located, two were on the NW side and one was on the NE side of the caldera seismic zone. No significant changes were observed in ground deformation measurements."
Information Contacts: C. McKee and I. Itikarai, RVO.
Seismicity remains low; deformation unchanged
"Seismicity remained at a low level in December. The total number of caldera earthquakes decreased slightly to 105 . . . with a rate of 0-14 recorded earthquakes/day. All events were of small magnitude (ML <1) and could not be located. No significant changes were observed in ground deformation measurements."
Information Contacts: B. Talai, RVO.
Brief earthquake swarm
"A moderate swarm of earthquakes, on 24 January, momentarily interrupted the otherwise monotonous, low level of activity . . . . A swarm of 125 recorded events - the largest [ML = 2.0] (and only three other events of ML >= 1) - occurred between 0500 and 0800 on 24 January. The events large enough to be located originated 0.5-3 km under Blanche Bay, in the eastern part of the annular caldera seismic zone. By the next day the seismicity had dropped back to normal - within the range of 0-20 events/day. The total number of caldera earthquakes for the month was 300.
"No measurable ground deformation seems to have occurred in connection with this swarm and trends throughout the month were flat."
Information Contacts: P. de Saint-Ours and C. McKee, RVO.
Minor inflation but seismicity remains weak
"Seismicity . . . returned to a low level in February, but ground deformation measurements indicated some uplift.
"The total number of caldera earthquakes for the month was 141, and daily totals ranged between 0 and 17. All events were of small magnitude (ML <1.0). Only three events were large enough to be located; these occurred on the NE (2) and NW (1) parts of the caldera seismic zone.
"Tide gauge measurements indicated a mild progressive rise in the Matupit Island area throughout February. The total uplift was ~25 mm. Slight uplift had also been indicated in January; ~7 mm between 11 and 31 January. Levelling measurements from Rabaul Town to Matupit Island indicated uplift of 10 mm at the S end of the island 10 January-8 March. The difference in these measurements is explained by the fact that the Matupit tide gauge is much closer to the source of deformation. The tide gauge is ~0.8 km from the SE coast of Matupit Island, and within a few hundred meters of the apex of the caldera floor bulge (evident since the early 1970's)."
Information Contacts: C. McKee, RVO.
Low-level seismicity; brief deformation episode
"Seismicity remained at a low level in March. The total number of caldera earthquakes for the month was 140. Daily totals ranged between 0 and 9. All events were of small magnitude (ML <1.0). None were large enough to be computer-located, but the patterns of station registration indicated that most of the events were from the NE part of the caldera seismic zone, with a few from the E and NW parts.
"Tide gauge measurements indicated there was little or no net elevation change in March in the central part of the caldera (Matupit Island area). There was, however, a progressive rise of ~10 mm from the beginning of the month until the 17th, followed by rapid subsidence of about the same magnitude until the 24th."
Information Contacts: C. McKee, RVO.
Low-level seismicity; minor deflation
"Seismicity remained at a low level in April. The month's total number of earthquakes was 126 . . . with daily totals ranging from 0 to 19. Thirteen earthquakes were locatable and were distributed on the NW and W sides of the caldera seismic zone. Levelling measurements carried out between 8 March and 23 April showed 4 mm of subsidence at the SE end of Matupit Island."
Information Contacts: C. McKee, RVO.
Continued low-level seismicity; slight uplift
"Seismicity was at a low level in May. The month's total number of earthquakes was 102 (compared to 126-140 over the last 3 months). Only five earthquakes were locatable, distributed on the NE and W sides of the caldera seismic zone. Levelling measurements on 24 May showed a slight uplift (3.5 mm at the SE end of Matupit Island)."
Information Contacts: D. Lolok and P. de Saint-Ours, RVO.
Seismicity remains low; no significant deformation
". . . In June . . . the seismicity remained at a very low level with only 99 events recorded, all ML <1. Only four events could be plotted and were distributed on the N and W sides of the caldera seismic zone. Levelling, tilt, and EDM measurements showed no significant change."
Information Contacts: P. de Saint-Ours, RVO.
Slight increase in seismicity
"There was a slight increase in seismicity in November. The total number of caldera earthquakes for the month was 347 (compared to 200 for October). The daily count fluctuated between 0 and 93. There were three earthquakes strong enough to be felt: a ML 2.0 event on 6 November in the E part of the caldera seismic zone, and events of M 1.4 and 1.9 on 21 and 22 November, respectively, in the W part of the zone. All other events had magnitudes <1.0. Of the 347 earthquakes, only 14 could be located. These clustered in the W, NW, and E parts of the caldera seismic zone."
Information Contacts: B. Talai and C. McKee, RVO.
Seismicity declines slightly
"There was a slight decrease in seismicity in December. The month's total number of caldera earthquakes was 146 . . . . The maximum daily count was 18, recorded on 2 November. Of the 146 earthquakes, only three (of ML >0.5) could be located, on the E, SE, and W parts of the caldera seismic zone respectively."
Information Contacts: D. Lolok and B. Talai, RVO.
Seismicity declines; minor uplift
"There was a further decrease in seismicity in January. The total number of caldera earthquakes for the month was 75 . . . with daily totals ranging from 0 to 7. All events were of small magnitude (ML <0.5). Only two events were large enough to be located. These occurred on the northern part of the caldera seismic zone. Levelling measurements on 19 January showed only minor uplift (5 mm) at the southern part of Matupit Island since last month's measurements."
Information Contacts: H. Patia, P. de Saint-Ours, and B. Talai, RVO.
Brief earthquake swarm
"There was a slight increase in seismicity in February. The total number of caldera earthquakes was 212 . . . with daily totals ranging from 0 to 35. The highest daily earthquake totals were due to a swarm on 22 February and a series of small discrete events on 29 February. The swarm included several events that were felt in Rabaul, the largest [ML 3.2]. Earthquakes of this swarm were located in the W part of the caldera seismic zone at a depth of ~3 km. All of the other caldera earthquakes recorded in February were of small magnitude (ML <0.5). Levelling measurements carried out on 12 February indicated slight subsidence (8 mm) at the S part of Matupit Island since January's measurements. No significant tilt changes were recorded."
Information Contacts: C. McKee, RVO.
Slight increase in seismicity
"Seismic activity increased slightly in March. The month's total number of caldera earthquakes was 267 . . .. The maximum daily count was 72, recorded on 7 March. None of the events was large enough to be felt. The strongest earthquake for the month was a ML 2.7 event recorded on 12 March."
Information Contacts: I. Itakarai, P. de Saint-Ours, and C. McKee, RVO; ICAO.
Low-level seismicity
"Seismic activity was at a low level in April. The month's total number of caldera earthquakes was 166 . . .. The highest daily totals were 43 and 32, recorded on 28 and 29 April, and consisted mostly of events in the W part of the caldera seismic zone, near Vulcan cone. Three of these events were felt, all registering at ML 2.8. Other earthquakes were located in the S and E parts of the caldera seismic zone."
Information Contacts: C. McKee, RVO.
Seismic swarm; uplift over broad area
"Slow magmatic inflation continued in May, although an unusual swarm of seismic activity took place at the beginning of the month. Seismic activity in the usual annular seismic zone remained at a low level throughout May, with a total of 125 events. Starting on 2 May, however, an unusual swarm of earthquakes occurred 4.5-5 km under the N (older and inactive) rim of the caldera, slightly E of Rabaul township. Approximately 300 such events were recorded 2-19 May, with ~140 occurring on 3 May. A dozen were felt by residents. Five events were of ML >=3.0, the largest ML 4.2. Levelling measurements on 4 June indicated that uplift had occurred over a broad area of the caldera since the previous measurements on 11 May. This suggests a deeper source than usual. The biggest changes (20 mm) were recorded at the S end of Matupit Island."
Information Contacts: P. de Saint-Ours and C. McKee, RVO.
Uplift and seismicity increase slightly
"Seismic activity . . . has shown a slight increase over the last 2 months (June: 410 caldera earthquakes, May: 425) compared with activity over the last 2.5 years (100-300 events/month). Less than 1% of the recorded earthquakes in June could be located. Most were from the NW part of the caldera seismic zone. Similarly, levelling measurements showed a slight uplift of the central part of the caldera during the last two months (20 mm, 11 May-4 June; and an additional 13 mm by 8 July)."
Information Contacts: P. de Saint-Ours, D. Lolok, and C. McKee, RVO.
Increased seismicity; largest monthly total since August 1988
"There was a marked increase in seismic activity . . . in July; 1,089 caldera earthquakes were recorded . . .. This is the highest monthly total since August 1988. Thirty of these earthquakes have been located, mainly in three distinct areas: the NE, NW, and S parts of the caldera seismic zone."
Information Contacts: B. Talai and C. McKee, RVO.
Seismicity decreases; slight subsidence follows inflation
"A moderate rise in seismicity accompanied by uplift of the central part of the caldera took place over the last four months. After an increase to 1,089 events in July, the level of seismicity remained moderate throughout August, with 514 recorded events. The located earthquakes originated, as usual, from the annular seismic zone. Levelling measurements showed a steady uplift of the central part of the caldera from mid-May to mid-July (+30 mm), followed by a slight subsidence (-8 mm) since. Tilt and EDM measurements around the caldera . . . showed no significant changes."
Information Contacts: P. de Saint-Ours and C. McKee, RVO.
Seismicity declines
"There was a decrease in seismic activity . . . during September while ground deformation measurements indicated continued uplift. The number of caldera earthquakes recorded was 394 . . .. Only 25 events were large enough (M >0.5) to be located, the majority from the W part of the caldera seismic zone. The tiltmeters in the N and NE parts of the caldera registered a steady accumulation of a few microradians of inflation during September. Results from the annual levelling survey, which was completed in August, show continued long-term uplift. Over the past year, the S part of Matupit Island has been elevated ~60 mm."
Information Contacts: B. Talai and C. McKee, RVO.
Seismicity remains low; minor uplift
"Seismic activity . . . remained low during October, when 588 earthquakes were recorded . . . . The highest daily total was on the 22nd, when a brief swarm of 149 events was recorded. Three or four of the largest were felt in Rabaul. Over half of the 24 earthquakes located in October were from the swarm, 1-2 km NE of Vulcan on the W side of the caldera ring-fault system. The rest of the located events were scattered around the NW and E sides of the ring fault. Levelling measurements between 8 August and 16 October showed a small amount of uplift (4 mm) at the S tip of Matupit Island. Another round of levelling measurements on 9 November indicated uplift of 13-16 mm along the SE coast of Matupit Island. This uplift may correlate with the seismicity on the 22nd. No significant changes were shown by EDM or dry-tilt measurements."
Information Contacts: I. Itakarai, R.C. Stewart, and C. McKee, RVO.
Fewer seismic events; uplift
"Seismic activity . . . remained at a low-moderate level during November, with 351 recorded caldera earthquakes . . . . The highest daily total of events was 36 on the 29th. Eleven earthquakes were located, distributed in the NE, N, and NW parts of the caldera seismic zone. Levelling measurements on 9 November indicated 13-16 mm of uplift at the S coast of Matupit Island since the previous measurements on 16 October. This uplift is believed to be associated with a small swarm of caldera earthquakes that occurred on 22 October. EDM measurements on 11 November indicated dilation of as much as 20 ppm in the Greet Harbor area since the previous survey, on 22 October."
Information Contacts: C. McKee, RVO.
Increased seismicity
"Seismic activity . . . showed an increase in December, when 1,090 caldera earthquakes were recorded . . . . This is the highest monthly total since August 1988, although it is only one earthquake more than . . . in July 1992. The December earthquakes occurred mainly in four swarms: on 1, 11, 14, and 17 December. The last of these was the largest, containing 226 events, some of which were felt in the Rabaul area with intensity III-IV. The 36 earthquakes located in December were distributed mainly around the northern end of the caldera seismic zone."
Information Contacts: H. Patia and B. Talai, RVO.
Decreased seismicity
"Seismic activity decreased in January, when 352 caldera earthquakes were recorded . . .. The 18 located earthquakes were distributed mainly in the N part of the caldera seismic zone. The routine monthly levelling in the caldera showed no changes compared to December."
Information Contacts: R. Stewart, P. de Saint-Ours, and C. McKee, RVO.
Seismicity remains low; no significant deformation
"Seismic activity remained low in February; 256 caldera earthquakes were recorded . . . . Only four of February's earthquakes were located. They occurred in the W (2), SW, and SE parts of the caldera seismic zone. Routine monthly leveling in the caldera showed no significant changes compared to January."
Information Contacts: R. Stewart, P. de Saint-Ours, and C. McKee, RVO.
Seismic activity increases; no significant surface deformation
"There was a marked increase in seismic activity in March; 1,685 earthquakes were recorded . . . . This is the highest monthly total since April 1986 (1,769 earthquakes), and the second highest since the 1983-85 crisis period.
The earthquakes occurred both individually and in swarms. Large swarms, with >100 events, occurred 9, 15, 18, and 30 March. Only a few of the earthquakes were felt, the largest on the 15th, M 3.0-3.5. All of the 35 accurately located earthquakes were on the ring-fault system, and the majority were clustered near the recent eruptive centres of Vulcan (9) and Tavurvur/Rabalanakaia (16) (figure 12). Most of the events were located at depths <2 km. Nearly all of the Vulcan earthquakes occurred before 4 March, though the Tavurvur/Rabalanakaia events occurred throughout the month. Routine monthly leveling on the 23rd showed no significant changes from previous months. Wet and dry tilt measurements also showed no trends."
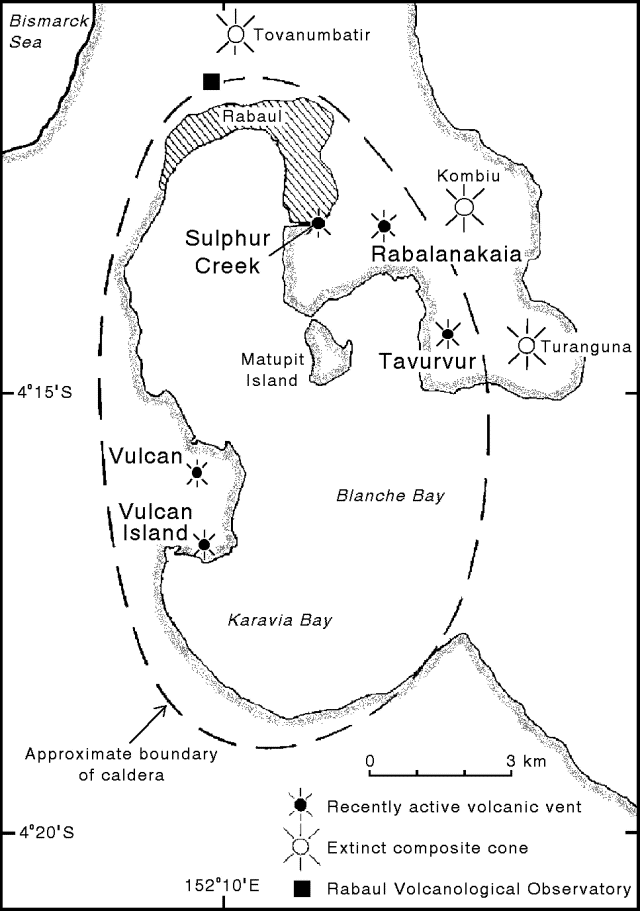 |
Figure 12. Map of the Rabaul Caldera showing recently active volcanic vents and extinct composite cones (modified from Almond and McKee, 1982). |
Reference. Almond, R. A., and McKee, C. O., 1982, Location of volcano-tectonic earthquakes within the Rabaul Caldera: Geological Survey of Papua New Guinea Report 82/19.
Information Contacts: H. Patia, R. Stewart, and C. McKee, RVO.
Seismic activity remains high; no ground uplift
"The number of earthquakes detected in April was 1,061, . . . still relatively high compared to background (250-350 earthquakes/month). Large swarms of >100 earthquakes occurred on 1, 3, and 21 April. No earthquakes were felt, suggesting that the largest event was M 2-2.5. The epicenters of the 52 accurately located earthquakes were mainly in the W and NE parts of the caldera seismic zone, similar to . . . March.
"Routine monthly levelling from Rabaul town to Matupit Island showed a small uplift at the S end of the island. Other parts of this levelling line showed no significant changes compared to March. Additional levelling along the N side of Greet Harbor showed a deflation of up to 13 mm since the last survey in August 1992.
"The relatively high level of seismicity with little or no associated ground uplift is reminiscent of activity recorded in mid-1986. The lack of significant uplift suggests that neither episode was related to any pronounced movement of magma within the caldera."
Information Contacts: N. Lauer, R. Stewart, and C. McKee, RVO.
Seismic activity remains high; uplift of caldera center
"Seismic activity in May was again relatively high, as 1,525 earthquakes were recorded . . . . Normal background level since the 1983-85 unrest has been around 250-350 earthquakes/month. The earthquakes occurred as discrete events and in swarms on 18 and 20 May. The 20 May swarm contained ~680 events, of which 73 were located. Some of the earthquakes were felt, with MM III-IV, and the four largest earthquakes in this swarm all had magnitudes of 3.8. Located earthquakes were equally distributed around the N part of the ring fault. The swarm on 20 May was located near the mouth of Blanche Bay, an area that has not been very active since the 1983-85 crisis period.
"Routine monthly levelling showed an uplift of 21 mm at the S end of Matupit Island between 27 April and 25 May. This levelling was complemented by dry-tilt measurements that showed inflation of the caldera's central portion. During the 20 May earthquake swarm, data from the tide gauge network showed an uplift of 50-60 mm at a station in the centre of the caldera, near the area of inferred maximum deformation."
Information Contacts: I. Itikarai, P. de Saint-Ours, R. Stewart, and C. McKee, RVO.
Seismicity declines to background levels
"Seismic activity declined in June, when 480 earthquakes were detected, compared to >1,000 in each of the previous three months. This represents a return to normal background levels of activity. Of these earthquakes, 25 were located, 16 with horizontal and vertical errors <1 km. Located events were centered mainly around the N and NW parts of the caldera ring fault. The only significant swarm activity was 2 June, with 121 earthquakes detected; 11 were located. Located events were scattered around the NW part of the ring fault, with the majority between Vulcan and Matupit Island. The largest earthquakes were felt in Rabaul with intensity II-III. In the two weeks after this swarm, most of the earthquakes were in the region of Greet Harbour or Matupit Island. By the middle of the month, activity had declined to almost insignificant levels. Small earthquake swarms in Greet Harbour during 25-28 June were not recorded on enough stations to be located.
"Routine monthly levelling on 6 July showed that uplift of as much as 20 mm had taken place at the S end of Matupit Island since the 26 May survey. Uplift of 21 mm had been measured between the previous two surveys (27 April-26 May). Tilt measurements showed changes of 15-20 µrad at the S tip of Matupit Island and at Sulphur Point on the E side of Greet Harbour."
Information Contacts: D. Lolok and C. McKee, RVO.
Seismicity declines to normal levels
"Seismic activity remained low in July as 394 earthquakes were recorded . . . . The majority of the located earthquakes were in the W part of the caldera seismic zone at depths <2 km. In August, seismic activity increased slightly with 781 earthquakes detected. Most of the earthquakes were small and only 20 were locatable . . . . The epicenters were mainly around the N and E parts of the caldera seismic zone. Seismic swarms were recorded on 6-7 August (S of Tavurvur) and on 15 August (Greet Harbour). No caldera earthquakes were felt during the month. Seismicity returned to normal levels in September with 464 caldera earthquakes recorded. The locatable events numbered 15 and were distributed in the NW, N, and NE parts of the caldera seismic zone.
"Levelling measurements in July showed slight uplift at the S end of Matupit Island, although less than was recorded in June. Additional measurements on 30 August again showed uplift. The change since the previous survey (27 July) was 10-15 mm. Uplift for the past 12 months at the S end of the island was 79-95 mm. Ground deformation measurements were restricted to water-tube tilt observations and no significant changes were recorded."
Information Contacts: C. McKee, N. Lauer, L. Sipison, B. Talai, R. Stewart, and D. Lolok, RVO.
Inflation of central caldera area; small seismic swarms
"Activity in October confirmed the trend noted since April of a higher rate of inflation in the central part of the caldera and release of stress in the form of earthquake swarms in the caldera seismic zone.
"Seismicity was at its usual background level of 2-10 small events/day at the beginning of the month. Starting in mid-October, there was a steady build-up in seismicity. A small swarm of earthquakes occurred on the 28th (~40 events), and then two larger swarms on the 31st, only 3 hours apart. The last swarm contained ~600 events, including six of estimated magnitude 3-3.5, and was felt locally with intensity (MM) III-IV. This swarm, and one on 20 May this year, are the most significant events since the seismo-deformational crisis of 1983-85. Sixty-four earthquakes were located, from a total of 1,320 events recorded this month (compared to 464 in September and 781 in August). Most of them originated in the NW (Vulcan-Beehives) part of the caldera seismic zone.
"Levelling measurements have been showing a slightly accelerated rate of uplift in the central part of the caldera since early April (~12 mm/month). The swarm of 31 October resulted in uplift of ~30 mm at the benchmarks most central to the caldera (at the S end of Matupit Island). Tilt stations around Greet Harbour, near the NE quadrant of the caldera seismic zone, registered a change of 10-20 µrads. Those on the Vulcan side (W), nearer to the area of the latest seismicity, showed no significant change."
Information Contacts: C. McKee, P. de Saint-Ours, and I. Itikarai, RVO.
Inflation of central caldera area; one seismic swarm
"Daily totals of caldera earthquakes ranged from 4-163. There was only one seismic swarm during the month, on 25 November, which included 144 recorded earthquakes. The strongest event in the swarm had an estimated magnitude of 2.4 and was felt with an intensity MM III. Most of the earthquakes for the month occurred as discreet events, and on 1, 2, 3, and 16 November, >100 earthquakes were registered. The total number of earthquakes was 1,467 in November . . . . There were 72 locatable earthquakes; most originated from the NW and NE parts of the caldera seismic zone, but a few were located in its SE and SW parts. Levelling measurements on 6 December indicated that the S end of Matupit Island . . . rose ~16 mm since the previous survey on 1 November."
Information Contacts: I. Itikarai and C. McKee, RVO.
Overall seismicity declines, but some earthquake swarms
"Seismic activity declined in December when 817 earthquakes were detected . . . . Normal background level is 300-400 earthquakes/month. Sixteen of these earthquakes were located, eight of them with errors (both horizontal and vertical) of <1 km. Locations were all in the Greet Harbour area (NE part of the caldera seismic zone), with the majority at depths <2 km. The percentage of located earthquakes is lower than usual, probably due to the location of the activity. Signals from Greet Harbour were recorded on the 3 or 4 stations nearby, but generally not on enough other stations to allow locations to be calculated. Small earthquake swarms occurred throughout the first half of the month, with the largest on 6 December. The rest of the month had a more normal level of activity, with the largest swarm on 23 December. None of the earthquakes were felt; the largest being a M 1.0 event."
Information Contacts: C. McKee and R. Stewart, RVO.
Seismicity declines further; review of 1993 seismicity and deformation
"Seismic activity declined further in January, with 591 small earthquakes recorded . . . . A number of these earthquakes occurred in small swarms of 30-80 events at intervals of 1-2 weeks. Twenty-three of these earthquakes were located. As usual, they originated from the annular caldera seismic zone, mainly to the NE (Greet Harbour area) and W (Vulcan headland). Routine levelling on 4 January showed that the greatest change since the previous survey (6 December 1993) was only 4 mm uplift at the S end of Matupit Island. Other ground deformation measurements were inconclusive.
"A review of . . . 1993 shows that earthquakes occurred in all parts of the caldera seismic zone, but the W and NE parts were the most active (figure 13). Rates of seismicity and ground deformation were variable (figure 14). Seismicity showed two periods of higher level activity, March-May and October-November. Rates of uplift were low early in the year, but accelerated at the time of a seismic swarm in May. Higher rates of uplift then continued through several months of low seismicity (June-October), until the second period of increased seismicity ended in November. At the end of the year there were indications that the rate of uplift had declined. The greatest measured elevation change in 1993 (~12 cm) is consistent with the long-term rate of uplift between 1973 and 1983."
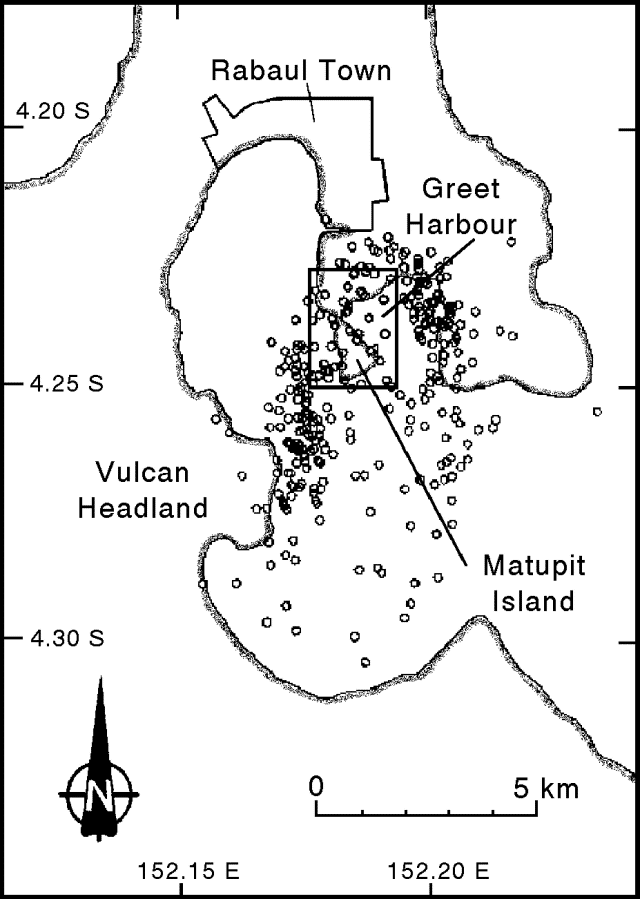 |
Figure 13. Map showing seismicity in Rabaul Caldera during 1993. Earthquakes with location error (horizontal and vertical) of |
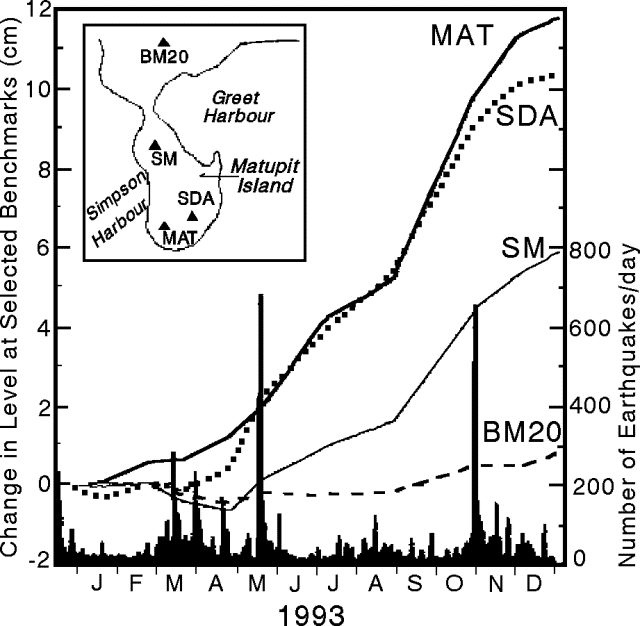 |
Figure 14. Seismicity and uplift at Rabaul Caldera during 1993. Lines show cumulative uplift (left scale) at deformation stations (inset map); solid bars show daily number of earthquakes (right scale). Courtesy of RVO. |
Information Contacts: Rabaul Volcano Observatory (RVO).
Two small earthquake swarms; uplift continues at Matupit Island
"Seismicity in February was steady at a level similar to January. The total number of recorded caldera earthquakes was 580 (compared to 591 in January). Two small earthquake swarms were detected during the month. A swarm of 53 events on 9 February was tightly clustered immediately E of Vulcan Cone. Another swarm, consisting of 173 events on 23 February, was more diffuse, with earthquakes scattered at the entrance of Greet Harbour. Altogether, 54 earthquakes in February (~9% of the total) could be located. Earthquakes, other than those of the swarms, occurred in the N and NW parts of the annular caldera seismic zone. Routine levelling on 24 February to the S end of Matupit Island showed uplift of ~20 mm since the previous measurement on 4 January. This rate of uplift is consistent with the normal uplift trend for the central part of the caldera."
Information Contacts: B. Talai and C. McKee, RVO.
Seismicity declines slightly; three earthquake swarms
"Seismicity declined slightly in March. The total number of recorded caldera earthquakes was 458 . . . . Three small earthquake swarms occurred. The first two, on 9 March, were located in Greet Harbour and near the airport; a total of 53 earthquakes were recorded that day. The other swarm consisted of 123 earthquakes on 13 March in the Karavia Bay area. During the month, 46 earthquakes were located instrumentally, 17 of them with reasonable errors (<1 km). Locations were mainly in Greet Harbour, the airport region, and ~1 km E of Vulcan cone . . . . Routine leveling to the S end of Matupit Island on 16 March showed no significant change compared to measurements made on 24 February."
Information Contacts: L. Sipison and C. McKee, RVO.
Seismicity continues to decline; additional uplift at Matupit Island
"There was a further decline in the level of seismicity in April. A total of 397 caldera earthquakes were recorded, down from 458 in March and 580 in February. Of this total, 181 earthquakes occurred during four small swarms that took place on the 13th (33), 17th (73), 19th (38), and 25th (37). Thirty-eight of the caldera earthquakes were located. About half of them were scattered evenly in the N part of the caldera seismic zone. The rest were located in the W part of the seismic zone near Vulcan. Routine levelling . . . on 2 May showed that uplift of ~25 mm had taken place at the S end of Matupit Island since the previous survey on 16 March."
Information Contacts: I. Itikarai and C. McKee, RVO.
Seismicity increases and uplift continues
"During May, 694 earthquakes were detected, compared to 397 in April and 458 in March. Of these, 51 earthquakes were located, 28 with errors <1 km.
"Seismic activity was low until 25 May; it consisted of small swarms and discrete events. On 25 May, Rabaul was subjected to its strongest seismic activity in about a year. Starting at 1043, earthquakes were felt for ~20 minutes. The maximum felt intensity was in the airport region, IV-V on the modified Mercalli scale. Two spatially separated swarms were involved. The first, including an ML 3.3 earthquake, was located in a linear zone between the airport region and Vulcan. The second swarm, which included an ML 3.0 earthquake, started ~15 minutes after the first. The second swarm was located just off the E shore of Vulcan and Vulcan Island, near the site of swarm activity in February and April (19:2-3). Both swarms were shallow (< 2 km), consistent with previous activity in these areas. Seismic activity at both centers continued throughout the rest of the day at a declining rate.
"For the rest of the month, seismic activity consisted of small and discrete events, probably located in the same region as the large swarms on the 25th. On the 26th there were two earthquakes just off the SW shore of Matupit Island, at depths around 2.2 km. These locations are not on the ring fault system.
"At 0212 on 26 May, a low-frequency earthquake was recorded on the harbor network. The signal had dominant frequencies around 1 Hz and probably originated near Matupit Island. There may have been as many as 10 similar events in the 24-hour period following the felt earthquakes.
"Routine leveling on 27 May showed that about 35-40 mm of uplift had taken place at the S end of Matupit Island since . . . 2 May. Additional leveling to Vulcan Point on 30 May showed an uplift of ~30 mm since September 1993."
Information Contacts: I. Itikarai and C. McKee, RVO.
Seismicity and deformation rates decrease
". . . Rabaul Caldera was quiet again throughout June. Routine leveling on 27 June showed that uplift of ~20 mm had taken place at the S end of Matupit Island since the previous survey on 27 May.
"There were 220 detected caldera earthquakes in June, compared to 694 in May and 397 in April. Days of higher activity (>10 earthquakes) occurred on 13, 15, 16, 19, and 23 June. On all of these days except the 16th, small swarms of earthquakes were recorded. None of these earthquakes were felt widely, although the largest, on the 13th, had a magnitude of 3.0. Only 23 earthquakes were located, 14 with location errors of <1 km. Most of the activity was located in the NE part of the caldera seismic zone. However, the swarms on the 13th and 15th included some earthquakes that appear to have originated from the SE part of the zone, although the location errors were large.
"On 23 and 24 June, the seismic station on Rabalanakaia (RAL) showed a number of unusual signals. Three types of signals were seen: brief high-frequency (~5 Hz) harmonic signals, low-frequency harmonic signals (~1 Hz) that lasted for up to a minute, and a non-harmonic tremor-like signal. The last two were man-made 'noise,' but no cause has yet been found for the high-frequency harmonic signals."
Information Contacts: D. Lolok, R. Stewart, I. Itikarai, P. de Saint-Ours, and C. McKee, RVO.
Seismicity remains low; minor subsidence
"July was relatively quiet, with 220 detected earthquakes . . . . Activity was highest in the middle of the month, with half the earthquakes occurring between 13 and 19 July, and two swarms on those days. Most of the earthquakes, including the 13 July swarm, were located on the NE portion of the ring fault on the E side of Greet Harbour at depths of 0-4 km. Most of the rest were located near the W portion of the ring fault. An exception to this was the swarm on 19 July, which was located, albeit poorly, in the center of Karavia Bay. None of the earthquakes were large enough to be felt. The largest earthquake during the month, M 2.7, occurred on 5 July. Leveling measurements on 19 July showed a very small amount of subsidence, <9 mm, at the end of Matupit Island since 27 June.
"On 13 July, signals were recorded from three earthquakes that originated outside the network, somewhere N of Rabaul. S-P times between 2 and 4 seconds were consistent with locations near Tavui caldera, an underwater caldera N of Rabaul. This caldera was only discovered in 1984 and virtually nothing is known about it. Records are currently being checked for any other seismic activity that may have come from this vicinity."
Information Contacts: B. Talai, R. Stewart, and C. McKee, RVO.
Major eruption sends plume to 18 km and covers Rabaul town with ash
Vulcan and Tavurvur, two vents on opposite sides of Rabaul Caldera (figures 15 and 12), erupted on the morning of 19 September and sent ash as high as 18 km asl. This caldera forms a sheltered harbor whose N end is occupied by Rabaul, New Britain's largest city. The report of August seismicity was sent from RVO on 9 September. Satellite interpretations are courtesy of NOAA, with TOMS data from the NASA Goddard Space Flight Center. Although communication with Rabaul was cut off for many days, RVO reports were received for 23 and 27 September. Information based on reports from local and international news services is noted, and may not be accurate.
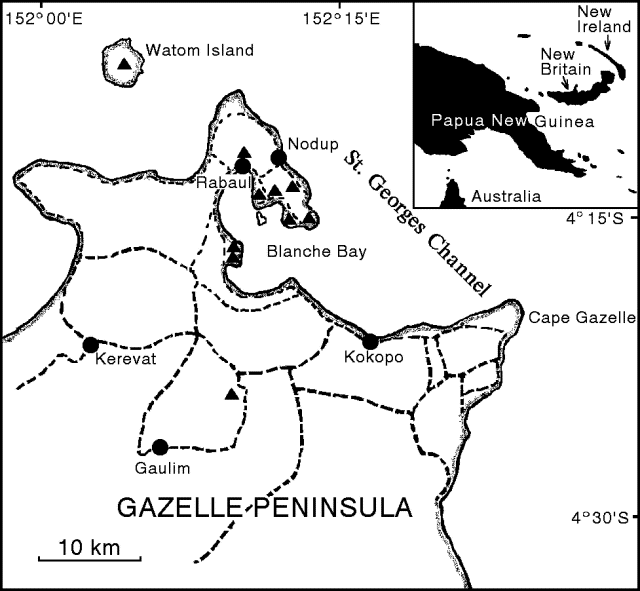 |
Figure 15. NW tip of the Gazelle Peninsula, New Britain Island, papua New Guinea, showing the road network (dashed lines), towns (dots), and volcanic centers (triangles). Modified from McKee and others, 1985. |
|
Figure 12. Map of the Rabaul Caldera showing recently active volcanic vents and extinct composite cones (modified from Almond and McKee, 1982). [copy from 18:03] |
August seismicity. The total number of detected events for August was 448 . . . . The month was quiet until 25-28 August when 227 earthquakes were detected, with more than half of them on the 26th. Unusually for Rabaul, these earthquakes tended to be discrete events not occurring in swarms. Only 34 of the August events were located, 25 of them during 25-28 August. Most located earthquakes were along the ring fault near Tavurvur, or offshore to the S and SW; 17 hypocenters had location errors ofL 2.6, but none of the earthquakes were felt. On 28 August, the caldera network recorded what appeared to be a low-frequency earthquake. Signals with a dominant frequency of ~1 Hz recorded on some of the inner network stations were very complicated with no clear phase arrivals or onsets. These signals probably originated close to the Matupit Island seismometer. No seismicity was recorded after 29 August.
Seismic precursors, 18-19 September. RVO reported that at 0300 on 18 September, a M 5.1 earthquake occurred beneath the harbor. An aftershock sequence from this event merged into an intensifying swarm of high-frequency (A-type) earthquakes. Peak intensity of this swarm occurred around 2400 that night with ~2 felt events/minute, but then tapered off slightly toward morning. By 0600 on 19 September the eruption had begun. Thus, only 27 hours of unusual seismicity preceded the eruption. Inspection of the seismograms since the onset of the eruption revealed several long-period events in the 12 hours prior to the M 5.1 earthquake.
Initial eruptive activity, 19 September. Tavurvur began erupting around 0600 on 19 September, followed by an explosion from Vulcan ~1-1.5 hours later. RVO volcanologist Patrice de Saint-Ours was quoted in press reports that day as stating that the pattern of eruptions was very similar to 1937, and that the vents were no longer visible from the observatory because of the ash cloud, estimated by ground observers to be >3 km high. Most press reports described thick mushroom-shaped pulses of ash rising from the vents, hot ash falling near the vents, and loud explosion noises. Aerial video footage showed vigorous, thick, light-brown ash columns, and the surface of the harbor covered with ash and floating pumice. Other press reports on 19 September stated that Rabaul town was covered with 20-25 cm of ash, and that thunderstorms mixed rain with the ash, forming a heavy mud that damaged buildings and vegetation. The press reports also described columns of gray ash rising thousands of meters into the air, ejecta as large as trucks, and "black muddy rain." Ash fell across New Britain and New Ireland.
A pilot report received at Port Moresby at 1034 placed the top of the volcanic ash cloud between 15 and 18 km altitude. A later pilot report noted the presence of drifting ash ~185 km SW of Rabaul well above 6 km altitude. GMS satellite imagery as late as 2132 on 19 September revealed an obvious plume fanning out to the S through WNW. The W part of the plume was tracking W and WNW at ~110 km/hour, and had moved across central Papua New Guinea; plume height was estimated to be 21-30 km, well into the stratosphere. The S part of the plume, at an altitude of 12-18 km, had begun to move SE at ~55 km/hour around an upper tropospheric ridge. A satellite infrared image taken a few hours earlier, at 1800 on the 19th (figure 16), showed similar plume morphology. Initial estimates of plume height during the first two days of activity were between 18 and 30 km. Space Shuttle astronauts who observed and photographed the plume (figure 17) estimated its height as at least 18 km based on altitudes of storm clouds in the area.
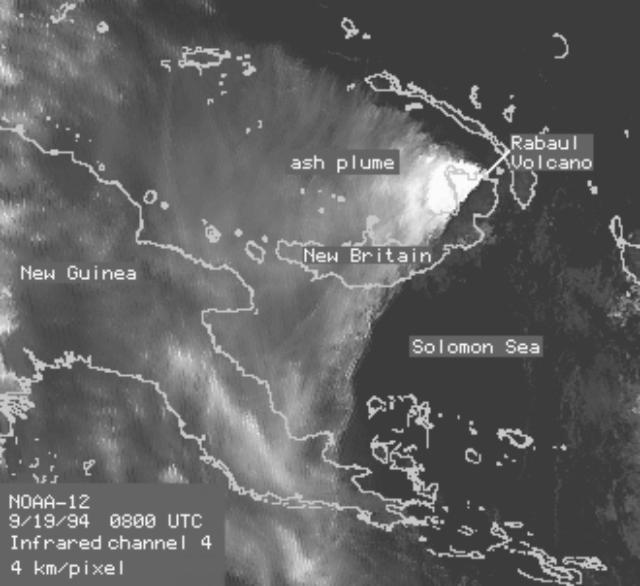 |
Figure 16. Infrared satellite image of the ash plume from Rabaul, 1800 on 19 September 1994, about 12 hours after the start of the eruption. Courtesy of George Stephens, NOAA/NESDIS. |
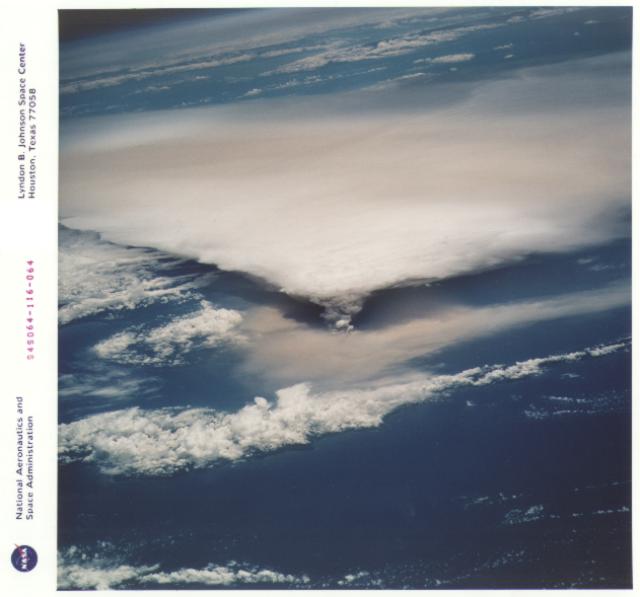 |
Figure 17. Photograph of plumes from Rabaul taken by Space Shuttle astronauts roughly 24 hours after the start of the 19 September 1994 eruption. Oblique view is to the SW. The cloud-covered island in the foreground is New Ireland, and the papua New Guinea mainland is in the distance. The eruption column rose to 18 km where it flattened out and was blown W in a fan-shaped plume. A layer of yellow-brown ash was blown towards the N by lower level winds. NASA photograph STS064-116-064, courtesy of Cindy Evans. |
Eruptive activity, 20-23 September. Video of the eruption, taken from a helicopter about 1.5 days after its start, showed massive, gray-to-black ash columns billowing vigorously from Vulcan and Tavurvur. The maximum height of the cloud was reported by the press to be ~20 km, with blocks as big as cars falling into the harbor. Black ash appeared to be falling over a wide area and scenes from Rabaul town showed buildings and vegetation blanketed by ash.
Night winds on 19 September, which were generally blowing NNE-NE (taking the ash over New Ireland), changed direction at dawn on the 20th and started blowing N-NNW, and as the afternoon progressed the winds became more westerly. By 1532 on 20 September the plume had narrowed compared to previous GMS satellite images and the core was moving WSW at ~55 km/hour at an altitude of ~12 km. As night fell on 20 September the cloud had reached the main island of Papua New Guinea between Lae and Milne Bay; residents in the town of Lae, 600 km away, reported ashfall.
On 21 September, witnesses said huge mushroom clouds of dense, black smoke and debris continued to rise high above Tavurvur and Vulcan. Much of the falling ash combined with rain, turning to a heavy mud mixture that demolished some houses and destroyed coconut plantations. The airport was buried under debris, many roads were blocked, and the harbor was covered with debris and floating pumice.
The plume was still moving WSW at 1832 on 21 September at ~7.5 km altitude, and was visible for up to 90 km SW of the origin. Soon after this time the plume was no longer clearly visible on GMS imagery, indicating that strong explosive activity, which had ejected ash high into the atmosphere almost continuously since about 0600 on 19 September, had declined. Some residents returned to Rabaul town during a brief respite from the falling ash. However, by the morning of 22 September Vulcan was ejecting massive amounts of whitish ash and Tavurvur was emitting dark blackish-gray ash. GMS satellite imagery for 1230 on 22 September revealed a new mid-high level plume that was ~40 km long and moving WSW. The plume was estimated to be at ~7.5 km altitude, and could still be seen at 1530 on GMS infrared images.
A report from RVO for the period from 1500 on 22 September through 0900 the next day indicated that volcanic and seismic activity remained relatively stable. Steady emissions continued from Tavurvur with a dark gray ash-and-vapor cloud rising ~2 km and blowing NE over Rabaul town. Low rumbling sounds accompanied the stronger emissions. At night, incandescent ejecta could be seen falling on the NW flank, but incandescence was rarely visible in the eruptive column due to its high ash content. Intermittent pulses of stronger activity from Vulcan produced jets of a vapor-rich ash at intervals of 5-15 minutes. Collapse of the column generated pyroclastic surges that traveled 2-5 km from the vent, mostly to the NE. Generally there was a low volume of ash in the eruption cloud. The column height was about 1.5 km. At night witnesses saw incandescent ejecta accumulate around the vent at the beginning of each pulse.
An aerial inspection by volcanologists at 1620-1640 on 22 September revealed little morphological change at Tavurvur, with the active vent located on the W side of the 1937 crater. At Vulcan, the only active vent was near sea level on the breached NE-flank crater. Eruptions were Surtseyan, highly explosive, and vapor-rich with low ash content. No great deformation was noted since the start of the eruption. Overall, volcano-seismic activity showed a steady small decline during 20-22 September. During the inspection, visibility over Rabaul was generally very good, but there were occasional ash falls.
On the morning of 27 September, RVO reported that Vulcan was no longer erupting, but an ash plume from Tavurvur was still present, and there was an ashy haze over Rabaul town. Seismicity had decreased to about the detection limit using the RSAM averaging method. The observatory reported ~40 mm of fine powdery ash at their location, and ~50 cm of ash at the airport, with the ash-fall layer thickening rapidly towards Matupit Island. The press initially reported up to a meter of ash in Rabaul town, but later estimates were consistently around 75 cm for most areas. No accurate mapping of the ashfall has been completed. Press reports on 25 September estimated that 25% of the buildings in the greater Rabaul area had been completely destroyed, and that another 50% had significant structural damage. Preliminary damage assessments reported on 27 September by the UNDHA indicated that 40% of the buildings in the area had been seriously damaged.
Satellite-based SO2 data. The Meteor-3 satellite overflew the eruption plume . . . at 1538 on 19 September. Preliminary results from the TOMS instrument showed SO2 column amounts no higher than background and a slight column ozone increase in the region that was most likely due to the presence of SO2. Another pass at 1520 on 20 September showed an SO2 plume of ~45,000 km2, with an SO2 mass estimated at a maximum of 80 kilotons (kt) ± 50%. At 1503 the next day, preliminary results showed that the estimated size of the SO2 plume was 50,000 km2, with an SO2 mass estimated at 70 kt ± 50%. The SO2 detected on 21 September had probably been produced since the overflight on the previous day because the small tropospheric plume noted at that time would have either dispersed or been chemically converted within 24 hours. Preliminary data from the overflight at 1430 on 23 September showed an estimated size of at least 40,000 km2 for the SO2 plume, with an estimated SO2 mass of 35 kt ± 50%. By 1410 on 24 September, SO2 column amounts were no higher than background levels in the vicinity of the volcano.
Evacuations and official response. On the night of 18-19 September, during the period of strong continuous seismicity, an estimated 30,000 people evacuated from Rabaul town and surrounding villages. Apparently, most of the people left before the eruptions began, but evacuations by road and sea to the towns of Kokopo (20 km SE) and Kerevat (~25 km SW), continued on 19 September. The airport closed just as Tavurvur began erupting. Evacuees went to missions and townships along the Gazelle Peninsula, where they were housed in camps, schools, church halls, and hospitals. Authorities were preparing to provide food and shelter for up to 70,000 people.
Ships rescued thousands of villagers off beaches near Rabaul town on 20 September. Press reports indicated that although Rabaul town was totally evacuated, there were small villages in the surrounding hills where people were trapped and taking shelter in schools and churches. As of 21 September, 45,000 people had been displaced, of whom 25,000 were located in Kokopo and the remainder at Kerevat and nearby mission and government stations. By 23 September, the UNDHA reported that a total of 53,000 people had been displaced. The only reported casualties were one boy killed when he was hit by a truck during the evacuation, and one man struck by lightning.
Following the declaration of a state of emergency in Rabaul, the Prime Minister of Papua New Guinea made a helicopter inspection on the afternoon of 19 September. NOTAMs issued from the Port Moresby Flight Information Region on 19-20 September advised pilots to exercise caution and informed them that the airspace within a 110 km radius of the Rabaul airport was closed to all air traffic unless authorized by emergency management officials. A NOTAM on the 22nd advised aircraft to avoid an abnormally colored cloud, especially yellow-brown or grayish layers. It further stated that the ash particles could contaminate engine oil and cause engine deterioration within hours. The duty manager of Air Niugini (national airline of Papua New Guinea) said all flights to and from New Britain and New Ireland provinces had been suspended. Relief flights were using an abandoned airstrip at Tokua (~20 km SE of Rabaul), which had received no ashfall.
Looting in Rabaul town was reported during both the evacuation and on 21 September, when military forces were brought in to help local police. News reports frequently mentioned looting by residents who had not evacuated or by non-residents going into the evacuated area. By the evening of 21 September, the army had sealed off all outlying roads and only allowed entry by authorized personnel.
At the request of the Papua New Guinea government, the USGS Volcano Disaster Assistance Program sent three volcanologists to Rabaul on 28 September. They took telemetered seismic stations with a PC-based data acquisition and analysis system, several telemetered tiltmeters, and other deformation-monitoring instrumentation. This equipment was requested because RVO was unable to locate earthquakes with only three seismic stations remaining in operation. The other stations were incapacitated by tsunamis, vandalism, or heavy ashfall.
References. Almond, R.A., and McKee, C.O., 1982, Location of volcano-tectonic earthquakes within the Rabaul Caldera: Geological Survey of Papua New Guinea report 82/19.
McKee, C.O., Johnson, R.W., Lowenstein, P.L., Riley, S.J., Blong, R.J., de Saint-Ours, P., and Talai, B., 1985, Rabaul caldera, Papua New Guinea: volcanic hazards, surveillance, and eruption contingency planning: Journal of Volcanology and Geothermal Research, v. 23, p. 195-237.
Mori, J., McKee, C., Itikarai, I., Lowenstein, P., de Saint-Ours, P., and Talai, B., 1989, Earthquakes of the Rabaul Seismo-Deformational Crisis September 1983 to July 1985: Seismicity on a caldera ring fault: IAVCEI Proceedings in Volcanology 1, J.H. Latter (ed.), Volcanic Hazards: Assessment and Monitoring, p. 429-462.
Information Contacts: C. McKee, R. Stewart, and I. Itikarai, RVO; J. Lynch, SAB; G. Stephens, NOAA/NESDIS; I. Sprod, GSFC; C. Evans, NASA-SSEOP; G. Wheller, Volcanex International Pty Ltd, Tasmania; Kevin Vang, Macquarie Univ, Sydney; ICAO; UNDHA; AP; UPI; Reuters; Papua New Guinea Post-Courier.
Tavurvur remains active; details of September eruptions
New eruptions began on 19 September 1994, ending a repose period of ~51 years. Following the pattern of the last two eruptive episodes (1878 and 1937-43), there were almost simultaneous outbursts on opposite sides of the caldera as the intracaldera cones Tavurvur and Vulcan began erupting at 0605 and 0717, respectively. The eruption at Vulcan was the more powerful and included a brief phase of strong Plinian activity soon after its onset. Vulcan's eruption ended on 2 October. The eruption at Tavurvur, after peaking during the first five days of activity, exhibited a slow decline. However, moderate to weak activity continued as of 28 October. By mid-late October, eight new 3-component seismic stations and two tilt stations had been installed by volcanologists at RVO with the assistance of USGS scientists. Many stations had been damaged or destroyed by tsunami, vandalism, or heavy ashfall during the eruption. The following report is from RVO.
Precursory activity. "A levelling survey along the usual route from the Rabaul Town area to Matupit Island was completed on 15 September. Compared with the previous survey on 19 July (19:07), the greatest change was uplift of ~25 mm at the S extremity of the island. This rate of uplift is similar to the long-term rate observed during 1973-83, prior to the 'Rabaul Seismo-Deformational Crisis Period' of 1983-85.
"For most of the time in the preceeding few months, seismicity gave little or no warning of the coming eruptions. The normal (high-frequency) seismicity on the caldera ring-fault was at a low level. Some low-frequency events were recorded, but their origin and significance are not yet known.
"The eruptions were immediately preceded by 27 hours of vigorous and fluctuating seismicity, which was initiated by two caldera earthquakes (max ML 5.1) at 0251 on 18 September. These earthquakes were located in the E part of the caldera seismic zone, near Tavurvur, at a depth of 1.2 km. The earthquakes were felt very strongly throughout the town and a small localized tsunami was generated. Seismicity over the following four hours took place near Vulcan and showed a general decline. Through this period, the pattern of seismicity appeared to be similar to many previous swarms of earthquakes on the caldera fault system. During the next ten hours (0600-1600), earthquakes continued at a steady rate, still concentrated near Vulcan. From about 1600 on 18 September, seismicity increased and reached a peak at about 0200 on 19 September; at this time, earthquakes were felt every few minutes. Seismicity then showed a slow decrease. Earthquake epicentres were concentrated in the Vulcan area until about 0430, when the focus shifted to Tavurvur.
"Soon after dawn on 19 September (0600), it was clear that an eruption was imminent because offshore areas had emerged. The most obvious uplift was at Vulcan, where a tide gauge was almost out of the water, indicating an estimated uplift of 6 m. The W and S coasts of Matupit Island had also been raised and the S shoreline was shifted ~70 m S.
Evacuation. "In consideration of the increased seismicity after about 1600 on 18 September, RVO recommended the declaration of a Stage 2 alert (eruption expected within weeks to months) around 1800. This was subsequently issued at 1815. Throughout the late afternoon a voluntary evacuation of the town had developed, but the release of the Stage 2 alert accelerated the process. At midnight, RVO advised the Provincial Disaster Committee that an eruption was imminent. By this time, people had congregated in Queen Elizabeth Park in the centre of Rabaul Town. Transport was mobilised, and during the next few hours people were ferried from the town area to beyond the caldera rim. RVO recommended a Stage 3 alert (eruption expected within days to weeks) in the early hours of the 19th, but the Disaster Committee refrained from a declaration because the evacuation appeared to be proceeding well. It was feared that announcement of a higher stage of alert might be counter-productive. The evacuation went smoothly and by around 0700 on the 19th, the town and high-risk areas were virtually deserted.
Outbreak of eruptions. "An aerial inspection had been arranged for early morning on the 19th. While waiting on the Rabaul airstrip, a small white emission cloud was noticed above the W rim of Tavurvur's summit crater at about 0603. Three minutes later, ash was seen in the emissions which appeared to originate from the SW part of Tavurvur's 1937 crater. The intensity of the emissions was low as billowing, grey, cauliflower-shaped ash clouds rose slowly and with little sound (figure 18). The ash clouds rose only a few hundred metres and were driven towards Rabaul Town by moderate SE winds. At about 0618, the ash plume had reached the S limits of the town. The strength of the eruption remained low over the next hour as darkness descended on Rabaul.
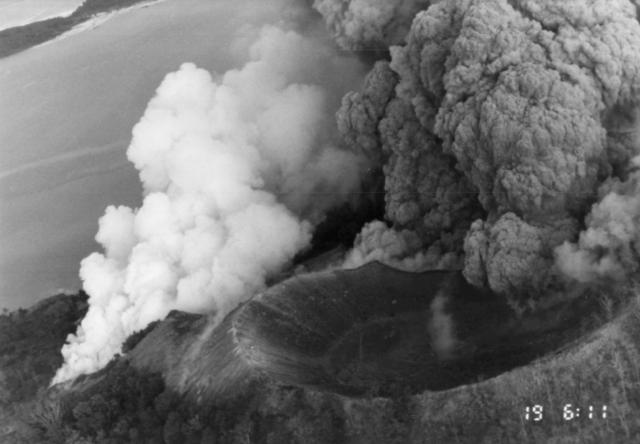 |
Figure 18. Photograph of Tavurvur taken from a helicopter at 0611 on 19 September 1994, just after the onset of activity. Note the 1878 cone (right foreground) being eaten away. View is approximately towards the ENE. Courtesy of Rod Stewart, RVO. |
"The eruption of Vulcan commenced at 0717 on 19 September with relatively small explosions on the N flank of the Vulcan 1937 cone. However, activity intensified rapidly, and by 0737 low-density pyroclastic flows were being generated and the eruption column was rising rapidly. Run-out distances of ~2 km were common for these early pyroclastic flows. At 0743, ballistic ejecta were seen landing in the water up to 1 km from the E shore of Vulcan. At about 0745 a phase of very strong activity commenced. Continuous explosions generated a Plinian eruption column that attained a height of ~20 km. The sounds of this activity were of dull thudding, quite a contrast to the sharp, loud reports of electrical discharges around the eruption column. By 0830, Rabaul Town and surrounding areas were enveloped in darkness by the spreading ash canopy. The phase of Plinian activity had ended by about 0830, but strong ash emission continued.
"A number of tsunami were generated, probably by the Vulcan activity. The largest of these rose ~5 m above high water. The SW and W parts of Matupit Island were hit numerous times by tsunami, washing inland as far as several hundred metres. Small boats were carried inland ~60 m at the head of Rabaul Harbour.
Continuing eruptions. "The activity at Tavurvur increased through the 19th and the eruption column was estimated to have reached a maximum height of ~6 km. Only one vent was active. The eruption column was very dense and the moderate SE winds drove the ash plume directly over Rabaul. No pyroclastic flows were generated at Tavurvur. Over the next few days activity at Tavurvur waned slightly. The eruption column was usually ~1-2 km high. The dense dark grey-brown ash clouds fed a plume that continued to blanket Rabaul Town with fine ash.
"At Vulcan, at least four vents were active. The main vent was at the point of the eruption outbreak. Another vent slightly to the N was active briefly. A vent in the crater of the 1937 Vulcan cone and one on its SW flank also were active. Two more phases of Plinian activity took place at Vulcan in the evening of 19 September between about 1830 and 1930. The intensity of this activity was considerably weaker than the first Plinian phase. Pyroclastic flows were formed throughout the first few days of the eruption. The largest of these extended ~3 km. Pumice from Vulcan formed a large raft that covered most of Simpson Harbour.
Sequence of felt earthquakes and decline of eruption. "On 23 September, between about 1850 and 1900, there was a sequence of strongly felt caldera earthquakes. The largest of these had an estimated magnitude of 3.5. Most of the seismic stations had been lost during the first day of the eruption, so it was not possible to locate any of these earthquakes. However, most of them appeared to originate from the SE part of the caldera. These earthquakes may have been due to structural re-adjustment of the caldera to the eruptive removal of significant quantities of magma. On the morning of 24 September, a marked decline was evident in the activity at Vulcan, and a lesser decline was seen at Tavurvur. This may have been connected with the sequence of earthquakes the previous evening. The eruption at Vulcan ended on 2 October, but Tavurvur continued erupting, generating an eruption column 1-2 km high and a plume ~20 km long.
Lava flow at Tavurvur. "A small lava flow was first noticed in the summit crater of Tavurvur on 30 September. The aa lava was emerging from a sub-terminal vent on the W flank of the growing ejecta cone. The flow rate was extremely low as the lava slowly advanced towards the W rim of the summit crater. On 5 October, a new lava lobe was seen overriding the first lobe in the summit crater of Tavurvur. This lava lobe also advanced very slowly and eventually reached the nose of the first lobe. The length of these lobes was ~100 m. Lava continued to be fed into these lobes after they had stopped advancing, causing them to thicken. Eventually, on 8 October, a breakout occurred on the W side of the original lobe. A more fluid black lava emerged, ponding between the earlier lava flows and the W crater rim. On 12 October, following a considerable growth of the body of lava within the crater, lava began spilling over the crater rim and descending Tavurvur's W flank. A second lava breakout from the earlier bulky flows within the crater took place on 14 October. This became the main feeder for the slowly advancing lava flow on the W flank of the cone. It remained active until about 25 October.
Tephra from Vulcan and Tavurvur. "The tephra from Vulcan was pale grey-brown pumice and ash, probably of dacitic composition. In contrast, Tavurvur's tephra was dominated by very fine-grained ash. Accretionary lapilli were abundant throughout both sequences and a number of ash units were extremely hard, apparently having self-cemented on deposition. The base of the Tavurvur sequence was marked by a blue-grey very fine ash that appeared to be rich in sulphides. This material probably originated as a hydrothermal clay on the crater floor. Late in the Tavurvur sequence was a pumiceous unit that may be sub-Plinian. During 8-18 October, strong explosions ejected ballistic material as far as 1.5 km from Tavurvur's summit. Large blocks (to ~1 m size) were found partially buried in the road around the N and E foot of Tavurvur. These ejecta included a mixture of dense glassy lava blocks, porphyritic lava blocks, and pumiceous bombs.
Sulfur dioxide emissions. "SO2 emission rates from Tavurvur were measured in the period from 29 September to 6 October by Stan Williams (Arizona State Univ). Preliminary results indicated a progressive decline from ~30,000 to ~3,000 t/d.
Ground deformation. "Tilt measurements, which started at Matupit Island on 24 September, indicated a large deflation (~930 µrad) of the central part of the caldera compared with pre-eruption values, and a slowly reducing rate of deflation during the eruption. The rate of deflation declined from ~10 to ~2 µrad/day between 24 September and 25 October. Sea-shore levelling measurements, which started in late September, indicated minor subsidence over most of the caldera compared with pre-eruption levels. The greatest subsidence was ~80 cm in the area of Rabaul Airport, between Matupit Island and the town. About 3 m of uplift was recorded at the E shore of Vulcan and slight uplift was recorded at the S end of Matupit Island. Geodetic levelling from outside the caldera, through Rabaul Town, and onto Matupit Island, confirmed these results.
Effects of the eruption. "The official death toll from the eruptions and associated events was five; four of which were due to house roofs collapsing. One person was killed by lightning. Over 50,000 people have been displaced by the eruptions and were in care centres in safe areas of the Gazelle Peninsula as of the end of October.
"The rapid accumulation of ash on Rabaul Town caused collapse of some buildings within a few hours of the onset of the eruptions. Ashfall from Tavurvur in the first few days of the eruption caused widespread damage in Rabaul Town; virtually every building in the S part of town collapsed. Serious structural damage was sustained by most buildings in the ashfall zone within 8 km of Tavurvur. All housing in the immediate area of Vulcan (to ~2 km) was destroyed within ~1 hour of the start of the Vulcan eruption by a combination of pyroclastic flows and heavy ashfall.
"Heavy rainfall during the first day and night of the eruption exacerbated the effects of heavy ashfall. Mudflows and floods were widespread in the Rabaul Town area, near Vulcan, and immediately outside the Rabaul Caldera to the NW. The most serious floods were NW of the caldera, where the heavy ashfall caused rapid runoff and eventual deep erosion and migration of stream channels. The obliteration of rainforest cover around Rabaul will present a serious risk of flash floods and mudflows at times of heavy rainfall. The wet season in Rabaul normally starts in early December.
Satellite imagery. "The westwards-spreading ash plume . . . was clearly visible from Earth-imaging satellites. A wide-angle plume (90°) was seen on a series of Japanese GMS images as a triangular area at 0903 of 19 September, spreading at different wind levels in a fan extending from Rabaul. The N edge of the plume trended NW, and the S edge to the SW, extending across the E Bismarck Sea and moving down the N coast of New Britain.
"A similar spreading pattern was seen on images (IR channel 4) from the NOAA-12 polar orbiting satellite (19:08). The SE margin of the cloud at 1800 on 19 September was seen curving S over the Solomon Sea and SE New Guinea, with the NE margin extending past Manus Island. All parts of Papua New Guinea to the W of these margins were covered by the eruption cloud. The strongly sheared cloud seen on subsequent images was being driven S and then E by high-level winds towards the Fiji region.
"AVHRR imagery from the Nimbus-7 satellite showed similar ash-cloud dispersal patterns. However, computation of the temperature differences recorded between AVHRR IR channels 4 and 5 at 1905 on 19 September and 0747 the next day yielded unexplained patterns in which negative temperature differences (T4-T5), thought to be indicative of ash-bearing clouds, were restricted to 1° of latitude W of Rabaul (F. Prata, pers. comm. to RVO). In addition, the SO2 signature seen on TOMS images at 1520 on the 20th and 1503 on the 21st (19:08) were restricted to the E corner of the Bismarck Sea W of Rabaul, or over the general Rabaul area. Both of these aspects of the satellite imagery require further consideration and study."
Jim Lynch (NOAA Synoptic Analysis Branch) provided the following satellite interpretation. NOAA and GMS satellite imagery clearly depicted the volcanic plume during the first three days of the eruption (19-22 September). The size and shape of the plume during the first 18 hours is shown on figure 19. By correlating plume drift with available wind data, the maximum height of the original plume was estimated at 21-30 km altitude, well into the stratosphere. The eruption maintained the plume to this altitude for ~12 hours before tapering off to 12-18 km. After the first 56 hours of continuous activity there was apparently a 6-hour respite, after which the eruption resumed at a moderate intensity, generating a plume to 21 km) blew W and WNW toward Borneo and Southeast Asia; however, the plume became too diffuse to track beyond 1,300 km from the volcano. The upper tropospheric plume (12-18 km) tracked SW, then S, and finally SE for ~1,000 km around an upper-level ridge before it became too diffuse to track with standard infrared imagery. The denser, more opaque portion of the plume remained within ~400 km of the volcano. Analyses of visible, infrared, and multispectral imagery from NOAA-12 and GMS satellites definitively depicted an ash plume only within 1,000 km of the volcano. Analysis of TOMS data revealed a relatively small amount of SO2 (80 kt) close to the volcano (19:08). The fact that a dense plume of ash and aerosols did not remain in the upper atmosphere suggests that the ash plume was composed mostly of large particulates that fell out of the atmosphere near and just downwind from the volcano.
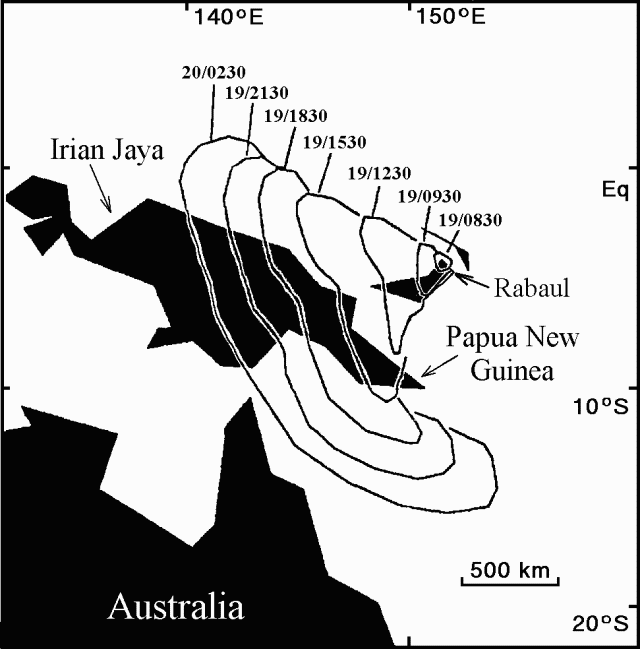 |
Figure 19. Areal extent and propagation of ash from Rabaul by upper-level winds from 0830 on 19 September to 0230 on 20 September 1994. Isochrones are based on analysis of GMS infrared imagery. Courtesy of Jim Lynch, NOAA. |
Information Contacts: C. McKee, with contributions fromRVO Staff and R. Johnson, RVO; J. Lynch, SAB; D. Dzurisin and C. Miller, CVO.
Tavurvur activity decreasing; its lava flow stops; minor subsidence
"The eruption . . . continued throughout October. However, only one of the two centres initially active, Tavurvur, on the NE part of the caldera, remained in eruption. It displayed moderate Vulcanian-type activity, accompanied by the production of a lava flow. Eruptive activity at the other intra-caldera cone, Vulcan, on the W side of the bay, ended on 2 October. Thereafter, its activity was reduced to weak fumaroles and bubbling pools of water at the bottom of its new NE crater.
"Overall, the level of activity at Tavurvur progressively decreased, in spite of variations in the strength, frequency, ash content, and height of its Vulcanian explosions. Only one crater was active on the E side of the cone; up to four were active in the first few weeks of the eruption. During the first few days of October, explosive phases occurred at intervals of 30-120 seconds. They produced billowing columns rising dynamically, with large ballistic fragments, up to 400-800 m above the crater. In between, ash emission was usually continuous though less forceful. Occasionally, the vent remained free of emissions for a few minutes. A second vent on the W side of the same crater occasionally produced a darker but weaker emission, with apparently unrelated frequency. Depending on wind strength, the emission plume levelled off between 1 and 2 km height, and spread W over the town of Rabaul, the pale yellow to brown mass remaining visible for 20 km.
"Through October, the interval between explosive phases increased, though irregularly, to 1-4 minutes. Explosions were irregular in strength but rose less and less frequently to >600 m, and the ash content of the plume decreased. The visible extension of the plume also decreased to ~15 km. Longer periods of weak activity were commonly followed by larger (and louder) explosions that ejected ballistic material as far as 1.5 km from Tavurvur's summit, onto the lower slopes of the cone or into Greet Harbour. During periods of lesser ash content in the emission, these projections caused incandescent night displays (22-27 October). At times of dense ash emission, lightning occurred under and around the plume. Sound effects of the eruption were variable. Rumbling sounds were the most common and apparently louder during periods of lesser ash content in the emission. At other times, Tavurvur could be silent for a couple of hours, or even days, without noticeable change in activity. The largest explosions (like at 0640 on 14 October or 2125 on the 16th) were heard as impressive, sharp detonations up to 20 km away and their air-waves were felt up to 10 km away.
"Backfall of material around the vent progressively built a cone ~30 m high with a radius of ~80 m. Light ashfall on the town of Rabaul and beyond it on the N coast continued throughout October. The first torrential rainfalls of the pending rainy season contributed to the major destruction within the town area. Most buildings in the S and central parts of Rabaul township collapsed under the weight of 0.3-1.2 m of ash/mud. Subsequent rainfalls also caused large flash-floods of mud that temporarily cut off access roads and flooded several buildings and villages. Earthmoving equipment was used to construct drains and barriers in an attempt to alleviate destruction in the remaining parts of town from expected mudflows at the start of the rainy season in December.
"A viscous lava flow, aa to blocky in texture, began on 30 September from a source SW of the main active vent of Tavurvur. Its flow rate was extremely low and its progression slow. On 5 October, as this lobe was still moving within the lower W part of the crater, a new lobe formed and started to override it. On the 8th, an outbreak of apparently more fluid, darker lava started on the W side of the original lobe source. The two initial lobes merged together on 12 October as they started to spill over the lower side of the crater rim onto the W flank of Tavurvur cone. On the 14th, a new lobe started to form from an outbreak through the flow, near the initial source. This became the main feeder to the combined flow system, although it progressed slower and slower until 25-27 October when the flow-front stopped ~100 m below the rim of the cone, 2/3 of the way to the coast.
"The extensive pumice raft, formed as a result of the early Plinian phases and pyroclastic surges, kept drifting across the bay in response to wind shifts. At times of strong SE winds it occupied the N half of the bay, packing to thicknesses of up to 1.7 m (G. Halls, Hydrographic Surveys, Pty Ltd, pers. communication). A few hours of lull or a reversal in the trade wind, and it decompressed and spread over the SE part of the bay, only to drift back a few hours later.
"Ten of the 14 stations of the RVO seismic network were progressively disabled by volcanic products, lightning, interruption of power supply, or vandalism, within the first week of the eruption. By early October, however, in a prompt response to an RVO and PNG Government invitation, a team from the USGS Volcano Disaster Assistance Program was on-site deploying a network of 10 digitized stations with P-picker, Tom Murray's RSAM, and Willie Lee's data management systems on personal computers.
"Following the end of eruptive activity on the Vulcan side, seismicity was scattered under the whole caldera, including outside the usual annular seismic zone. A high concentration of events at Tavurvur corresponded to explosion earthquakes. The level of seismicity indicated by RSAM and the number of detected events showed a general decline, with some fluctuations, throughout the month (figure 20). Most detected events consisted of low-frequency and explosion earthquakes with delayed air-phases distinctive throughout the network.
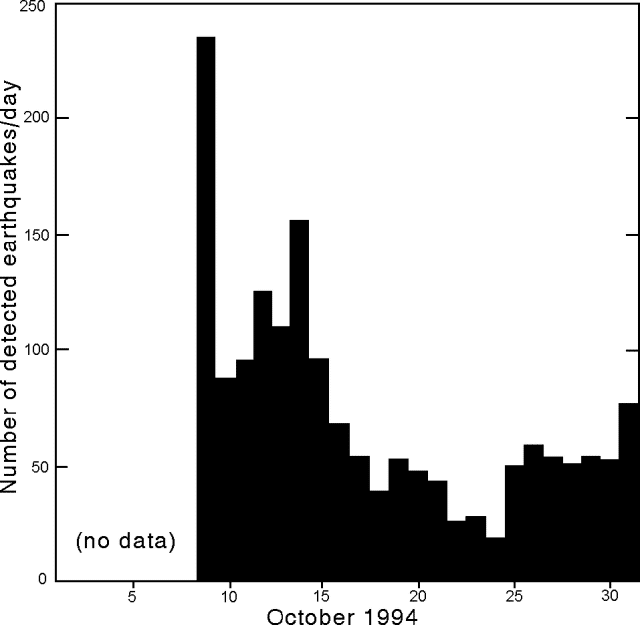 |
Figure 20. Fluctuations in the level of seismicity recorded at Rabaul, October 1994. Courtesy of RVO. |
"All real-time ground deformation monitoring (electronic tilts and tide gauges) had progressively been lost over the last few years prior to the eruption by lack of appropriate funding. From the onset of the eruption, ash density in the bay prevented EDM monitoring. For the first week thereafter the only accessible ground deformation data were from two water-tube tiltmeters on the outer caldera rim. They indicated radial deflation of the caldera, which started with the triggering earthquakes (ML 5.1) on 18 September and amounted to 30 and 37 µrad, respectively, by the end of September. By late September a few other stations had been recovered, including a dry-tilt array near the centre of the caldera at the S end of Matupit Island. In early October two electronic tiltmeters were deployed by the USGS team. Sea shore surveying around the bay resumed on 27 September, and geodetic levelling to Matupit Island on 4 October.
"All collected data revealed a caldera-wide subsidence amounting to ~1 m near the centre and 20-30 cm near the edges. The resulting bowl-shaped subsidence is, however, perturbed by the residuals of a pre-eruption uplift on the night of 18-19 September around the two pending eruptive centres, which amounted to 5-6 m on the E shore of Vulcan and 1-2 m at Tavurvur and Matupit Island. Minor caldera subsidence continued through October, although mainly affecting the central area within 3 km of Tavurvur. The maximum measured subsidence amounted to 20 cm at the Tavurvur tide gauge, near the long-recognized apex of ground deformation, with progressively decreasing rates from ~1.5 to 0.4 cm/day. Simultaneously, the Matupit Island tiltmeter recorded a deflation of >110 µrad, radial to the same centre of deformation, at a slowly decreasing rate (figure 21)."
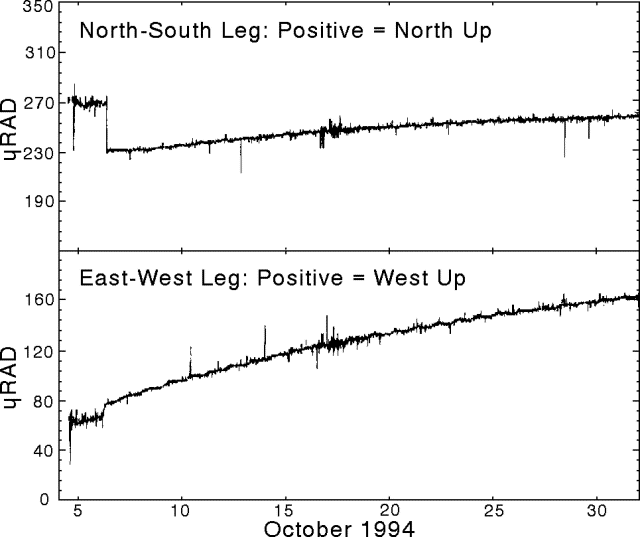 |
Figure 21. Changes recorded by the Matupit Island tiltmeter, October 1994. Although an upward trend is seen on the plot, the change reflects a steady deflation of the central part of the caldera. Courtesy of RVO. |
Information Contacts: C. McKee and P. de Saint-Ours, with additional contributions fromRVO Staff, RVO; T. Murray, A. Lockhart, and E. Endo, CVO; R. Johnson, AGSO; H. Davies, Univ of Papua New Guinea.
Explosions from Tavurvur show steady decrease in frequency
"The eruption . . . continued through November. Tavurvur exhibited moderate Vulcanian activity that declined slowly in strength, while Vulcan remained quiet. Vulcan exhibited only weak fumarolic activity from four small vents filled with bubbling water at the base of the new crater.
"Activity at Tavurvur consisted mainly of discrete explosive pulses. The ash content was generally low, producing a pale-grey emission column. The size of, and timing between, explosions was variable, but there was a general decline in activity during November. At the beginning of the month, explosions were 1-4 minutes apart and the emission columns rose forcefully to ~1.5 km. By the 6th, the intervals were 1-10 minutes and the crater was sometimes clear of emissions. Blue vapours were seen around the active vent at the bottom of a 50-m-high tephra cone. There were, however, large explosions on the 5th, 6th, and 9th which showered the flanks of Tavurvur with blocks and bombs, and produced a large billowing cloud up to 2 km high. From 9-19 November, emissions were mainly of white vapour with occasional explosion clouds up to 1 km. The eruption was mainly silent, except for rumbling and roaring noises on the 10th and 11th.
"The Tavurvur crater was never freely open during this phase of the eruption, but was clogged up with a mass of rubble, welded together and sometimes glowing. The dark ash-laden billowing clouds that suddenly rushed out of the vent every few minutes seemed to percolate through the rubble. A lava mound, 10 m in diameter and 2 m thick, formed over the vent on the 15th but was destroyed by a large explosion the next day. A new lava mound had formed by the 18th, this time 20 m across and 4 m thick, possibly consisting of two lobes and fractured into four main blocks. The intermittent ash-laden emissions were then hissing out from under the sides of the mound. Details of the crater could not be seen again until the 25th, when all traces of the lava mound had disappeared from the base of the bowl-shaped crater, presumably blown out by the large explosions heard at intervals of 1-4 hours on the 19th.
"From the 19th until the end of the month explosions were generally mild. Large explosions, however, occurred on 20-22, 26, and 29 November. At night, these explosions resulted in a shower of incandescent blocks on the flanks of the volcano. Sizeable blocks were occasionally found in the Talwat road that goes around the base of the cone.
"Seismic activity in the caldera was lower in November than in October. It was dominated by shallow explosive and low-frequency earthquakes associated with the eruptive activity at Tavurvur. RSAM amplitudes and event counts showed a marked decline between 29 October and 2 November (figure 22). Throughout the rest of the month, the data were dominated by diurnal meteorological effects, although a gradual decline could still be seen. Data captured on the seismic data-acquisition system showed an average of ~6.5 low-frequency and explosive events per day, compared to almost 26 per day in the second half of October.
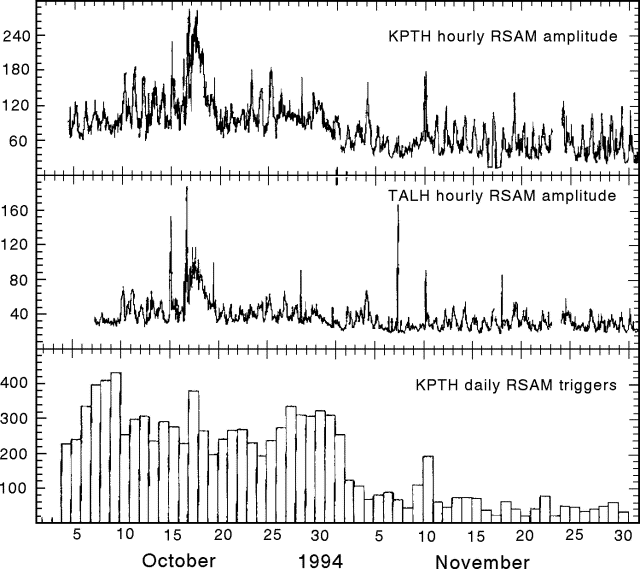 |
Figure 22. Seismicity at Rabaul (station KPTH), October-November 1994. Courtesy of RVO. |
"Before the eruption, seismic activity . . . was dominated by high-frequency earthquakes located on the caldera ring-fault system. Since the eruption, there have been few high-frequency earthquakes detected (58 in October and 37 in November, compared to normal pre-eruption levels of 200-300/month) and most of these were located away from the ring fault or in previously inactive regions of it. The level of seismicity cannot be easily compared to earlier pre-eruption levels because totally different seismic detection systems were used. However, it is believed that the level is much lower than before the eruption. This, and the fact that the majority of the epicenters are away from the ring-fault system that previously contained almost all of the seismicity, suggest that the caldera is no longer in a highly pressurized state.
"Ground deformation determined from electronic tilt meters and dry-tilt measurements indicate a reduction in the rate of deflation of the caldera since the onset of the eruption. This change is illustrated by an offshore pylon near the centre of deformation, 2 km S of Tavurvur, which subsided by 8 cm in November, compared to 18 cm in October and at least 45 cm in the last 10 days of September."
Information Contacts: B. Talai, R. Stewart, and P. de Saint-Ours, RVO.
Explosive activity at Tavurvur declines and finally stops
"The 1994 eruption . . . stopped in December. Explosive activity at Tavurvur varied in strength during the month and stopped completely on 23 December. Vulcan remained quiet, with the last explosive activity on 2 October. Vulcan exhibited only very weak fumarolic activity during December from both the 1937 and 1994 craters. A landslide took place on the NW portion of the inner wall of its 1994 crater some time between 2 and 5 December, leaving a near-vertical face.
"Following the decline in explosive activity during November, there was very little activity at Tavurvur on 1-2 December. A new phase of explosive activity began at about 2300 on 3 December; this peaked in intensity on the 5th and then declined slowly until 19 December. The decline was evident in the ash content of the clouds and their height (up to 2 km altitude at the peak of activity) but not in the interval between explosions (1-40 minutes). Ash emissions usually lasted for about a minute. The ash clouds were blown mainly NNW over Rabaul Town, where there was light-moderate ashfall, and occasionally to the SE. A series of explosions would sometimes create a discontinuous ash plume. There were no audible sounds associated with the explosions. During an aerial inspection on 9 December, a small lava mound was seen on the floor of the crater and incandescence was seen in cracks between the rocks.
"At night on 19 and 20 December, weak roaring and rumbling sounds were heard; incandescent projections were noted on 20 December. At 0137 on 21 December there was a large explosion that was heard and felt over a wide area. For the next two days, there were many of these explosions as well as some long (up to 6 hours) periods of quiescence. The ash content of the explosion clouds was higher than during the first two-thirds of the month and the ash emissions lasted up to 3 minutes. Due to changes in the prevailing wind direction, a 20-km-long horizontal plume spreading both NW and SE was generated at a height of 1-2 km. On 23 December, there were only a few short periods of weaker explosive activity. The last explosion noted occurred at 1500. From then until the end of the month, the only visible activity was emission of white vapour, low-moderate in volume, from the crater. The vapour rose several hundreds of metres above sea level, rarely to a kilometer.
"Seismicity in December consisted mainly of explosive and low-frequency earthquakes associated with the activity at Tavurvur - the level of seismic activity followed the visual activity. Between 13 and 19 December, a new type of event came to dominate the records. These events were of longer duration and lower amplitude than the low-frequency events that had been recorded since the start of the eruption. More normal events returned with the explosive activity on 20 December and continued until the 26th. Seismic activity was very low from then until the end of the month. There were again very few high-frequency earthquakes: 30 in December, compared to 37 in November and 58 in October. Ground deformation from electronic tiltmeters and dry-tilt measurements showed a further reduction in the rate of deflation. There were reports of a rainbow linking Tavurvur and Vulcan on 25 December."
Information Contacts: D. Lolok, R.Stewart, and B. Talai, RVO.
Fumarolic activity with little seismicity or deformation
"The two active cones . . . showed only fumarolic activity in January; the activity at Tavurvur declined during the month. Seismic activity was low throughout January, although small volcanic earthquakes continued to be recorded. Ground deformation was also low. The Stage IV alert for Rabaul was canceled on 5 January, and reverted to Stage I.
"There was no further explosive activity at Tavurvur following the last Vulcanian explosion on 23 December 1994. Only fumarolic activity has been observed since that date. The amount of vapour released declined gradually during January. Up until the middle of the month there was still a distinct plume rising to several hundred meters above the crater. By the end of the month, however, there was only intermittent vapour release, with an occasional small plume. No fumarole temperatures have been measured.
"Although the external shape of Tavurvur appears to be little different, the internal crater structure was totally changed by the 1994 eruption. Almost all of the crater features produced by eruptions in 1878, 1937, 1941, and 1942 were destroyed and replaced by a single shallow bowl-shaped crater. The low point of the crater is still on its W side, where the 1994 lava flow exits. Inside the main crater, slightly off-center to the SE and taking up perhaps a third of the crater floor, is a single cone, which was built up during the later stages of the 1994 eruption. The cone's crater is almost hemispherical and the vent is no longer visible due to the accumulation of debris on the crater floor. During January, as crater temperatures dropped, both the inner and main craters became very brightly colored with sulphur and other precipitates. Fumarolic activity was concentrated in the inner crater, although there were some fumarolic areas in the main crater. There was also a distinctive blue-vapour fumarole about halfway down the 1994 lava flow, rising through the flow. This appears to have been active since the very first minutes of the eruption. Vulcan continued to exhibit only very weak fumarolic activity from both the 1937 and 1994 craters.
"Earthquake activity in January consisted of both high- and low-frequency events. There were very few high-frequency earthquakes (28) continuing the pattern of low activity seen since the eruption. Located earthquakes tended to be in either of two distinct zones. The first is shallow (1 km) and to the S of Vulcan, extending into Karavia Bay. The second is deeper, 3-5 km, and is located under the NE edge of the seismic network, with epicenters between Namanula Hill and Nodup on the NE coast. Earthquakes in the first zone are undoubtably due to structural readjustment following the Vulcan eruption. The cause of the earthquakes in the other zone is not yet known; it is not part of the ring fault. The last occurrence of earthquakes in this region, May 1992, was followed by an increase in seismic activity and ground deformation.
"At the end of December the number of volcanic earthquakes associated with Tavurvur dropped to a very low level. Starting on 29 December, however, a new type of low-frequency earthquake was recorded. These were only seen on three seismic stations in the N part of the network and, because of their emergent onset and variable waveforms, it was impossible to locate them; the most likely locations are in the NE portion of the network, perhaps even outside it. These events continued through January at an average rate of 14/day although >25/day were recorded on 12-14 and 30 December. Only a few Tavurvur volcanic earthquakes were recorded during the month. This level of activity is very low compared to that during the eruption and is probably due to a minor readjustment in the caldera's plumbing system - there may be a connection with the Namanula/Nodup high-frequency earthquakes.
"Electronic tilt data showed that the amount of ground deformation declined in December. The station on Matupit Island, which seems to be the most stable, showed that deflation following the eruption has gradually declined to ~0.5 µrad/day in the second half of January, with the center of deflation to the S of Matupit. The peak deflation rate, shortly after the equipment was installed at the beginning of October, was >3 µrad/day. Other ground deformation data confirm this trend.
"Following a recommendation from the RVO, the East New Britain Disaster Committee declared on 5 January that the level of alert for Rabaul was being reduced from Stage IV to Stage I. This was based on the cessation of volcanic activity at both Tavurvur and Vulcan and the continuing decline in ground deformation and seismicity, indicating that no resumption of eruptive activity was likely. Although no longer a hazard to what remains of the town of Rabaul, the two cones are still off-limits to the general public.
"Rabaul has remained under a State of Emergency, with access to the town controlled, because mudflows and flooding are still perceived to be a serious hazard. To date the rainy season has been unusually dry without any persistent periods of heavy rainfall. Mudflows and flash floods have already caused some damage and the roads into Rabaul are washed out after even slight rain, but there is great potential for more damage. Large amounts of ash still remain in the high ground surrounding Rabaul and there are large areas of potentially unstable land that have been exposed by the destruction of vegetation. The rehabilitation of areas affected by the eruption continues in a haphazard fashion. With the end of explosive activity, ashfall stopped being a nuisance and this has accelerated the rehabilitation of the Nonga area on the N coast. In Rabaul itself, most of the activity consists of clearing-up operations. However, a number of businesses have been re-established, the port is open and taking large ships, and one of the hotels has re-opened."
Information Contacts: H. Patia, R. Stewart, and B. Talai, RVO.
Renewed eruptive activity at Tavurvur
"Eruptive activity resumed at Tavurvur on 13 February after one and a half months of quiescence; no precursory activity was detected. Following the end of the 1994 eruption on 23 December, Tavurvur had exhibited only fumarolic activity. The amount of vapour released declined during January and emissions became intermittent in the first half of February. Seismicity was low, although some volcanic earthquakes continued to be recorded. The deflation rate of the caldera was also extremely low.
"After about 0100 on 13 February, small explosions started from Tavurvur's 1994 crater. Activity increased during the early hours of the morning, and large explosions occurred at 0328, 0857, 0919, 0937, 1012, 1100, and 1230. Each of these lasted 2-3 minutes and generated ash clouds that rose 1,500-3,000 m above the crater. Some of the ash clouds were laced with lightning. Ballistic blocks were seen falling onto the flanks of the cone and into the sea around Tavurvur. Between the larger explosions, emissions were less energetic or in "puffs" over periods of 5 minutes or more. After the first day, the emissions generally rose 500-1,000 m above the crater and were blown SE, producing a 10-km-long discontinuous, diffuse, pale-grey plume.
"Each of the explosions was accompanied by a distinctive explosive or low-frequency earthquake whose amplitude corresponded to the size of the explosion. Changes in the eruptive activity could therefore be tracked using RSAM data from station KPTH on Matupit Island (figure 23). An analysis of RSAM 1-minute data produced the event counts and mean amplitudes shown in figure 23. These showed that after a few hours of large events, at an average rate of ~10/hour, the activity was dominated by smaller explosions that peaked after about a day and a half on 14 February, at an average rate of 15/hour. The number of explosions and their amplitude then declined over the next 2-3 days. On 17 and 18 February, however, the activity increased again, perhaps associated with heavy rain on the 16th and 17th. The event count stayed fairly constant until the end of the month, although event amplitudes exhibited a slowly increasing trend.
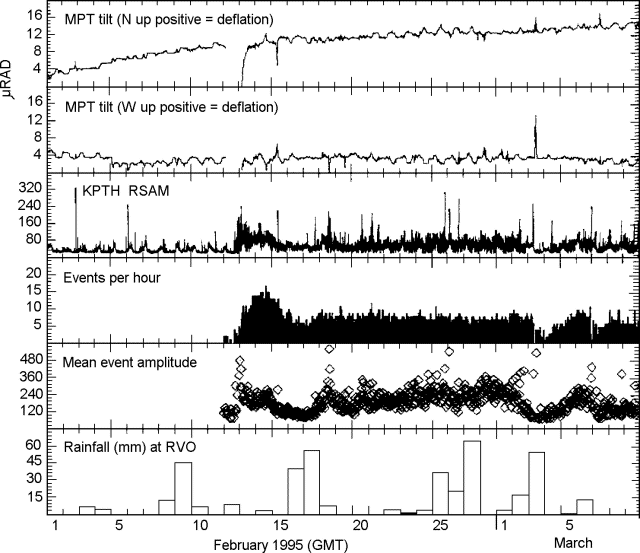 |
Figure 23. Rabaul tilt and seismicity measured at stations MPT and KPTH on Matupit Island, 1 February-10 March 1995. Positive N and W tilts indicate deflation of the caldera. Note that times are GMT (= local time - 10 hours). Courtesy of RVO. |
"Apart from the low-frequency explosive events associated with the Tavurvur eruption, earthquake activity at Rabaul was very low in February. There were only four small high-frequency earthquakes recorded, compared to 28 in January. Two were located at shallow depths near Vulcan and the other two were outside the seismic network to the NE.
"Throughout the first part of February, ground deformation data continued to show the slowing deflationary trend seen since September 1994, with the deflation centered S of Matupit Island. Electronic tilt data from station MPT on Matupit Island showed deflation of ~0.5 µrad/day during this period (figure 23). Seashore survey measurements around Greet Harbour were in good agreement, with subsidence of <1 cm/month. Following the renewal of activity at Tavurvur, ground deformation rates seem to have decreased, with only 3 µrad of tilt at MPT in 3 weeks, and no measurable changes in seashore levelling data. The gap in the tilt data on figure 23 was because the battery at MPT was stolen the day before the explosive activity began.
"There were three aerial inspections of Tavurvur during this period. On the morning of 13 February, before the large explosions took place, there was no marked change in the configuration of the bowl-shaped crater compared to the previous inspection in January. There also was no open vent, although the explosive emissions rose through the central part of the crater floor, which was covered with ash and rubble. On 20 February, emissions were seen rising from an obstructed vent in the SE part of the crater, while a strong fumarole was active on the W side of the crater (at the head of the 1994 lava flow). A small mound of lava seen on the 27th at the base of the crater was 20-30 m wide, only a few meters high, and was partly mantled with ash. Emissions were released through cracks in the lava or from between blocks near the edges.
"Throughout February, Vulcan continued to exhibit only very weak fumarolic activity from diffuse sources around the edge of the floors of both the 1937 and 1994 craters. At some time in late January or February, hot steaming springs appeared along the N shore of the Vulcan headland. Measured temperatures were consistently around 100°C.
"The Gazelle Peninsula has remained under a State of Emergency, with access to Rabaul controlled because of the risk from mudflows and flooding. Although the rainy season has been unusually mild so far, mudflows and flash floods are causing much damage to the roads into Rabaul and are flooding the remaining buildings in the town and in nearby villages."
Information Contacts: P. de Saint-Ours, R.Stewart, and B. Talai, RVO.
Mild explosive activity at Tavurvur
"Explosions at Tavurvur were mostly mild with emission clouds rising slowly to ~1 km above the crater at intervals of ~5-15 minutes. Seismic activity was slightly elevated on 1-2 March, but then decreased sharply in accord with weaker visible activity. The activity remained low for 24 hours then started to increase at a steady rate until it peaked on the 6th. Activity decayed the following day, but then began a gradual recovery that continued until 14 March. The explosions continued at intervals of ~5-15 minutes with ash emissions lasting 2-5 minutes. On 15 March a slight increase in seismic activity occurred as indicated by larger and more frequent explosion earthquakes, although visible activity appeared unchanged. Seismicity peaked on the 19th and then declined slightly over a period of ~48 hours. During the next 10 days the activity showed minor fluctuations but on average there were ~6 events/hour. On 30 March at 0805 and 2034 two strong explosions occurred. Dense ash clouds rose ~3 km above the crater and the flanks of Tavurvur were showered with lava fragments. These explosions signified a dramatic change in the pattern of activity as the frequency of explosions dropped markedly. The intervals between explosions sometimes lasted several hours.
"Aerial inspections of Tavurvur and Vulcan were conducted on 6, 13, and 21 March. The active crater at Tavurvur was bowl-shaped. On two occasions (6 and 21 March) there appeared to be an ash-mantled lava mound on the floor of the crater. At the NW and SE edges of the mound were a number of small vents (~1-2 m wide). These vents were aligned roughly in two arcs, which might represent small fissures. Between eruptions some vents emitted blue vapour. When inspected on 14 March, three rubble-covered vent areas were noted on the S, E, and NE parts of the crater floor. Low ridges of ash separated these vents. Weak fumaroles were present on parts of Tavurvur's main crater, especially on the N Wall. Fumarolic activity was also noted on the 1994 lava flow.
"Apart from the seismic activity related to events at Tavurvur, which were basically low-frequency explosion earthquakes, overall seismic activity of Rabaul Caldera was very low. Only five well-located high-frequency earthquakes were recorded (compared to 4 in February and 28 in January). Three occurred outside the caldera and the other two were under Tavurvur. The electronic tiltmeter at Matupit Island continued to show a trend of slow deflation of the caldera.
"Vulcan continued to exhibit only weak fumarolic activity at the W base of the 1994 crater. Hot springs along the N shore yielded temperatures of ~100°C. Rabaul continued to be under a State of Emergency with access to severely affected areas being controlled because of the risk of mud flows and flooding. Since the eruption started in September 1994, only one death was reported related to flooding."
Information Contacts: B. Talai, RVO.
Tavurvur explosions stop on 16 April
Two strong explosions took place at the intra-caldera cone Tavurvur on 30 March; after that, the repose intervals between explosions at Tavurvur lengthened, lasting from several hours to more than 24 hours. Tavurvur discharged several noteworthy explosions on 13-15 April; explosions ceased on 16 April.
During the first half of April, explosions sent ash clouds 1-2 km above the crater, but they were typically spasmodic and relatively mild. Ash predominantly fell to the SE (mainly over Talwatt and occasionally at Kokopo, with smaller amounts in Rabaul on a few days). Accompanying the normally gray ash emissions were weak roaring sounds heard late on the 3rd, low rumbling sounds on the 9th, and lightning seen in and around the billowing ash column on the 11th.
At 1206 on 13 April an impressive explosion occurred. It began with fast-rising, spear-headed jets of dark ash, which fed a billowing ash cloud that rose to about 2 km above the crater. Some ballistic blocks landed in the bay immediately W and NW of Tavurvur. On 14 April, moderate-to-strong explosions started at about 0920, with the most intense activity occurring between 1030 and 1040. Resulting eruption clouds were dark gray and quite dense; fallout was heavy at Tavurvur and immediately downwind (SE). In and around the eruption column, lightning was noted. The activity declined slowly through the day and stopped at about 2320.
Strong explosions resumed at about 1320 on 15 April. During a roughly 1 hour period, several large eruption clouds rose to about 2 km. These ash clouds remained intact as they drifted to the SE. Prolonged moderate ash emission also took place from early to mid-afternoon. During the early hours of 16 April, mild explosive activity took place; it stopped at about 0600. From that time onward activity chiefly consisted of weak white vapor emissions. Following a period of heavy rainfall on the 24th, however, these emissions again became more voluminous, but by the next day they returned to a very low level.
Seismicity in the first half of April, until the 16th, partly consisted of low-frequency earthquakes associated with Tavurvur's explosions. Explosion sizes appeared to correspond to earthquake amplitudes. Six high-frequency earthquakes also occurred (compared to 5 in March and 4 in February). These earthquakes all had epicenters outside the caldera--five to the N-NE and one to the SW.
During April, electronically measured tilt in the interior of the caldera at Matupit Island continued to show a trend of very slow deflation. Other ground deformation measurements failed to show significant trends.
An aerial inspection, on 8 April, revealed that Tavurvur's surface was covered with fresh black ash. Numerous gray blocks had also landed, mainly on the S flank and inside the old crater. The fumarole previously emitting blue-vapor (located about 1/3 of the way down the 1994 lava flow) was inactive. One white-vapor fumarole was noted where the lava had advanced over the crater rim. The crater displayed variably colored sublimate deposits and small erosional gullies. A step-like structural form was seen on the crater's E side, and a smooth, bowl shape was seen on its W side. Inside the crater there were neither visible vents nor a lava mound.
Vulcan continued weak white vapor emissions, coming mainly from the crater of the 1994 cone. Fumaroles at the base of the 1994 crater had been mostly buried by mud leaving only one on the W side of the crater. The upper one of the two pit craters on the N flank of the 1994 cone had caved in. Temperature of hot springs along the N shore were consistent with previous months' readings at ~100°C.
The State of Emergency in Rabaul was lifted on 10 April, making way for the Gazelle Restoration Authority to promote the rehabilitation process.
Information Contacts: David Lolok and Ben Talai, RVO
Slow deflation and weak vapor emissions; earthquakes N of the caldera
"There was no eruptive activity at Tavurvur in May. Since 16 April only weak white vapour emissions have been seen from Tavurvur's summit area. This trend of low activity was confirmed by the seismicity in May. During the month only 16 low-frequency earthquakes were recorded. These earthquakes were not associated with activity at Tavurvur, and appear to originate immediately N of the caldera. Nineteen high-frequency earthquakes were recorded, compared to 6 in April. Eleven of these occurred on the 17th and were located outside the caldera, 1-3 km to the N. Most of the other located events occurred SSW of the caldera. Electronic tilt measurements from the station on Matupit Island continued to show a slow deflationary trend."
Information Contacts: Ima Itikarai and Ben Talai, RVO.
Fumarolic activity but no caldera seismicity
Tavurvur Crater remained very quiet during June, with only strong fumarolic activity accompanied by occasional low volume white vapor emissions. No caldera seismicity was recorded during the month. Ground deformation showed a very slow rate of deflation.
Information Contacts: Ima Itikarai and Ben Talai, RVO.
July volcanism and local seismicity both quiet
Activity remained low during July, with only weak-to-moderate fumarolic activity at the summit of Tavurvur, and no reported emissions at Vulcan. Only 11 low-frequency earthquakes originated from the N part of the caldera. There were 7 high-frequency (M <1) earthquakes, mostly from the Namanula Hill and Karavia Bay areas in the NE and SW portions of the caldera.
Two unusual "hybrid" earthquakes occurred in July. The associated signals had very high-frequency impulsive onsets, and low-frequency codas (1.2 Hz) that lasted > 1 minute. At distant stations, only the low-frequency signals were registered. The first earthquake, on 3 July, occurred at 3 km depth off the S shore of Matupit Island close to the area of maximum ground deformation. The second, a much smaller hybrid earthquake, occurred on 25 July and was likely from the Vulcan area. Ground deformation measurements showed little or no change throughout July.
Information Contacts: Ben Talai, RVO.
Intracaldera cones quiet, but nearby earthquake triggers local seismicity
Although Rabaul remained quiet in August, the region was subjected to a strong tectonic earthquake (Ms 7.8) followed by associated aftershocks. The earthquake struck on 16 August centered ~260 km SE of Rabaul. In Rabaul the earthquake struck at 2027 with a modified Mercalli (MM) intensity of V, causing some minor landslides and the collapse of a few buildings.
The earthquake triggered noteworthy responses at the caldera. On 16 August there were 24 high-frequency events, and, as late as 23 August, 3-9 additional events/day; in July there were 7 high-frequency earthquakes (M <1). On 22 August, one event was felt by residents. With an approximate magnitude of ML 2.8, this was the first felt caldera earthquake since the early phase of Rabaul's September 1994 eruption.
These high-frequency earthquakes occurred mostly in the NE part of the caldera (Namanula Hill area). In contrast, throughout the period of heightened seismicity the number of low-frequency earthquakes remained low, peaking on 30-31 August at 10 and 26 events, respectively. For comparison, during July low-frequency events occurred 11 times. The August low-frequency earthquakes appeared to originate from within or just outside the N caldera area.
During the first half of the month ground deformation remained below the measurable level. Following the Ms 7.8 earthquake, electronic and water-tube tiltmeters recorded offsets as large as 90 µrad. The offsets suggested subsidence in the central part of the caldera with the outer rim remaining stationary. As of 15 September, adequate elevation data were unavailable to confirm the pattern of offset seen in the deformation data.
Information Contacts: Patrice de Saint-Ours and Ben Talai, RVO.
Minor seismicity and vapor emission
The volcanoes at Rabaul Caldera continued to remain quiet in October. Tavurvur's summit area released bluish white vapors at very low rates; however, the emission rates rose during rainy days at the end of the month. No emissions came from Vulcan.
Only 19 earthquakes were recorded in October. Two of the 13 low-frequency earthquakes originated from Tavurvur while the rest came from either within or just outside the caldera's N sector. The six high-frequency earthquakes took place on the 20th (2 earthquakes), 23rd (2), 26th (1), and 29th (1). Most of these high-frequency earthquakes occurred in the caldera's NE sector (Namanula area). One high-frequency earthquake (ML 1.9, on the 23rd) originated near Tavurvur at about 1 km depth. October ground deformation remained very low.
Information Contacts: Ben Talai, RVO.
Small ash-bearing emissions from Tavurvur
Throughout most of November 1995 the two recently active centers remained quiet, with Tavurvur emitting only steam and Vulcan not emitting any visible vapor (figure 24). Then on 28 November, Tavurvur suddenly began erupting, creating a parasitic crater. Vulcan continued to remain quiet throughout December.
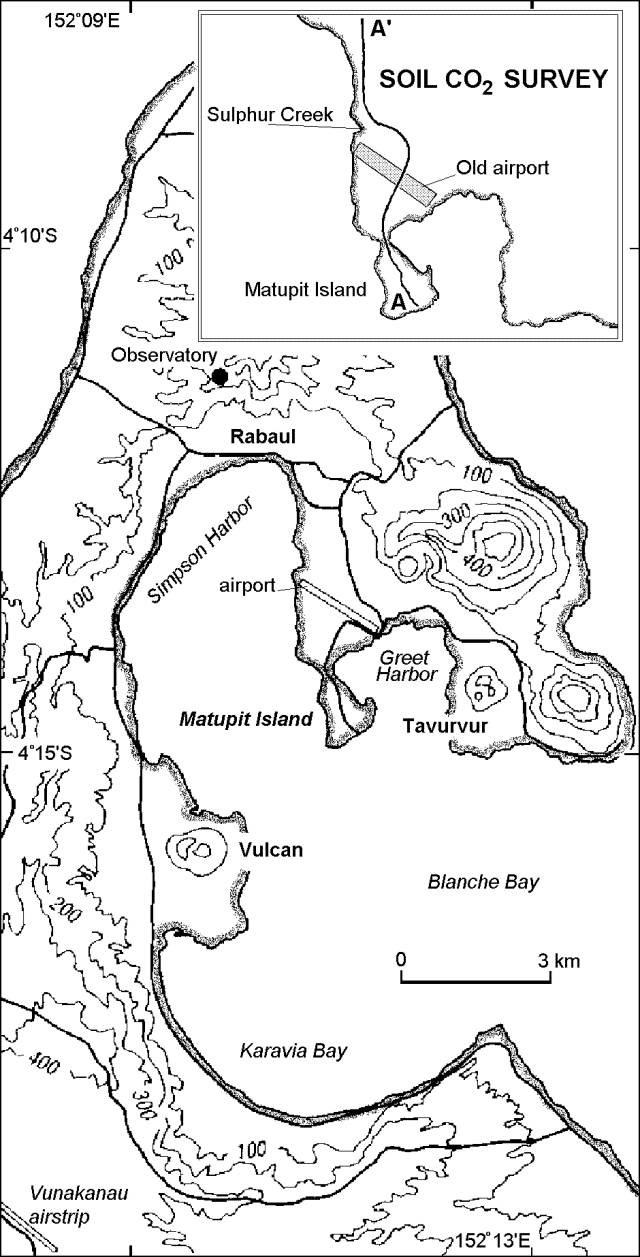 |
Figure 24. Index map of Rabaul and detail of soil CO2 transect. Elevation contours given in meters; base map after Johnson (1995). |
The volume of Tavurvur's faint blue vapor emissions seemed to increase in the weeks prior to 28 November. On the morning of the eruption an impressive white steam cloud stood several hundred meters above Tavurvur's summit. The new eruption, which was preceded by weak roaring sounds, started at about 1020, and initially consisted of forceful emissions of gas and dark ash at 2-6 minute intervals. Those emissions lacked explosion sounds; they rose 400-800 m above the crater rim and blew over a broad arc between the SE and SW, resulting in fine ashfall both onshore and over the sea. No ashfall reached Kokopo, 25 km SE. The next day, 29 November, two intervals of stronger emission took place (at 1200-1300 and 1415-1430), sending columns ~1 km above the summit.
An aerial inspection on 30 November revealed a new crater on the 1994-95 crater's SSE rim. Although the 1994-95 crater displayed no new activity, fumaroles were particularly active along its E walls. An old explosion crater along the base of Tavurvur's S flank, in which 6 people were killed in 1990 by inhalation of carbon dioxide, was releasing weak-to-moderate emissions of white vapor from its N to E walls. Directly downslope and immediately offshore of this explosion crater a spring had become considerably more active since the 1994 eruption; during the 30 November aerial inspection it was prominent, giving off a strong stream of rusty brown water. During November and December, ground deformation remained low.
Tavurvur discharged dark ash clouds in December, typically at 3-6 minute intervals, that rose 400-1,000 m above the summit. On 2 December two ash clouds rose to 1.5-2 km. The second brought intense lightning causing minor damage to home appliances in Rabaul Town (figure 24). On 5 December, a particularly loud explosion, heard 30-40 km away, accompanied the discharge of an ash cloud that rose to 1.2 km. Additional loud explosions accompanied dense ash clouds that rose to 1-1.2 km; these took place during December as follows: 11th (1 time), 13th (1), 14th (4), 18th (1), 23rd (1), 24th (1), and 29th (2). Moderate-sized clouds blew SE, and very fine ash occasionally fell both in Kokopo and, due to shifting winds, in Rabaul Town. On December nights, observers saw incandescent fragments and during the second half of the month they heard occasional deep roaring noises.
Seismicity. November seismicity generally remained low, but was punctuated by 11 high- and 42 low-frequency events. Eight of the high-frequency events were located. Five occurred within the caldera's seismically active elliptical fault zone, in the NE (1 event), W (1), and S (3) quadrants. Although one of the extra-caldera events was centered S of the caldera, two events were located immediately to the caldera's NE, an area where the bulk of the high-frequency earthquakes have occurred in the past few months. One of these two events, ML 3.0 on 24 November, produced a felt intensity of MM III at Rabaul Town.
Of the 42 low-frequency earthquakes during November, 17 came from around Tavurvur volcano. Two of these occurred in late October, and 9 others in November prior to the 28 November eruption. The last time such events appeared was during the eruptive activity in March 1995. The other 25 low-frequency earthquakes not centered around Tavurvur were more difficult to locate accurately due to emergent waveforms and fewer stations outside the caldera. Many may have originated immediately N of the caldera. On 10 November a low-frequency earthquake centered 7-8 km outside of the caldera was strong enough to trigger aftershocks.
During December, seismic instruments detected 30 high-frequency earthquakes, 684 low-frequency earthquakes, and 488 explosion events. Instruments also recorded occasional discontinuous non-harmonic tremors. About 70% of the high frequency earthquakes occurred during 4-6 December. The five located events had epicenters in either the S part of the caldera's seismically active zone (the largest one, M 2.7), NE of the caldera (two events), or within the caldera. All of the seismic explosions and most low-frequency earthquakes originated at Tavurvur; the 20 exceptions originated farther NW and took place at the end of the month.
Fumarole and soil sampling. During 21-27 November, rainwater, water from hot springs, and gases from subaerial and submarine fumaroles were sampled at 13 sites (table 3). Compared to Vulcan, fumaroles at Tavurur displayed relatively high temperature, low pH, and high conductivity. Hot springs sampled near the shore of Greet Harbor were slightly acidic and comparatively conductive. All samples were more acid than those assessed prior to the 1994 eruption episode.
Table 3. Summary of fumarole and hot spring sampling at Rabaul Caldera, 21-27 November 1995. Courtesy of RVO.
| Location | Number of samples/type | Temp (deg C) | pH | Electrical conductivity (mS/cm) |
| Tavurvur | 3/fumarole | 202-98.9 | 1.21-3.53 | 0.327-10.4 |
| Vulcan | 1/fumarole | 99.8 | 5.28 | 0.0758 |
| Rabalanakaia | 1/fumarole | 99.3 | 3.20 | 0.444 |
| Vulcan | 1/hot spring | 99.2 | 5.98 | 73.3 |
| Greet Harbor shore | 4/hot spring | 62.6-84.8 | 5.89-6.66 | 52.9-53.8 |
| Sulphur Creek | 1/hot spring | N.D. | 6.21 | 4.29 |
| Rabaul | 1/rainwater | N.D. | 6.06 | N.D. |
A soil CO2 survey E of Simpson Harbor (figure 24) showed that CO2 concentrations varied widely, 0.4-20% (figure 25). As reported by Mori and McKee in 1987, the CO2 concentrations peaked along the seismically active fault zone (near the old airport), some distance from either Tavurvur or Vulcan. Other anomalously high concentrations were seen at the Matupit causeway and Sulphur Creek. Low concentrations were seen at other places, including Matupit Island.
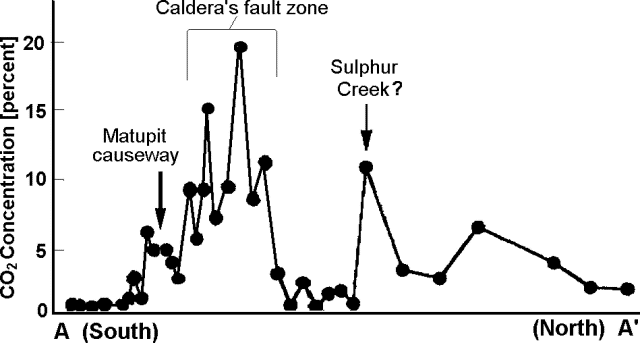 |
Figure 25. Soil CO2 concentrations at Rabaul Caldera along transect A-A'. Courtesy of RVO. |
Isotopic analysis of six selected samples along the profile found that 13C ranged from -29.8 to -18.4 per mil suggesting chiefly biogenic contributions. A mixing process with a minor contribution of volcanogenic CO2 might also account for the wide range of ratios seen. High soil CO2 levels could be related to the effects of a higher thermal gradient along active fractures and faults.
Information Contacts: Ben Talai, H. Patia, D. Lolok, and C. McKee, RVO; N. M. Perez and H. Wakita; University of Tokyo, Earth Chemistry, Bunkyo-ku, Tokyo 113 Japan.
Explosive eruptions from Tavurvur
Low-level activity from Tavurvur throughout January continued with plumes containing low to moderate ash contents. The plumes were released at intervals of 3-10 minutes, sometimes accompanied by weak roaring or explosion sounds. Incandescent lava fragments were ejected during some ash emissions. Large explosions occurred on 3 (2), 17 (2), 19 (1), and 24 (1) January. These explosions deposited lava blocks, as large as 60-80 cm in diameter, 1-1.5 km from the vent. The plumes rose 400-1,000 m above Tavurvur and were generally blown SE, but sometimes in a broad arc extending from the SW to the N. Ashfalls were recorded at Talwat village, in the Kokopo area, and in Rabaul Town. No vapor emissions were observed from Vulcan.
Seismicity was higher in January compared to December, with three high-frequency earthquakes, 2,401 low-frequency earthquakes, and 1,404 explosion events. Discontinuous non-harmonic tremor also occurred during the month. High-frequency earthquakes that could be located occurred NE of the caldera. Except for three low-frequency earthquakes, which originated NW of the caldera, all the other seismicity was associated with eruptive activity at Tavurvur. The increase in the number of both types of events was also accompanied by an increase in their amplitudes.
Information Contacts: Ben Talai, Rabaul Volcano Observatory, P.O. Box 386, Rabaul, Papua New Guinea.
Tavurvurs November eruption continues; 35% increase in seismicity
Tavurvur's two-month-long eruption continued in February with weak to moderate explosions every few minutes. At close range, roaring and detonation sounds could be heard. Pale to dark gray ash and vapor clouds rose ~400-1,000 m above the crater rim and formed a plume 10-15 km long. The plume generally trended SE over the sea, but occasionally it moved NW over Rabaul Town. At times, ballistic blocks were ejected as far as the outer slopes of Tavurvur's low cone. Sprays of incandescent lava were occasionally seen at night. There were no emissions from Vulcan.
During February, seismicity reached its highest level since the current phase of eruptive activity began on 28 November, 1995 (BGVN 20:11/12). A total of 5,212 eruption-related seismic events were recorded in February, which compares to 3,850 in January, and 1,283 in December. Seismicity peaked in mid-February, declining slightly during the second half of the month. February earthquakes consisted of 4 short-duration volcanic tremors, 5,187 explosion earthquakes, and 21 high-frequency earthquakes. The first two groups of events were directly associated with Tavurur's eruptive activity; 707 of the explosion earthquakes had a distinct air-wave phase recorded at distant seismic stations.
High-frequency earthquakes chiefly occurred in two main time intervals of dissimilar duration. The first interval included 10 events and occurred during 5 minutes on the 10th. The largest event had a magnitude (ML) of 3.1 and was felt in Rabaul Town with a Modified Mercalli intensity of III. The second interval included nine events and occurred over four consecutive days. Except for one earthquake on the W side of the caldera seismic zone, all others were located immediately NE of the caldera.
Ground deformation measurements indicated slight inflation. Between 1 February and 1 March, just W of Tavurvur (Greet Harbor area), tilt amounted to ~15 µrad. In the second half of February, on the opposite side of the caldera (the SW, in vicinity of Vulcan), tilt amounted to ~5 µrad.
Reference. Lauer, S., Pumice and ash: a personal account of the 1994 Rabaul volcanic eruptions, Quality Plus Printers, Ltd., Ballina, NSW, Australia, 1995.
Information Contacts: Ima Itikarai and Ben Talai, Rabaul Volcano Observatory, P.O. Box 386, Rabaul, Papua New Guinea.
December-March ash deposits now 10-cm thick; seismicity continues
During March the intra-caldera cone Tavurvur produced ash explosions at 2-5 minute intervals; these rose to ~400-1,500 m altitude and then generally drifted SE. As a result, over the last 4 months ~10 cm of ash accumulated on the abandoned village of Talwat (2 km SE of Tavurvur). Vulcan only produced weak fumarolic emissions.
Seismicity fluctuated slightly during March, remaining at a level slightly lower than the peak reached in mid-February. Low-frequency earthquakes, events associated with Tavurvur ash emissions, took place 100-250 times/day (a total of 4,708 times during March). There were also five brief intervals where non-harmonic tremor took place. Only six high-frequency earthquakes occurred; some were kilometers outside the caldera to the NE in the area most seismically active since the 1994 eruption.
No significant ground deformation affected the caldera during the month. Overall, during the recent eruptive phase, the only observed ground deformation has been a slight (20 µrad) deflation at the tiltmeters nearest to Tavurvur.
Information Contacts: Ben Talai, Rabaul Volcano Observatory, P.O. Box 386, Rabaul, Papua New Guinea.
Low-level eruptive activity from Tavurvur
During April, low-level eruptive activity continued from Tavurvur as in the past several months (BGVN 21:02 and 21:03). Weak to moderate explosions produced pale- to dark-gray ash-and-vapor clouds every few minutes. These clouds rose ~400-1,000 m before drifting 15-20 km to the S and SW and producing fine ashfalls in villages downwind. Roaring noises were heard, at times from as far as 15 km away. Observers occasionally noticed sprays of incandescent lava fragments at night. Vulcan only produced weak fumarole emissions.
Seismicity remained at approximately the same level as in February (BGVN 21:02). A total of 5,210 low-frequency (explosion) earthquakes occurred during April. Seismicity peaked during the second and third weeks of the month. Eighteen high-frequency earthquakes were recorded, and nearly 50% of them occurred on 3 April. Most of these events originated immediately NE of the caldera, but three earthquakes occurred N, W, and S of the caldera, respectively. Ground-deformation measurements showed no significant changes.
Information Contacts: H. Patia, Rabaul Volcanological Observatory (RVO), P.O. Box 386, Rabaul, Papua New Guinea.
Strong Strombolian eruption followed by less intense and more varied activity
On 11 May a Strombolian eruption took place at Tavurvur. Until early in May weak to moderate explosions occurred every few minutes and generated pale to dark-gray ash-and-vapor clouds that rose ~ 400-1,000 m before drifting 15-20 km downwind (mostly SE, S, and SW). Large incandescent ejecta were observed at night and roaring noises were heard from as much as 15 km away (BGVN 21:04).
Visible eruptive activity began to change mid-afternoon on 9 May. Vapor emissions reached ~1,500 m and seismicity increased to a peak around 2200, when a series of strong explosions started. By about 0800 on 10 May, the emissions were sub-continuous and explosions sent ash clouds ~2-2.5 km above the vent. The activity declined through the afternoon. Later that day the emission column was ~1.2-1.5 km high, with occasional explosion clouds rising 1.9 km. Shortly before midnight, explosions were occurring at intervals of ~5 minutes.
A moderate increase in activity began at midnight on 11 May. By 0245 it changed to Strombolian mode as explosions were occurring every 30 seconds, with increasing frequency and strength. Large bolts of lightning flashed through the growing eruption column. Slabs of lava ~10-15 m in diameter were ejected hundreds of meters above the vent, and meter-sized blocks were landing on the shore ~1 km from the vent. By 0300 the explosions and the lightning were almost continuous. The eruption column was a constant stream of incandescent lava fragments rising at least 400 m. There was a spontaneous evacuation of some people from nearby Matupit Island. Strong air-shock waves from the explosions were felt within a few kilometers from the summit. Irregular and continuous tremors were recorded, but observers noted that the shaking was due to the blasts and not to earthquakes.
Seismicity peaked at 0315. Within minutes the activity declined, the streaming of ejecta stopped, and the time between explosions increased to 30 seconds. By 0400 the activity had returned to the level observed on 10 May. At 0438 the first of a series of strong explosions, at irregular intervals of 10-40 seconds, sent incandescent ballistic blocks 1.5 km from Tavurvur. The last explosion, at 0728, generated and ash cloud that rose ~2.3 km.
During the following day a few large explosions occurred, but their frequency and strength were declining. The emissions were commonly white and blue vapors with occasional ash. By the end of 12 May the explosions stopped and seismicity consisted of irregular tremor. This type of activity persisted for 2-3 days, until 15 May when explosive activity resumed.
Several phases of intensified activity took place during the following weeks, but these were considerably less intense than that of 10-11 May. Seismicity remained weaker than during the previous five months (figure 26).
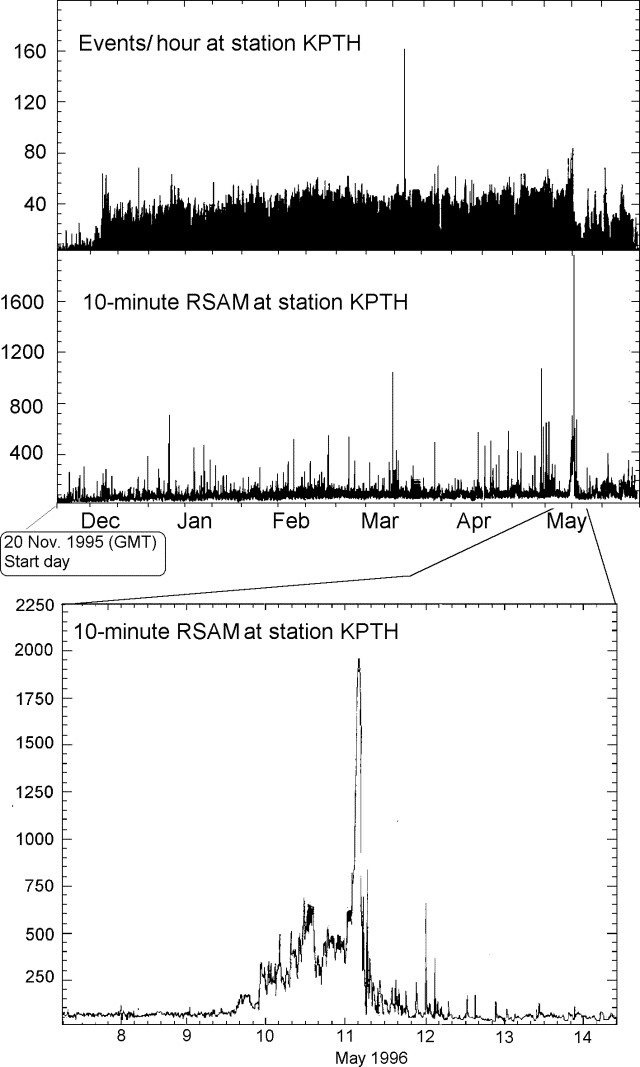 |
Figure 26. Seismicity at Rabaul for the period December 1995-May 1996 with detail over the days of peak activity in May. Courtesy of RVO. |
A new electronic tiltmeter was installed on 30 April at Matupit Island, ~2.5 km WSW of Tavurvur. It initially measured moderate WNW downward tilt. This continued until 3 May when the pattern reversed and ESE downward tilt began. On 8 May, after accumulating ~10 µrad of rotation, the tilting pattern again changed and the instrument recorded WNW downward tilt. The WNW downward tilt that started on 8 May was probably related to the 9 May activity. The WNW downward tilt continued until 20 May, with rotation reaching up to 16 µrad. From 20 to 30 May the downward tilt returned to ESE and gradually decreased to zero.
The available COSPEC measurements showed a decline in SO2 emission rate from the range of ~500-900 metric tons/day (t/d) at the beginning of May to background values of a few hundred tons per day during 8-15 May. At the end of the month the emission rate increased to ~800 t/d. Although the 8-15 May data failed to portray any flux increases associated with the 10-11 May eruption, later, on 18 and 26 May, peaks in SO2 emissions correlated with some less dramatic periods of enhanced eruptive activity.
A total of 3,993 explosion earthquakes was recorded during May. Episodes of volcanic tremor numbered 106; more than 90% of these tremors took place during the 10-11 May eruption. Four high-frequency earthquakes were recorded during the month. Two of these were within the zone of defined by 1994 caldera seismicity.
Information Contacts: D. Lolok and C. McKee, Rabaul Volcano Observatory (RVO), P.O. Box 385, Rabaul, Papua New Guinea.
Eruptions wane, stop, then resume
From December to April, Tavurvur continued fairly steady eruptive activity. During May emissions became more variable. In June Tavurvur's summit emissions waned, stopped for several days, then resumed.
On 1-2 June Tavurvur produced weak-to-moderate explosions at irregular intervals, but these became more frequent on 4-5 June. The explosions generated pale- to dark-gray ash-and-vapor clouds that rose 400-2,000 m above the crater rim. The clouds blew N and NW and produced ashfalls. Between 3 and 5 June, explosions were accompanied by roaring noises.
On 5 June, the number of earthquakes dropped rapidly, reaching the lowest level in six months and remaining low until 29 June (figure 27). During 5-29 June observers saw white- to pale-gray vapor clouds rising ~1 km; these clouds blew N, NW, and W. Moderate explosions 1-2 times/day caused regular warnings to aircraft in the vicinity. For example, on 10 June a SIGMET from Port Moresby noted volcanic ash to below 5,600 m altitude. For a period of six days (11-16 June), no emissions took place from the summit, but explosions resumed on 17 June.
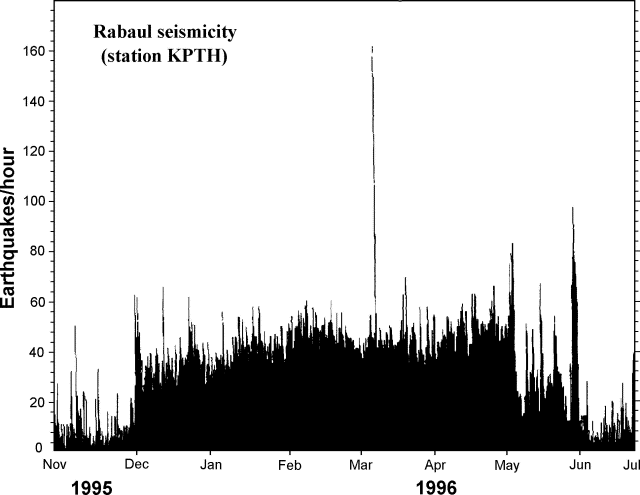 |
Figure 27. Rabaul seismicity for the period November 1995-June 1996. Courtesy of RVO. |
Ground deformation changes were low for the first half of June. After 13 June (figure 28), however, rapid radial inflation (to the N of Tavurvur) was recorded by the Matupit (MPT) electronic tiltmeter 2 km W of Tavurvur. Inflation was also recorded by a water-tube tiltmeter at Sulphur Creek (3.3 km NW). Sea-shore leveling measurements near Tavurvur have showed slow uplift since September 1995. The total inflation recorded at MPT was >52 µrad. Forty-two µrad were recorded in four days, the highest recorded rate since electronic tiltmeters were installed in October 1994.
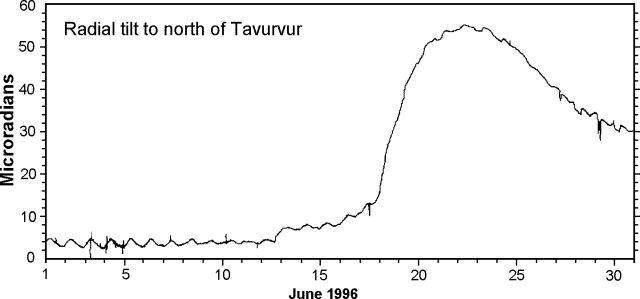 |
Figure 28. Inflationary tilt at Rabaul in June 1996, recorded by the Matupit (MPT) electronic tiltmeter 2 km W of Tavurvur. Courtesy of RVO. |
Following the rapid inflation indicated by the electronic tiltmeter, it was expected that a higher level of eruptive activity would commence. It did so later in the month when activity similar to that in the past six months resumed. Frequent explosions sent ash clouds to 400-1,000 m above the crater rim, some accompanied by loud roaring noises. These explosions continued through the end of June.
Seismicity in June consisted of 1,575 explosion earthquakes, 10 volcanic tremors, and 11 high-frequency earthquakes. The number of explosion earthquakes was the lowest since December 1995. Four high-frequency earthquakes were located to the NE of the caldera, four struck in the W part of the area delineated by the pre-1994 caldera seismicity, and the rest were scattered elsewhere.
Information Contacts: D. Lolok, and C. McKee, Rabaul Volcano Observatory (RVO), P.O. Box 385, Rabaul, Papua New Guinea; Jim Lynch, NOAA/NESDIS Synoptic Analysis Branch (SAB), Room 401, 5200 Auth Road, Camp Springs, MD 20746, USA.
Tavurvur eruption continues; seismic activity increases
During the first two weeks of July, Tavurvur emitted pale to medium gray clouds with low to moderate ash contents every 2-8 minutes. Some emissions were accompanied by roaring and weak explosion sounds. Projections of glowing lava fragments were observed at night. Eruptive activity changed on 13 June, when the rate of ash emissions decreased, and discrete, moderate to large explosions took place at longer intervals (about every 1-5 hours). The explosions emitted medium gray clouds with moderate ash contents, which rose to a height of 2-3 km before being blown to the N. Large lava blocks fell on the flanks of Tavurvur as far as the shoreline. After 13 June the rate of emissions increased slightly and ash clouds were released at variable intervals (minutes to hours). Few audible sounds accompanied the emissions. Between ash emissions, Tavurvur was generally quiet and continuously released bluish white vapor in low to moderate volumes. During July light ashfall was observed in Rabaul Town and the areas to its N.
Seismicity was at a moderate level for the first half of July. This was a continuation of the increased activity that began 29 June. Seismicity declined after 16 July, and remained low until the end of July. In total, 2,384 explosion earthquakes and three tremors were recorded in July, higher than those in June (1,565 explosion earthquakes and 10 tremors). On 29 July a sequence of high-frequency earthquakes began NE of the caldera. During a period of two and a half days (29-31 July), about 300 earthquakes took place. In a NE-trending zone crossing the caldera, 69 high-frequency earthquakes were recorded and the strongest one had a magnitude of about 3.0. In addition, five other high-frequency earthquakes took place elsewhere in the caldera.
An electronic tiltmeter on Matupit Island (2.5 km W of Tavurvur) recorded a deflationary tilt of 27 µrad towards Tavurvur during 23 June-31 July. A low inflationary tilt towards Tavurvur occurred after 3 July, but deflation took place on 27 July and continued until the end of July. Between 3 and 27 July about 20 µrad of inflationary tilt accumulated. On the other side of the caldera, Vulcan remained quiet throughout July and the Vulcan headland continued its slow deflation (<5 µrad/month tilt and 1 cm/month subsidence).
Information Contacts: B. Talai, D. Lolok, and C. McKee, Rabaul Volcano Observatory (RVO), P.O. Box 386, Rabaul, Papua New Guinea.
Vulcan quiet, Tavurvur mildly explosive
Vulcan was quiet during August but the continuing eruption at Tavurvur was characterized by periods of frequent minor explosions and occasional large discrete explosions. During the first two days of the month, Tavurvur had minor explosions emitting ash and vapor at irregular intervals. Some sequences of subcontinuous mild explosive activity went on for tens of minutes.
On 3 August, activity returned to the style seen for the first 5 months of the eruption (i.e. mild ash and vapor emissions at shorter, 1-6 minute, intervals). This was the dominant mode of eruption through the rest of the month.
However, there were occasional large discrete explosions and sometimes sequences of these events. Specifically, there were explosions on the 5th (2), 8th (1), 11th (2), 15th (5), 22nd (6), 25th (1), and 26th (5). Ash-and-vapor clouds produced by these explosions rose to ~2-4 km above the vent. Commonly, the vent would clear of all emissions for tens of minutes to several hours prior to the explosions. Following the explosions were periods of frequent and even continuous ash and vapor emissions.
A decline in the ash content of the background emissions was noted on the 14th, and at the same time the intervals between emissions lengthened to as much as 30 minutes. However, on the 15th, the emissions became more frequent again. On the 17th, there were prolonged ash and vapor emissions. A further decline in the ash content of the emissions was observed from the 18th, as the clouds became very pale gray to off-white. On the last two days of the month, the emissions were almost pure white.
Seismicity was somewhat stronger in August than in previous months. Altogether there were 2,770 low-frequency (explosion) earthquakes recorded, compared with 1,565 in June and 2,384 in July. Although there were short-term irregularities in the rate of these events, over the longer term the events were fairly evenly distributed.
The electronic tiltmeter at Matupit Island (2 km W of Tavurvur) recorded inflationary tilt (~20 µrad) that took place between 3 and 27 July. A slight deflationary tilt (~4 µrad) was seen during August. There was a rapid drift of ~45 µrad on one component of the tiltmeter on 10 August.
Measurements of SO2 concentration in the emissions using a correlation spectrometer (COSPEC) instrument showed an overall increasing trend until late August. At the beginning of the month the concentration-path lengths were ~500 ppm-m. A peak of ~900 ppm-m was reached before the series of explosions on the 26th, after which the values declined to between 200 and 400 ppm-m during the last five days of the month.
Information Contacts: C. McKee and B. Talai Rabaul Volcano Observatory (RVO), P.O. Box 385, Rabaul, Papua New Guinea.
Strong explosions produce ash clouds and ashfall
Mild eruptions continued at Tavurvur during September. Weak, white to pale-gray vapor-and-ash emissions took place at short irregular intervals, and plumes rose ~1,000 m above the crater. These emissions were occasionally accompanied by roaring sounds. On 2, 7, and 9-12 September, strong explosions sent ash clouds up to 4 km above the crater, resulting in light ashfall on Matupit Island and Rabaul town.
After the explosions on 26 August (BGVN 21:08), the release of SO2 was at a low level of ~200 metric tons/day (t/d). However, the flux rate gradually increased and reached ~1,500 t/d on the night of the 11 September explosions. Seismicity showed variations similar to the SO2 flux. The background seismicity level was 5-20 low-frequency events/hour and 30-100 RSAM (Real-time Seismic Amplitude Measurement) units. From 8 to 10 September, seismicity increased to ~40 low-frequency events/hour and 100-200 RSAM units. After the eruption on 11 September, seismicity returned to a normal level (3-15 events/hour and 25-100 RSAM units). Ground deformation was not evident around the mid-September eruptions.
After 18 September, seismic activity increased to medium levels (30-40 events/hour and 50-150 RSAM units). Likewise, the flux rates of SO2 changed from 200-400 t/d to 1,000-1,500 t/d by the end of September. Beginning on 22 September, tiltmeters recorded deflation of the central caldera reservoir at a rate of up to 1 µrad/day. Following these anomalies, strong eruptions took place in early October, sending ash clouds to an altitude of 5.5 km.
Information Contacts: C. McKee and B. Talai, Rabaul Volcano Observatory (RVO), P.O. Box 386, Rabaul, Papua New Guinea; NOAA/NESDIS Satellite Analysis Branch (SAB), Room 401, 5200 Auth Road, Camp Springs, MD 20746, USA.
Tavurvur's 4-5 October eruptions yield the largest lava flow in over 200 years
Strong Strombolian eruptions occurred at Tavurvur on 4-5 October, but activity was generally low during November and December. Before the eruptions in October, activity consisted of weak to moderate emissions of white vapor and occasional ash clouds that rose ~600 m above the crater. Some of the ash emissions were accompanied by roaring noises. Light ashfall was observed to the N and NW. Three moderate explosions occurred at 1209 on 3 October, and at 0017 and 0219 on 4 October, producing dark gray ash clouds 3-4 km high.
Strombolian eruptions started with emissions of dark gray ash clouds at 1200 on 4 October. At that time, real-time seismic amplitude measurement (RSAM) values were 30-50. Eruptive activity gradually increased, with more frequent emissions of thick, dark gray ash clouds. The activity rapidly increased at 1430, and peaked at 1450 with an RSAM value of ~680. Activity quickly declined after only 20 minutes, to an RSAM value of 300 by about 1700. Activity soon increased again, and reached another peak at about 2000 with an RSAM value of 800. Frequent loud explosions rattled windows and doors 7-8 km from the crater, and were heard as far as 40 km away. Red incandescent lava fragments were frequently projected ~1 km above the crater. Some of the ejecta were 1-2 m in diameter during the peak eruptions. The hot and plastic ejecta were deformed during flight.
Beginning at 2000, the eruptive activity slightly decreased and RSAM values dropped to ~710 in two hours, then the activity increased again and peaked at about 2320. According to the RSAM data, activity remained almost unchanged from then until 0820 the next morning with a constant RSAM value of ~860. From 0820 on 5 October, the activity began to decline, accompanied by frequent explosions. The frequency of explosions peaked at 1700 on 5 October (~150 explosions/hour), and decreased exponentially, with only ~20 explosions/hour at 0700 on 6 October. The last relatively large explosion occurred on 25 October.
During the strong phase of Strombolian eruptions, a significant amount of lava was erupted. Effusive activity began around 0130 on 5 October. Lava flowed to the S of the vent, covering a large area of coconut plantation and burying two houses. Three lobes of the lava flow moved into the sea, ~1.6 km from the vent. The volume of lava was estimated at 4-5 x 10⁶ m3, the largest amount produced at Tavurvur in more than 200 years. Effusive activity occurred at Tavurvur during the 1994 eruption (BGVN 19:08-19:10), with a lava flow of ~0.4 x 10⁶ m3.
Ash clouds produced by the Strombolian eruptions and the subsequent large explosions rose 3-4 km above the crater. Light ash fell on the N, NW, W, SW, and SE areas of the caldera. Moderate, damp ashfall was observed on Matupit Island 1.5 km W of the vent.
A low level of eruptive activity occurred at Tavurvur during November and December, with very weak to moderate emissions of white vapor. However, emissions of small volumes of pale gray ash took place twice in December, the first on 6-7 December. Pale gray emissions with a very low ash content began on the morning of 6 December, then gradually changed to weak, white vapor the next day. The ash clouds rose ~3 km above the crater before being blown to the NE, NW, and W. Very light ashfall was observed on 7 December in Rabaul Town, ~5 km NW of the crater. The second ash emission began on 27 December and was continuing at the end of the month.
During October-December, 27 high-frequency earthquakes were recorded. Two events on 24 December were felt with an intensity of III. During November and December, seismicity was generally low; the only seismic increases were associated with the two ash-emission episodes.
Information Contacts: B. Talai, I. Itikarai, and P. de Saint Ours, Rabaul Volcano Observatory (RVO), P.O. Box 386, Rabaul, Papua New Guinea.
Large gas fireball, Strombolian eruptions, and lava flows
A strong Strombolian and lava-producing eruption occurred at Tavurvur, the small active crater on the E side of Rabaul Caldera, on 9 January. The eruption, very similar to the one on 4 October last year, marked the start of a new eruptive phase in the caldera.
Since early December, a reversal in trend at the Sulphur Creek (SCK) water-tube tiltmeter (3 km NW of Tavurvur) suggested a slight deflation of the central magma reservoir. From mid-December, SO2 emissions measured by COSPEC dropped to very low levels and emissions from Tavurvur were reduced to only white vapor. From 25 December onward, low-frequency earthquakes started to occur under Tavurvur and became increasingly common. In early January, emissions from Tavurvur contained more blue vapor and only occasional ash. A hissing sound could be heard from nearby Matupit Island accompanied by red glow at night.
At 0053 on 9 January, a powerful explosion woke residents of the caldera and Kokopo, 1 km S. It was reported to have produced a dark ash cloud that rose 3,000-4,000 m and blocks could be heard falling around the Tavurvur cone.
No further unusual activity was noticed until 0120, when a "large fireball" rose silently above the crater to a height of ~1,500 m while expanding to a ~500 m radius before falling onto the cone where it ignited bush fires. Witnesses say that it produced very intense light for a few seconds before dying off instantaneously and that there were no incandescent projections. It is presumed that this phenomenon corresponded to the ignition of a large bubble of methane, a gas that is relatively abundant in Tavurvur emissions.
Following the gas fireball, background RSAM rose (from <50 to >100 scale units) and weak Strombolian activity started within ten minutes. The strength of the Strombolian activity increased rapidly as did the RSAM levels (~200 by 0200, ~500 by 0245, and ~700 by 0300). The activity culminated between 0400 and 1200, with sub-continuous fountaining of pasty lumps of lava to ~1,000 m above the crater rim and sub-continuous detonations that broke glassware at Kokopo and were heard as far away as Bialla and Buka Islands (200 km SW and 300 km SE, respectively). The detonations were quieter on the N side of Rabaul (presumably due to the shape of Tavurvur crater, now open to the S). A column containing ash and scoria rose to ~4,000 m; it blew SE, leaving >1 cm thickness of coarse ash at Talwat village (1.5 km SE) and a few millimeters over the Tokua-Kokopo area.
Starting at about 0315 on 9 January, a chunky lava flow (estimated volume 4 x 10⁶ m3) poured over Tavurvur's S rim, over and onto either side of the 4 October lava flow, until it reached the sea. By 10 January the coastline had been extended ~100 m offshore. Throughout the main phase of the Strombolian activity and lava flows, RSAM levels were steady at ~850, similar to the October 1996 eruption.
Coconut and cocoa groves, the road leading to Talwat, and a few houses (deserted since the 1994 eruption) were ignited and buried by the lava flow. During the night, inhabitants of Matupit Island (~2 km W of Tavurvur) began to evacuate on their own accord. Upon encountering RVO staff at about 0300 and 0400 on 9 January, they learned that the eruption was probably not a threat to life or property and many returned to their homes. That day, many businesses stayed closed in the Kokopo area, due to the continuous, unnerving detonations.
Activity started to decline after noon, and decreased rapidly after 1400. By 1800, Strombolian explosions were discontinuous and weak. RSAM levels dropped to pre-eruption background levels (~40).
The SCK water tube tiltmeter showed a radial deflation of ~10 µrad in response to the eruption (compared to ~12 µrad in response to the October eruption). Some GPS measurements along a 3 km radius to Tavurvur showed significant (centimeter scale) horizontal changes. Although some motion occurred away from the volcano, the horizontal movement appeared complex and irregular.
Inspection of the S flank of Tavurvur revealed that, at an unknown time during the eruption, part of the crater wall slumped half way down the cone, now forming a hump partly covered and partly surrounded by the lava flow.
On the following days, activity was low. Pale gray ash clouds discharged at irregular intervals with load roaring or explosion sounds. For nearly a week afterward, bands of harmonic tremor occurred at intervals of a few hours, sometimes energetic enough to be recorded by the whole seismic network. RSAM values remained at background levels, with discrete spikes in response to explosions. SO2 levels also remained low (300-800 tons/day) throughout.
From 15 January, ash emissions became darker. By 21 January, these Vulcanian explosions were occurring at 1-5 minute intervals, rising to 3,000 m and resulting in light, damp ashfalls to the SE. However, past the third week in January, activity was back to a moderate level of weaker, grayish Vulcanian explosions, while SCK tiltmeter showed a slow recovery trend.
Information Contacts: B. Talai, D. Lolok, P. de Saint-Ours, and C. McKee, Rabaul Volcano Observatory (RVO), P.O. Box 386, Rabaul, Papua New Guinea.
Occasional stronger explosions and a tilt reversal
After some strong Strombolian eruptions during January, the Tavurvur cone was more subdued in February. Typically frequent (every few minutes) explosions sent ejecta to <1 km heights. Tephra content varied between explosions and tended to decrease during the course of January. When ejected at night, the tephra glowed.
Stronger explosions took place during 5-8 February and 14-16 February. On 6 February, the day with the highest number of stronger explosions, there were 10 such events. The stronger explosions produced dark gray clouds with highly convoluted forms; the largest clouds rose ~4 km above the vent. As with the smaller explosions, tephra glowed when seen at night. On 8 February an eruption reached ~7 km altitude.
Explosion earthquakes dominated seismicity during February. These 3,287 events during the month were typically low- to moderate-frequency. High-frequency caldera earthquakes took place only six times. Epicenters for the two located events were a few kilometers N of Tavurvur (on Kabiu cone) and in the SSE part of the caldera; both caldera earthquakes had shallow focal depths (5 km).
Sulfur dioxide fluxes from Tavurvur were relatively low on most days in February. In addition, fluxes tended to decline during the month.
Deformation and a forecast. During February, tilt was most apparent in the NE caldera (Sulphur Creek) on a water-tube tiltmeter. Immediately following the deflation associated with the strong Strombolian eruption of 9 January, SE-oriented inflation resumed. Until mid-February, the inflation rate was steady at ~2 µrad/week; this inflation ceased coincident with the second phase of strong explosions from Tavurvur. After that, and continuing until at least early March, deflation occurred with the station slowly tilting towards the SE.
A similar pattern of initial inflation followed by deflation was associated with the strong Strombolian activity of October 1996. On the basis of this comparison, it was forecast that a new Strombolian event would occur in mid-March.
Information Contacts: B. Talai, H. Patia, D. Lolok, P. de Saint Ours, and C. McKee, Rabaul Volcano Observatory (RVO), P.O. Box 386, Rabaul, Papua New Guinea.
Lava flow issues from Tavurvur crater during 14 March eruption
On 14 March, a strong Strombolian and lava-producing eruption occurred at Tavurvur, the small active cone on the E side of the Rabaul Caldera (figure 29). This was the third eruption of this type since October 1996 (BGVN 21:12 and 22:01). Two photos of Tavurvur and vicinity from November 1996 show the effects of eruptions since 1994 (figures 30 and 31).
 |
Figure 29. Map of Rabaul Caldera showing locations of volcanic vents, selected towns, and features (modified from Almond and McKee, 1982). |
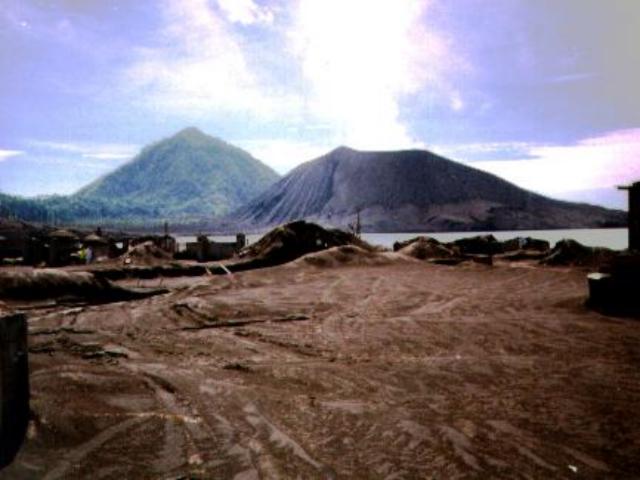 |
Figure 30. Photograph of a weakly steaming Tavurvur cone taken from the peninsula leading to Matupit Island, November 1996. Turanguna cone sits in the background. The abundant ash in the foreground was deposited during the 1994 eruption. Courtesy of Nancy Roper. |
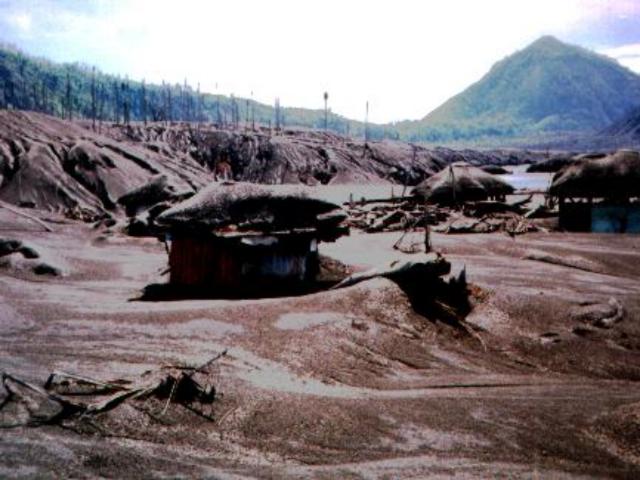 |
Figure 31. Photograph of Tavurvur's extreme N flank (upper right edge), Turanguna (right background), and devastated groves and structures, November 1996. Courtesy of Nancy Roper. |
Emissions from Tavurvur in early March consisted of pale gray vapor clouds that commonly rose ~600 m above the crater. Vulcanian explosions occurred occasionally and were commonly followed by ash emission lasting from 20 minutes to 2 hours. On 6 March, a Vulcanian explosion ejected lithic blocks that fell over the entire cone, the farthest reaching Greet Harbor (1 km from the vent). During the explosion, a small landslide on the NW flank of the volcano left a scar several hundred meters long.
At 0736 on 14 March a large and loud explosion was accompanied by a gray ash-rich eruption plume. Within an hour, Strombolian explosions ejected fragments that showered Tavurvur cone. By 0930, sub-continuous Strombolian eruptions occurred; these commonly produced loud detonations; in addition, flashing arcs were noted in the eruption plume. Some of the explosions sent "large lumps of lava" up to 1 km above the crater at intervals ofBGVN22:01) and partially overrode the October 1996 and January 1997 lava flows. The strength of the eruption did not begin to decrease until about 1530. By 2200 the eruption had declined to discontinuous explosions. Lava reached the sea near Sulphur Point sometime during the night (figure 29).
Due to a strong wind, the eruption plume was dispersed to the SW and remained below 2 km in height. Approximately 2 km SW, the town of Talway accumulated a 13-cm-thick pumiceous deposit. The detonations were very loud in the Kokopo area, 14 km SW. The Tokua airport ~20 km SW was closed for most of the day due to the threat of ashfall.
On 15 March, strong eruptions continued at intervals of minutes to hours and eruption plumes rose 400-600 m. Occasionally a peculiar pulsating roaring sound was heard that generally correlated with periods of harmonic tremor.
The level of activity continued to decrease between 16 and 19 March. There were progressively less frequent, but still loud, explosions with occasional roaring sounds. For the remainder of March, the level of activity was low, with weak white plumes rising to ~500 m above the crater. Occasionally, large explosions sent plumes as high as 3,000 m above the crater.
Seismicity began to increase on 7 March and reached 300 events/day with real-time seismic amplitude measurement (RSAM) levels rising to ~60-120. Levels decreased during 11-12 March but increased again on the 13th. During the eruption on 14 March, RSAM levels reached a plateau of ~ 850, similar to October 1996 and January 1997 eruption levels. By 2200 on 14 March, RSAM levels had dropped to ~100. A few intervals of harmonic tremor were recorded on 18-20, 22, 24-25, and 28 March.
Correlation spectrometer (COSPEC) measurements early in the month revealed SO2 fluxes of 2 fluxes increased to 400-700 tons/day before returning to background levels on 18 March. By the end of March, SO2 fluxes began to rise again.
In response to the eruption, the SCK water-tube tiltmeter 3.3 km NW of Tavurvur showed a radial deflation of 11 µrad (compared to 16 µrad and 11 µrad during the October and January eruptions, respectively). By the end of the month, radial inflation began to increase again.
Reference. Almond, R.A., and McKee, C.O., 1982, Location of volcano-tectonic earthquakes within the Rabaul Caldera: Geological Survey of Papua New Guinea report 82/19.
Information Contacts: B. Talai, H. Patia, D. Lolok, P. de Saint Ours, and C. McKee, Rabaul Volcano Observatory (RVO), P.O. Box 386, Rabaul, Papua New Guinea; Bureau of Meteorology, Northern Territory Regional Office, P.O. Box 735, Darwin, NT 0801 Australia.
Typical eruptive behavior and plumes up to 7 km altitude
Another phase of strong Strombolian eruptions took place at Tavurvur in April. There were both gas-rich explosions and a small but complex lava flow on the upper S flank of the cone. The lead-up to these eruptions was characterized by episodes of relatively gas-rich, low-pressure vapor emissions punctuated by occasional moderate to large explosions. The explosions seemed to increase in strength from late March to early April. One of the largest explosions took place on 28 March and its cloud rose ~4.3 km above the vent. One on 5 April rose ~5.3 km.
In early- to mid-April Tavurvur displayed a variety of notable eruptive phenomena: odd-colored gases, unusual lava-venting styles, a small pyroclastic flow, and the ejection of very large bombs. The water-tube tiltmeter at Sulphur Creek (3.5 km from Tavurvur) showed inflation at a rate of 0.4 µrad/day in the direction of Tavurvur until about 8 April when a reversal occurred.
COSPEC measurements indicated low outputs of SO2, 100-200 metric tons/day (t/d) following the higher output of the mid-March eruption (BGVN 22:03). During 29 March-2 April, briefly elevated SO2 outputs (400-600 t/d) were measured. There was a decline in SO2 flux in early April, reaching a low of 220-370 t/d when measurements ceased on 8 April. Unfortunately, the COSPEC was removed from Rabaul at a critical time, denying the opportunity to monitor SO2 during the subsequent eruptive cycle.
Small swarms of low-frequency earthquakes preceded several of the 9-12 April explosions. An explosion on 10 April ejected a plume that may have risen as high as 7 km, and generated small pyroclastic flows on Tavurvur's upper flanks. Heavy ballistic fallout on the N flank also triggered a small landslide.
Eruption of 12 April. At 0829 on 12 April a Strombolian eruption was accompanied by a strong explosion. This explosion generated a very dense and dark ash cloud. Part of the ash cloud may have been projected at a low angle eastward, or alternately, the E part of the eruption column may have collapsed. In any case, the end result was the generation of a small pyroclastic flow on Tavurvur's E flank. A very dense, dark ash fall-out cloud hung over the area NE of Tavurvur until about 1000 on 12 April. About this time, the ash content of emissions dropped markedly.
During this episode, from about 0830 the RSAM level rose very sharply, peaking at 1000 at about 850 RSAM units. The seismicity remained at this level until about 1100 when it started to decline.
At 1030, nearby observers saw ejecta that looked incandescent and quite fluid. Accompanying explosions repeated at intervals of 1 second or less. The maximum height reached by ballistic ejecta was a little over 1 km. Some of the ejecta were tens of meters across. Orange gas clouds of unknown composition accompanied some explosions.
From about 1130 it seemed as though lava collecting in the crater had risen, although no lava flow had commenced. By about 1200 strong fumes escaped from Tavurvur's upper S flank, which began to bulge outward. Incandescence was seen occasionally on the flank as chunks of the bulging part of the cone tumbled downslope. At 1215 a breach in the S rim of the crater developed in an area that had been undermined by the subsurface passage of lava. Black lava without visible incandescence was moving down the S flank at 1218. By 1226, a broad flow-front (several hundred meters wide) reached a mound about half-way down the S flank. Soon after, by 1229, a W lobe developed.
At 1236 on 12 April, following 1-2 minutes of silence, a lava fountain rose rapidly several tens of meters above the crater. It then expanded at its top, forming a large ball of lava ~50 m across. The lava ball then exploded, showering the S flank with huge clots of brightly incandescent lava. A similar event followed at 1245 when a large mound of lava (50 m across) rose rapidly in the crater before exploding.
During the early afternoon, the multi-lobed front of the slowly descending lava flow headed mostly S and W. No incandescence could then be seen in the frontal parts of the flow, but weak incandescence was visible in the 20- 30 m channel through the breach in the S rim of the summit crater. Observers first saw an E lobe at about 1420, but it had certainly developed prior to that time.
An aviation report around 1335 on 12 April (issued by Darwin VAAC) described an ash cloud to 4 km that was "pale gray and low in ash content." The report also noted that ash clouds blew NE and satellite imagery lacked clear evidence of an ash cloud. At 2123 the Rabaul Volcano Observatory issued a warning to aviators that "a large ash column was ejected forcefully up to several kilometers."
During the early afternoon there was a gradual decline in seismicity, although some individual explosions accompanied very strong signals. By 1800 the RSAM level had dropped to about 640 RSAM units.
The night-time activity on 12 April remained spectacular even though the strength of the eruption had markedly declined. A particularly large bubble of lava formed in the crater at 1816 and shattered, causing a brilliant shower of incandescent ejecta, accompanied by a loud cracking detonation. Many similar explosions occurred through the night but none was as large or as bright as the one at 1816.
The outline of the new lava flow was difficult to see when viewed from ~1 km away on the night of 12 April. Only the part of the flow front on the S flank remained incandescent, and it lacked detectable movement.
Although there were occasional, powerful explosions through the night of 12 April, an overall decline in eruptive and seismic activity continued. At about 1000 on 13 April, seismicity reached a low of about 150 RSAM units. Strong explosions continued through the 13th, but they took place less frequently than they had previously. A key feature of the explosions was the very low ash content in emission clouds. Fluid or plastic incandescent ballistic lava fragments were the principal solid products from the explosions. The gas component was a white to pale gray fume emitted in moderate to large quantities.
The vigor of Tavurvur's outbursts gradually declined through the remainder of the month. Crater glow was still present at month's end.
Post-eruptive activity and observations. Strong, caldera-wide harmonic tremor was a significant feature of the post-Strombolian activity. Commonly, a pulsing and roaring noise accompanied the tremor; the noise suggested that the tremor may have been linked to a near-surface degassing process. On many occasions a large explosion took place followed by a prolonged period of degassing and tremor. There were instances, however, when tremor would commence without an attendant explosion and audible sounds. Tremor mostly ceased by 24 April, but isolated periods still occurred at the month's end.
In contrast to earlier Strombolian eruptions at Tavurvur, tiltmeter readings at Sulphur Creek lacked offset, an observation that appeared consistent with this eruption's relatively small volume. By late April there was evidence from the Sulphur Creek tiltmeter that inflation of the Tavurvur area had resumed, presumably in conjunction with a possible forthcoming Strombolian eruption.
Inspections on the E, N, and S sides of Tavurvur revealed abundant "cow-dung" lava bombs. The largest one seen had landed ~1 km from the vent and measured ~8-9 m across. The lava had obviously been very fluid, and after impact the bomb displayed delicate surface features. No fine ash-fall deposit was found around Tavurvur's base. This was consistent with the absence of ash in the emissions from about 1000 on 12 April, yet the early part of the eruption generated much ash. A search for deposits from the pyroclastic flows found only a light dusting of very fine gray ash in a gully at Tavurvur's NE foot.
The lava flow produced in this eruption differed slightly from the earlier flows seen in October 1996, and January and March 1997. The April flow was ~3-4 m thick (compared to earlier flows that were 4-5 m thick). The most recent flows only covered a relatively small area (105 m2, compared to 106 m2 for each of the earlier flows).
Inspection on 23 April revealed that the E lobe of the flow actually overrode the E margin of the initial flow. Thus, part of the April flow was compound and in this respect unlike the simple flows of the earlier eruptions.
Analysis of one sample from the 12 April eruption indicated a significant change in lava chemistry. The April sample was an andesite having ~59% SiO2 and 4.4% MgO. In comparison, the 1994-95 samples had the compositions of high-silica andesites to low-silica dacites. As with earlier samples, the April one showed evidence of mixing of the caldera's resident dacite with a basalt.
Information Contacts: B. Talai, H. Patia, D. Lolok, P. de Saint Ours, and C. McKee, Rabaul Volcano Observatory (RVO), P.O. Box 386, Rabaul, Papua New Guinea; Bureau of Meteorology, Northern Territory Regional Office, P.O. Box 735, Darwin, NT 0801 Australia.
Inflation precedes 1 June eruption at Tavurvur
Inflation recorded since late April culminated in a Strombolian eruption on 1 June. Unlike most of the earlier Strombolian eruptions, this one escalated slowly and sustained moderate-to-high intensities briefly before declining.
Activity during May. The lead-up to June's Strombolian eruption, like that of the April eruption, was characterized by relatively low-pressure, but voluminous gas-rich emissions. Occasionally, these very pale gray emissions produced light ashfalls from columns with heights of 0.6-1 km altitude. Roaring sounds were heard throughout May; loud explosions occurred on the 2nd (at 0105), 12th (1526), 14th (0759), 15th (0052), and 31st (2201). Weak night glows were seen above the crater on the 1, 2, 16, and 25 May.
Twenty-one low-frequency earthquakes (mostly associated with explosions) were recorded during May; most in the first two weeks. The highest numbers of daily earthquakes reached four on the 7th and three on the 8th. There were six high-frequency earthquakes on the 18th. Two of these were located immediately NE of the caldera and one was just outside the SE part of the caldera. Background seismicity remained low at ~20 RSAM units.
The Sulphur Creek water-tube tiltmeters registered N-down tilt in early May, continuing the inflationary pattern seen since late April. About 5 µrad of inflationary tilt had accumulated by mid-May, a time when the tilting seemed to cease or perhaps reverse slightly. At Sulphur Creek, the total inflation since the March eruption was ~10 µrad.
A new electronic tiltmeter was installed at Matupit Island on 8 May and soon indicated WNW-down tilt, suggesting inflation of the magma reservoir. About 18 µrad of this tilting had accumulated by 15 May when tilt changed to WSW-down, a direction radial to Tavurvur. This change was consistent with the behavior of the tiltmeters at Sulphur Creek in mid May. The WSW-down tilt continued through the remainder of the month, amounting to ~20 µrad. The pattern of tilting registered by the electronic tiltmeter on the S part of the Vulcan headland (Vulcan Island) was complicated during the first half of May, but during the second half of the month ~10 µrad of SW-down tilt took place, consistent with the inflation in the central or eastern part of the caldera.
During May the water-tube tiltmeters at Tavuiliu (on Rabaul caldera's SW rim) continued to shift in a SW- down direction. Since the April eruption this tilting had amounted to about 6 µrad. The only late-stage precursor to the 1 June eruption was an unusual E-down tilt of a few microradians recorded at the Matupit Island electronic tiltmeter beginning about midday on 31 May.
Activity during June. Apart from the tilt, through the early morning of 1 June there was little indication of the impending Strombolian eruption. The eruption's early phase began when low-pressure, hazy, white-and-blue emissions rose a few hundred meters above Tavurvur.
Starting about 0700 at Matupit Island, a N-down shift in tilt began at ~1 µrad/hour accompanied by discontinuous tremor (recorded at the nearest seismic station, KPTH, ~1 km away on Matupit Island). By about 0830 on 1 June, the seismicity had climbed to ~50 RSAM units from a normal background of about 20. At 0837, a moderate explosion sent a low-density ash cloud ~1.3 km above the vent. Seismicity briefly reached 200 RSAM units and then declined to ~90 RSAM units by 0900. The column remained at ~1.3 km and seismicity fluctuated between about 60 and 150 RSAM units until 1030 when activity intensified.
Later, at about 1030, the column rose to ~2.5 km and seismicity increased to 250 RSAM units. The column was a pale gray-brown color, with moderate ash content. A strong S wind blew the plume over the E side of Rabaul Town. Then, between 1100 and 1145, eruptive vigor declined and seismicity fell (to 120 RSAM units).
From 1130 until 1930, the eruption was observed at comparatively close range, at 0.5-1.5 km distances. Although the explosions were initially, around 1130, almost continuous, the column only rose to ~0.5 km above the vent. There were multiple active vents within Tavurvur's summit crater, but the principal one was near the crater's S rim. The explosions produced broad, dense, and moderately dark gray emission clouds that assumed the shape of cock's tails. The activity began increasing again at 1145 and lightning was seen in the column at 1200. The N-down tilt that had been in progress since 0700 reversed at 1200 after accumulating ~5 µrad.
A change in the column was noticed at about 1240 as the emissions became distinctly depleted in ash and the sounds grew louder and sharper. By this time seismicity had increased to about 250 RSAM units, where it stayed until 1400. Tavurur's principal vent (on the S side of the crater) started ejecting incandescent lava fragments, including some very large ones. For brief intervals, other vents in the crater issued dark, dense clouds.
The noisy explosions from the principal vent carried brightly incandescent lava fragments with little ash. In contrast, the dense ash-rich explosions from other vents escaped were accompanied by little or no sound.
During a brief lull between about 1400 and 1425 seismicity fell to ~200 RSAM units. Then, at about 1425, distinctly louder explosions began. It appeared that fluid lava had almost reached the crater rim and the explosions were akin to bubbles bursting. The explosions usually involved sustained jetting for periods of over 10 seconds. Intervals between events were typically only a few seconds.
Beginning about 1440, visible shock waves were observed. At about 1451 the explosions were very loud and the eruption column was about 0.5 km high. At 1450, seismicity peaked at 645 RSAM units.
A prolonged period of dense, dark ash emission commenced at about 1500 and seismicity fell sharply. While dark ash clouds billowed upwards from vents in the W part of the crater, the principal vent continued producing nearly ash-free explosions bearing larger incandescent fragments. The dense, dark ash emission had ceased by 1519, and by then seismicity had dropped to 300 RSAM units. Seismicity during 1520-1600 increased to ~500 RSAM units; after that it declined slowly so that by 1800 it reached 300 RSAM units. After 1830 seismicity declined more quickly, so that by 2030 it reached only 90 RSAM units.
For most of the remainder of the eruption the only vent to emit much solid material was the principal vent, which continued to eject nearly ash-free, incandescent lava fragments. Although the bulk of the column remained only ~0.5 km above the vent, beginning in the mid-afternoon some fragments rose ~100 m higher. Explosions throughout the afternoon tended to sustain stronger jets of gas and lava fragments. By about 1800 some of the explosions were more than 1-minute long. In one 5-minute period at about 1800 there were eight explosions.
Witnesses on a boat sailing past Tavurvur's S and W flanks at about 1910-1930 noticed considerably more ejecta landing N of the vent. Some ejecta blew in the strong prevailing S wind as far as Tavurvur's N flank. Between 1200 and 2000 the tiltmeter at Matupit Island had accumulated ~5 µrad of predominantly S-down tilt. Then, at 2000, the tilt shifted to SW down, changing by 0.3 µrad/hour.
During the night of 1 June there were episodes of rhythmic degassing; in addition some very loud detonations shook buildings. Background seismicity fell slowly after 2030 on June 1, descending by midnight to 30 RSAM units. Sustained increases in seismicity returned on 2 June during two intervals: the first, 0100-0145, and the second, 0300-0500. During these intervals, seismicity reached 300 and 250 RSAM units, respectively. In addition, a brief (10 minute) peak in seismicity occurred around 0330 on 2 June; it reached 750 RSAM units.
Overview. Unlike some previous eruptions, no lava flows were generated by the 1-2 June event. Ejected lava fragments showed textural evidence of moderate expansion but lacked evidence of post-emplacement flow. Additionally, the bombs were considerably smaller.
The volume of material erupted on 1 June was very small, possibly only 1 x 10⁵ m3. There was no off- set in tilt as had been seen with the earlier, larger eruptions. Thus, after the 1 June eruption, Tavurvur remained inflated 10 µrad over the tilt encountered after the March eruption (BGVN 22:03). Accordingly, scientists believe that Tavurvur could erupt with similar intensity again in coming weeks.
Information Contacts: B. Talai, D. Lolok, P. de Saint-Ours, and C. McKee, Rabaul Volcano Observatory (RVO), P.O. Box 386, Rabaul, Papua New Guinea.
Diminished eruptions after 1 June but strong tilt follows
Tavurvur's activity subsided following the Strombolian eruption of 1 June (BGVN 22:05). The eruption's main episode peaked at about 1452 on 1 June, achieving a RSAM value of 645 units. Activity then dropped briefly but picked up again. The second RSAM peak at about 1612 on 1 June did not get higher than the first one; afterwards, activity decayed exponentially and at about 2300 on 1 June reached a background low of 30 RSAM units.
As the activity decayed there were loud explosions that sent dark ash clouds ~ 2 km above the summit. Explosions decreased in number and intensity until 14 June. For the remaining part of the month, Tavurvur both continuously and gently emitted thin white with blue vapors.
During the month a total of nine high-frequency earthquakes occurred. Only one of them was reliably located in the caldera's SE quadrant, a common zone of epicenters. The other events were not reliably located (due to a lack of operating seismic stations), but probably occurred outside the caldera to the E (1 event), NW (6), and W (1). Harmonic tremor with durations of a few minutes to about an hour occurred in June. These followed the main eruption episode of 1 June and on 4, 6, 9, 10,11, and 21 June.
The electronic tiltmeter at Matupit Island indicated WSW-directed tilt in the latter half of May. At the beginning of June, the tilt direction drifted to the SW, suggesting inflation to Tavurvur's N. This inflation continued until the 14th; tilt during this interval amounted to 34 microrad. After the 14th, the tilt direction drifted back to WSW, radial to Tavurvur; in this orientation the tilt changed by 20 microrad. Tilt changed little during 19-30 June.
During June, the water-tube tiltmeter at Sulphur Creek (near Rabaul Town's S margin, 3.5 km NW of Tavurvur) suggested inflation centered to Tavurvur's N. During June, the electronic tiltmeter on the S part of the Vulcan headland indicated inflation in the central caldera (S of Matupit Island). Similar observations preceded the last few Strombolian eruption episodes.
Reference. Lauer, S.E., 1995, Pumice and ash: a personal account of the 1994 Rabaul volcanic eruptions: Quality Plus Printers Pty. Ltd., Ballina, Australia, 80 p.
Information Contacts: Ben Talai, Rabaul Volcano Observatory (RVO), P.O. Box 386, Rabaul, Papua New Guinea.
Increased Strombolian eruptions on 11-12 July
A short eruption of ash and blocks occurred at Tavurvur during July. The build up prior to this eruption was similar to the two previous Strombolian phases (1 June and 12 April); those build ups were characterized by relatively low-pressure, low-ash emissions and occasional moderate-to-large explosions.
The eruption began on at 2318 on 11 July and peaked at about 0700 on 12 July with a corresponding RSAM value of 450 units. Activity then dropped and fluctuated between 90 and 240 RSAM units; later, at about 2230 on 12 July, a peak of 420 RSAM units occurred. After 0200 on 13 July activity declined to a background level of 30 RSAM units.
The more vigorous periods of eruption included explosions with gray ash clouds rising 2-3 km above the summit and ejected blocks thrown ~1 km from the vent. The ash plumes blew N and NE, and fine ash fell downwind. Later, during 14-31 July, Tavurvur issued continuous gentle emissions of thin white and blue vapor. No lava flow was emplaced during the 12 July eruption. As a result, the volume of material erupted was very small, ~0.3 x 10⁶ m3.
Seventy-five low-frequency earthquakes (mostly explosion events) were recorded during the month. Most of these occurred during the eruption on 11-12 July with daily counts of 29 and 43, respectively.
The electronic tiltmeter at Matupit (2 km W of Tavurvur) accumulated 12 µrad of WNW-down tilt from the beginning of July until the eruption on the 12th (i.e. radial to an inflation of the shallow caldera magma reservoir). After the eruption, the tilting pattern changed to WSW (i.e. radial to a possible inflation between Rapindik and the north of Tavurvur). The eruption itself caused virtually no significant tilting. No clear trends were shown by any of the other tiltmeters further away from Tavurvur. These small ground deformations appear in accord with the eruption's short duration, low energy, and small volume.
After technical problems, COSPEC measurements resumed and during the first four days of measurements, 2- 5 July, the SO2 output was 660-1,380 metric tons/day (t/d). The SO2 flux then decreased during 5-10 July (~200 t/d), increasing again on 11 July (420 t/d). It remained high until the eruption on 12 July (~1,000 t/d) and continued so during the next three days. After that it decreased to ~600 t/d where it remained until the end of the month.
In overview, the observations and measured parameters all indicated that the 11-12 July eruption was small compared to the six Strombolian phases since December 1995.
Further Reference. Lauer, S.E., 1995, Pumice and ash: a personal account of the 1994 Rabaul volcanic eruptions, Quality Plus Printers Pty. Ltd., Ballina, Australia, 80 p. (ISBN 0 646 26511 3).
Information Contacts: B. Talai and H. Patia, Rabaul Volcano Observatory (RVO), P.O. Box 385, Rabaul, Papua New Guinea; Bureau of Meteorology, Northern Territory Regional Office, P.O. Box 735, Darwin, NT 0801 Australia.
Explosion and lava fountaining on 17 August
Activity in August was restricted to Tavurvur crater while Vulcan cone and the rest of the caldera floor remained quiet. During the first two weeks of the month Tavurvur released continuous gentle weak emissions of white and blue vapors, occasionally accompanied by loud to low roaring. Night glow around the crater mouth occurred on some days.
On 17 August at 0327 a loud explosion was immediately followed by forceful emissions of dark ash-laden clouds rising to ~3 km altitude. Glowing lava fragments were observed within the eruption columns. Eruptive activity increased gradually until it peaked at 0500 with a corresponding Real-time Seismic Amplitude Measurement (RSAM) value of 740. During the 15 minutes of peak activity there was loud sub-continuous lava fountaining. Glowing lava fragments projected ~500 m above the crater rim fell on the S and E slopes of Tavurvur; some fell on the E caldera wall. At 0515 eruptive activity dropped sharply and by 0700 (RSAM = 180) roaring and explosion sounds only occurred ~3 times/minute. The intervals between sounds and ash projections became longer and at about 1300 (RSAM = 64) the eruption stopped. No lava flows were produced during the eruption.
Two vents were active during the eruption, one on the E crater rim and the other just W of the rim. The E vent was the more active of the two. The eruption clouds were pale gray (during daytime) at the height of the eruption but were paler (whitish) as the level of eruption decreased. The emissions rose to ~3,000 m altitude during the eruptive period but dropped to ~400 m when the eruption stopped. The emissions were blown NE and N with continuous light to moderate ash falls in the Matalau area and light ashfall on the E part of Rabaul Town. The eruption was mild, short-lived (~10 hours) and smaller than the last eruption on 11 July (BGVN 22:07). It was the smallest of the last seven Strombolian phases of activity (10-11 May and 4-5 October 1996, 9 January, 14 March, 12-13 April, 1 June, and 11-12 July 1997). The last two eruptions (July and August) were more Strombo- Vulcanian in character.
On 16-17 August there were 173 low-frequency earthquakes recorded associated with explosions at Tavurvur. Only four high-frequency earthquakes were recorded during the month; one was located to the NE (offshore) outside the caldera, and another ~1 km S of Matupit Island. From 18 August until the end of the month Tavurvur returned to its normal gentle white emissions with blue vapors accompanied by occasional (sometimes hours apart) loud to low roaring sounds. The emissions rose as high as 400 m and then were blown N. Steady weak red glow at night around the crater mouth occurred throughout the month.
Electronic tilt at Matupit Island started to show a NW-down tilt beginning on 5 August. This continued until the 13th when the E-W component of the tilt plateaued; the N-S component continued its steady N-down trend until the 17 August eruption, when that component also plateaued. This cessation of ground tilt continued until 24 August when both components simultaneously resumed their steady NW-down tilt. It is thought that this cessation of tilt for 6 days indicated small-scale relaxation of tumescent stress in Greet Harbour caused by the eruption; no deflation occurred and the inflationary trend on the 24th was at the same rate and direction as before the 13th.
Dry tilt around the caldera showed no overall pattern in response to the eruption. The closest regularly occupied dry tilt station to Tavurvur (Transmitter, on Matupit Island) showed a slight inflationary trend in relation to the deformation center in the mouth of Greet Harbour before the 17 August eruption, and a 20 µrad NW offset after the eruption. This offset had not been recovered by the end of the month.
The water-tube tiltmeter at Sulphur Creek (~3.5 km NW of Tavurvur) showed a steady NW-down tilt of ~4 µrad (away from Tavurvur) seven days before eruption happened. One day before the eruption, an increase of 6 µrad was recorded, but deflation (SE-down tilt) with a similar magnitude occurred during the eruption. Sulphur Creek resumed its steady NW-down tilt trend after the eruption. A GPS network along the old Rabaul Airstrip (eight stations) and around the N part of the caldera showed few significant horizontal movements during August, although post-eruption surveys seem to indicate a slight NW movement of most stations (up to 4 cm at some stations at the E end of the runway).
COSPEC measurements showed fluctuations in SO2 emissions during the month. A high SO2 emission level of 1,080 tons was recorded on the 12th. Output dropped on the following two days (to ~500 tons) and was on a slow steady increase when the eruption occurred (at ~800 tons). During the eruption SO2 output continued to rise, reaching a peak on the 19th (at 1,050 tons). It decreased on the 20th to low levels before resuming an upward trend, reaching the highest peak of 1,200 tons on 28 August before it dropped once more.
Information Contacts: Ben Talai, Rabaul Volcano Observatory (RVO), P.O. Box 386, Rabaul, Papua New Guinea.
Tilt recorded after a M 4.7 tectonic earthquake on 25 September
An earthquake of M ~4.7 on 25 September, centered ~40 km SSW of Rabaul, caused small offsets on tiltmeters throughout the caldera. A water-tube tiltmeter at Tavuliu on the SW caldera rim showed a large non- recovered offset of 20 µrad to the WSW, possibly due to a small rotational slip of the cliff in this area. The earthquake also seemed to trigger a 300 ppm rise in SO2 from Tavurvur, declining to pre-earthquake levels after a few days. Possibly also related to the shock on the 25th was the only low-frequency seismic event of the month, on 26 September, near Tavurvur. Since an airwave was produced, this event was probably an explosion at shallow levels within the conduit of Tavurvur.
In the immediate area of Rabaul Caldera, seismicity remained low. Only two high-frequency events occurred under or near the caldera. Striking at depths of 2 to 4 km, one occurred on the 20th and the other on the 29th.
Steady glow was observed at night from Tavurvur until 9 September. Roaring and rumbling sounds could be heard during 1-6, 14, 17, and 28 September. Fumes continued to be emitted throughout the month; in dry, warm conditions these appeared as a blue-gray haze and would sometimes cause a sulphurous odor and hazy conditions for several km downwind; in cooler and/or more humid conditions the fumes would appear as a thick white plume.
A water-tube tiltmeter at Sulphur Creek, 3.5 km from Tavurvur, showed a 3.5 µrad inflation of Tavurvur for September. This inflation has been continuing since the 20 µrad deflation caused by the 14 March eruption (BGVN 22:03). The eruptions of 12-13 April, 1 June, 11 July , and 17 August (BGVN 22:04-22:08), caused no significant deflation, and there has been a 16 µrad recovery.
Information Contacts: B. Talai and H. Patia, Rabaul Volcano Observatory (RVO), P.O. Box 386, Rabaul, Papua New Guinea.
Low level of activity but tilt readings reveal inflation
Activity at Tavurvur crater was at a low level during October 1997 despite a slow re-inflation of the shallow caldera reservoir. Weak fumarolic activity composed of white and blue vapor emissions occurred at the summit area; during mid-October the emission rate increased and roaring noises were heard. Output of SO2 from the crater peaked at ~960 metric tons/day during mid-October; during the following week, the emission rate returned to a normal level of 400 tons/day. A similar peak occurred towards the end of the month.
Seismic activity remained low throughout October. Two high-frequency events, on 15 and 21 October, were recorded; however, neither was large enough to be located.
The water-tube tiltmeter at Sulphur Creek (3.5 km from Tavurvur) indicated an additional 8 µrad inflation of the central magma reservoir area during October. Inflation since the 17 August eruption (BGVN 22:08) totaled 15 µrad. Dry-tilt measurements around Greet Harbour showed an inflation of 2-5 µrad radial to the central magma reservoir. Leveling results confirmed the inflationary trend with a 3-cm uplift since March at the end of Matupit Island and a 3-5-cm uplift measured by sea shore survey since June. No changes in tilt were recorded on the Vulcan side.
Information Contacts: B. Talai and H. Patia, Rabaul Volcano Observatory (RVO), P. O. Box 386, Rabaul, Papua New Guinea.
Slow ongoing inflation
Slow caldera inflation continued throughout November. Weak emissions of white vapor were produced by Tavurvur cone. The volume of emissions increased at the end of the month in response to rainfall. On 26 November, weak night glow was visible and a brief rumbling sound was heard.
Slow, ongoing inflation has occurred since the last significant lava-producing eruption at Tavurvur on 14 March (BGVN 22:03), despite subsequent minor Strombolian and Vulcanian eruptions on 12 April, 1 June, 11 July, and 17 August (BGVN 22:04, 22:05, 22:07, and 22:08). The inflation mainly affected areas within ~3 km of Tavurvur and the Greet Harbour shallow magma reservoir. Maximum rates of tilt were no more than 4 µrad /month; maximum monthly uplift was no more than 1 cm.
One high-frequency event from the NW was recorded on 14 November; no low-frequency events occurred during the month. SO2 output measured by COSPEC decreased in mid-November from ~800 to ~300 tons/day. Soil CO2 flux, monitored at 14 locations around the bay, was relatively low (<=200 mg/(m2 day)).
Information Contacts: Patrice de Saint-Ours, Rabaul Volcano Observatory, P.O. Box 386, Rabaul, Papua New Guinea.
New eruptive phase begins in late December
After 4 months of slow inflation, a new, though mild, eruptive phase occurred at Tavurvur in late December. Until mid-December, emissions from Tavurvur crater were mainly white vapor clouds of varying density. A weak glow was visible around the crater mouth on most nights. An explosion occurred on 7 December at 0636. A series of explosions occurred later on 21, 23, 24, 28, and 29 December, resulting in ash columns rising ~1,000-3,000 m above the summit. Explosions at night displayed glowing lava projections. Roaring and rumbling sounds were heard for days preceding and accompanying the explosions. Seismicity and ground deformation reflected the eruptive activity.
Low-frequency volcanic earthquakes from Tavurvur resumed on 2 December following a quiet period during September-November. The number of earthquakes was low initially (1-3/day) but increased suddenly on 22 December. By the end of the month the number had decreased again. The increase in earthquakes was accompanied by periods of low harmonic tremor with durations ranging from a few to 20 minutes.
Also in the first week of December, a series of 10 high-frequency earthquakes occurred. The earthquakes were too small to be located, but according to analysis of arrival times at recording stations they appeared to originate NE of Rabaul. The occurrence of these earthquakes, together with the increase in low-frequency earthquakes and summit activity, illustrate a long perceived theory that NE earthquakes precede an increase in volcanic activity at Tavurvur with the lead-time ranging from a few weeks to months. This particular period of eruption at Tavurvur was foretold by a reversal in tilt at the Sulphur Creek water tube tiltmeter (3.5 km NW) from the first day of December. A deflation of ~4 µrad E occurred during the month. The amount of material drained by this eruption was too small to cause a noticeable subsidence. Interestingly, the output of SO2, measured daily by COSPEC, dropped early in the month from 600 metric tons/day to undetectable levels. Explosions on 7 and 24 December released 400-900 tons /day of SO2. Soil CO2 flux, integrated over 2 weeks, remained relatively low (<200 mg/m2/day).
Information Contacts: Ben Talai, Rabaul Volcano Observatory (RVO), P.O. Box 386, Rabaul, Papua New Guinea.
Slow inflation, low activity during January
The mild upsurge of activity in late December 1997 (BGVN 22:12) decreased in January. Tavurvur Crater returned to normal activity with weak to moderate white vapor emissions that were thicker following rainfalls. Loud roaring and rumbling noises were heard on 4 January. Weak to bright red glow was seen at the summit almost every night in January.
Seismity was at a low level. Low-frequency volcanic earthquakes occurred on 1, 4, and 6 January; 11 high-frequency earthquakes were recorded during January. All of the high-frequency events occurred outside the caldera, eight to the NE, and three to the E and SE.
Ground-deformation instruments recorded the continuous, slow inflation that has been occurring since May 1997. In agreement with sea-survey measurements, GPS data since November 1997 revealed an uplift of ~1.5 cm on Matupit Island. The Sulphur Creek water-tube tiltmeter (3-5 km NW of Tavurvur) showed ~6 µrad of January inflation.
During January, COSPEC measurements of SO2 registered ~200 metric tons/day (t/d) compared to ~450-750 t/d during November-December 1997. The low readings were due in part to a change in wind direction that blew the plume away from the observation point.
Information Contacts: Ben Talai, Rabaul Volcano Observatory (RVO), P.O. Box 386, Rabaul, Papua New Guinea.
January activity presages February eruption
A continuous glow was visible at nights throughout January 1998 at Tavurvur crater, and there was also a slow but steady inflation of the volcano during the month. An expected eruption began at Tavurvur on 3 February 1998.
The eruption began with emissions of pale to dark gray ash clouds typically 5-20 minutes apart. There was no noise associated with the emissions although small, low-frequency seismic events did accompany each event. Over the next few days roaring and rumbling could be heard down-wind (to the SE) of Tavurvur and seismic events became generally larger. Loud explosions were recorded once to 5 times daily. The explosions usually were accompanied by forceful emissions of dense gray to dark ash clouds that rose to 2000-3500 m above the crater. These were followed by moderate to small ash-cloud emissions lasting ~30 minutes. During the explosions lava fragments were ejected to heights of 200-300 m, showering the slopes 200-500 m from the base of the cone. Some small ash flows were also generated during explosions. During strong ash emissions at night, successive 5-minute projections of glowing lava fragments were observed. This pattern of eruptive activity lasted until the end of February.
Ash rose to 300 m above the crater (600 m a.s.l.) and was usually distributed to the SE, with occasional drifts to the N and W. Each ash emission produced light ash fall at Talwat village SE of Tavurvur near the base of the cone. There was also very light ash fall recorded elsewhere on New Britain, including at Tokua airport 20 km from Tavurvur.
Seismic activity was generally low. A slight increase in the frequency of volcanic earthquakes in early February reflected the increase in activity at the summit of Tavurvur. The increase was indicated on the 1- minute RSAM data as background values of 20 RSAM units increased to 100. Between 10 and 48 earthquakes were recorded daily. The average number per day was 27, but after 22 February they dropped to 9. Two high-frequency earthquakes recorded during February were located 20-30 km ESE of the caldera.
During the current phase of eruptive activity there has been no significant change in ground deformation compared to the inflationary trend prior to the eruption. A water-tube tiltmeter located 3.5 km NW of Tavurvur showed a slow yet steady rate of inflation: total accumulated tilt for February was 4 µrad. Real-time GPS measurement taken from a remote station on Matupit Island 2 km W of Tavurvur showed no significant change.
Although COSPEC SO2 measurements lacked precursory signatures suggesting an eruption, a slightly higher SO2 flux of ~350 metric tons/day was measured when the eruption started. After several days the flux decreased to a low level of ~190 tons/day. The low flux values attained during the month were partly due to a change in wind direction away from the fixed observation post.
Information Contacts: Ben Talai, Rabaul Volcano Observatory (RVO), P.O. Box 386, Rabaul, Papua New Guinea.
Ash emissions, pyroclastic flows, and inflation during March
Eruptive activity at Tavurvur persisted during March following the 3 February eruption (BGVN 23:02), producing ash emissions, small pyroclastic flows, and relatively low but fluctuating seismicity. Seismicity peaked around20 March, when eruptions became more energetic, and was probably related to near-surface eruptive activity.
Deformation monitoring indicated steady inflation at Tavurvur. Readings from the Sulphur Creek water tube (3.5 km NW of Tavurvur) revealed a change of ~3 µrad tilt away from the volcano during March. Leveling and real-time GPS also showed continuing inflation.
Tavurvur continued to erupt throughout March and emitted ash at intervals of ~10 minutes to several hours; the rapidly convecting column sometimes rose 2-4 km. After emissions had ceased for more than 10-20 minutes, activity would often recommence with explosions that threw large numbers of blocks from the vent. Blocks up to 1 m in diameter were regularly thrown 1 km S and W of the vent, landing out to sea. Large blocks (~3-4 m across) littered the rim and upper slopes of Tavurvur, probably produced during larger-than-usual explosions on 7 and 8 March.
The 8 March explosion sent red oxide-covered lava blocks and boulders over the S crater rim and down the S flank of Tavurvur, where the flow traveled ~1 km. This mass was described as being "pushed" from the vent immediately prior to the explosion. At other times the ash plume underwent partial column collapse and sent short, billowing flows randomly down the cone's flanks. The flows deposited light gray dust ~50-150 m downslope in well-defined tongues.
During 18-26 March night glow became more evident; occasionally lava fountains sent glowing fragments 200-300 m above the crater rim for up to 5 minutes at a time. During 26-31 March intermittent ash emissions with discrete explosions after longer periods of quiescence resumed.
Information Contacts: Ben Talai, Rabaul Volcano Observatory (RVO), P.O. Box 386, Rabaul, Papua New Guinea.
Tavurvur cone issues periodic large explosions and almost constant weak eruptions
During March, the frequency of explosions at Tavurvur rose progressively to about one weak ash plume per minute (BGVN 23:03). On 3 April, the volcano began producing 1-2 large explosions per day but continued emitting about 20 weak ash explosions per hour. Larger explosions showered the volcano's flanks with blocks and sent dark ash clouds to an altitude of ~1 km.
After fours days with short bands of harmonic tremor, activity changed on 11 April, when at 0730 visible and recorded activity dropped suddenly to background level. After 1030 large explosions occurred every 2-12 hours and sent dark ash clouds to altitudes of 1.5-3 km. The largest explosion threw blocks beyond the cone's base and Sulphur Point into the sea and produced short ash flows down every flank. Between explosions only weak white and blue vapor wisps were visible. This pattern persisted with minor fluctuations until the end of April. In total, 1,064 explosions were detected during April; 6 high-frequency events also occurred on the caldera's NE rim on 13 and 25 April.
Trade winds shifted SE on 23 April, causing dense ashfalls in the now partly re-occupied Rabaul town. Ashfalls affected the city throughout the 1996 dry season (BGVN 21:07 and 21:09); scientists predicted that ashfalls would beleaguer the town through 1998 unless emissions cease.
Ground deformation data showed ongoing inflation; they did not suggest an end to the current eruptive phase. Since a March 1997 eruption produced a 4 x 10⁶ m3-lava flow (BGVN 22:03), the central part of the caldera has steadily risen ~12 cm, indicating the slow accumulation of 10-20 x 106 m3 of magma in the shallow central reservoir. Ongoing Vulcanian activity at Tavurvur has not significantly modified the inflation process. Rates of uplift and tilt were only moderately slowed by eruptions during April, June, July, August, and December 1997, and February-March 1998 (BGVN 22:04, 22:05, 22:07, 22:08, 22:12, 23:02, and 23:03). Since the current phase of activity began in February 1998, inflation has appeared radial to the central magma reservoir rather than to Tavurvur. Petrological analysis of samples erupted from mid-1997 to February 1998 indicated that the shallow resident dacitic reservoir received new influxes of basaltic magma.
Scientists stated that despite the "healthy" appearance of the volcanic system, the re-inflation has accumulated only 5% of the volume erupted in September 1994 (BGVN 19:08 and 19:09). They predicted that a dangerous eruption was not imminent, but was a possibility in the long term.
Information Contacts: Ben Talai, Rabaul Volcano Observatory (RVO), P.O. Box 386, Rabaul, Papua New Guinea.
Tripling of volcanic events; ash plumes
During May, the intracaldera cone Tavurvur continued Vulcanian eruptive activity with minor fluctuations. In the first few days of the month there was a sharp increase, from 15 to 200 per day, in the number of low-frequency seismic events related to ash emissions. However, activity soon returned to more normal levels; between the 11th and 18th there were an average 20 events per day.
Most ash plumes contained relatively low to moderate amounts of ash and rose to less than 1,000 m above sea level. Throughout the first week ash plumes were blown to the SE and SW resulting in fine ashfall at the abandoned village of Talwat and in the Kokopo area. For the remainder of the month winds shifted between N and W resulting in ashfall in villages on the W of the caldera and in Rabaul town were it continued to be a nuisance to inhabitants. There were larger explosions with dark-gray ash clouds that rose to 1.5-3.0 km. From 9 May until the end of the month occasional explosions and roaring noises ranging in intensity from weak to loud accompanied the ash emissions. A weak glow was observed above the crater rim throughout the nights of 7 and 8 May, and incandescent lava fragments were ejected during explosions on the 7th.
Activity continued with minor fluctuations from 19 May to the end of the month. The seismic system recorded a total of 3,265 low-frequency volcanic events during May, a significant increase over the 1,064 recorded during April. Five high-frequency events originating outside the caldera were also recorded. Only two of these were located: one W of the caldera on 13 May, and another to the NE on 29 May.
Ground-deformation data showed that the slow on-going inflationary trend associated with the current phase of the eruption temporarily stabilized in early May only to resume again at the end of the month. These data may indicate that Vulcanian activity is likely to continue.
Information Contacts: Ben Talai and H. Patia, Rabaul Volcano Observatory (RVO), P.O. Box 386, Rabaul, Papua New Guinea.
Increase in Vulcanian activity during last week of June
Low-level Vulcanian eruptive activity continued at Tavurvur in June but increased somewhat during the last week of the month. During the first three weeks of June the volcano emitted small pale-gray clouds with a low ash content that rose 600-1,000 m above sea level. These emissions were usually accompanied by weak (or sometimes loud) roaring and rumbling sounds and caused light ashfalls in all but the E areas of Rabaul Town. The activity was consistent during these weeks but was interrupted by two moderately loud explosions heard at 1943 on 5 June and at 0306 on 9 June. Both explosions produced thick dark-gray ash columns rising to 3,000 m above sea level accompanied by glowing lava fragments.
The style of eruption changed in the last week of June. Beginning on 24 June, ash emissions became very small in volume but were extended over longer intervals. This period of relative quiet was followed by four weak explosions on 25-26 June that produced ash columns rising to 1,500 m. This activity persisted: dense ash-producing explosions occurred at 0408 on 27 June, 0403 on 28 June, and at 0355 and 1825 on 30 June. Ash clouds resulting from the explosions rose to 3,000 m and glowing lava fragments showered the flanks and base of Tavurvur cone.
Seismic activity was low in June according to data recorded about 2 km from Tavurvur's summit (at station KPTH). During the month a total of 1,029 low-frequency events were recorded, a significant decrease compared to 3,265 in May. Most of these events were recorded during the first three weeks of the month with an average of ~46 per day. At the end of the month daily totals decreased to only two per day. On some days throughout June, periods of short-duration tremor were recorded. Only three high-frequency earthquakes were recorded, but they were too small to be located. The sequence of arrivals at the recording stations suggested the events occurred outside the caldera.
Ground deformation data showed that the recovery (inflationary) trend observed in late May continued through June. For June, an accumulation of ~6 µrads inflation was recorded by the Sulphur Creek water tube tiltmeter, located 3.5 km NW of Tavurvur.
Information Contacts: Ben Talai, Rabaul Volcano Observatory (RVO), P.O. Box 386, Rabaul, Papua New Guinea.
Scattered ash emissions during July and August
Tavurvur's ash emissions diminished during July and parts of August, but there was a larger-than-usual outburst on 20 August. Caldera deformation continued in July and August.
Ash emissions from Tavurvur continued in July although at a reduced level compared to previous months. During the first two weeks of July emissions were associated with discrete low-frequency seismic events. Occasionally (e.g. on 3, 7, 12, and 16 July) there were moderate explosions producing pale-gray ash plumes that rose ~1,500 m above the summit. Some of these explosions ejected lava fragments onto the flanks. Following lessened activity during 17-24 July, the pattern of emissions changed slightly: in addition to discrete ash emissions, there were periods of continuous emission lasting from a few minutes to a maximum of ten minutes. Ash from these emissions, like that from the explosions earlier in the month, fell NW of Tavurvur in Rabaul Town.
During the first three days of August, intermittent ash emissions generally were pale-gray and poor in ash content. Only one emission, on the 1st, was accompanied by a moderate explosion. A loud roaring and rumbling sound without an ash emission was heard on the following day. There were no ash emissions from 4 to 11 August. Following 12 August, intermittent moderate emissions of pale-gray ash resumed, although there were periods of continuous ash emissions lasting from a few minutes to about an hour. Later in the month, long intervals (12-20 hours) of relative calm were followed by large emissions that generated hot ash flows down the W, S, and E slopes of Tavurvur. On 20 August a violent explosion produced a dense dark-gray ash-laden cloud that rose ~2,500 m above the summit. The explosion ejected many lava fragments high above the summit that showered the slopes of the volcano. Some fragments landed 1 km from the base of the cone.
The reduced level of activity in July was accompanied by a drop in the general level of seismicity as recorded at the KPT seismic station, which is ~1.8 km from Tavurvur's summit. Real-time Seismic Amplitude Measurement (RSAM) values dropped from 55 to 20 units and the hourly event counts dropped from 10 to 2. During July a total of ~200 low-frequency volcanic events was recorded, the lowest count since February 1998. Only four high-frequency earthquakes were recorded; two were located outside of the caldera to the E. Seismicity remained low in August despite a minor increase during the second week of the month associated with ash emissions. These emissions were recorded as discontinuous non-harmonic tremors lasting from a few minutes to about an hour. There were no significant changes from July in either RSAM values or hourly event counts. The total number of low-frequency earthquakes for August was 152, but the count may have been affected by the intermittent functioning of one of the triggering stations. The two high-frequency earthquakes recorded in August were too small to be located.
Ground-deformation measurements continued to show a slow, ongoing inflationary trend through July and August. During each month an inflation of about 2-3 µrad towards Tavurvur was recorded at the Sulphur Creek water-filled tiltmeter (3.5 km NW of Tavurvur). Sea-shore surveys in Rabaul Harbour showed ~1 cm of uplift in the Greet Harbour area. A lower amount of uplift also occurred around the Vulcan area. GPS measurements confirmed an increase in altitude at Matupit Island. The inflation trend had been accompanied by a SW-directed horizontal movement of about 2.5 cm in the previous two months. On the W of the harbour a GPS site on the SE of Vulcan Island showed no significant inflation; however the horizontal components showed a significant deformation of 4 cm towards to NW in the preceding 6 months.
Information Contacts: Ben Talai, Rabaul Volcano Observatory (RVO), P.O. Box 386, Rabaul, Papua New Guinea.
Low seismicity, but regular eruptions continue
The activity at Tavurvur continued as in previous months, with regular Vulcanian eruptions mainly emitting dust with few blocks. These events occurred at intervals of ten minutes to one hour; the longer the preceding interval, the more powerful the eruption.
The overall trend of seismic activity remained low, although short periods of increased activity were observed. During the first two weeks, on 5, 6, 8, and 10 September, bands of discontinuous non-harmonic low-amplitude tremor lasted from a few minutes to about an hour. This activity was coupled with a daily average of 10 discrete low-frequency earthquakes. From 13 September, an increase in low-frequency events became more apparent, with the highest number of 128 recorded on the 18th. This increase continued until 23 September, after which the activity declined to previous levels. Event counts recorded at the KPT seismic station, ~1.5 km W from Tavurvur crater, showed an increase during the month. The total number of events was about 675 compared to about 154 in August. RSAM values also showed a general increase. A few high-frequency earthquakes on 3 September were too small to be located, only seismic stations to the N of the Rabaul Harbor Network recorded them.
A water-tube tiltmeter at Sulphur Creek (3.5 km from Tavurvur) showed a 3.5-mm inflation of Tavurvur for the month. This inflation has been continuing ever since a 20-µrad deflation associated with an eruption on 14 March 1997. In other words, eruptions after 14 March 1997 have lacked significant deflation, and since then cumulative inflation has totaled ~30 µrad.
Information Contacts: Patrice de Saint-Ours, Steve Saunders, and Ben Talai, Rabaul Volcano Observatory (RVO), P.O. Box 386, Rabaul, Papua New Guinea.
Intermittent emissions continue during October
Tilt, leveling, and sea-shore surveys continued to record the slow resurgence of the caldera floor observed since April 1996. During October, continued slow magma supply into Rabaul Caldera kept feeding mild Vulcanian activity at Tavurvur cone. Emissions occurred at irregular intervals, from a few minutes to several hours apart. Longer time intervals usually resulted in more powerful and voluminous explosions.
In the beginning of the month, explosions ejected a grayish ash plume 500-1,000 m above the crater. Following a particularly large explosion at 2138 on October 5 (which littered the cone with incandescent ballistic blocks, and displayed dramatic lightning within the dark rising cloud) emissions were larger for a few days, rising to 1,000-3,000 m, although without sounds. During 10-15 October emissions were again milder, hardly rising over 600 m above the crater. Emissions occurring 16-20 October rose to ~1,000 m and were often accompanied by roaring sounds. After 29 October, emissions were again noiseless, and from the 26th onward they became lower in ash content and energy.
October was the transitional period of wind shift. From the 19th, the NW wind began to dominate and bring welcome relief after seven months of very unpleasant, corrosive, and toxic ashfall to Rabaul and neighboring residents.
The recorded seismicity consisted almost exclusively of low-frequency events accompanying the Vulcanian activity from Tavurvur. However, two types of signals were observed: usual short-duration events, and low-amplitude, long-duration (1-3 minutes) events. Their combined number, with an increase in August and September, averaged 46 per day but increased to 81 and 143 on the last two days of October without any corresponding change in visible eruptive activity. The two types of signals usually occurred in subequal amounts, although on 5-7 October the number of long-lasting events started to dominate, while the shorter events prevailed for a few days after the 8th. The amplitude of both types fluctuated substantially for several multi-day intervals during October. Short-duration harmonic signals were also recorded during 16-18 and 24 October. On 20 October the system registered the month's only significant high-frequency event.
A visit to Rabaul by professional photographer George Casey resulted in several images of Tavurvur during August. Casey appreciated the aid kindly given him by RVO staff and was gracious enough to provide us with photos, including one of a small plume on 4 August (figure 32).
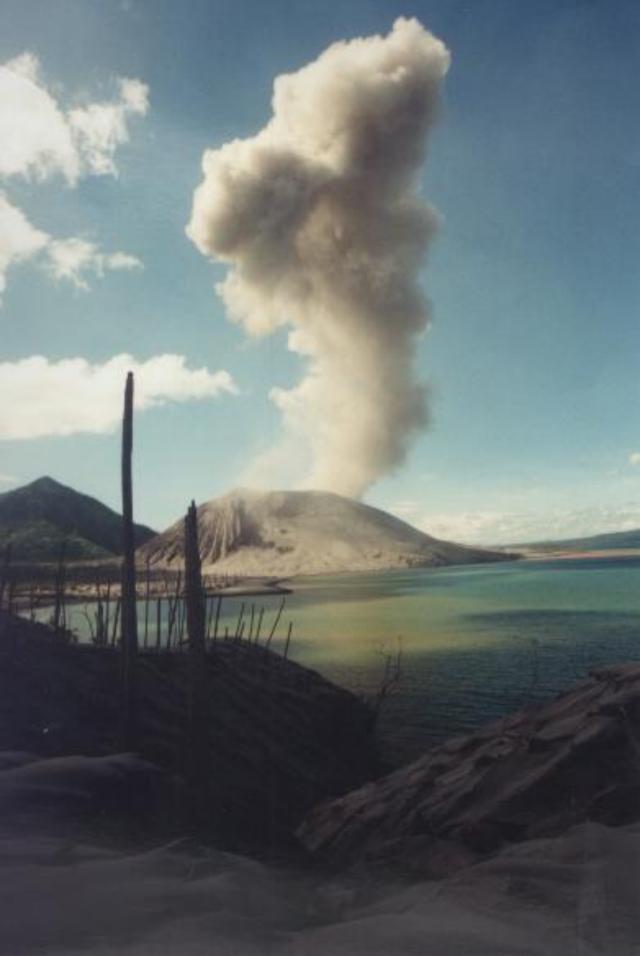 |
Figure 32. The Tavurvur cone at Rabaul emits a small plume on 4 August in this photograph looking SE from the bay's shore. Courtesy of George Casey. |
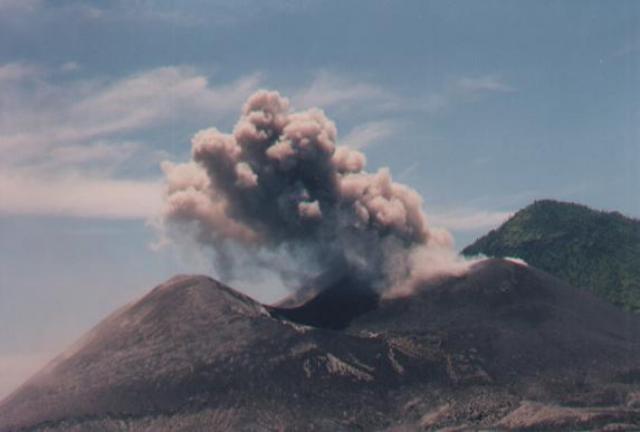 |
Figure 33. An E-facing close-up photograph of the Tavurvur cone at Rabaul from the bay's shore; it emphasizes its low conical shape, wide-aperture crater, and ongoing emissions. Courtesy of George Casey. |
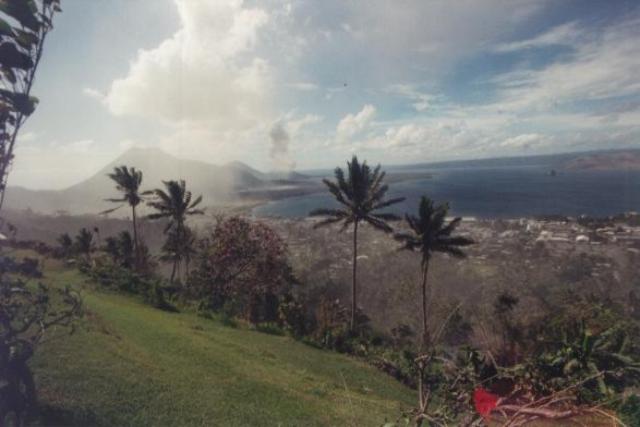 |
Figure 34. SE-looking overview photograph taken on 11 August from Rabaul caldera's topographic margin looking out over the city of Rabaul, Simpson harbor, and the cones that bound the harbor's NE side. The now-resurging caldera is breached by the sea on its E side. Tavurvur cone, ~10 km distant, lies in the peninsular lowlands to the right of the highest peak, Mother (Kombiu), and the lower peak, South Daughter. Courtesy of George Casey. |
Information Contacts: Ben Talai and Patrice de Saint-Ours, Rabaul Volcano Observatory (RVO), P.O. Box 386, Rabaul, Papua New Guinea.
Intermittent emissions of ash during November-December
Eruptive activity was continuous during November and December, dominated by intermittent emissions of small, pale-gray ash clouds from the Tavurvur cone. Some larger ash-laden explosions reached 2.5 km high.
Visual observations. The first 13 days of November were a continuation of the style of activity observed at the end of October (BGVN 23:11) when emissions occurred minutes or hours apart. Ash clouds were usually released quietly, but occasional dark, ash-laden explosions rose 600-1,500 m above the summit. At 1334 and 2019 on 6 November two such explosions occurred: the latter produced an ash column 3 km high and sent pyroclastic flows down the sides of the cone. Moderate explosions were also heard occasionally during 13-23 November, a period of otherwise low activity. On 27 November emissions of dark gray ash at 1712 and 1909 rose ~1,000 m. Emissions subsequently became more frequent, thicker, and darker. Another significant explosion occurred at 1500 on 29 November. Light ashfalls fell mainly to the SE (over the sea), although occasional shifts of wind resulted in ashfalls over populated areas.
Emissions during December also occurred at irregular intervals; however, emissions became more frequent during 5-19 December and at the end of the month. Six large explosions during the month produced dark, ash-laden plumes that rose more than 1,000-1,500 m. Three of these explosions (on the 8, 27, and 29 December) produced ash columns that rose 2,500 m and showered the flanks with lava fragments. The ash was blown mainly to the SE, but some wind changes resulted in fine ashfall over Rabaul. Field observations suggested that the fragments were accidental materials from the vent area. Occasional roaring noises were heard during the month.
Ground deformation. Ground deformations were very slow during both months, though still indicating an uplifting trend that has continued since April 1997. However, sea shore survey measurements showed a reversal, which might be an artifact of the large flow of ocean water westward due to the reversal of El Niño, although this phenomenon is not well understood.
Seismicity. Only 633 low-frequency events were recorded during November; 2,843 were recorded in December. During 10-12 and 29-30 November low-amplitude harmonic signals were recorded. Between 12 and 28 November, the pattern of seismicity was characterized by low-frequency events of low amplitude and long duration. A noticeable emergence of moderate and large explosions (1-3 per day between 14 and 20 November) occurred during this period. A sequence of high-frequency events having an average S-P interval of 3.5 s occurred NE of the caldera during 20-25 November. It was not discovered whether these events were from the usual NE focus of earthquakes (which have had an S-P interval of 1-2.5 s). After 29 November the number and amplitude of the events increased.
A marked increase to a daily average of 100 low-frequency events during 5-19 and 29-31 December was associated with more frequent ash emissions. During 20-28 December ~60 events were recorded daily. Short bands of harmonic tremor were recorded during the second week of December and again on the 18th, 22nd, and 27th. Two high-frequency events were located NE of the caldera.
Information Contacts: Herman Patia, Rabaul Volcano Observatory (RVO), P.O. Box 386, Rabaul, Papua New Guinea.
Mild, intermittent Vulcanian activity at Tavurvur
The very slow-moving supply of magma into Rabaul Caldera resulted in mild, intermittent Vulcanian activity at Tavurvur in January. Emissions occurred at irregular intervals a few minutes to several hours apart. Longer intervals between emissions usually resulted in more powerful and voluminous explosions.
As in previous months intermittent small-to-moderate pale gray ash emissions continued, most of them without accompanying sounds. However, on 2, 4, 6-7, 21-23, and 25-27 January, loud vulcanian explosions occurred accompanied by dense ash clouds rising approximately 2,000-3,000 m above the summit. Large ballistic blocks littered the slopes of Tavurvur and small, hot pyroclastic flows traveled down the slopes. There was a shift in wind direction resulting in light ash falls in populated areas.
The recorded seismicity was lower in January than in December (1,413 events, compared to 2,843). There were 18 vulcanian explosions during January. Twenty-eight high-frequency earthquakes occurred located outside the caldera along a NE-trending line extending ~20 km offshore. Most of these events happened during the first two week of January.
Ground-deformation measurements continued to show a slow, inflationary trend. Survey measurement from the center of Rabaul to the tip of Matupit Island (2 km to the W of Tavurvur) showed a maximum inflation of 6 mm for the month. A continually recording GPS site at Matupit showed no significant deformation within the instrument accuracy.
A dry tiltmeter at Matupit showed upward tilting toward Tavurvur of about 12 µrad, while the water-tube tiltmeter at Sulphur Creek (3 km NW of Tavurvur) showed 7 µrad of radial uptilting. Other dry-tilt sites farther away from the center of the caldera showed no significant change.
Information Contacts: Herman Patia, Rabaul Volcano Observatory (RVO), P.O. Box 386, Rabaul, Papua New Guinea.
Small pyroclastic flows following explosions during 15-20 February
Moderate activity at Tavurvur continued during February with quiet, intermittent emissions of pale gray ash rising 600-1,000 m above the summit. Variable NW winds led to light ashfalls at Talwat and Matupit. A short period of more energetic activity during 15-20 February included moderate explosions ejecting lava blocks and dark gray ash. Small pyroclastic flows were generated down the S flank and ash rose to about 2,000 m. Some light ashfall was reported as far south as Kokopo.
Although the caldera was still restless, leveling, tilt, and GPS showed minor deformation with few significant movements during February. Seismicity was much lower than that previous months; low-frequency events totaled 465, compared with 2,843 in December 1998 and 1,413 in January 1999. Twenty-four explosive events were recorded, on 3, 4, 8, 12-18, 20, 21, 23, and 24 February. Only two high-frequency events were detected NE of the caldera, compared with 28 in that direction during January.
Information Contacts: Herman Patia, Rabaul Volcano Observatory (RVO), P.O. Box 386, Rabaul, Papua New Guinea.
Continued ash emission at Tavurvur; low seismicity
Tavurvur crater activity continued small pale-gray ash emissions at long irregular intervals during March and April. No significant changes in ground deformation were measured during this period. There was a slight increase in the rate of ash emission during mid-March. The emissions contained moderate ash content and rose < 1 km above the summit before blowing to the S and SE with fine ashfall downwind. On 22 March a few moderate explosions were accompanied by loud roaring noises. A similar pattern occurred during April, i.e., a steady increase in the rate of ash emission until 22 April with moderate explosions being accompanied by loud roaring noises.
Seismic activity related to the continuing eruptive activity at Tavurvur was much lower; there were 120 low-frequency events in March and 142 in April, compared with 465 in February and 1,413 in January. A total of 15 explosions were recorded through March, whereas only three occurred in April. Five of the six high-frequency events in March were located; one occurred to the W and the rest NE of the caldera. Only three were recorded in April, one to the E and two NE of the caldera.
Information Contacts: Herman Patia, Rabaul Volcano Observatory (RVO), P.O. Box 386, Rabaul, Papua New Guinea.
The active intracaldera cone (Tavurvur) continues mild emissions through June
The mild Vulcanian activity continuing since November 1998 continued through June 1999. With time, the eruption's from Rabaul's Tavurvur cone appeared to be progressively waning in intensity. Still, during May and June several moderate explosions occurred.
Some May and June explosions sent ash clouds 1 km above the summit. The ash clouds drifted NW, some resulted in light ashfall over Rabaul Town. The mild ash-bearing outbursts in June occurred with very long intervals (sometimes 24 hours) between them. Notable outbursts took place on 9 days during the month (3, 5, 6, 9, 13, 15, 16, 17, 19, 23 and 25 June); although many only lasted 2-10 minutes, the last one of the set prevailed for 25 minutes. Typical plumes rose to 500 m high; SE winds typically blew these plumes and fine ash fell, including some on Rabaul Town.
In accord with these visual observations, both deformation and caldera seismicity remained low. Although during May, April, and March there had been 150, 142, and 120 low-frequency earthquakes, respectively, during June there occurred only 38 such earthquakes. The two located earthquakes appeared to the NE of the main ring fault. Anomalously, during the past 2 years there has been an absence of recorded high-frequency earthquakes on the ring fault. Instead, located earthquakes have consistently struck NE of the ring-fault system.
On the 16th a regional earthquake directly E of Wide Bay triggered a 31-cm tsunami. Since then, more than 20 regional events have occurred within a 20 km radius of the initial quake.
Information Contacts: Ben Talai, Rabaul Volcano Observatory (RVO), P.O. Box 386, Rabaul, Papua New Guinea.
Ash eruptions continue; new vent generates ash emissions for eight days
During all of August and until 17 September the mild activity that has occurred at Tavurvur cone since November 1998 continued, consisting only of weak, pale gray ash emissions. These emissions, usually several hours apart, had slightly increased frequency and ash/vapor volume for two periods around 11 August and at the very end of that month. During the reporting interval the volume of ash was small and the ash plumes rose only a few hundred meters above the summit. Three mild explosions occurred on 5, 13, and 15 September and sent dark gray ash clouds to ~1,000 m before they were blown to the NW.
However, between 0915 and 1015 on 17 September, a vent that presumably last erupted in 1941 opened. For about eight consecutive days the new vent produced continuous emissions of dark gray ash clouds, sometimes in puffs. Associated with the ash emissions was the strong odor of sulfur gas. Night observations on 17-18 September showed weak red glow at the mouth of the vent, seemingly associated with the puffs, and weak deep roaring noises were heard. Subsequent to the eight days, the emissions changed to pale gray in color and occasionally to white vapor for short intervals. Three mild explosions occurred on 20, 26, and 28 September; the resulting ash columns rose ~1,500 m and caused significant ashfall on Rabaul Town.
Fluctuating volumes of continuous emissions took place in October from the old 1941 vent that re-opened on 17 September 1999. The emissions fluctuated from very thin white to thick white-gray vapor, and occasionally dark gray ash clouds. The ash clouds rose several hundred meters above the summit and were later blown to the N, NW, and W between 1 and 17 October by variable winds, and primarily to the S and SE after 18 October. Two moderate dark gray ash clouds on 28 and 31 October were released forcefully and rose about 1,500 m above the summit before they were blown NW, resulting in light ashfalls.
The vent that produced the lava flows in 1996 and 1997 (South Vent) showed declining vapor/ash emissions during October. Early in October the vent produced about 4-5 distinct daily ash emissions, but almost none during the last 2-3 weeks. Three mild explosions of dark gray ash columns on 7, 11, and 18 October rose ~1,000 m above the summit before they were blown to the N and NW, causing fine ashfalls. The odor of sulfur was at a very reduced level compared to that during the second half of September, and by 16 October was almost unnoticeable.
The number of low-frequency earthquakes increased to 235 in September over the 165 in August, exceeding the numbers in May (159), June (35), and July (89). A total of 40 high-frequency events were recorded in August, the highest for any month this year, whereas only four occurred in September, and only two of which had epicenters NE of the caldera. Twelve explosions were detected seismically in August compared with three each in June and July. There were a total of 617 low-frequency events, a further increase, in October. All these events originated from the summit of Tavurvur. The bigger events were associated with summit emissions, as observed in the past. Only four high-frequency events were recorded. None of them were big enough to be located, but from the sequence of arrivals from stations that recorded them, they appeared to originate from the NE, outside of the caldera.
Measured deformation of the ground surface within the caldera remained slight as it has since February, although ~5 µrad of tilt accumulated at the water-tube tiltmeter at Sulphur Creek, before the two periods of increased activity in August. Overall, ground deformation remained low with indications of very low levels of long-term caldera resurgence.
Information Contacts: Ima Itikarai, Kila Mulina, and Steve Saunders, Rabaul Volcano Observatory (RVO), P.O. Box 386, Rabaul, Papua New Guinea.
Mild Vulcanian eruptions continue from Tavurvur
The mild Vulcanian activity at Tavurvur continued at a low level through November and December. During 1-14 November the emissions from the 1941 vent consisted mainly of small volumes of thin white vapor. Occasionally, small-to-moderate volumes of pale gray ash clouds were produced. In the early hours of 15 November, the activity changed as continuous, forceful emissions of thick, light-to-dark gray ash clouds became paramount. This pattern of activity was sustained with minor fluctuations until the 18th, accompanied by low booming and roaring noises. Emissions came from the 1941 vent and from a smaller vent on the W flank of the 1995 vent, the latter apparently becoming active on the 15th after a long period of quiescence. Also during this three day period, NW winds blew the ash clouds SSE to heights of 1-1.5 km. After the 18th, except for a mild explosion on 30 November, the low-level activity noted at the beginning of November prevailed once again and continued throughout December until the 30th when several belches of dark gray ash clouds were produced. Once again, these were blown to the SE. The 1995 lava-producing vent remained quiet.
Seismic activity was low throughout both months. About 459 low-frequency (LF) earthquakes were recorded in November but more than half of these (244) were recorded during the anomalous period of 15-18 November. Only 64 LF earthquakes were recorded in December. Both months had lower counts than the 617 recorded in October. Most of the LF earthquakes were associated with Tavurvur's summit activity of ash emissions.
Five high-frequency earthquakes were recorded in November and 11 in December. They were too small to be located in December, but the sequence of arrival times from the few stations that recorded them indicated all but two were from the NE, with one each from the E and SE. Ground deformation measurements showed a slight deflation during November with no significant change in December.
Information Contacts: I. Itikarai, H.Patia, and F. Taranu, Rabaul Volcano Observatory (RVO), P.O. Box 386, Rabaul, Papua New Guinea.
During early 2000, occasional ash clouds and the 1995 vent reactivates
After the emissions of dark gray ash clouds from the 1941 vent on 30 December 1999, through 16 January 2000 activity consisted mostly of thin white and grayish clouds. Occasional pale gray to dark gray ash clouds of moderate volumes were interspersed among the ongoing thin white vapor emissions.
The 1995 lava-producing vent reactivated on 16 January at 1532 with emissions of dark gray ash clouds until the 18th, before going quiet again at month's end. The initial emissions on 16 January occurred frequently (4/minute) during the first 30-45 minutes before decreasing to 1/minute thereafter. The ash clouds rose ~500-1,000 m above the summit and were later blown by high-altitude winds to the N and low-altitude winds to the SE, resulting in ashfalls in those directions.
Seismicity associated with the ongoing activity at Tavurvur was very low in January. A total of 66 low-frequency events were detected, of which most were associated with surface activity. The only harmonic tremor was recorded on the 30th. Nine high-frequency events were recorded during the month. Only two of these events which originated NE of the volcano, were located outside of the caldera. The other seven were too small to locate; however, their arrival times indicated an azimuth of NE.
The eruptive activity remained low throughout February. Gentle emissions of very thin volumes of white vapor continued for most of the period. However, between 7 and 14 February small volumes of pale gray ash clouds were produced at irregular intervals, and seismicity fluctuated. Again between 21st and 22nd small amounts of white-to-brownish ash clouds were produced. Most of the ash emissions during both periods rose to several hundred meters above the summit before they were blown to the SE and occasionally to the N, NW, and SW by variable winds. Very fine ash fell in the same areas.
Event trigger counts were similar to December 1999 and January 2000, with a total of 78 low-frequency events detected. Most of these were associated with the summit activity of Tavurvur. Three high-frequency earthquakes were detected in February. Two were located to the S and NE, outside of the caldera. The other was too small to locate, however, arrival times on the few stations that detected it indicated a NE azimuth.
A slight increase in ash emission associated with sub-continuous non-harmonic tremor was observed in March. Bands of such tremor were recorded on 8, 14-20, and 30-31 March. The tremor occurred only once each day, but at different times of the day. The duration for each episode of tremor ranged from an hour to about 5 hours. During the corresponding period of 15-20 March, Tavurvur's 1995 vent produced occasional gentle puffs of thick gray ash clouds that were blown SE by low-altitude winds and later to the W by high-altitude winds. Similar ash emission was observed on 31st. On that day the ash clouds rose only a few hundred meters at the highest and were later blown N and NW. The 1941 vent remained quiet, releasing only very small volumes of thin white vapor.
March's low-frequency earthquakes continued to fluctuate around normal background. Trigger counts for March were 90. Most of these events were associated with the summit activity of Tavurvur. Seven high-frequency earthquakes were detected in March. Three were locatable. The others occurred outside of the caldera. Ground deformation measurements by the electronic and water-tube tilt instrumentation showed an inflationary trend which began in late February.
Information Contacts: I. Itikarai, D. Lolok, K. Mulina, and F. Taranu, Rabaul Volcano Observatory (RVO), P.O. Box 386, Rabaul, Papua New Guinea.
Two periods of increased summit explosive activity in June
This report covers the period April-June 2000. During mid-April, the inflationary trend that began in February 2000 tapered off (BGVN 25:03). However, the realtime GPS system, along with electronic and water tilt data, continued to indicate a long-term inflation trend.
Emissions from the 1941 vent were characterized by thin, white vapor throughout the months of April and May. The 1995 vent was free of vapor emissions except for gentle puffs of grey ash-clouds on 5, 14-16, and 28-30 April, and 5 and 30 May. During April, these ash clouds rose several hundred meters above the summit before being blown to the W, NW, and SW. Towards the end of May, the general haze produced began to contain a weak ash component and there was a strong smell of SO2.
In April, a single high-frequency earthquake was recorded and located NE of the caldera wall. Low-frequency earthquakes continued to occur throughout April and were related to the eruptive activity associated with Tavurvur (figure 35). The number of these earthquakes fluctuated within background levels. There was a significant decrease in the number of trigger counts from 78 in February and 90 in March to 28 in April. The number rose again in May to 64. However, it should be noted that these trigger counts include only events that trigger two or more stations. The count that includes non-triggered events (seismic events that do not trigger more than one station) is much higher. On 15 and 30 April, bands of sub-continuous, 2-3 hour long, non-harmonic tremor were recorded.
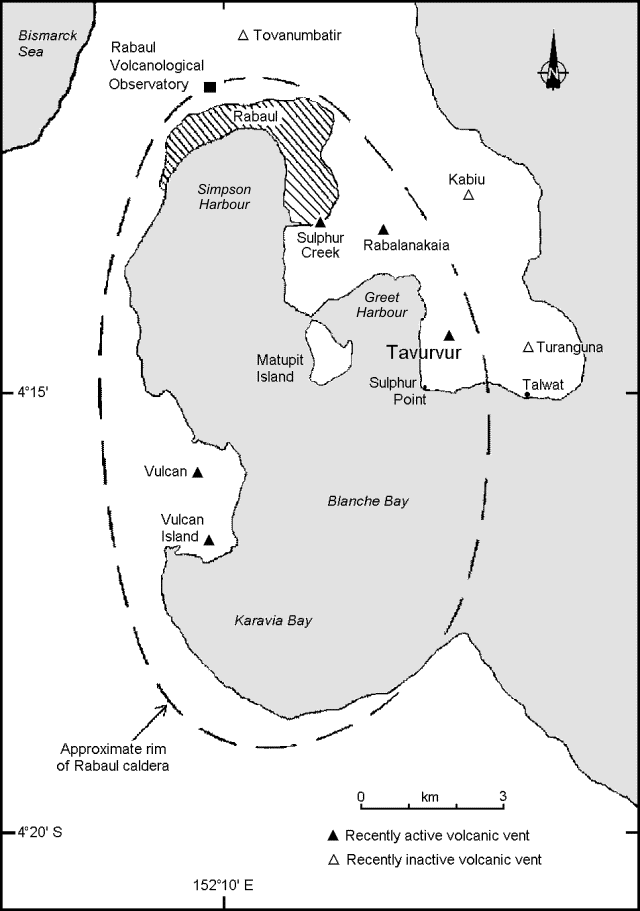 |
Figure 35. Map of Rabaul caldera showing locations of volcanic vents, selected towns, and features (modified from Almond and McKee, 1982). |
For most of May, seismic activity was low. The exception was a ~M 4.8 earthquake that occurred at 1649 on 10 May and was centered 30 km NE of Rabaul. This produced several aftershocks; a total of 95 high-frequency triggered events were recorded on this date. Because of the proximity of these events to the established 'NE earthquake zone,' which is associated with ongoing eruptive activity, there was an expectation that higher levels of summit activity would occur at Tavurvur.
In June, 13 high-frequency events were recorded. Most originated NE of the Rabaul caldera. The S-P interval for these events was 1-4 seconds. Earthquakes occurring in this region have apparently been associated with the ongoing eruptive activity that began on 28 November 1995. A total of 185 low-frequency triggered events were recorded in June. Most of these events were related to explosions during two episodes of ashfall, one on 5 June and the other on 28 June. In addition, quasi-monochromatic volcanic tremor with durations ranging from a few minutes to a few hours were recorded during these periods. An increase in low- frequency non-triggered events was noted before each of the two episodes.
The 5 and 28 June episodes were characterized by moderate ashfall that emanated from Tavurvur. The first episode began on 5 June with a Vulcanian eruption that deposited lithic blocks beyond the crater rim. Through 8 June there was moderate-to-heavy ashfall. On 6 June at 1150 a loud explosion occurred at the 1941 vent. This was followed by increased explosive activity until the afternoon of 7 June when explosions occurred at 30-minute intervals. The explosion clouds contained moderate amounts of ash and rose to about 1.0-1.5 km above the summit. These ash clouds were blown such that they deposited ash towards the N, NE, and NW where Rabaul Town is located. By 8 June, the explosions had subsided to occasional emissions of light-to-moderate white vapor. For the following two weeks, the areas to the N, NE, and NW were continuosly blanketed in a thin fog of white vapor from Tavurvur.
At 0527(?) on 28 June, another explosion from the 1941 vent triggered the second period of light-to-moderate ashfall. The explosion was followed immediately by a dark grey ash cloud that rose to 1.5 km above the summit before being blown to the N and NW. Over the next two days, further ash clouds were produced that attained heights of several hundred meters. Discrete explosions, occurring at long intervals, marked the end of this period of activity. The last explosion occurred on 30 June.
Beginning in early May, electronic and wet-tilt measurements showed a downward tilt with a total deflation of ~9.0 µrad throughout May and June. However, an inflation of 4.0 µrad was recorded before the activity of 5-8 June and 5.5 µrad was recorded before the 27-30 June activity.
The low-lying Rabaul caldera forms a sheltered harbor once utilized by New Britain's largest city Rabaul prior to the 1994 eruption, which forced the abandonment of the city. Tavurvur and Vulcan are two eruption centers within the Rabaul caldera complex. These volcanoes have had virtually simultaneous eruptions in 1878, 1937, and 1994.
Information Contacts: Ima Itikarai, David Lolok, Herman Patia, and Steve Saunders, Rabaul Volcano Observatory (RVO), P.O. Box 386, Rabaul, Papua New Guinea.
Ashfall during August-October most abundant since 1995
This report, which covers the period from August through October 2000, notes that Vulcanian eruptions prevailed at Tavurvur during 29 August through October 2000. These eruptions bore far more ash than typical. Substantial amounts of ash blew towards the city of Rabaul and other inhabited areas. During the second and third weeks of September the amount of ash falling reached a maximum since the current eruption began on 28 November 1995.
On 2 and 9 August eruptive plumes contained ash. At other times during August vent activity was relatively low, consisting only of small volumes of thin white vapor. The 29 August eruption changed this pattern.
Although the main phase of the 29 August eruption began at 1158, it was preceded by a series of weak explosions yielding dark gray ash plumes. After these less-forceful explosive events ended, moderate volumes of dark gray ash clouds erupted. Subsequently, and through 8 September, the eruption pattern was comprised of interchanging periods of either continuous, moderate-volume ash emissions or relatively subdued ash-cloud emissions typically white to pale gray in color.
At about 2200 on 8 September, the eruption became more intense, frequent, and discrete explosions producing thick billowing dark ash clouds. Throughout the rest of September, periods of sub-continuous ash emissions occurred. After 21 September, however, discrete explosions and sub-continuous ash emissions declined and continued at a subdued level. Throughout September, observers saw incandescent lava fragments occasionally ejected. Residents saw these ejected fragments more frequently after the onset of explosive activity on 8 September, and around this time the residents regularly noted audible noises associated with venting.
Explosions every few minutes produced sub-continuous moderate to heavy ash emissions that continued in October. Some of the larger explosions showered the N and NE flanks of the volcano with bombs. At night these were seen to be incandescent (red to dull orange). On inspection most projectiles were lithic blocks, but a minority were in a plastic state with some bread-crust surfaces. Jet-aircraft-like roaring from the vent was common and some of the larger explosions could be heard at distances of over 15 km. Toward the end of October, the explosions were less forceful, but contained increased volumes of solid fragments.
All activity during the reporting period appears to have been confined to the 1941 vent; the 1995 crater issued only white vapor. The current phase enlarged the vent as a result of explosive activity. The N crater was breached, forming a saddle-like depression in the rim reaching about 15-20 m lower than the originally symmetrical and level line comprising the ridge.
During the first 2-3 weeks of September ash clouds rose as high as 2 km above the summit. As previously noted, many plumes blew N and NW to drop ash on inhabited areas. As a result, many Rabaul businesses were adversely affected and, by the end of the September, some had moved ~40 km SE of Rabaul to the settlement of Kokopo. The major health center in Rabaul town was also affected and patients with respiratory problems were moved to another health center near Kokopo. During early October the ashfalls caused patients to undergo evacuation from Nonga Hospital (5 km NNW of Rabaul). Toward the end of October the annual change in the trade winds caused less ashfall in Rabaul town; frequent heavy rains around this time also provided relief from suspended dust.
Seismicity correlated fairly directly with behavior observed at the summit, and accordingly, seismic activity remained relatively low until the onset of the eruption. The total number of low-frequency earthquakes recorded during August was 208, with the largest daily number of 35 on 30 August. This monthly total was slightly higher than that in July. During the main episodes of ash eruption between 29 August and 8 September, seismicity was characterized by bands of non-harmonic volcanic tremor. Bands of volcanic tremor with reduced amplitude were recorded again during 17-19 September and, until the end of the month, seismicity included sporadic short-duration tremor associated with sub-continuous ash ejections.
For August and September, respective high-frequency earthquakes totaled 17 and 8; all occurred NE of Rabaul caldera. The time difference between S- and P-wave arrivals for these events (S minus P) was 3-6 seconds. Since 28 November 1995, strings or significant numbers of high-frequency NE earthquakes have correlated with greater summit activity at Tavurvur. The time interval from the onset of the high-frequency earthquakes to greater summit activity ranged between one week to a few months. Rabaul's last major NE earthquake sequence occurred during May-June 2000 (see BGVN 25:07).
During September a total of 3,661 low-frequency earthquakes were recorded. This total includes explosion earthquakes (with air phases). When like earthquake records were compared, the September record attained the highest total since May 1996 (when 3,993 such earthquakes were recorded). September's highest daily total, 228, was recorded on 11 September; the lowest total, 3, was recorded on 4 and 7 September, occurring on days when tremor dominated the seismicity. October seismicity included 2,544 low-frequency earthquakes.
Ground deformation measurements from electronic and wet tiltmeters showed some caldera inflation from July 1999 to April 2000. After April, the trend changed to show deflation until about August 2000. Tiltmeters registered slow inflation during the first few days of September, followed by subsidence, and then stable conditions on 8 September. Some deformation-monitoring sites in the area of Tavurvur seemed to indicate a deflationary trend starting in late September and continuing through October.
Information Contacts: Ima Itikarai, David Lolok, Herman Patia, and Steve Saunders, Rabaul Volcano Observatory (RVO), P.O. Box 386, Rabaul, Papua New Guinea.
Intermittent ash eruptions continue during January-May
This report covers the period from November 2000 through May 2001. Activity at Rabaul was relatively low through this period until 14 March, when low-frequency earthquakes resumed and continued to increase in number and amplitude throughout that month. These earthquakes were apparently precursors to an ash eruption at Tavurvur on 2 April after several months of relative quiet.
Occasional ash-laden clouds resulting from mild explosions occurred in January and February. White vapors were released in varying amounts from Tavurvur. Two large explosions occurred on 12 and 26 January producing a dark gray, billowing ash cloud that rose to ~1,000-2,000 m above the summit before dispersing W and NW. The explosions showered the flank of the volcano with rock fragments and deposited significant amounts of ash on Rabaul Town. For short periods during these months H2S was smelled downwind of Tavurvur.
Seventeen high-frequency earthquakes were recorded in March, only five of which were determined as having originated from NE and ESE of the caldera. No high-frequency earthquakes have been recorded on the once-active ring-fault seismic zone since 1995. Between February and the end of March, GPS recorded ~1.5 cm of uplift in the central part of the caldera, while an electronic tiltmeter measured ~3-4 µrad of inflation.
The caldera had previously subsided about 4 cm on 16 November 2000, associated with earthquakes N of Rabaul. According to the UN Office for the Coordination of Humanitarian Affairs (OCHA), two earthquakes, M 7-8, occurred in Papua New Guinea about 3 hours apart on 16 November. The first earthquake was ~50 km N of Rabaul and just S of New Ireland. The second earthquake struck ~100-150 km from Rabaul and N of New Ireland, near the Lihir, Tabar, and Tanga Islands. Both earthquakes occurred about 50 km below sea level. Tsunami of 1-2.5 m height caused damage on New Britain, New Ireland, and Bougainville, leaving thousands homeless; no casualties were reported. At least four other M ~6.5 aftershocks were reported in the following days. According to the BBC, recent tectonic activity has caused subsidence of coral islands between New Ireland and New Britain. As many as 40,000 people may need to be evacuated.
At 1300 on 2 April the number and amplitude of the low-frequency earthquakes increased again, culminating in the first ash clouds between 2100 and 2200. Figure 36 shows an ash eruption on 4 April 2001. Similar low-frequency earthquakes were noted a few days before the 28 November 1995 eruption. High-frequency earthquakes, another good indicator of eruptive activity, continued to occur on the NE side of the volcano during April 2001. Other parameters indicating signs of likely renewed eruptive activity were 3-4 months of slow inflation in the central part of Rabaul Caldera, GPS measurements that showed ~3-4 cm of uplift, and tiltmeter measurements near the GPS benchmark and ~2 km from Tavurvur that also indicted inflation. The smell of sulfuric gas was noted occasionally.
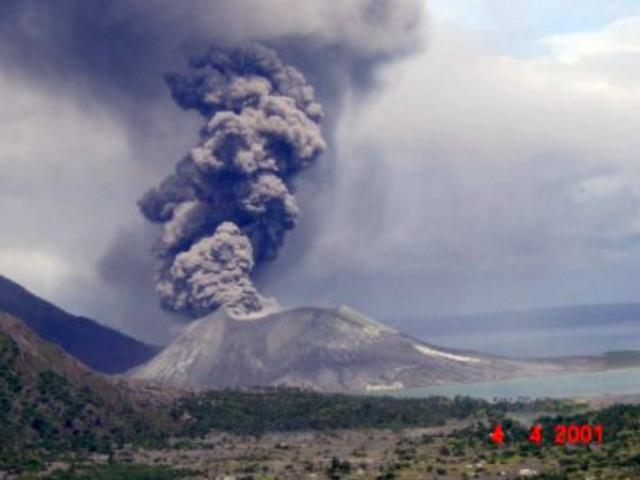 |
Figure 36. Ash eruption on 4 April 2001 at the Tavurvur cone. This photo was taken looking from the NW and shows the SE side of the cone. Courtesy of RVO. |
From 2 to 24 April Tavurvur's ash emissions fluctuated between white to pale-gray ash clouds and sub-continuous ejection of pale- to dark-gray ash clouds. Beginning at about 1400 on 25 April, activity changed to short explosions that produced white to pale-gray mushroom-shaped ash columns and were usually accompanied by roaring noises. During the month ash clouds rose from a few hundred to ~1,000 m above the summit area. Variable winds blew the ash N and NW. Similar eruptive activity continued through the end of April.
During April, 1,089 low-frequency (LF) earthquakes were registered by the trigger system. Daily LF totals ranged between 0 and 291. High LF totals occurred on the 25th (172), 26th (291), 27th (228), and 28th (212). This period corresponded to the time when the mode of Tavurvur's eruptive activity changed from occasional sub-continuous ash cloud emissions to frequent, short-duration ash cloud expulsions. The totals for April 2001 were substantially higher than for the previous months of January (22), February (31), and March (13). During April, short duration, non-harmonic volcanic tremors were also recorded and were usually associated with the sub-continuous ash cloud emissions. On the other hand, during April the system recorded only six high-frequency earthquakes, fewer than in January (15), February (8), and March (17). Moreover, in April, half of the high-frequency earthquakes struck to the NE and outside the caldera.
During May, Tavurvur emitted pale gray to white ash clouds, sometimes accompanied by 0.5-2 minute periods of roaring. The ash clouds typically reached as high as several hundred meters above the vent. During the first half of May incandescent explosions were observed at night, but towards the end of May these explosions lessened in frequency and vigor. The roaring noises also lessened. On 30 May the roaring noises were replaced by stronger, discrete explosions. These produced dark ash clouds that rose to 1-1.5 km above the vent. In general, intra-caldera seismicity was low in frequency and associated with explosions. Almost 2,000 seismic events were recorded.
The unambiguous inflationary trend observed over the previous six months slowed in early May, and a period of relative stability occurred until the end of the month. The start of the darker emissions heralded a period of small-scale rapidly fluctuating vertical movements, but no overall inflationary or deflationary trend predominated.
Information Contacts: Ima Itikarai, Rabaul Volcano Observatory (RVO), P.O. Box 386, Rabaul, Papua New Guinea.
Ash columns to 1.5 km, ashfall, and tremor during June and August
This report covers activity at Rabaul from June to October 2001. Repeated ash columns appeared during June over Tavurvur, ejected both noiselessly and associated with loud roaring and rumbling noises. The activity was dominated by strong discrete explosions during 1-2 June that showered rock fragments on Tavurvur's flanks. At night, red incandescent lava fragments were visible. The resulting dark, billowing ash columns rose rapidly to 1-1.5 km above the summit before strong winds dispersed them NNW. Significant downwind ashfall affected surrounding areas, including the town of Rabaul. Shock waves from the larger explosions caused windows and doors to rattle.
For several subsequent days, activity was characterized by occasional ash cloud emissions and a handful of moderate explosions that sent dark billowing ash clouds rising ~1 km above the summit. On 6 June, the activity changed to frequent pale-ash clouds, but the roaring and rumbling noises resumed. The noises ceased around 14 June but discrete, moderate explosions continued to send thick, dark ash columns ~1 km above the summit. The larger explosions again showered lava fragments on the N flanks. During 18-19 June, the activity changed to sub-continuous ash eruptions and fewer discrete explosions.
On 20 June a quiet period began, marked by emissions of thin, white vapor. This quiet continued during July and most of August. Mild ash eruptions began on 28 August following an increase in the number and magnitude of low-frequency earthquakes a few days earlier. Subsequently, activity remained low throughout September and October. Small-to-moderate amounts of steam were emitted from the active vent, and low-frequency earthquakes continued to occur, but their number and size were relatively low. No significant ground deformation was detected.
The seismicity associated with the June activity (575 low-frequency events) was about three times less than that of May (over 2,000) (BGVN 26:06). The explosive pattern in June was similar to May, but at a reduced level. Collectively, 27 explosions occurred on 1, 4, 14-17, and 19 June, but three-fourths of these occurred during 14-17 June. Volcanic tremors were recorded on 8, 12, and 15 June. Four high-frequency earthquakes were recorded during the month; one was located outside the caldera while the other three were too small to be located. Ground-deformation measurements were relatively low throughout June.
Reference. Lauer, S.E., 1995, Pumice and ash: a personal account of the 1994 Rabaul volcanic eruptions: Quality Plus Printers Pty. Ltd., Ballina, Australia, 80 p.
Information Contacts: Ima Itikarai and F. Taranu, Rabaul Volcano Observatory (RVO), P.O. Box 386, Rabaul, Papua New Guinea.
M 5.6 earthquakes during March 2002 not related to volcanism
After explosions at Tavurvur during June and August 2001, activity decreased through October. During February-March 2002, the Rabaul Volcanological Observatory (RVO) reported that volcanic and seismic activity remained low, with some low-frequency earthquakes recorded. The active vent emitted weak-to-moderate amounts of white vapor. Ground deformation measurements showed no significant changes.
During mid-February, moderate-to-strong gas emissions drifted to the SE and E and damaged vegetation on the adjacent cone South Daughter, suggesting the presence of volcanic gases like sulphur dioxide within the emissions. The last ash-producing activity from Tavurvur occurred in early September 2001. RVO reported that the chance of mild ash activity occurring in the near future is very remote.
A few tectonic earthquakes were felt during mid-February. They were located 35-80 km NW and SW from the Rabaul-Kokopo area. An M 5.6 tectonic earthquake was felt at 0650 on 17 March. The earthquake was located offshore in the Pomio area. On 21 March, some high-frequency earthquakes occurred NE of Rabaul. Since 1995, these high-frequency earthquakes have been associated with eruptive activity at Tavurvur. During mid-March, some earthquakes were felt, unrelated to volcanic activity, that had magnitudes of 5.3-5.6.
Information Contacts: Ima Itikarai, Rabaul Volcano Observatory (RVO), P.O. Box 386, Rabaul, Papua New Guinea.
May-June quiet; late 2002 explosions send ash to ~4 km altitude
During February-March 2002, the Rabaul Volcanological Observatory (RVO) reported that volcanic and seismic activity remained low, with some low-frequency earthquakes recorded. The active vent emitted weak-to-moderate amounts of white vapor, and ground-deformation measurements showed no significant changes (BGVN 27:03).
RVO reported that Tavurvur was quiet during 20 May-2 June. The active vent continued to release variable amounts of white vapor. Occasionally, the emission changed to very thick volumes of white vapor. The smell of SO2 was evident on some days. Seismic activity remained low and a few small, low-frequency earthquakes were recorded beneath Tavurvur. Ground-deformation measurements showed a small amount of inflation, however, the long-term trend showed no significant changes.
On 20 October at 1347 an eruption took place at Tavurvur cone. News reports indicated that rocks were thrown 700 m from the summit, and no lava was erupted. They also noted that the eruption produced a thick, dark, ash plume that rose to ~3 km before dispersing to the N and NW. No ash was visible on satellite imagery due to meteorological clouds in the vicinity. News reports also stated that ash caused Tokua airport flights to be suspended on 22 October. On 23 October ash was visible at ~3.6 km altitude. The airport reopened on 27 October, with two flights permitted during the day. Reopening the airport was possible because erupted ash ceased to blow towards it.
Several small explosions occurred after the 20 October eruption, sending ash clouds to 4 km altitude. On 28 October RVO stated that a major increase in volcanic activity seemed unlikely. Low-level activity continued in early November. Ash emissions occurred at long, irregular intervals and associated ash remained below ~3 km altitude.
Very heavy ash emission was observed on 24 November. A low-level plume was produced, and no ash was visible on satellite imagery. Observations during 20-26 November revealed that the ash content in the emissions was generally decreasing, and erupted ash clouds remained below ~1.5 km altitude. The intensity of ash emission changed on 30 November from very slow to slightly forceful, and the interval between eruptions increased. Occasional moderate eruptions produced ash clouds that reached heights of 1-1.5 km above the crater. Two moderate explosions on the night of 30 November emitted visible incandescent lava fragments that showered the volcano's N and NE slopes and ash plumes that rose 100-1,200 m above the crater. During 29 November-1 December, ash plumes were blown to the E and SE. Seismicity was at a low-to-moderate level, and the signature of events changed from short to long duration. Ground deformation measurements lacked significant changes, however, the electronic tiltmeter showed slow inflation.
On 3 December RVO reported that the eruption pattern varied between sustained ash emissions lasting 1-2 minutes to discrete short duration ash emissions lasting less than 1 minute. Ash plumes ascended several hundred to 1,200 m above the summit. On the evening of 3 December ash plumes were blown N and NW, causing fine ashfall in parts of Rabaul Town.
During late November through at least 16 December, the eruption was characterized by slow, convoluted ash plumes that rose several hundred meters above the summit. There was a small amount of ash in the plumes, and minor ashfall affected areas close to the cone. Seismicity was generally at low-to-moderate levels. There was a ~2.5-minute-long period of harmonic tremor on the morning of 11 December accompanied by a pulsating noise from the volcano. Another period of harmonic tremor occurred on 13 December. Ground-deformation measurements from real-time GPS and electronic tilt showed no significant changes.
During mid-December, although the NE vent was still dominant, some plumes rose from the W side of the N crater. The eruptions at Tavurvur continued as of 16 December, with light gray or brown plumes with little ash rising several hundred to more than a thousand meters above the summit. Winds from the SE led to moderate ashfall in Rabaul, although RVO reported that variable winds made it difficult to be specific about which areas were being affected by ash.
Information Contacts: Ima Itikarai, Rabaul Volcano Observatory (RVO), P.O. Box 386, Rabaul, Papua New Guinea; Darwin VAAC, Bureau of Meteorology, Northern Territory Regional Office, PO Box 40050, Casuarina Northern Territory 0811 Australia (URL: http://www.bom.gov.au/info/vaac/); Reuters; Pacific Island Report.
Continued ash eruptions from three vents at Tavurvur
During mid-December 2002 through early February 2003, eruptions at Tavurvur continued from three vents at different times. The eruptions were characterized by slow, thick convoluted ash plumes occurring at irregular intervals and rising about several hundred to thousands of meters above the summit. Occasionally they became forceful. Throughout the report period light to pale gray ash plumes drifted in various directions, resulting in ashfall in the town of Rabaul, Matupit Island, Malaguna village, and other areas. During 20-27 January ash emissions were associated with discrete short-duration seismic events and slightly longer duration events. The former event types were pronounced during 20-27 January, but on 26 and 27 January seismicity changed to the low-amplitude medium-to-long duration type.
Generally, the seismicity fluctuated at low-to-moderate levels. A period of harmonic tremor was recorded on the morning of 18 December 2002. That day, the Rabaul Volcano Observatory (RVO) reported that the gaps between emissions seemed to have lengthened over the previous 24 hours. During 19-20 December, occasional larger explosions showered the flanks with rocks. Following the explosions ash-poor plumes were gently emitted from the whole area of the Northern Crater. During 20-23 December there was a slight increase in the number of volcanic earthquakes due to more ash emissions. The increase in volcanic earthquakes tapered off over the next few days.
Ground deformation measurements from real-time GPS showed no significant changes. On 24 January RVO reported that the electronic tiltmeter had been showing a slow inflation during the previous 2 months. That trend ceased by 27 January, when ground-deformation measurements from real-time GPS changed to show an inflationary trend through 2 February. Long-duration, low-amplitude earthquakes occurred through at least 10 February.
MODVOLC Thermal Alerts, 2001-2002. During 2001 and 2002, MODIS alerts occurred only during April-September 2001 and June-December 2002. These anomalies were always represented by a single alert-pixel, except for 26 May 2001, 4 July 2001, and 22 October 2002, which each had two alert-pixels. The maximum alert ratio was on 4 July 2001 when it reached -0.26. The center coordinates of all the alert-pixels plot within 1 km of each other, in a cluster centered ~1 km W of Tavurvur (figure 37), which is the only site of known activity during this period. This high degree of repeatability offset from the likely seat of the anomaly at the summit vent suggests a systematic error in geolocation.
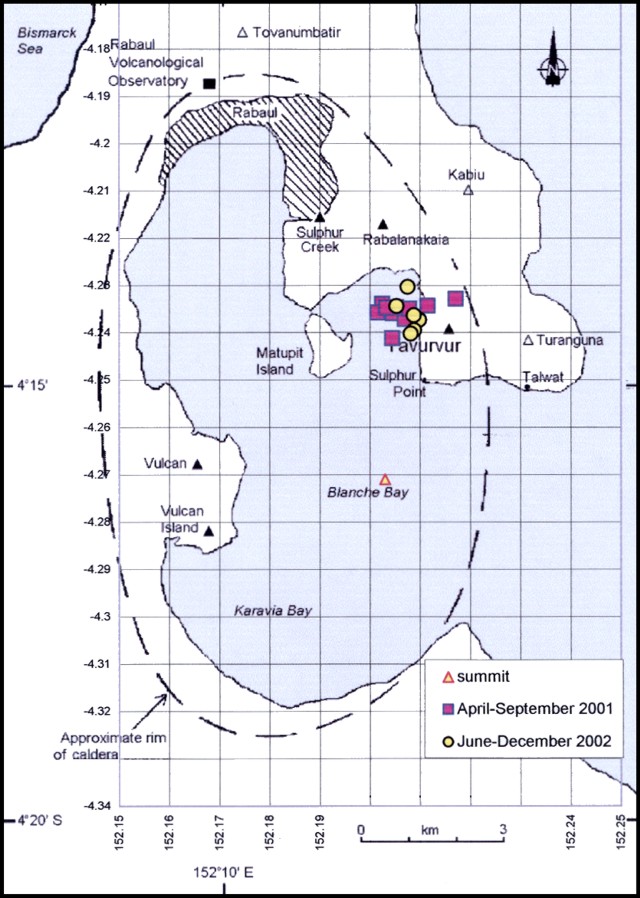 |
Figure 37. Locations of alert-pixels at Rabaul during 2001-2002. Base map from BGVN 25:07 (modified from Almond and McKee, 1982). Courtesy of Diego Coppola and David Rothery, The Open University. |
The first alert was detected on 26 April 2001, and can be related to a change in activity on Tavurvur from occasional sub-continuous ash emissions to frequent, short-duration ash expulsions on 25 April (BGVN 26:06). From 21 May to 2 June MODIS detected a series of anomalies characterized by a single pixel (two pixels on 26 May) with a low alert ratio averaging -0.774. For this period RVO reported incandescent explosions that lessened in frequency and vigor towards the end of May but picked up again on 30 May when explosions produced dark ash clouds that rose to 1-1.5 km above the vent. On 1-2 June activity was dominated by strong discrete explosions. At night, red incandescent lava fragments were visible (BGVN 26:10). On 4 July 2001 MODIS detected a moderate anomaly coincident with Tavurvur cone, characterized by two alert-pixels with a maximum alert ratio of -0.263. The anomaly was much smaller on 6 July. Reports by RVO (BGVN 26:10) indicated a quiet period from 20 June through July and most of August marked by emission of thin, white vapor. Activity remained low throughout September and October (BGVN 26:10). MODIS detected a single alert-pixel on 17 September, possibly corresponding to the last ash-producing activity in early September 2001.
The next MODIS alerts were in 2002 on 14 June, 19 September, 22 October, 21 November, and 25 December. These were single pixels except for the 22 October anomaly, which was 2 pixels in size. This may represent the aftermath of a large explosion on 20 October that produced a thick, dark ash plume that rose 3 km (BGVN 27:11).
Reference. Almond, R.A., and McKee, C.O., 1982, Location of volcano-tectonic earthquakes within the Rabaul Caldera: Geological Survey of Papua New Guinea Report 82/19.
Information Contacts: Ima Itikarai, Rabaul Volcano Observatory (RVO), P.O. Box 386, Rabaul, Papua New Guinea; Diego Coppola and David A. Rothery, Department of Earth Sciences, The Open University, Milton Keynes, MK7 6AA, United Kingdom.
Ash eruptions from Tavurvur continue through March
Eruptions at Tavurvur continued to occur throughout January-March 2003. The eruptions were characterized by forceful and convoluted, sub-continuous, light to pale gray ash cloud emissions at irregular intervals. The following was provided by the Rabaul Volcano Observatory.
Activity during January 2003. During the first several days of January (except the 4th), activity was similar to late December 2002. The eruptions consisted of sub-continuous ash emissions occurring at intervals ranging from a few minutes to ~10 minutes. Many of the ash emissions were sustained for 1-2 minutes. On the 4th, activity was at a low point, shown by the fewest ash emissions of the month. Between 8 and 17 January, the pattern of eruption changed slightly to a mixture of events. The sub-continuous ash emissions persisted, but forceful emissions began as well, although not in significant numbers. A complete change in the pattern of eruptive activity began on the 18th. The sub-continuous ash emissions reduced significantly and the sharp forceful emissions became more prominent. They occurred at very short intervals of 2-4 minutes. This pattern of activity was maintained until the 26th. A lot of the forceful emissions between 20 and 26 January were accompanied by low roaring noises. Noises were also heard on the 7th. After 26 January, the magnitude of the forceful emissions eroded and activity changed back to sub-continuous ash emissions at slightly longer intervals. This trend of summit activity continued until the end of the month.
Ash plumes from the eruptive activity rose variably in height. Those from the forceful emissions rose to a maximum of about 1,500 m, while ash plumes from the sub-continuous emissions rose to several hundred meters above the summit. Variable winds blew the ash plumes to the E and SE (1-14 and 22-31 January), and N and NW (15-21 January). Rabaul Town and villages that are located N and NW from Tavurvur had fine ashfall between 15 and 21 January. The S and SE drifting ash fell mainly in the sea; however, very fine specks of it fell on Cape Gazelle including the nearby Tokua Airport, ~20 km from Tavurvur.
Seismic activity reflected the summit activity. Both the sharp forceful and the sub-continuous ash emissions generated seismic waves characteristic of their nature. Seismic waves associated with the forceful emissions had greater amplitudes reflecting greater energy. Average duration of this type of event was about 40-50 seconds. On the other hand, events associated with the sub-continuous ash emissions had lower amplitudes, and their duration ranged between one and several minutes. Only one volcano-tectonic earthquake was recorded.
During the month ground-deformation measurements showed deflation. Real-time GPS measurements showed 5-8 mm of deflation. The electronic tiltmeter showed a few microradians of down-tilt towards the perceived uplift center SE of Matupit Island and SW of Tavurvur.
Activity during February 2003. Forceful ash emissions were observed in February, but not as abundantly as in January. In February, ash emissions were slightly more frequent during the first few and last few days of the month. The emissions occurred at intervals of 4 and 10 minutes. The longest duration for an ash emission during these periods was about 4-6 minutes. Between 5 and 24 February activity fluctuated, and ash emissions occurred at intervals of several minutes. The longest duration for an ash emission during this period was about 15 minutes. This does not necessarily imply that the amount or volume of ash contained in the emissions was consistent throughout the entire duration of emission. Rather, there was higher ash content in the initial stages of the emissions, which faded thereafter to white to pale gray emissions with very little ash content.
Plume heights were similar to those in January. During the month ash plumes were blown mainly to the E and SE, and occasionally to the SW. On 3 and 4 February, some ash plumes drifted N and NW, resulting in fine ashfall in Rabaul Town and nearby villages farther downwind.
Seismic activity was dominated by the long-duration, low-amplitude, tremor-type events, associated with the convoluted, sub-continuous ash emissions. The duration of these events ranged between 2 and 19 minutes. Only one high-frequency, volcano-tectonic earthquake was recorded.
Real-time GPS measurements fluctuated in February. During the first half of the month, measurements showed an inflationary trend. This is a rebound from the month-long deflationary trend observed in January. During the second half of February, movements changed to show deflation. The electronic tiltmeter fluctuated showing no obvious trends.
Activity during March 2003. The general level of eruptive activity in March had minor fluctuations but did not deviate much from previous months. Activity during the first two weeks was a continuation of the last few days of February. Thereafter, activity waned slightly, with ash emissions occurring at slightly longer intervals, with the exception of a couple of half-days on 15 and 16 March, when ash emissions were a bit more frequent. At the same time forceful-type emissions began until about the 23rd, when rates of sub-continuous ash emissions picked up again slightly, surpassing the activity for the first two weeks of the month. The slightly increased level continued until the end of the month. A handful of forceful emissions also occurred.
Ash plumes from the March activity rose 500-1,500 m above the summit before they were blown mainly to the SE. Most ash fell immediately downwind near Tavurvur and the deserted Talvat village. Lighter ash particles drifted farther downwind and fell in the sea.
Seismicity reflected the summit activity. It consisted mainly of low-amplitude tremor-type events with durations ranging from a couple of minutes to about eight minutes. These events were associated with sub-continuous convoluted ash emissions. Short duration, higher amplitude events associated with forceful ash emissions were also recorded but were outnumbered by the former event type. Four volcano-tectonic earthquakes were recorded during the month on the 2nd (2) and 3rd (2).
Ground-deformation measurements in March showed a more distinct and consistent sense of surface movement. Both the realtime GPS and electronic tilt measurements showed inflation. The long-term trend between January and March, as per realtime GPS measurements, was characterized by diurnal-type fluctuations of peaks and troughs, the range being about 20 mm between the highest peak and lowest trough. The cumulative movement for the three-month period was deflation of ~8 mm.
A ML 6.8 tectonic earthquake occurred on 11 March. The quake, located about 120 km SE from Rabaul in offshore southern New Island, and was felt strongly at Rabaul with MM VI. It caused minor landslides in parts of the Gazelle Peninsula.
Information Contacts: Ima Itikarai, Rabaul Volcano Observatory (RVO), P.O. Box 386, Rabaul, Papua New Guinea.
Frequent ash plumes from March through early October 2003
Reports from the Rabaul Volcanological Observatory (RVO) over the period 20 March-9 October show that ash eruptions from the Tavurvur cone at Rabaul are continuing. Activity has been nearly continuous since the major September 1994 eruption (BGVN 19:08).
Eruptions during 20 March-6 April were characterized by discrete, slow, convoluted ash plumes occurring at long irregular intervals rising slowly to several hundred meters over the summit. The ash plumes were mainly light to pale gray, blowing to the SE. Seismicity was generally low, with low- to intermediate-frequency events of 1-5 minute duration associated with the ash emissions, and greater energy expended over the first 10 seconds of the more forceful eruptions. Ground deformation fluctuated without showing any real trends.
Short forceful and slow sub-continuous discrete ash emissions were reported for 7-29 April. Light to pale gray ash-laden plumes rose as high as 1,500 m over the summit, blowing NW and SE on variable winds, with ash accumulation in Rabaul Town to the NW. Seismicity was generally low and reflected the eruptive activity. Most activity involved low-frequency, low-amplitude short- to long-duration sub-continuous volcanic tremors. Some high-frequency earthquakes were recorded NE of Rabaul Town. Deformation measurements showed minor inflation.
Steady ash eruptions continued during 7-12 May. While the ash content in individual plumes was fairly low, the accumulation of ash on the ground became quite significant within 5 km of the volcano. Seismicity was generally low (low-frequency earthquakes with durations of several minutes), reflecting summit activity. This increased to moderate seismicity over 10-12 May. Short-term ground-deformation measurements were ambiguous; long-term trends showed minor inflation.
There was a noticeable decline in ash eruptions and seismicity during 19-30 June, from one every few minutes to less than one per hour and then complete cessation on 29 June. Very occasional low roaring noises were heard early in the period. Tavurvur released only variable amounts of thin white vapor through 9 August. It began to erupt again on 10 August, with slow convoluted emissions of mainly white to pale-gray ash at irregular intervals blowing to the NW, including over the Rabaul Town area. Discrete moderate to large explosions began to occur on 25 August (1-3 per day). Occasional low rumbling noises were heard. Seismic activity was low and there were no significant ground movements.
From 29 August to 11 September the level of eruptive activity was low to moderate, characterized by convoluted ash clouds at short irregular intervals. Moderate explosions (3-6 per day) produced thick columns of pale gray to dark ash clouds rising 2-4 km above the summit. The prevailing SE winds resulted in ashfall to the NW, including in the Rabaul Town area. Seismic activity was low, with some high-frequency earthquakes NE of Rabaul Caldera and no significant ground-deformation movements.
The level of eruptive activity was generally low during 12-25 September (figure 38), with light to pale gray ash clouds rising 500-1,500 m above the summit and light downwind ashfall in the early part of the reporting period. Over 22-25 September the ash cloud emissions became light gray, with high water vapor content. Low to moderate rumbling noises were heard, but seismic activity was low and ground deformation movements were not significant.
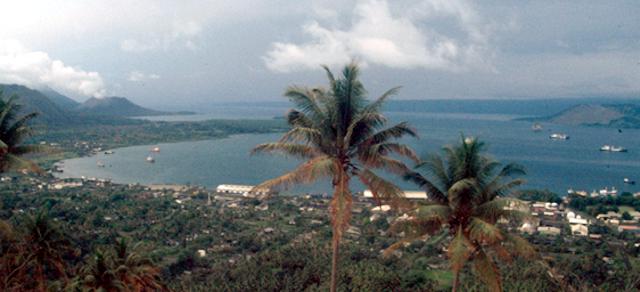 |
Figure 38. Photograph showing a plume from the Tavurvur cone at Rabaul (left background) taken from the Rabaul Volcanological Observatory, with Rabaul Town and Harbor in the foreground, 17 September 2003. Courtesy of William Kiene, UCLA. |
Eruptive activity continued at a low level from 26 September to 9 October, with light to pale gray emissions (containing some ash but mostly water vapor) rising 500-1,500 m. The emissions occurred at long, irregular intervals, and many were accompanied by low roaring and rumbling noises. Very fine ash was blown mainly to the N and NW. Seismic activity was low, with no high-frequency earthquakes inside the caldera or NE of the caldera. Ground-deformation measurements showed a long-term inflationary trend between May and September, but the magnitude of change was small.
Information Contacts: Ima Itikarai and Steve Saunders, Rabaul Volcanological Observatory, P.O. Box 386, Rabaul, Papua New Guinea; William Kiene, UCLA, 405 Hilgard Avenue, Box 951361, Los Angeles, CA 90095-1361.
Explosions through mid-December cause ashfall in Rabaul Town
Emissions of light to pale ash clouds from Tavurvur characterized activity during November 2003. Between 10 and 20 November the ash emissions occurred frequently at irregular intervals. During 20-24 November Tavurvur produced only a handful of emissions at very long intervals, but after 24 November the emissions became frequent. Occasional moderate explosions through 14 December produced thick ash plumes that rose 1-2.5 km above the summit. Incandescent lava fragments from some explosions were visible at night and occasional roaring and rumbling noises were heard. After 16 November winds were consistently from the SE, blowing ash plumes N and NW. Ashfall resulted in downwind areas, including Rabaul Town and villages on Tavui Peninsula, Malagura and Matupit; accumulation was heaviest in the area of Rabaul Town. Fine ashfall also occurred to the W, SW, S, and SE.
Seismicity has been low, with some high-frequency earthquakes from the NE. Ground deformation in November remained low. The real-time GPS and electronic tilt site on Matupit Island, in the center of the caldera, continued to indicate a slow gradual uplift. This uplift is part of the long-term trend reported earlier (BGVN 28:03).
Information Contacts: Ima Itikarai, Rabaul Volcano Observatory (RVO), P.O. Box 386, Rabaul, Papua New Guinea.
1-17 February 2004-ash falls 30 km to the E
The eruptive activity at Tavurvur that began in early October 2002 ceased on 17 February 2004. From 1-17 February the activity was characterized by emissions of light to pale ash clouds accompanied by occasional moderate explosions that produced thick ash plumes. The ash plumes rose 1000-2000 m above the summit before being blown to the E and NE resulting in ashfall in the Duke of York islands, ~ 30 km E of Rabaul.
A slight change in wind direction resulted in fine ashfall over Rabaul Town and villages downwind on 6 and 13-15 February. Occasional weak roaring noises accompanied some of the explosions on 5 and 11 February. From 18 February until the month's end, Tavurvur was only releasing weak white vapor, with occasional blue vapor. Seismic activity between 1 and 17 February reflected the ash emissions at the summit. One high frequency event occurred on 5 February, located NE of the caldera. Ground deformation indicated a deflationary trend. The real-time GPS and electronic tilt site on Matupit Island, in the center of the caldera, showed a deflationary trend since the middle of the month.
Information Contacts: Ima Itikarai, Rabaul Volcano Observatory (RVO), P.O. Box 386, Rabaul, Papua New Guinea.
Tavurvur cone's eruptions pause or cease, starting 17 February; MODIS data
The Rabaul Volcano Observatory has reported that eruptive activity from the Tavurvur crater at Rabaul, which began in early October 2002, ceased on 17 February 2004. Activity during 1-17 February was characterized by emissions of light pale ash clouds with occasional moderate explosions producing thick ash plumes. The plumes rose 1-2 above the summit, resulting in ashfall to the E and NE, including in Duke of York. A slight change in wind direction on 6 and 13-15 February resulted in fine ashfall to the NW over Rabaul city and villages downwind. Occasional weak roaring noises were heard with some of the explosions on 5 and 11 February.
Seismic activity was consistent with the ash emissions, with one high frequency event NE of the caldera on 5 February. The real-time GPS and electronic tilt site on Matupit Island, in the center of the caldera, showed a deflationary trend since the middle of the month, a reversal of the long-term trend of slow gradual uplift reported earlier (BGVN 28:03, 28:09, and 28:11). During 18-29 February Tavurvur released weak white, and occasional blue, vapor.
A review of MODIS data for the year to 11 May 2004 showed thermal alerts recorded at Tavurvur cone, Rabaul, on 12, 21, and 29 October; 1, 8, 15, and 24 November; 1 and 26 December 2003; and 9 and 25 January 2004.
Information Contacts: Ima Itikarai and Herman Patia, Rabaul Volcano Observatory (RVO), P.O. Box 386, Rabaul, Papua New Guinea; Rob Wright, Luke Flynn, and Eric Pilger; MODIS Thermal Alert System, Hawaii Institute of Geophysics and Planetology (HIGP), School of Ocean and Earth Science and Technology, University of Hawaii at Manoa (URL: http://modis.hgip.hawaii.edu/).
Numerous MODVOLC thermal alerts during October 2003-January 2004
MODVOLC alerts were still intermittent adjacent to the site of the Tavurvur cone up to the end of April 2003, with single alert pixels detected on 8 January, 31 March, and 30 April 2003 (figure 39). This was consistent with earlier reports of ground-based observations (BGVN 28:03 and 28:09), which described sub-continuous ash emissions for this period. Although there were frequent ash eruptions during March-October 2003 (BGVN 28:09), no alerts were generated by MODVOLC.
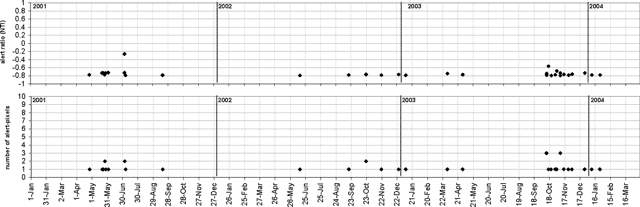 |
Figure 39. MODIS thermal alerts from Rabaul's Tavurvur cone seen during 1 January 2001-31 May 2004. Thermal alerts collated by Charlotte Saunders and David Rothery; data courtesy of the Hawaii Institute of Geophysics and Planetology's MODIS thermal alert team. |
MODVOLC detection started again on 12 October 2003, when three alert pixels were recorded. Alerts were numerous through October-December 2003, concluding with six single-pixel alerts, with the last occurring on 25 January 2004. The highest alert ratio was -0.57, seen on 16 October 2003, but most of the alerts for this period were just above the detection threshold. This was consistent with previously reported observations (BGVN 28:11), although there were no ground-based observational reports of higher activity for 12-16 October when the alerts appeared most intense.
Data acquisition and analysis. Reports from Diego Coppola and David A. Rothery provided analyses of MODIS thermal alerts during 2001 and 2002 (using the MODVOLC alert-detection algorithm) extracted from the MODIS Thermal Alerts website (http://modis.hgip.hawaii.edu/) maintained by the University of Hawaii HIGP MODIS Thermal Alerts team (BGVN 28:01). Rothery and Charlotte Saunders provided updates to 31 May 2004. MODVOLC data are now routinely available from the Aqua satellite (equator crossing times 0230 and 1430 local time) in addition to the original Terra satellite (equator crossing times 1030 and 2230 local time).
Information Contacts: David A. Rothery and Charlotte Saunders, Department of Earth Sciences, The Open University, Milton Keynes, MK7 6AA, United Kingdom.
White vapor emissions and low level seismicity at Tavurvur in July 2004
Tavurvur continued to remain quiet during July. Activity consisted of white vapor being released in variable amounts throughout the month. Seismicity was at a low level. Five high-frequency earthquakes occurred each day on 17, 19 and 25 July and two events occurred on 27 July. Only three of these earthquakes were located, two NE of the caldera and the other E of the caldera. Ground deformation continued as slow uplift, which began in October 2003.
Information Contacts: Ima Itikarai and Herman Patia, Rabaul Volcano Observatory (RVO), P. O. Box 386, Rabaul, Papua New Guinea.
Continuing low-level eruptions and ash emissions
As of July 2004 Tavurvur was releasing white vapor in variable amounts, seismicity was at a low level, and ground deformation continued as slow uplift (BGVN 29:07). Eruptive activity had stopped months earlier, in February 2004 (BGVN 29:04).
On 25 January 2005 ash rose to ~ 500 m above the summit and drifted E. Another ash emission on 31 January reached ~ 1 km above the summit but was not visible on satellite imagery. During 1-21 February, frequent eruptions of ash clouds rose a few hundred meters, drifted SE, and deposited ash mainly offshore. However, ashfall was reported in the town of Tokua during 18-21 February. Incandescent lava fragments were visible on several evenings. Between 200 and 350 daily earthquakes were associated with the eruptions. The number of seismic events leveled off around 20 February to between 150 and 200 per day. During 22-24 February ash fell offshore, but there were also reports of fine ash reaching Tokua airport.
Low-level eruptions continued during the first two weeks of March. During 22-28 March, eruptions continued every 10-20 minutes. Ash clouds rose several hundred meters above the summit, and moderate ash fell in Rabaul Town during 25-28 March. There were 100-200 daily earthquakes associated with the eruptions. No changes were recorded in ground deformation.
During April, May, and most of June 2005, low-level eruptive activity consisted of occasional emission of diffuse pale gray to gray ash clouds, which rose a few hundred meters above the summit. On 1-5, 17-22, and 25-30 April the ash clouds were blown NNW; on 6-16 and 23-24 April they drifted ESE. Fine ashfall occurred over Rabaul Town and villages downwind. Occasional roaring noises were heard throughout April. The daily average number of low-frequency seismic events increased from about 40 during the first half of the April to about 100 in the second half. One high-frequency event, on 26 April, was located NE of the caldera. Ground deformation indicated an inflationary trend. The real-time GPS site on Matupit Island, in the center of the caldera, has shown an inflationary trend since January 2005.
Photographs taken by visitors to Rabaul in late May to early June documented activity from two separate vents at Tavurvur. On 25 May there were two distinct plumes, one a very dark, coherent, ash column and the other a more diffuse white or light gray emission; the plumes appeared to mix a short distance above the volcano (figure 40). A single larger gray plume was seen on 5 June (figure 41). On 27 June the Darwin VAAC received a pilot report of an ash plume 37 km to the NW of the volcano. A pilot observed an ash plume from Rabaul on 28 July at a height of 3 km, but ash was not visible on satellite data.
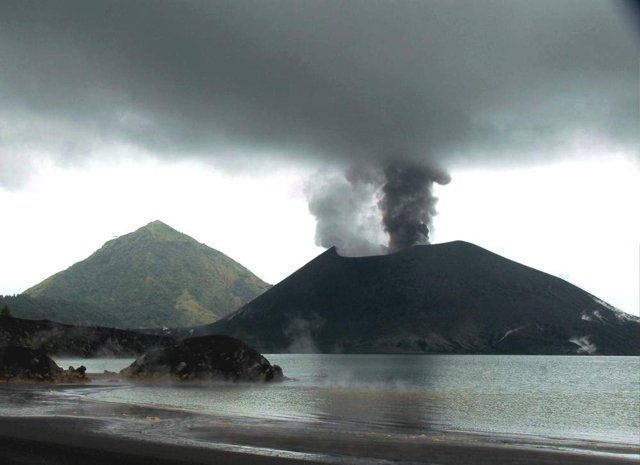 |
Figure 40. Photograph showing an eruption of the Tavurvur cone at Rabaul looking from the NW across Matupi Harbor on 25 May 2005. Two plumes, one white and the other dark gray, are originating from separate vents. The peak in the background is Turanguna. Courtesy of Roy Price. |
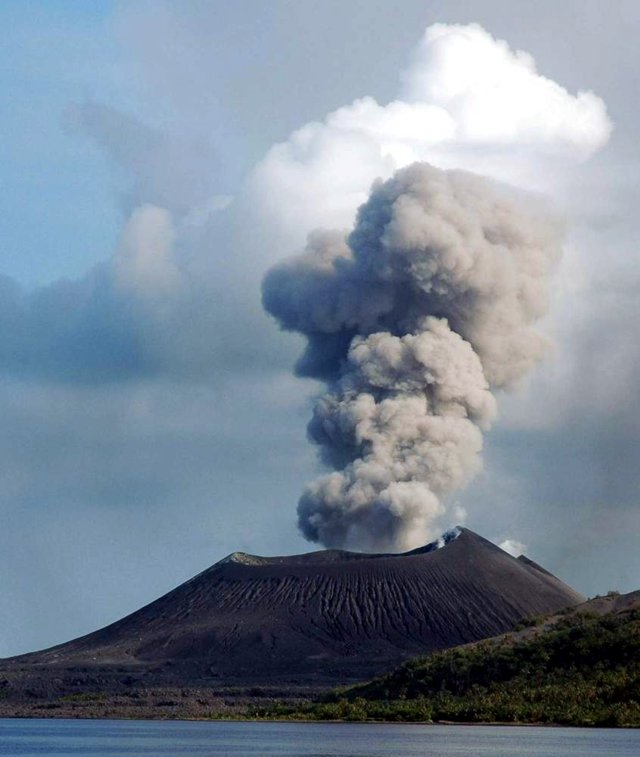 |
Figure 41. Photograph showing an eruption of the Tavurvur cone at Rabaul looking from the SE on 5 June 2005. The single large plume in this view was darker gray in the upper portion and lighter gray in the lower portion. White clouds above the plume appear to be meteorological clouds. Courtesy of Roy Price. |
On 9 August, a low-level ash plume at an altitude of 1.5 km was visible on a satellite image of Rabaul. As of mid-August Tavurvur continued to erupt with discrete ash emissions, although their frequency had declined and most were less vigorous. Some of the of ash-laden clouds were also lighter in color, suggesting less ash content. Ash plumes rose between 800 and 1,500 m and drifted N and NW, occasionally depositing ash on the E part of Rabaul Town and in areas farther downwind. Roaring and rumbling noises accompanied the activity. Projections of incandescent lava fragments were visible at night but were less conspicuous compared to the previous week. Seismicity was at a moderate to high level with most earthquakes associated with ash emissions and explosions. However, small low-frequency earthquakes not associated with ash emissions were also recorded. No high-frequency earthquakes were recorded. Ground deformation measurements from GPS and tide gauge instruments fluctuated, but the general trend showed a slow rate of uplift. As a safety precaution, people continue to be discouraged from venturing within 1 km of the erupting vent.
Information Contacts: Ima Itikarai and Herman Patia, Rabaul Volcano Observatory (RVO), P. O. Box 386, Rabaul, Papua New Guinea; Darwin Volcanic Ash Advisory Center, Bureau of Meteorology, Northern Territory Regional Office, PO Box 40050, Casuarina, Northern Territory 0811, Australia; Roy E. Price, Geology Department, University of South Florida, 4202 East Fowler Ave., Tampa, FL 33620, USA.
Minor ash plumes reach Rabaul Town
The February 2005 eruption from the Tarvurvur cone at Rabaul and its aftermath were previously described (BGVN 30:07). In late August and September 2005 Tavurvur continued to produce discrete light to pale gray ash emissions. Emissions occurred at irregular intervals and with varying frequency. Discrete explosions also occurred. Ash plumes rose between 800 and 1500 m before they were blown to the N and NW, resulting in some ashfall on the eastern half of Rabaul Town. Areas further downwind were also affected. Roaring and rumbling noises accompanied the activity. Projections of incandescent lava fragments were visible at night but were less conspicuous compared to previous weeks.
Seismicity was at moderate to high levels, with most earthquakes associated with ash emissions and explosions. Small low frequency earthquakes not associated with ash emissions were also recorded. Ground deformation measurements from global positioning system (GPS) and tide gauge instruments fluctuated but the general trend showed a very slow rate of uplift.
One high frequency earthquake occurred on 12 September NE of Tavurvur. Prevailing SE winds during the last several months caused the ash plumes to drift to the N and NW. During 12-18 September there were some brief periods of NW winds that could mark the beginning of gradual wind transition from SE to NW winds, directions that would blow ash plumes away from Rabaul Town.
Information Contacts: Rabaul Volcano Observatory (RVO), P.O. Box 386, Rabaul, Papua New Guinea.
Intermittent ash eruptions continue
The previous report on the activity of the Tavurvur cone at Rabaul (BGVN 30:08) covered the period through 12 September 2005. According to the RVO report of 10 October 2005 Tavurvur continued to erupt with discrete ejections of light to dark gray ash clouds with high ash content. The ejections occurred at irregular, but sometimes frequent intervals. Discrete, convoluted explosion clouds were also observed. Ash plumes from the eruptive activity rose between 800 to 1,500 m before being blown variably to the E, W, and S during the beginning of the 3-9 October 2005 period and later in that period towards the NW. Ash fell in the downwind areas. Occasionally roaring and rumbling noises were heard. Projections of glowing lava fragments showering the flanks of Tavurvur were visible at night during strong explosions.
Seismic activity was at moderate-to-high levels with most earthquakes associated with ash emissions and explosions. No high frequency explosions were reported and ground deformation measurements showed a general trend towards a slight deflation.
The RVO report dated 28 November 2005 stated that as of 20 November ash emission from the volcano ceased with only very small traces of white vapor being released from the now silent vent and other spots on the summit area. During 21-27 November seismicity was very low and ground-deformation measurements showed some small degree of inflation.
The volcano remained quiet until the middle of January 2006 when activity resumed. Single ash emissions occurred at 0722 on 10 January, 0854 on the 11th, 1638 on the 12th, and 2100 on the 15th of the month (all local dates and times). The emissions consisted of thick gray ash clouds that rose more than 1.5 km above the summit and then drifted E. The ash emissions on the 12th and 15th lasted three minutes. Seismic activity was at a low level with small, low-frequency earthquakes beginning to occur on 7 January 2006. The daily totals fluctuated between zero and seven per day.
RVO reported that during 30 January to 15 February, Rabaul caldera's Tavurvur cone continued to be relatively quiet. Variable amounts of gas were emitted from an active fumarole at the summit area on the upper part of the W flank. An average sulfur-dioxide flux of 200 metric tons per day was recorded and seismicity was at low levels. According to the Darwin VAAC, ash from Rabaul was visible on satellite imagery at a height of ~ 3.7 km (12,100 ft) altitude on 17 February.
Information Contacts: Ima Itikarai, Rabaul Volcano Observatory (RVO), P.O. Box 386, Rabaul, Papua New Guinea; Andrew Tupper, Darwin Volcanic Ash Advisory Centre (VAAC), Bureau of Meteorology, Northern Territory Regional Office, PO Box 40050, Casuarina, Northern Territory 0811, Australia (URL: http://www.bom.gov.au/info/vaac/).
Gas emissions and earthquakes during March-April 2006
Despite minor inflationary movements that began in mid-February 2006, Tavurvur remained relatively quiet from the end of March to mid-April 2006. Variable amounts of white vapor were released from the summit area and from an active fumarole on the upper W flank during this period. Vapor emissions became denser during and after rainfall. There were no noises heard or visible glow detected at night. Seismic activity remained at a low level. A high-frequency earthquake that originated NE of the caldera was recorded on 22 March. No other distinct high-frequency events were recorded, but 53 low-frequency earthquakes were recorded during 1-14 April.
Information Contacts: Ima Itikarai and Herman Patia, Rabaul Volcano Observatory (RVO), P.O. Box 386, Rabaul, Papua New Guinea.
Strong eruption at Tavurvur ejected ash and large plumes to the troposphere
A 7 October Rabaul eruption obscured visibility in and around the caldera, which sits at the NE end of New Britain Island (figure 42). The eruption took place at the intra-caldera cone Tavurvur, and emissions included lava flows. Intermittent eruptions had occurred at Tavurvur since 1994, the last of which took place on 15 January 2006 (BGVN 31:02). Photos by pilots shortly after the eruption documented a dramatic umbrella-shaped plume, which rose to the tropopause and created an SO2 cloud that later divided into two parts, one moving NW, the other SE.
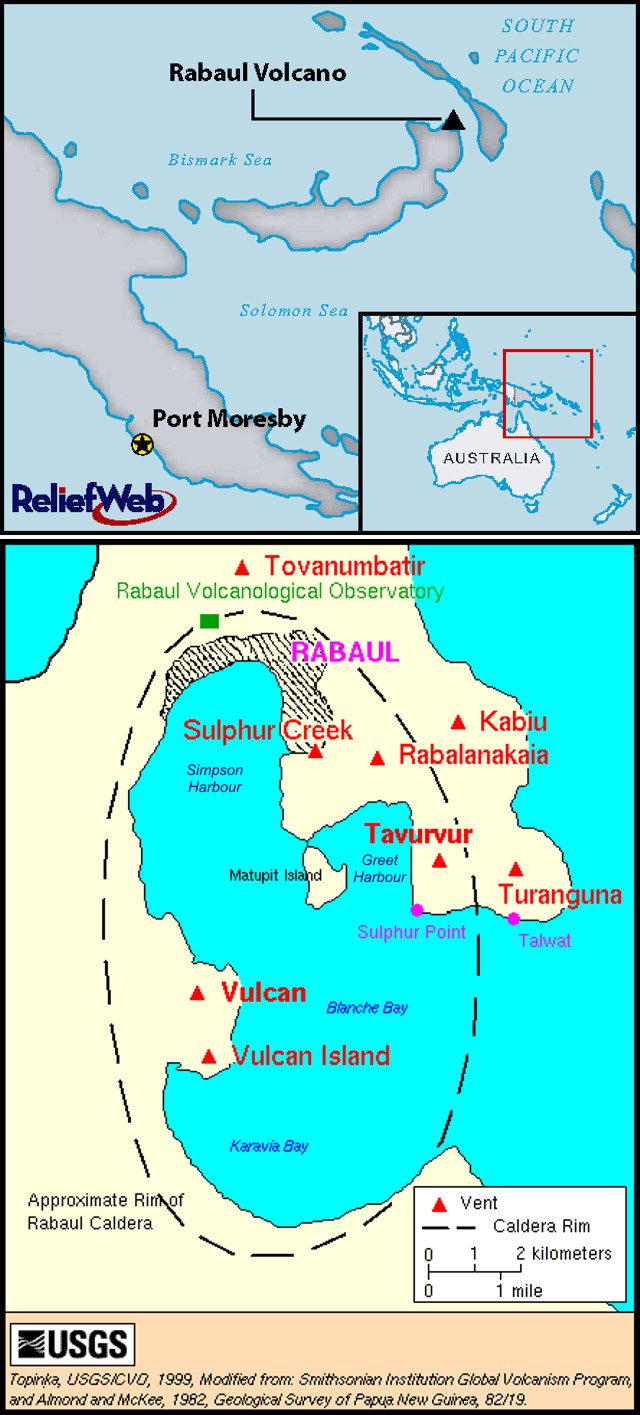 |
Figure 42. (Top) Index maps indicating the location and geography around Rabaul caldera. (Bottom) A map of Rabaul derived from work by Almond and McKee and prepared by Lyn Topinka (US Geological Survey). For other maps see previous Bulletin reports on Rabaul (most recently, BGVN 28:01). |
Rabaul Volcano Observatory (RVO) observations. The RVO announced that a sustained eruption from Tavurvur did not appear to have been any immediate precursors apart from a small deflation. The sub-Plinian eruption began at about 0845 on 7 October 2006 and continued into the early afternoon. Semi-continuous to rhythmic air blasts were obvious in Rabaul town, with doors slamming and windows rattling. Rabaul received moderately heavy ashfall; heavy lapilli of ~1 mm diameter fell, and a few lithics up to 3 cm across fell around the S and SW parts of the caldera. According to Herman Patia at RVO, a small pumice raft accumulated in Greet Harbor and pumice was still drifting about several weeks later.
Ashfall affected the whole of the Gazelle peninsula (the name given to the bulbous, 50-km-diameter NE end of New Britain island). About 1 cm of ash was deposited on the SW side of the caldera in the Blue Lagoon-Vulcan sector. Ashfall occurred ~ 7 km SE of Rabaul caldera's center point in Kokopo and -20 km S of the center point in Warangoi. The density of ashfall was such that Tavurvur was obscured from all directions. In the town of Rabaul the experience was very similar to the October 1996 and January 1997 Strombolian eruptions.
At 1200 on 7 October 2006 the RSAM was about 1900 units and its rate appeared to be decreasing. (The Real-time Seismic Amplitude is an often-used tool to summarize seismic activity during volcanic crises by presenting a measure of the average amplitude of ground shaking over successive 10-min intervals.) Thick ash clouds rose to a height of about 18 km. The cloud subsequently dispersed over a broad western swath (N to W to S). The nature of the eruption changed to Strombolian at 1415 hours, with activity characterized by frequent explosions accompanied by shock waves. At 1730 hours, the Strombolian activity began to subside. A moderate to bright glow was visible during the evening of 7 October on Tavurvur's N rim, accompanied by occasional explosions and loud roaring noises throughout the night.
In the morning of 8 October, thick white and blue vapor accompanied occasional ash explosions drifted N and NW of Tavurvur. Inspection from Rapindik (2 km NNW from Tavurvur) revealed lava flows emplaced down the cone's W and N flanks. The W flank flow went into the harbor and caused small secondary explosions; visibility of the N flank was poor due to the white vapor emission. The RSAM level decreased to the background value of ~70 units.
Herman Patia reported that by 28 October 2006 the eruption had quieted down with only occasional ash emission accompanied by rare explosions. Seismic activity was at a low level and ground deformation was at a low rate. On 30 October mild eruptive activity continued at Tavurvur. The activity consisted of continuous emission of thick pale to dark gray ash clouds that drifted N to NW of the volcano. Fine ash fall occurred in the NE caldera at Namanula, and also in surrounding areas downwind and on the E side of Rabaul Town. There were no audible noises and no glow visible. The low-level eruptive activity consisted of occasional ash emissions similar to those that have occurred regularly since 1994.
Pilot observations. Figures 43 and 44 are pilot's photographs provided by Tony Gridley, Air Niugini, indicating the well-developed ash clouds visible 1-2 hours after the eruption. The photos are reminiscent of the 20 September 1994 photo of the eruption cloud taken from the orbiting Space Shuttle, an oblique, downward-looking perspective from the NE about 24 hours after the start of that eruption (BGVN 19:08).
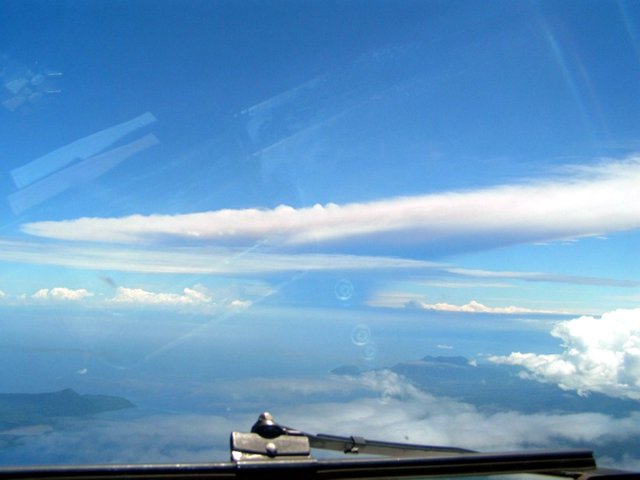 |
Figure 43. Aerial photo taken 1 or 2 hours after the eruption of 7 October 2006 at ~3.7 km (~12,000 ft) and ~90 km (~50 nautical miles) from Tokua airport (Rabaul's new airport, on the S side of the caldera) while flying at a heading of about 060° (i.e. looking ENE). The flight was "on the Hoskins-Tokua track." Courtesy of Tony Gridley, Air Niugini. |
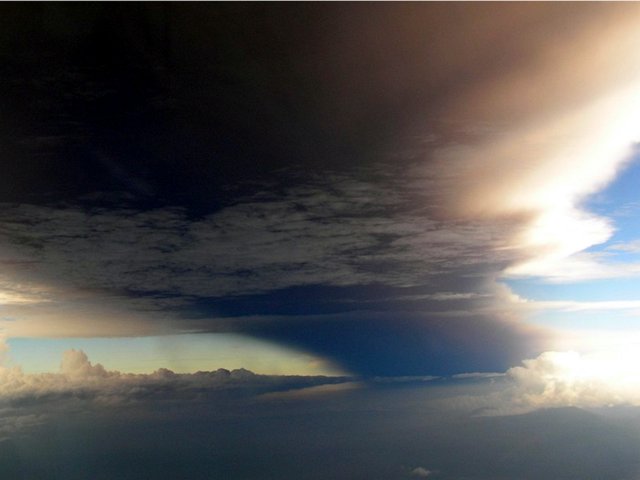 |
Figure 44. Aerial photo taken 1 or 2 hours after the eruption of 7 October 2006 at ~3.7 km (~12,000 ft) and ~90 km from Tokua airport, heading about 060°. Courtesy of Tony Gridley, Air Niugini. |
Satellite observations. According to Andrew Tupper, the 7 October eruption was clearly visible on infrared and visible imagery (to around tropopause altitudes). Figure 45 shows the ash cloud imaged from the MODIS satellite on 7 October 2006. Figure 46 depicts the sulfur dioxide (SO2) in Dobson Units (DU) from the Ozone Monitoring Instrument (OMI) for 7-9 October 2006. Further details appear in the figure caption. The SO2 concentration-pathlengths on the figure are shown using the logarithmic scale of Dobson Units. (As one explanation of this unit, if all SO2 in the air column the satellite observed was flattened into a thin layer at the surface of the Earth at a temperature of 0°C, then 1 Dobson Unit would make a layer of pure SO2 0.01 mm thick.)
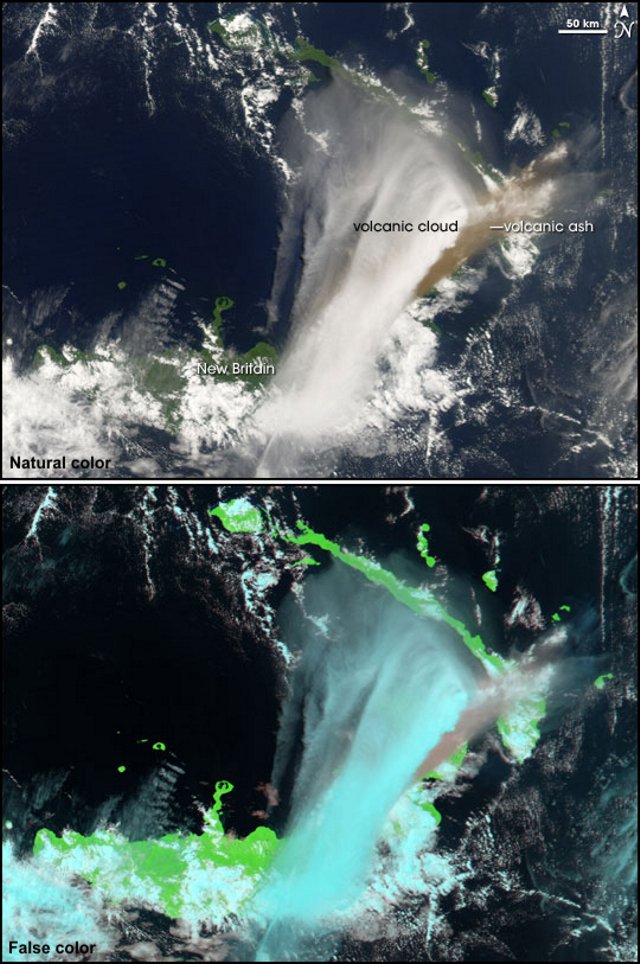 |
Figure 45. True-color (above) and false-color (below) images of a Rabaul eruption cloud created by the Moderate Resolution Imaging Spectroradiometer (MODIS) on NASA's Aqua satellite, 7 October 2006. Volcanic emissions block the view of most of the island but Rabaul's approximate location is at the solid triangle. The brown or tan plume in the E clearly bears volcanic ash. The bright "cloud" to the immediate left of the brown ash represents a portion of the volcanic ash plume that reached a high enough altitude for the water content of that plume to turn to ice crystals that "white out" the ash content that would otherwise appear tan or brown. Courtesy of the NASA Earth Observatory. |
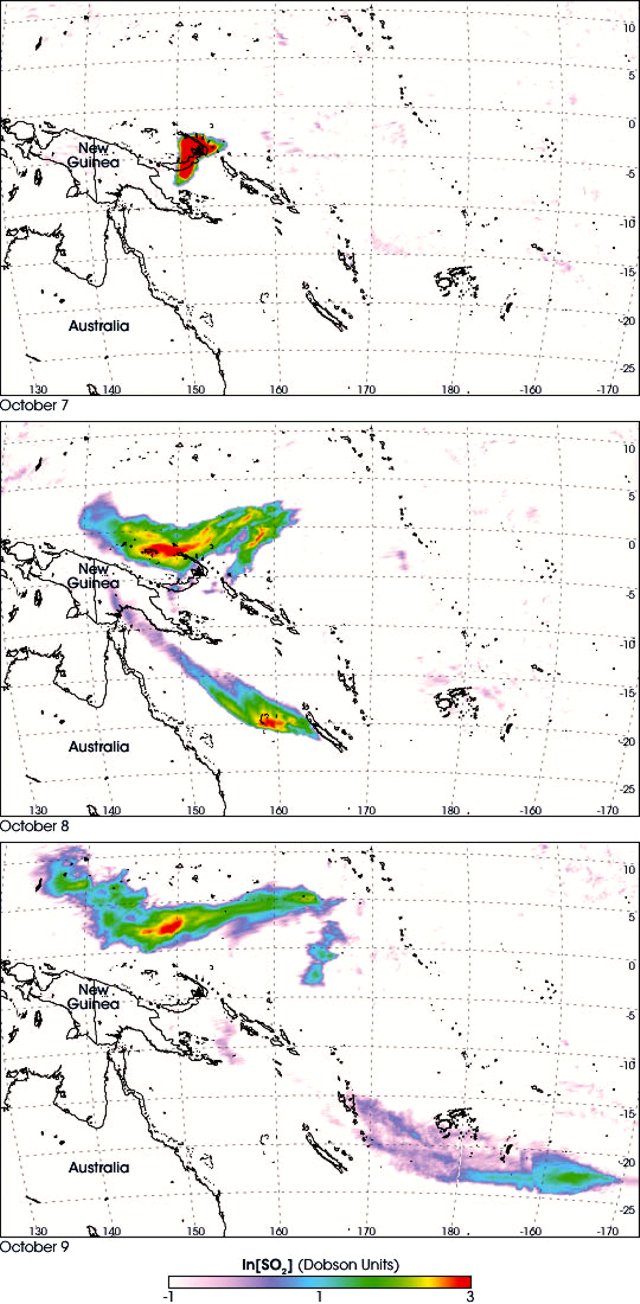 |
Figure 46. The Rabaul eruption injected SO2 into the atmosphere and measurements from satellite spectrometers led to creation of this series of images mapping the SO2 concentrations over the region during 7-9 October 2006. Data are from the Ozone Monitoring Instrument on NASA's Aura satellite. On 7 October, high SO2 concentrations lingered over New Britain. By 8 October, the original plume had split into two clouds, one spreading NW, the other, SE. On 9 October, the SO2 had diffused more, but a core of elevated concentration-pathlength values remained in the northern plume. Courtesy of NASA Earth Observatory and Simon Carn, University of Maryland Baltimore County. |
Based on information from the RVO, the Darwin VAAC reported that a brief eruption of Rabaul on 11 October produced a plume that reached an altitude of 7.6 km altitude and dissipated NW. Continuous low-level emissions and vulcanian eruptions produced plumes to 1 km altitude during 12-17 October.
Moderate Resolution Infrared Spectroradiometry (MODIS) thermal anomalies. Table 4 shows the thermal anomalies as measured from the MODIS satellite during the eruption period. Note that there were no anomalies for several months before this period. The anomalies are in harmony with the observed lava flows.
Table 4. MODIS thermal anomalies for Rabaul volcano for 7-17 October 2006. Courtesy of Hawai'i Institute of Geophysics and Planetology.
| Date | Time (UTC) | Pixels | Satellite |
| 07 Oct 2006 | 1140 | 4 | Terra |
| 08 Oct 2006 | 0000 | 2 | Terra |
| 08 Oct 2006 | 1220 | 6 | Terra |
| 08 Oct 2006 | 1520 | 4 | Aqua |
| 10 Oct 2006 | 1210 | 2 | Terra |
| 11 Oct 2006 | 0035 | 1 | Terra |
| 11 Oct 2006 | 1250 | 1 | Terra |
| 15 Oct 2006 | 1230 | 1 | Terra |
| 15 Oct 2006 | 1525 | 3 | Aqua |
| 17 Oct 2006 | 1215 | 1 | Terra |
| 22 Oct 2006 | 0015 | 2 | Terra |
| 22 Oct 2006 | 1535 | 1 | Aqua |
| 24 Oct 2006 | 1220 | 2 | Terra |
News releases. According to Reuters news service the 7 October blast shattered windows up to 12 km from the caldera. In 1994, a large eruption at Tavurvur and the nearby Vulcan peak destroyed much of Rabaul, covering the airport and much of the town with ash, and forcing the construction of a new capital, Kokopo, 20 km away. Ash was falling on Kokopo, causing power and phone cuts. There were no reports of death or injuries. In addition Reuters noted that "Rabaul Chamber of Commerce President and hotelier Bruce Alexander told Australian Associated Press that around 2,000 people?or 90 percent of the local population?had fled the town as Mt. Tavurvur erupted. All flights into Tokua airport across the harbor from Rabaul had been canceled due to ash falls."
According to The Sydney Morning Herald, with 90% of the residents absent and only essential personnel in Rabaul, local officials feared looters. Accordingly, extra police were called in, and armed police patrols were stepped up.
Information Contacts: Steve Saunders and Herman Patia, Rabaul Volcanological Observatory (RVO), Department of Mining, Private Mail Bag, Port Moresby Post Office, National Capitol District, Papua, New Guinea; Andrews Tupper, Darwin Volcanic Ash Advisory Centre (VAAC), Bureau of Meteorology, Darwin, Australia; Peter Webley, ARSC/UAF, 909 Koyukuk Drive, Fairbanks, Alaska; Simon Carn, Joint Center for Earth Systems Technology (JCET), University of Maryland Baltimore County (UMBC), 1000 Hilltop Circle, Baltimore, MD 21250, USA; National Aeronautics and Space Administration Earth Observatory (URL: http://earthobservatory.nasa.gov/NaturalHazards); HIGP MODIS Thermal Alert System, Hawai'i Institute of Geophysics and Planetology (HIGP), University of Hawaii at Manoa, 168 East-West Road, Post 602, Honolulu, HI 96822, USA (URL: http://modis.higp.hawaii.edu/).
Eruptions of varying intensity at Tavurvur; explosion on 14 November 2006
The Rabaul Volcano Observatory (RVO) reported that a large, sustained Vulcanian eruption began at Rabaul at about 0845 on 7 October 2006 (BGVN 31:09). A further point regarding that eruption, absent from our previous report, was that some members of the Volcanic Clouds Group (a listserv discussion group) conducted significant observations and initial modeling of the 7 October eruption clouds, including mapping the cloud's sulfur dioxide content and making forecasts of their dispersion. In the Volcaniccloud listserv discussions of the 7 October clouds, Andrew Tupper noted the following: "The cloud was at 16 km (upper troposphere/lower stratosphere) when it passed over Manus on its way NW . . . . However, the north/northeastern parts were initially higher . . . , with the eastward bit clearly stratospheric. There were multiple flights under the cloud over Micronesia for [sic] that reported that was no ash or smell?this puts a lower boundary (~ 10 km) on the cloud, consistent with our view that the bits at cruising levels had gone to the SE."
Since that event and in reference to the time interval for this report, 4 November to early December 2006, RVO has noted that activity continued at Tavurvur at varying intensities. The largest event in the reporting interval took place at 0715 on 14 November 2006; Tavurvur produced a large explosion that rose several kilometers above the cone.
During 4-13 November, mild eruptive activity continued at Tavurvur, with occasional small-to-moderate ash emissions continuing and blowing to the SE. An emission on 11 November consisted of thick white vapor accompanied by occasional small-to-moderate ash clouds that drifted variably to the SE, S, and NW and resulting in fine ash fall downwind. On 12 November the emission was blown W and NW, and on the morning of 13 November the ash cloud drifted N of the volcano.
An explosion occurred at Tavurvur at 0715 on 14 November 2006, accompanied by a thick ash cloud that rose to about 2 km above the summit before drifting NW. The explosion showered the flanks of the volcano with lava fragments, some of which fell into the sea. Fine ash fall occurred at Rabaul Town areas and downwind to the Ratavul and Nonga areas. Continuous ash emission followed the explosion. Seismic activity continued at low levels; however, high-frequency earthquakes continued to occur within the Rabaul caldera. After the large explosion on 14 November, mild eruptive activity continued at Tavurvur, consisting of continuous thick white vapor accompanied by pale gray to gray ash clouds that rose ~ 1.5 km above the summit before drifting variably S and E of Tavurvur. During 16-17 November, continuous thick white vapor accompanied by pale gray ash clouds rose to about 2.5 km above the summit before drifting variably to the NW and E with fine ash falling on settlements downwind, including Rabaul Town. One high-frequency earthquake occurred on 16 November.
Mild eruptive activity continued at Tavurvur during 18-20 November. On 18 November and on the morning of 20 November continuous gray ash clouds rose less than 200 m above the summit before being blown N and NW. Fine ash continued to fall on villages downwind including Rabaul Town. Activity on 19 November consisted of emission of thick white vapor only, accompanied by roaring noises heard between 1130 and 1400.
Quiet generally prevailed at Tavurvur during 20-23 November. Emissions then consisted of thick white vapor accompanied by a small amount of pale gray ash clouds. On 21 November the emissions accumulated in the atmosphere around the caldera causing haze, and on 22 November the emissions rose less than 1,000 m above the summit before drifting W. Fine ash fell on villages downwind. On the morning of 23 November the emission consisted of white vapor rising more than a kilometer above the summit before drifting E.
On 26 and 27 November the activity consisted of gentle sporadic emission of subcontinuous, gray to pale gray ash clouds of varying thickness. The ash clouds drifted NW to W resulting in fine ash fall downwind. From November to 1 December the emission consisted of pale gray to dark gray ash clouds being released more forcefully. The ash clouds rose less than 200 m above the summit before drifting E. On the morning of 2 December the emission consisted thick white vapor and pale gray ash clouds that rose about 2 km before being blown ENE. On 3 December thick pale gray ash clouds that rose about 1 km above the summit were emitted. The ash clouds drifted NE in the morning and then slightly to the W in the afternoon. On the morning of 4 December the ash cloud rose about 2 km before drifting E. Fine ash fall occurred in downwind areas. There was no glow from the volcano visible at night. From late morning to the afternoon of 4 December the activity consisted of emission of thick pale gray ash clouds that rose about 500m above the summit before drifting NW. In the morning of 5 December the ash cloud rose 200 m before drifting E. By mid-morning the ash clouds were rising about 1 km above the summit before drifting NNW, and during the early afternoon the ash clouds drifted briefly to the E and then S before going back to the E by late afternoon. On the morning of 6 December the ash cloud rose about a km before drifting N-NW. The emission was accompanied by loud roaring noises. Fine ash fall occurred in downwind areas including Rabaul..
There was no significant deformation until 10 December. The RVO reported that loud and continual roaring was present from 8 December 2006 until the morning of 9 December, when the roaring became intermittent. The roaring ceased on 10 December and at that time parts of the caldera underwent a rapid ~ 1 cm uplift. On 11 December the volcano was quiet with very little fume. At 0400 on 12 December, a loud explosion occurred with an airwave which shook houses in Rabaul. This event generated a billowing gray column that rose to a maximum of 1,000 m before being blown to the E. Following the 12 December explosion subsidence returned the site's level to that of 9 December. Seismic activity continued at low levels. No high frequency earthquake was recorded.
Table 5 shows the MODIS thermal anomalies observed during 22 October-12 December 2006 (see BGVN 31:09 for earlier October anomalies).
Table 5. MODIS thermal Anomalies for Rabaul volcano for 24 October through 12 December 2006. Courtesy of the Hawai'i Institute of Geophysics and Planetology.
| Date | Time (UTC) | Pixels | Satellite |
| 22 Oct 2006 | 1220 | 2 | Terra |
| 22 Oct 2006 | 1520 | 1 | Aqua |
| 27 Oct 2006 | 1250 | 1 | Terra |
| 16 Nov 2006 | 1230 | 1 | Terra |
Information Contacts: Steve Saunders and Herman Patia, Rabaul Volcanological Observatory (RVO), Department of Mining, Private Mail Bag, Port Moresby Post Office, National Capitol District, Papua, New Guinea; Andrew Tupper, Darwin Volcanic Ash Advisory Centre (VAAC), Bureau of Meteorology, Darwin, Australia; National Aeronautics and Space Administration Earth Observatory (URL: http://earthobservatory.nasa.gov/NaturalHazards/); HIGP MODIS Thermal Alert System, Hawai'i Institute of Geophysics and Planetology (HIGP), University of Hawaii at Manoa, 168 East-West Road, Post 602, Honolulu, HI 96822, USA (URL: http://modis.higp.hawaii.edu/); Volcanic Clouds Group (URL: http://groups.yahoo.com/group/volcanicclouds/).
Mild eruptive activity between December 2006 and March 2007
As previously reported, the Rabaul Volcano Observatory noted a large, sustained Vulcanian eruption at Rabaul on 7 October 2006. Since that initial event at the Tavurvur cone, activity has varied in intensity (BGVN 31:10). During 13 December 2006 through the end of March 2007, generally mild eruptive activity continued, often with loud roaring noises and in some cases with ash plumes rising 1.5 to 3.7 km above Tavurvur's summit.
During December 2006, there was only low level seismicity, including high-frequency earthquakes and mild eruptive activity. During 24-29 December, ash clouds rose 1-3.7 km above the summit before being blown variably to the NE and SW. On 25, 27, and 28 December, fine ash fell downwind, including in Rabaul Town, and occasional roaring noises were heard. Seismic activity continued at low levels. No high-frequency earthquakes were recorded. Low seismicity continued during most of January.
During 4-10 January 2007 plumes occasionally bearing ash rose 0.9-3.3 km above the cone and drifted E and NE. Vapor emissions accompanied by pale gray ash clouds occurred on 13, 16, and 24 January. The emissions rose 0.4- 2.5 km above Tavurvur's summit and blew E, NE, and N. During 24-25 January there were nine low-frequency earthquakes recorded. Ground deformation measurements showed no significant movement apart from a slight deflation of about 1 cm during the last few days of January. From 29 January onwards, seismicity increased to a moderate level. Three high-frequency earthquakes were recorded, one on 27 January, and two on 30 January, all originating NE of the caldera. Low-frequency earthquakes began 24 January. A total of 16 events were recorded during 24-28 January, and a further 50-60 small events 29-31 January.
Two small explosions occurred at 0448 and 0548 on 27 January and a large explosion occurred at 0130 on 31 January. The latter explosion showered the cone's flanks. The accompanying ash clouds rose a couple of hundred meters straight above the summit. Fine ashfall occurred at Rabaul Town and surrounding areas.
Mild eruptive activity continued during early February with associated seismicity at very low levels. The small low-frequency earthquakes had declined in number by about half. Ground deformation data indicated a noticeable deflation of the caldera. Mild eruptive activity continued intermittently during the latter half of February, associated with low seismicity. Ash fell on surrounding villages on 20 February. On 16, 19, and 21 February, low-frequency earthquakes and white vapor emissions containing very low ash content rose as high as 3 km above Tavurvur's summit. The emissions were not accompanied by high-frequency signals or significant ground deformation.
Moderate explosions occurred on 21, 26, and 27 February. A larger explosion, at 1150 on 28 February, showered the cone's flanks with lava fragments. Thick ash clouds rose 2 km above the summit and blew NE.
Between 3 and 4 March, multiple explosions occurred; the biggest on 3, 4, and 8 March. The explosion's shockwaves rattled houses in Rabaul Town and surrounding villages. Thick ash and lava fragments showered the flanks of the cone. Other emissions consisted of white gray ash clouds that drifted E and SE. On 4 and 6 March ash plumes rose as high as 2.7 km above the summit. A weak glow was visible only during forceful emissions. During 6 to 21 March, ash plumes intermittently rose as high as 3.7 km. From 16 to 25 March, multiple explosions again produced shockwaves felt in Rabaul Town, and ash fell in surrounding villages. Incandescent material was seen rolling down the cone's flanks. During the period 27-30 March only low level vapor emissions rising to 400 m above the cone were visible. Seismic activity continued to remain at a very low level, with just three or four short (< 30 second) low-frequency events. There were no high-frequency events.
Information Contacts: Steve Saunders and Herman Patia, Rabaul Volcanological Observatory (RVO), Department of Mining, Private Mail Bag, Port Moresby Post Office, National Capitol District, Papua, New Guinea; Andrew Tupper, Darwin Volcanic Ash Advisory Centre (VAAC), Bureau of Meteorology, Darwin, Australia.
Ash plumes, crater glow, and roaring through April and May
Eruptive activity continued from the Tavurvur cone during April and May 2007, with ash plumes drifting downwind in various directions. A large Vulcanian eruption from the Tavurvur cone occurred at Rabaul on 7 October 2006 (BGVN 31:09). After activity varied in intensity through the end of December 2006 (BGVN 31:10), generally mild eruptive activity was reported by the Rabaul Volcano Observatory (RVO) through March 2007 (BGVN 32:02).
During 3-17 April, the RVO and Darwin Volcanic Ash Advisory Centre (VAAC) reported that Tavurvur emitted steam and steam-and-ash plumes that rose to a maximum of 3 km altitude. Occasional weak roaring noises accompanied the emissions. On 3 April, explosions shook buildings in Rabaul town. Incandescent material was ejected from the crater during the night of 9-10 April and moderate to strong sub-continuous roaring could be heard in Rabaul town. Small amounts of incandescent material were ejected from the crater during 13-15 April. White to gray emissions during 16-25 April generated plumes that rose a few hundred meters. A diffuse plume seen on satellite imagery rose to an altitude of 1.5 km on 18 April. Minor ashfall was reported in Rabaul town from 22 to 25 April, when moderately-sized explosions led to darker gray plumes. On 29-30 April, ash emissions generated plumes that rose to an altitude of 1.2 km. Seismicity continued to remain at low levels. There were no high-frequency events or explosions recorded, but there were some small low-frequency events associated with roaring noises.
During 1-2 May, ash plumes drifted NNW and ashfall was reported at Rabaul town and surrounding areas. After that, emissions from Tavurvur were mostly steam that only rose 500 m. After heavy rains in the first week of May, the night-time red glow disappeared, but roaring noises intensified. Roaring noises were heard throughout May, but were more intense after heavy rainfall. Weak to moderate glow was visible during the last three weeks of the month. Seismicity remained at low levels. Small low-frequency earthquakes associated with the roaring noise dominated the seismic activity. There was a gradual increase in the daily number of low-frequency events from less than 10 during the second week to a peak of 50 during the third week before declining back to less than 10 at the end of the month. Ground deformation measurements indicated no apparent changes during the month.
Information Contacts: Steve Saunders and Herman Patia, Rabaul Volcanological Observatory (RVO), Department of Mining, Private Mail Bag, Port Moresby Post Office, National Capitol District, Papua New Guinea (URL: http://www.pngndc.gov.pg/); Darwin Volcanic Ash Advisory Centre (VAAC), Bureau of Meteorology, Darwin, Australia.
Six explosions occurred June-July 2007; ashfall and sulfurous odors
During April and May 2007 (BGVN 32:05) and through mid-June 2007, the Rabaul Volcanological Observatory (RVO) reported that low-level activity continued at Tavurvur. Between the afternoon of 19 June and the morning of 20 June, four explosions occurred (at 1745 and 1928 hours on 19 June, and at 0319 and 0933 on 20 June) producing shockwaves that rattled windows of houses in Rabaul Town and surrounding areas. The explosions also showered the flanks with lava fragments.
Ash clouds from the 19 and 20 June explosions rose about 2 km before being blown to the NW, resulting in moderate ashfall in Rabaul and downwind areas such as Ratavul, Volavolo, and Nonga villages (each on the SE shore of Talili Bay about 10 km NW from the Tavurvur summit). Weak-to-moderate glow was visible at night, and occasional weak-to-loud roaring noises, probably due to steam production, continued to be heard during the above 1-day period. RVO attributed the June-July 2007 eruptions to result from residual unquenched magma remaining from the eruption of October 2006 (figure 47).
 |
Figure 47. Eruption of the Tavurvur cone, seen from across the harbor formed by Rabaul caldera. The photo was taken at 0900 on 7 October 2006. Courtesy of Reinhard Lorenz. |
Summaries of geophysical activity at Rabaul for June-July 2007 are shown in tables 6 and 7. After the four big explosions on 19 and 20 June, Tavurvur emitted variable volumes of white vapor containing very little ash content for the next two days. These emissions were accompanied by blue vapor clouds that rose less than 1 km before drifting N-NW. Very fine ashfall occurred downwind, including in Rabaul Town where mild smell of hydrogen sulphide (H2S)gas was evident. Occasional weak roaring noises were heard accompanying the vapor emissions, and weak-to-moderate glow was visible at night. Thick white vapor was emitted from the crater on the morning following rain on the night of 21 June 2007.
Table 6. Summary of seismic activity at Rabaul during June-July 2007. Courtesy of RVO.
| Date | High-frequency earthquakes: date (number) | Low-frequency earthquakes: date (number) | Explosion earthquakes: date (number) | Comments on level of seismicity |
| 04-15 Jun 2007 | None | -- | -- | Low |
| 16-20 Jun 2007 | 8 June (1), 18 June (3), 19 June (1) (all originated NE of Rabaul caldera) | 19 June (26) | 19 June (2), 20 June (2) | Low to moderate |
| 20-21 Jun 2007 | 21 June (1) (originated NE of Rabaul) | 43 total | 21 June (1) (weak) | Low to moderate |
| 22-25 Jun 2007 | Eight total. | 102 total. Five originated NE of caldera, two from S (~2.5 km S of Raluana), one from NW (~2 km S of Watom Island). | -- | Low to moderate |
| 26-29 Jun 2007 | -- | Range of 27-44 per day (slightly higher than normal background) | -- | Low to moderate |
| 02-14 Jul 2007 | None | 3-6 July (range of 9-11/day), 7-10 July (range of 2-6/day), 10-14 July (1-7/day) | 5 July (1) | Low |
| 14-17 Jul 2007 | None | Five on 14 July, 0 on 15 July, 55 on 16 July | 17 July (1) | Slight increase to moderate |
| 18-21 Jul 2007 | -- | Eleven total | -- | Decrease to low |
Table 7. Summary of Rabaul ground deformation, June-July 2007. Courtesy of RVO.
| Date | Global positioning system (GPS) | Water tube tilt monitoring | Comments |
| 04 Jun-08 Jun 2007 | slight uplift | slight uplift | insignificant! |
| 08 Jun-18 Jun 2007 | slight inflation | slight inflation | pressure build-up |
| 20 Jun-22 Jun 2007 | no apparent deformation | no apparent deformation | -- |
| 22 Jun-26 Jun 2007 | slight uplift | slight uplift | -- |
| 26 Jun-28 Jun 2007 | stable | stable | -- |
| 28 Jun-29 Jun 2007 | slight subsidence | slight subsidence | -- |
| 03 Jul-06 Jul 2007 | low-level deformation | low-level deformation | -- |
| 06 Jul 2007 | minor inflation | minor inflation | -- |
| 07 Jul-08 Jul 2007 | stable | stable | -- |
| 09 Jul-10 Jul 2007 | further inflation | further inflation | precursor to ash release on 10-11 July |
| 11 Jul 2007 | subsidence | subsidence | -- |
| 14 Jul-16 Jul 2007 | minor inflation | minor inflation | horizontal movement twice that of vertical movement |
| 18 Jul-22 Jul 2007 | inflation trend | inflation trend | northward movement |
By 22 June activity had returned to a low level, with emissions consisting of moderate to dense white and blue vapor rising to about 1 km. An odor of H2S gas was evident in Rabaul Town on 22 and 25 June (along with rain that stung the eyes on 25 June). Occasional weak roaring noises continued to be heard accompanying the vapor emissions, and weak to moderate red glow was visible at night.
Tavurvur remained quiet during 26-28 June 2007. Variable amounts of white fume were produced, the quantity of steam present reflecting atmospheric conditions (such as temperature and humidity). Moderately strong night-time glow was still present, but Tavurvur made no sound. A slight smell of H2S lingered downwind. An M 6.7 earthquake that occurred at 1252 on 28 June was located beneath the Solomon Sea, but it was not related to volcanic activity. Tavurvur remained quiet during 2-4 July 2007, releasing variable amounts of white vapor.
A big explosion occurred at 0511 on 5 July, producing a shock wave that rattled houses in Rabaul Town and surrounding villages. A thick gray ash cloud rose ~ 2 km above the summit before being blown N to NW. Fine ashfall occurred in Rabaul and areas downwind. A weak glow was visible at night and occasional weak to loud roaring noises were occasionally heard. A slight smell of sulphur lingered downwind. A thermal image taken from RVO indicated that the volcano was relatively cool. A weak glow was visible around the crater rim on 7 July.
Tavurvur released pale gray ash clouds from about 1400 on 10 July to 11 July 2007. The ash clouds rose less than 500 m above the summit and were blown to the N and NW of the volcano. Fine ashfall occurred at Rabaul and villages downwind between 10 and 11 July. From 12 until 14 July, the emission returned to white, thin-to-thick vapor accompanied by blue vapor that continued to drift to the N and NW. Downwind there was still a weak smell of sulphur in the emission. Occasional low roaring noise was heard and a weak to moderate glow was visible above the crater rim.
During 14-16 July, Tavurvur was only releasing variable amounts of white vapor accompanied by blue vapor. Occasional low roaring noise was heard during the above period and a weak to moderate red glow was visible above the crater rim.
A large single explosion occurred at Tavurvur at 0648 on 17 July 2007. The explosion was accompanied by a loud booming noise and a thick brown ash cloud that showered the flanks with lava fragments. The ash cloud rose about 1.5 km above the summit before curving NW of the volcano over Rabaul and Malaguna village. Fine-to-moderate ashfall occurred in Rabaul and Malaguna and areas downwind.
Low activity at Tavurvur continued during 18-22 July 2007. After the explosion on 17 July, Tavurvur continued to release variable amounts of white vapor accompanied by blue vapor that was blown N to NW of the volcano. Some of the white vapor emissions contained a small amount of ash. Smell of sulphur occurred on the downwind side of the vapor plume on 19 July. Occasional low roaring noise continued to be heard during the above period and a weak to moderate red glow was visible above the crater rim.
MODVOLC Thermal Alerts. MODIS satellite thermal anomalies measured between 16 November 2006 and 23 July 2007 are shown in table 8; no thermal anomalies were measured between 17 November 2006 and 12 February 2007.
Table 8. MODIS thermal anomaly data for 2007 for Rabaul. Courtesy of Hawai'i Institute of Geophysics and Planetology (HIGP) Thermal Alerts System.
| Date (UTC) | Time (UTC) | Number of Pixels | Satellite |
| 13 Feb 2007 | 1225 | 2 | Terra |
| 08 Mar 2007 | 1230 | 1 | Aqua |
| 08 Mar 2007 | 1530 | 2 | Terra |
| 15 Mar 2007 | 1235 | 1 | Terra |
| 22 Mar 2007 | 1240 | 1 | Terra |
| 24 Mar 2007 | 1525 | 2 | Aqua |
| 05 Jun 2007 | 1220 | 1 | Terra |
| 05 Jun 2007 | 1520 | 1 | Aqua |
| 12 Jun 2007 | 1230 | 1 | Terra |
| 14 Jun 2007 | 1515 | 1 | Aqua |
| 23 Jun 2007 | 1510 | 1 | Aqua |
| 16 Jul 2007 | 1515 | 1 | Aqua |
| 23 Jul 2007 | 1225 | 1 | Terra |
Information Contacts: Steve Saunders and Herman Patia, Rabaul Volcanological Observatory (RVO), Department of Mining, Private Mail Bag, Port Moresby Post Office, National Capitol District, Papua New Guinea (URL: http://www.pngndc.gov.pg/); Hawai'i Institute of Geophysics and Planetology (HIGP) Thermal Alerts System, School of Ocean and Earth Science and Technology (SOEST), Univ. of Hawai'i, 2525 Correa Road, Honolulu, HI 96822, USA (URL: http://modis.higp.hawaii.edu/); Reinhard Lorenz.
Main vent plugged; seismicity, deformation, explosions, and H2S all high
This report describes ash plumes (figure 48) and explosions (table 9) located at Tavurvur, a cone located on the NE flank of Rabaul caldera. Tavurvur's summit sits at ~ 240 m elevation. The largest nearby settlement is Rabaul Town. Throughout the course of this report, audible sounds such as roaring, glowing of the cone, incandescent events, and hydrogen-sulfide (H2S) odor were frequently reported. RVO interpreted high-frequency earthquakes as rocks breaking or explosion events, and low-frequency earthquakes driven by fluids, steam or gas (rarely liquid magma), their motions imparting a slower shaking or rocking to the ground.
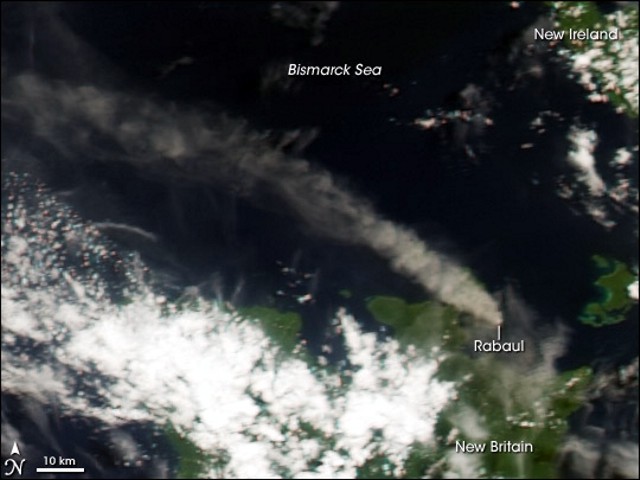 |
Figure 48. MODIS satellite image of a Rabaul ash plume on 18 March 2008.The plume can be seen over 150 km. Courtesy of NASA Earth Observatory. |
Table 9. Summary of events at Rabaul's Tavurvur cone during August 2007 to April 2008. Not all events are reported here. Further details of some of the events can be found in the text. Some data such as plume height or direction of plume were not measured. Areas effected by ashfall can generally be found in the text. Courtesy of the Darwin VAAC.
| Date | Plume height (km) | Direction | Notes and Comments |
| 01-07 Aug 2007 | 0.9-1.7 | N, NW, W | Thick, dark gray. Occasional emission of white vapors. Ashfall. |
| 14-20 Aug 2007 | -- | -- | White vapors. Accompanied by blue vapor plumes. |
| 22-28 Aug 2007 | 3 | -- | -- |
| 03 Sep 2007 | -- | NW | Gray ash. Fine ashfall. |
| 04 Sep 2007 | 2 | WNW | White vapor. |
| 20-24 Sep 2007 | 1.2 | W, NW | White vapor. Ashfall. |
| 25 Sep 2007 | 1.7 | W | -- |
| 02 Oct 2007 | 2.4 | -- | -- |
| 03 Oct 2007 | 1.7-2.7 | NW | Ashfall. |
| 04 Oct 2007 | -- | W | Ashfall. |
| 08-23 Oct 2007 | 1.7-2.7 | NNE, S | Thick white, gray ash clouds. Occasional explosions, ashfall on large area. |
| 29-30 Oct 2007 | 2.7-3.7 | -- | Ashfall. |
| 10 Dec 2007 | 2 | SSE, E, NW, W | Thick dark ash clouds. Ashfall. |
| 11 Jan 2008 | 1.2-1.5 | SE | Ash plume. |
| 11-15 Jan 2008 | 0.9-1.2 | SE, E, NE, N, W | Ash vapor plume. Ashfall. |
| 18-20 Jan 2008 | 1.7 | NE | -- |
| 28 Jan 2008 | 1.7 | W | -- |
| 29-30 Jan 2008 | 1.7 | SW, W, E | Ash and gas plumes. |
| 01-03 Feb 2008 | 1.2 | SSE | Weak ash emissions. |
| Mid Feb 2008 | 1.2-1.7 | NW, W, SW, S, SE, E | Thick gray ash clouds. Long duration of ashfall. |
| 26 Feb 2008 | 3.7 | SE, E | Thick billowing ash plumes. Explosion caused ashfall. |
| 27 Feb-04 Mar 2008 | 0.9-2.2 | W | Ash and steam plumes. Ashfall. |
| 08-10 Mar 2008 | 1.2-1.7 | NW, W, SW, S, SE | Ash plumes. Ashfall. |
| 13 Mar 2008 | 2.5 | NE | Ashfall. |
| 16 Mar 2008 | 2 | S, W | Gray ash. Ashfall. |
| 17 Mar 2008 | 2.5 | WNW | High ashfall, rapid gas escape. |
| 18 Mar 2008 | 2 | WNW | -- |
| 19 Mar 2008 | 2 | NW, N | -- |
| 20 Mar 2008 | 2 | NW, SSE | Ashfall. |
| 21 Mar 2008 | -- | S | Fine ashfall. |
| 22 Mar 2008 | 1 | SW, W, NW | Ashfall. |
| 23 Mar 2008 | 2.5 | N, SE | Ashfall. |
| 26 Mar 2008 | 1.5 | SE | Ashfall, disruption of aviation. |
| 27 Mar 2008 | 2 | S | Thick gray. |
| 28 Mar 2008 | 0.5-1.0 | W, SW | Gray. |
| 30 Mar 2008 | 1-2 | N, NW | Thick white vapor gray ash clouds. |
| 01 Apr 2008 | 0.5 | -- | Fluctuating between water vapor and dense gray ash. Occasional explosions. |
| 03 Apr 2008 | 1 | SE | Discrete puffs gray ash. Rarer explosions. |
| 07-09 Apr 2008 | 1 | E | Gray ash clouds. Ashfall. |
| 13 Apr 2008 | 1-1.5 | W, NW | Ashfall. |
| 28 Apr 2008 | 1-1.5 | N | Gray. |
Low eruptive activity such as reported in this issue have been periodically occurring since the powerful explosion in 1994. Our last report (BGVN 32:06) reported the six explosions that occurred in June and July (2007) at Tavurvur cone that produced shockwaves that rattled windows of houses in Rabaul Town and surrounding areas. The explosions also showered the flanks with lava fragments and conveyed ashfall and sulfurous odors to the NW.
RVO stated that there was no indication of any build up that might lead to significant eruptive activity like in October 2006. Ground deformation remains to be in a deflated but stable state. Seismic activity remains at a moderate to high level dominated by low-frequency earthquakes.
Throughout the entire period covered by these observations and reports, authorities have been regularly advising the public not to venture close to the volcano due to the possibility of rocks being expelled during the occasional eruptions.
Late July 2007. Rabaul Volcanic Observatory (RVO) described this time as marked by minor eruptions. The activity consisted of emission of thin to thick, white, and bluish vapor, which rose to an altitude of ~ 0.9 km and drifted NNW. Roaring noises were occasionally heard and incandescence was intermittently visible at the crater rim.
Red glow was visible at night, associated with a small lava dome centrally located within Tavurvur's wide vent. A weak smell of sulphur was evident on the downwind side of the vapor plume on 25 July. Occasional low roaring noise continued to be heard and a weak to bright red glow was visible above the crater rim on 28 and 29 July. On 30 July, a white plume with little ash content rose to an altitude of 2.7 km and drifted SW.
Seismicity was low but it and deformation were consistent with a dynamic and restless caldera. The real-time GPS at the caldera's center of the showed that centimeter-scale movements often occurred over a few hours. Small inflation events sometimes preceded activity by 6-12 hours. Only 17 low-frequency earthquakes were recorded between 22 and 27 July. One high-frequency earthquake was recorded on 26 July which originated NE of the caldera. Ground deformation continued to show a slow inflation trend with movement N.
August 2007. August activity was characterized by Tarvurvur emitting almost continuous ash and vapor plumes. During 1-7 August 2007, ashfall was reported at Rabaul Town (~ 6.5 km NW of the vent) and surrounding areas. Seismicity was generally moderate during the earlier part of August but increased to higher levels between 22-29 August. Activity was usually low frequency earthquakes, with occasional high-frequence earthquakes between 25-29 August. Five weak explosions were recorded on 27 August.
Ground deformation was stable until the middle of August when minor uplifts were noted. On 22 August, a marked uplift began and then subsided with the resumption of ash emissions. The subsidence continued until 28 August when a minor uplift began but subsided on 30 August.
A total of 1,087 low frequency earthquakes were recorded during 28-31 August. Three weak explosions were recorded on 30 August, but no high-frequency earthquakes were recorded. Ash emission persisted before declining significantly on the night of 30 August. A total of 150 low-frequency earthquakes were recorded on 31 August. After a momentary eruptive interlude took place at the end of August, blending into early September
September 2007. On 2 September, fine ashfall continued on Rabaul Town. Seismicity continued at a moderate level, dominated by bands of irregular tremor and discrete low-frequency earthquakes. A total of 886 low-frequency earthquakes were recorded during 1-5 September; no high-frequency events were recorded. During 6-10 September there was little or no ash emitted. Emissions consisted of billowing white fume when atmospheric conditions were humid or cool. During hot dry periods, observers saw clear air above the cone, with a white plume appearing several hundred meters higher. On 8 September, odors of H2S became noticeable downwind; this coincided with a blue tinge to the plume. Ground deformation measurements indicated an uplift. Emissions began again on 20 September, with ashfall in Rabaul Town and areas downwind, including Namanula Hill (3 km W). On 27 September, a large explosion was noted. During 30 September-2 October, incandescent fragments were ejected from the summit and rolled down the flanks.
October 2007. On 3 October ashfall was reported from areas downwind, including Rabaul Town. On 4 October ash plumes resulted in ashfall in Matupit Island (3.3 km SE), Malaguna. Incandescent fragments were ejected from the summit. On 5 October, vapor plumes with minor ash content were noted. During 8-23 October, occasional explosions produced ash plumes. Ashfall was reported at Namanula Hill and surrounding areas. Continuous weak glow was visible at night and incandescence at the summit was observed. The glow was bright on the night of 17 October. On 29-30 October ashfall was reported in Rabaul Town. Seismicity continued at moderate to moderately high level between the 17th and 20th. One high-frequency event was recorded on 21 October from NE of Rabaul.
November 2007. In late November, after five weeks of low-level activity, Tavurvur began to emit ash from a new vent on the NE crater rim. The new vent was formed as a result of the lava dome blocking the vent on the crater floor. The activity progressed and on 8-9 December emissions were thick white gray ash. The new dome has been the source of the continuous red glow visible at night.
December 2007. There was a slight increase in seismicity during December, but it was still low. The average daily number of low-frequency earthquakes was 20 during 1-3 December, before increasing to 55 during 4- 6 December, and 85 during 7- 8 December. The activity was accompanied by low-level sub-continuous signals. Two high-frequency earthquakes were recorded on 3 December which originated NE of the caldera. Ashfall continued downwind, including Rabaul Town. During 13-18 December, white plumes were observed and a strong smell of H2S gas was reported.
January 2008. January 2008 continued the December activity. White ash and vapor plumes continued from the Tavurvur cone. The eruptive activity came from vents based on the inner eastern wall. One vigorous coneless fumarole on the upper outer eastern flank occasionally erupted ash. Unfortunately, NW winds carried ash towards the Provincial Airport (5.3 km NW) on a few occasions, causing closures.
During 11-12 January slight ashfall was reported about 20 km SE of Tokua. On 17 January ashfall at Tokua, prompted Air Niugini to cancel some flights. During 18-20 January, the ash plumes were released at 10-20 minute intervals. Slight ashfall was reported in areas on the E coast. Incandescence from the center of the crater was visible at night throughout most of January.
Deformation-monitoring instruments indicated that uplift started on 23 January and peaked during 25-26 January with 2 cm of inflation. On 26 January, ashfall was quite heavy but died down on the morning of 27 January. Seismicity remained moderately high, with small sub-continuous low-frequency signals dominating. In the preceeding 24 hrs there were 400 low-frequency events and 3 explosion type signals, most of them were not associated with the seen emissions. There were no high-frequency or hybrid events. There were small explosion type signals, even when ash was not emitted. Deformation monitoring showed a slight uplift superimposed on the gradual 6 month long subsidence. On 29 January two small, instrumentally recorded, high-frequency events occured within the caldera, one between Tavurvur and Rabalanakia and the other just off the E coast of Vulcan (the first here since the '94 eruption). Deformation monitoring showed that the center of the caldera underwent a rapid centimetre scale uplift and matching deflation on 31 January.
February 2008. There was little variance in the activity at Tarvurur which was essentially a continuation of the January activity. Because of light winds, the plumes reached 1 km above Tavurvur. Drift was predominantly E. During 1-3 February ashfall was reported in Kokopo (20 km SE). On 4 February, a strong smell of H2S gas was reported from Rabaul Town (3-5 km NW). Incandescence from the center of the crater was visible almost every night.
Low-frequency seismicity was moderately high and increased slightly, with occasional low-frequency signals dominating. Some hybrid events were also recorded. Seismic activity did not always appear to be related to the observed events. Deformation monitoring showed that the center of the caldera remaining reasonable stable during the early part of the month, although the trend was towards inflation. On 5 February, deformation monitoring showed some small, but significant movements with horizontal strain greater than vertical. A slight deflation was noted.
Toward the middle of February, ashfall was reported everyday in areas downwind, including Matupit, Kokopo, and Rabaul Town, and surrounding areas. Incandescence at the summit was noted and incandescent material was propelled from a vent on the inner E wall of the crater. Seismic activity remained at moderate levels; but again, the activity did not always appear to be related to observed events. Deflation appeared to continue but only slightly. Occasional periods of high level seismic activity were dominated by low-frequency volcanic earthquakes. A total of over 1,570 events were recorded during 7-8 February. Ground deformation showed no significant movement although the trend after 9 February was towards inflation.
From 13-19 February, ashfall was reported in Barovon, Lalakua, Raluana, Kokopo, and surrounding villages. During 19-20 February, incandescence at the summit was accompanied by projections of lava fragments. Ground deformation as indicated by both the GPS and water-tube tiltmeter continued to indicate a trend towards inflation. On 25 February an explosion showered the flanks with lava fragments. On 26 February a large explosion occurred. The flanks were again showered with lava fragments. Ashfall was reported in Kokopo and surrounding areas.
March 2008. Tavurvur's activity during March was a continuation of the preceeding months. During 27 February-4 March ashfall was reported in areas downwind, including Matupit. A smell of H2S gas was again reported in Rabaul Town. During 3-7 March, incandescence at the summit. A slight smell of H2S was reported in areas to the S on 5 March. During 8-11 March, ash fall was reported in areas downwind, including Kokopo town (SE), and Rabaul Town (NW) on 11 and 13 March. Seismic activity often remained at a high level during March, but, the instrument's batteries died during 10-11 March. A total of over 980 events were recorded on 9 March. No high-frequency earthquakes were recorded. Deformation continued to indicate an inflationary trend after 8 March. On 13 March fine ash fell upon Rabaul Town. Ground deformation began towards an inflation trend after previous indications towards deflation. Unlike most plume eruptions, on 13 March sounds were not recorded. On 17 March moderate to heavy ash fall rained on Matupit island and surrounding areas.
At 1105 on 20 March a large explosion occurred showering the flanks with lava fragments. The shockwave rattled windows in Rabaul Town. At 1730 on 22 March 2008 an explosion occurred showering the flanks with lava fragments. During 22-23 March areas downwind had ashfall.
On 25 March 2008 ash clouds formed a broad fan from S at Barovon/Ialakua to Kokopo. The cloud drifted SE towards Tokua later that morning. During the morning on 26 March 2008 ash plumes caused Air Niugini flights into Tokua to be affected.
During 27 March into July 2007 overall deflation was 5 cm of subsidence, step-wise with small superimposed up lifts. RVO suggested that low-pressure intrusions were periodically rising in an open conduit causing the uplift before intersecting with the surface. The overall deflation implied that the deeper source was being depleted. The deformation measurements were made at Matupit. Constant expansion and degassing of magma in the recent weeks had apparently kept the conduit open. Pressure and debris have started to block the mouth of the vent by compaction and partial welding of molten material. This would lead to pressure build-up causing periodic explosions, in a plausible waning explosive phase.
April-May 2008. On 2 April ground deformation was stable with small and continued rapid fluctuations due to the repeating sealing and rupturing of the shallow conduit. Seismicity generally became moderate, but still generally dominated by low-frequency earthquakes. Activity was no longer preceded by notable explosions. The vent would be clear for a period of time. On 7 April a high-frequency event occurred NE of the caldera. On 9-10 April 9 mm of uplift occurred. On 11 April moderate ashfall was noted in Rabaul Town. Fine ashfall occurred in Matupit island. Seismic activity returned to a high level dominated by low-frequency earthquakes. On 11 April a total of 1,000 earthquakes were recorded. At 1100 on 22 April a modest explosion occurred. On 23 April 1-2 mm of non compacted flocculated pale ash was deposited in a sector from Malaguna E to S of Matupit. The cone was obscured to vision. On 28 April ground deformation was in a deflated but stable state. Ashfalls on 2 May left 3-4 cm in eastern Rabaul and 1-2 cm in western Rabaul.
Information Contacts: Steve Saunders and Herman Patia, Rabaul Volcanological Observatory (RVO), Department of Mining, Private Mail Bag, Port Moresby Post Office, National Capitol District, Papua New Guinea (URL: http://www.pngndc.gov.pg/); NASA Earth Observatory (URL: http://earthobservatory.nasa.gov/).
Frequent ash emissions during mid-2007 to early May 2008
This report documents ash plumes and explosions at Tavurvur, a cone on the NE flank of Rabaul caldera, from May through December 2008; our last report (BGVN 33:03) described activity from the end of July 2007 through early May 2008. Aviation notices were frequent from May 2008 through December 2008 (table 10); plume heights were typically to 3 km altitude or less, but they were visible considerable distances downwind, often over 100 km and in some cases during 22 July to 12 August, to 185 km. Additional details and ground observations were provided by the Rabaul Volcanological Observatory (RVO).
Table 10. Ash plumes from Rabaul's Tavuvur cone during 7 May-10 December 2008. The table distills ~ 150 reports, mostly from the Darwin Volcanic Ash Advisory Center (VAAC). Areas affected by ashfall can generally be found described in the text.
| Date | Plume Height | Direction | Distances downwind | Notes and Comments |
| 07 May-08 May 2008 | 3.0 km | SE | 55-92 km | -- |
| 10 May-12 May 2008 | 3.0 km | NE | 37-46 km | -- |
| 14 May-21 May 2008 | 3.0 km | SW, SE, NW | 37-55 km | -- |
| 28 May-02 Jun 2008 | 3.0 km | NNW, NW, WNW | 74-111 km | Plumes 111 km (29 May, 1 Jun). |
| 03 Jun-10 Jun 2008 | -- | -- | -- | Low eruption plumes. |
| 19 Jun-18 Jul 2008 | 1.5-3.0 km | N, NW, W | 27-129 km | Typically ~8- km-long plumes. Plumes 27 km (19 Jun), 129 km (3 Jul), and 111 km (7 Jul). |
| 22 Jul-12 Aug 2008 | 1.5-3.0 km | W, NW | 37-185 km | Plumes ~185 km (7 and 11 Aug). |
| 15 Aug-05 Sep 2008 | 1.5-2.4 km | WNW, NW | 22-111 km | Plume 111 km (15 Aug), 92 km (16-17 Aug). |
| 07 Sep-08 Sep 2008 | 1.8 km | W | 101-129 km | -- |
| 09 Sep-11 Sep 2008 | 1.8 km | NW, WNW | 46-55 km | -- |
| 12 Sep-16 Sep 2008 | 1.8-3.0 km | SW, S, NW | 27-129 km | Plume 129 km (15 Sep). |
| 17 Sep-21 Sep 2008 | 1.8-2.4 km | W, NW | 27-64 km | Typically 27- to 55-km-long plumes; Plume 64 km (18 Sep). |
| 25 Sep-26 Sep 2008 | 2.4 km | SE, NW | 27-74 km | -- |
| 29 Sep-30 Sep 2008 | 1.8 km | W | 64 km | -- |
| 06 Oct-16 Oct 2008 | 1.5-3.0 km | NW, WNW, W | 74-111 km | Chiefly plume heights of 2.4 km. Plumes 111 km (6-7 Oct), 101 km (13 Oct). |
| 17 Oct-28 Oct 2008 | 3.0 km | SW, W, WNW, NW | 46-222 km | Plumes 166 km (23-24 Oct), 222 km (26 Oct). |
| 31 Oct-11 Nov 2008 | 2.4 km | NW | 37-120 km | Plume 120 km (2 Nov), 37 km (9-11 Nov). |
| 15 Nov-06 Dec 2008 | 3.0 km | W, NW, NNW | 27-148 km | Typical plume length of 55 km. On 20 Nov and 5 Dec, Plumes 148 km (20 Nov), 129 km (5 Dec). On 2-3 Dec, minor low plumes. |
| 07 Dec-10 Dec 2008 | 2.4 km | E, ENE | 27 km | -- |
May 2008. Emissions were variable with some ejections being quite forceful; while at other times there were long periods of hazy emissions. Sub-continuous rumbling and roaring from the vent were reported, and was especially noticeable after heavy rain. The roaring was interpreted as a result of the interaction of water with hot rocks. Seismicity was dominated by low-frequency volcanic earthquakes, which increased from low levels at the beginning of the month to moderately high levels on and after the 15th. Ground deformation measurements continued to indicate slow subsidence. There were, however, two periods of significant uplift (1 cm each) on the 16th and 17th, each occurring over 4 hours. The speed of the uplift and then its return to 'normal' within 24 hours accompanied by increased roaring and occasional explosions, seemed to indicate this was a blockage in the vent that caused steam build up, followed by leakage and vent clearing.
June 2008. Continuous roaring and moderate ashfall ceased in June, but periodic (hours apart) explosions produced some large amounts of ash, followed by gentle steam emissions. The explosions were interpreted as the result of the vent becoming periodically blocked, due to a lessening of volume of the gas/steam emissions, enabling debris to accumulate rather than being instantly expelled. This process enabled the gas pressure to build until it was able to explosively clear the vent. The gas pressure then dropped and the debris began to accumulate again.
Although eruptions had ceased by the 10th, loud roaring continued and night glow was visible. On the 17th a small eruption occurred. Ground deformation measurements showed that during the latter half of June, the volcano was in a deflated state with the caldera stable. Seismicity was moderate.
July 2008. Tavurvur continued to generate occasional ash emissions accompanying white vapor in July (figure 49). The ash was mostly dark and gray throughout the month with some days being lighter. Ashfall was prevalent at Rabaul Town and other areas downwind, including Namanula Hill, Malaguna, Pilapila, Volavolo, Nonga, and Watom. Night glow was usually obscured by the ash cloud. Ground deformation measurements showed a 1 cm deflation since early June. Low-frequency earthquakes resulted from movement of steam or gas and ash in the conduit. Some of the earthquakes were associated with ash emissions.
 |
Figure 49. MODIS satellite image of a Rabaul ash plume on 3 July 2008. In this image, the volcano's plume differs from the nearby clouds in both color and form. Whereas the clouds are bright white with distinct margins, the plume is more diffuse in shape with a dingy gray-beige color. The relatively dark color of the plume suggests volcanic ash mixed with water vapor. Courtesy of NASA Earth Observatory. |
August 2008. Light to moderate winds continued to blow ash-rich plumes to the NW, while weak to moderate ash emissions continued. Rabaul Town has been the most affected, given its location along the main axis of the wind path and proximity to the volcano. The accumulated ash in Rabaul Town during the past 4-5 weeks has been very significant. Some visual change in the plume was evident shown by the slight increase in the number of light-colored ash emissions compared to previous weeks when dark emissions with more ash were dominant. Occasional roaring noises were heard, and weak to strong projections of incandescent lava fragments were present during moderate and strong explosions. Some small high-frequency earthquakes that began in late July appeared to be originating from NE of Rabaul Caldera, but exact locations could not be established.
September 2008. There was slight improvement in the conditions at Rabaul Town and the downwind areas during September, despite continuing ash emissions from Tavurvur. This resulted from decreased ashfall, changes in wind patterns, and light rains that inhibited ash re-suspension. The areas affected by the continuing ashfall included the villages between Rapolo and Raluan as well as Namanula Hill and Korere. On 24 September, flights to Tokua were cancelled due to ashfall.
October 2008. Tavurvur continued to emit occasional light to dark gray ash plumes in October. The changing wind directions continued to blow ash plumes to the W, NW, and E of Tavurvur. Loud roaring noises were heard on the 5th and a total of eight high-frequency earthquakes that originated NE of Rabaul were recorded that day. After a period of slight decrease in ash content, the eruptive activity began to change. On the 11th forceful emissions of pale gray to dark gray ash clouds occurred. Large explosions began on the 20th with emissions of ash-rich plumes. The ash plumes rose between 1-3 km above the summit before they were blown to the NW and W. A continuous red glow was visible at night, and roaring and rumbling noises continued. Ground deformation measurements from the water-tube tiltmeter continued to show the long-term deflationary trend at the central part of the caldera since July 2007. Minor inflation was noted during 7-11 October.
November 2008. Light to pale gray ash emissions continued in November, though the ash content was relatively low. Nearly continuous glow was visible at night. Occasional projections of incandescent lava fragments were produced by forceful emissions and weak explosions. No high-frequency volcano-tectonic earthquakes were recorded. The water-tube tiltmeter continued to show downtilt towards the center of the caldera, which was interpreted as a deflation of the central part of the caldera. Heavy rains washed excess ash from the upper slopes of the caldera wall down to low lying areas, causing flood deposition. An earthquake on 1 November in the Bismarck Sea did not result in a tsunami recorded by the RVO tide gauges.
1-12 December 2008. Activity continued in the first half of December, with steady emissions of ash-rich plumes. Some of the emissions were forceful and occasional roaring/rumbling noises were heard. Villages affected by the ash plumes included Rabaul Town, Malaguna, Rapolo, Raluan, Vulcan, Karavia, Davaon, Nguvalian, Raluana, Barovo, Butuwin and inland villages in the downwind paths. The down-tilt toward the center of the caldera, reported in previous months, stopped.
Information Contacts: Steve Saunders and Herman Patia, Rabaul Volcanological Observatory (RVO), Department of Mining, Private Mail Bag, Port Moresby Post Office, National Capitol District, Papua New Guinea (URL: http://www.pngndc.gov.pg/); NASA Earth Observatory (URL: http://earthobservatory.nasa.gov/).
Modest earthquakes and ash plumes since mid-December 2008
This report updates our discussion of Rabaul caldera's behavior after mid-December 2008 (BGVN 33:11). Following the large 1994 eruption (Blong and McKee, 1995; Blong, 2003; Nairn and others, 1995), the ongoing eruptions have been focused at one vent along the caldera's E side at the Tavurvur cone.
Between mid-December 2008 and 30 September 2009, minor eruptions at Tavurvur continued a period of intermittent activity that began in August 2006 (BGVN 31:02). Characteristic activity during this interval consisted of intermittent emissions of ash plumes and less frequent explosions sometimes ejecting incandescent lava fragments.
During mid-December 2008 through January 2009, earthquakes were weak to moderate, but increased to moderate to high in March before decreasing again after 10 April. The earthquakes were dominated by events associated with ash emissions.
Ground deformation measurements by GPS and tide gauge stations registered deflation during mid-December 2008 through mid-March 2009, sometimes with modest uplift. The water-tube tiltmeter data showed a modest down-tilt toward the caldera. In mid-March deflation slowed and then ceased. Deformation was stable until September 2009, when deflation increased slightly.
According to the Rabaul Volcano Observatory (RVO), during much of the above 10-month period, white plumes and gray ash plumes from Tavurvur rose a few hundred to several thousand meters above the crater. Glow was seen most nights and incandescent tephra was ejected.
RVO reported that, on 11 January, two small vents opened one-quarter of the way up the SW flank of Tavurvur and began to emit ash. Ash emissions from the volcano ranged from occasional to sustained over long periods during mid-December 2008 through April 2009 and, during this period, light-to-moderate ash fell on nearby communities, including Rabaul town (3-5 km NW). During 5-9 January 2009 ashfall caused Air Niugini to suspend all its flights to Tokua airport (about 20 km SE) and, according to a news article, a local shipping company offered to take up to 400 passengers to an airport in New Ireland Province, an area not affected by the ash plumes. In May through July, the amount of ashfall decreased, and periods of no ash were noted, but ashfall again increased somewhat in September. A MODIS satellite image of an ash plume was taken on 28 August 2009 (figure 50).
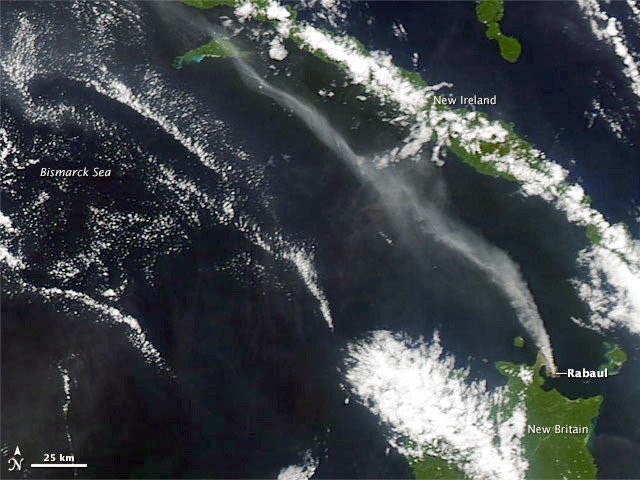 |
Figure 50. Rabaul volcano on the island of New Britain released a plume of ash and/or steam on 28 August 2009, as the Moderate Resolution Imaging Spectroradiometer (MODIS) on NASA's Aqua satellite captured this true-color image. The volcanic plume blews NW. Unlike the nearby clouds, the plume is slightly darker in color, with more diffuse outlines. Courtesy of NASA Earth Observatory. |
Although the weather often precludes satellite observations, the combination of reports from the Darwin Volcanic Ash Advisory Centre (VAAC) and the RVO can be tabulated to provide a sense of the ongoing activity (table 11).
Table 11. Ranges of ash plume altitudes and drift directions from Rabaul's Tavuvur cone between 10 December 2008 and 18 September 2009. A similar table was presented for the period 1 May-10 December 2008 in BGVN 33:11. Data courtesy of RVO and the Darwin VAAC.
| Date | Plume Altitude | Plume Direction | Plume Distances | Notes |
| 10 Dec-26 Dec 2008 | 1.7-3 km | NE, ENE, ESE, SE, W | -- | Gray ash, roaring noises, explosions, incandescent lava ejections. |
| 30 Dec-30 Jan 2009 | 1.7-2.4 km | W, NW, NNW, N, NE, SE, SW | -- | Gray ash. |
| 14 Jan-03 Feb 2009 | 1.7-3 km | N, NE, SE, SW | -- | Gray ash. |
| 04 Feb-23 Feb 2009 | 1.8-3 km | SE, S, W, NW | -- | -- |
| 02 Mar-26 Mar 2009 | 1-3 km | N, NW, SE | -- | White and gray ash; blue vapor visible between ash emissions. |
| 27 Mar-26 Apr 2009 | 0.5-3 km | S, SW, SE, NW, NE, W | 35-120 km | White with occasional gray or brown plumes. |
| 27 Apr-20 May 2009 | 2.4-3 km | NE, E, SE, SW | 30-40 km | Pale gray ash, white with occasional blue plumes. |
| 21 May-21 Jun 2009 | 1-4.3 km | S, E, SE, NW | 20-75 km | Pale gray ash, white with occasional blue plumes. |
| 22 Jul-02 Sep 2009 | 1.5-3 km | N, E, NW, SW, S | 25-280 km | -- |
| 04 Sep-18 Sep 2009 | 1.5-2.4 km | N, NW | 35-260 km | Gray ash and white plumes; ashfall in Rabaul town (3-5 km NW). |
MODVOLC satellite thermal alerts were common at Tavurvur during the year ending 7 October 2009. Alerts during this interval sometimes occurred multiple times per day but with frequent gaps of days, and in one case, about a month. A similar pattern was noted during 16 November to 23 July 2007 (BGVN 32:06 and 29:06).
References. Blong, R. and McKee, C., 1995, The Rabaul eruption 1994: Destruction of a town: National Hazards Research Center, Macquarie University, Australia.
Blong, R., 2003, Building damage in Rabaul, Papua New Guinea, 1994: Bull. Volc., v. 65, no. 1 [ISSN 0258-8900 (Print) 1432-0819 (Online)]
Nairn, I.A., McKee, C.O., Talai, B. and Wood, C.P., 1995, Geology and eruptive history of the Rabaul Caldera area, Papua New Guinea: Jour. Volcanol. Geotherm. Res., v. 69, p. 255?284.
Information Contacts: Rabaul Volcano Observatory (RVO), P.O. Box 386, Rabaul, Papua New Guinea; Darwin Volcanic Ash Advisory Centre (VAAC), Bureau of Meteorology, Northern Territory Regional Office, PO Box 40050, Casuarina, NT 0811, Australia (URL: http://www.bom.gov.au/info/vaac/); Hawai'i Institute of Geophysics and Planetology (HIGP) Thermal Alerts System, School of Ocean and Earth Science and Technology (SOEST), Univ. of Hawai'i, 2525 Correa Road, Honolulu, HI 96822, USA (URL: http://modis.higp.hawaii.edu/); NASA Earth Observatory (URL: http://earthobservatory.nasa.gov/).
Intermittent ash plumes and incandescent ejections continue through 2009
Eruptive activity at the Tavurvur cone at Rabaul continued during September-December 2009. This caldera has been frequently active since September 1994, and most recently the activity has consisted of intermittent ash explosions and ejection of incandescent lava fragments (BGVN 34:08). The volcano is monitored by staff at the Rabaul Volcano Observatory (RVO). They work closely with the Darwin Volcanic Ash Advisory Center, who use their satellite imagery analysis capabilities to track plumes downwind and warn aviators of volcanic hazards.
Mild eruptive activity at Tavurvur in September was characterized by emissions of pale gray, and sometimes dark gray, ash plumes. Roaring and rumbling noises that were heard frequently during the first half of September gradually declined, and by the last week of the month had virtually ceased. The strong explosions that began about 20 August continued during the first two weeks of September. Occasional glow was visible at night during September with some small projections of incandescent lava fragments observed on some nights.
RVO reported that during 25 September-8 October gray ash plumes rose 2 km above the crater. Ashfall was reported in Rabaul town (3-5 km NW) and surrounding areas. Occasionally, incandescence from the summit crater was seen at night and incandescent lava fragments were ejected. During the second week of October ash emissions became more diffuse, with occasional long periods of white vapor. During October, occasional dull glow was visible during the first week only. Low roaring and rumbling noises were heard during the second and last weeks of October.
Based on analyses of satellite imagery, the Darwin VAAC reported that on 6 October an ash plume rose to an altitude of 3 km and drifted 55 km NW. A similar plume on 9 October rose to an altitude of 2.4 km and drifted 75 km NW. On 15, 18, and 20 October, ash plumes rose to altitudes of 2.7-3 km and drifted 25-85 km NW, W, and NE. Ash plumes during 28-29 October rose to an altitude of 2.4 km and drifted 35-45 km N, E, and SE.
Seismicity in September was dominated by high-frequency signals associated with roaring and rumbling noises, overshadowing low-frequency signals from ash emissions. Seismic activity during October was associated mainly with the ash emissions and rumbling noises. No high- frequency earthquakes were recorded during September and October. Ground deformation data from the GPS and tide gauge stations generally showed deflation during the first three weeks of September. In October the data showed a slow deflationary trend.
On 9 November an ash plume rose to an altitude of 1.8 km and drifted 110 km NW. During 11-14 November ash plumes rose to an altitude of 2.4 km and drifted 75-150 km NW and W. On 19 November ash plumes rose to an altitude of 2.1 km and drifted 35-90 km NW. During 20-26 November dense white plumes and gray ash plumes rose from Tavurvur. Strong explosions produced ash plumes that rose 1.5 km above the summit and showered the flanks with lava fragments that were incandescent at night. Shock waves rattled windows in the Kokopo area, ~ 20 km SE. Occasional incandescence from the summit crater was noted.
Dense white plumes and gray ash plumes rose above Tavurvur during 27 November-3 December. Strong explosions produced ash plumes that rose 1.5 km above the summit and showered the flanks with lava fragments that were incandescent at night. Shock waves rattled windows in the Kokopo area. Incandescence from the summit crater was occasionally noted. During 2-4 December, ash fell in Rabaul town (3-5 km NW) and other villages downwind. Activity consisted of a few strong explosions towards the beginning of the 4-10 December reporting period, and emissions of gray ash afterwards. Diffuse white vapor was emitted during quieter intervals. Ash plumes rose 1 km above the summit and drifted SE towards Tokua and the Tokua airport, causing suspension of some flights. Based on analyses of satellite imagery, the Darwin VAAC reported that during 5 and 7-8 December ash plumes rose to an altitude of 2.4 km and drifted 45-55 km E; on 14 December another ash plume drifted 35 km SE.
No emissions from the crater was observed on most days during 21-31 December, although there were occasional white steam plumes or blue plumes. On 23 December ash emissions rose less than 200 m above the cone. The Darwin VAAC reported that on 31 December an ash plume rose to an altitude of 2.4 km and drifted less than 30 km SE.
Information Contacts: Ima Itikarai, Rabaul Volcano Observatory (RVO), P.O. Box 386, Rabaul, Papua New Guinea; Darwin Volcanic Ash Advisory Centre (VAAC), Bureau of Meteorology, Northern Territory Regional Office, PO Box 40050, Casuarina, NT 0811, Australia (URL: http://www.bom.gov.au/info/vaac/).
Quiet during early 2010 with few emissions or earthquakes; 2008 summary
This report discusses quiet at Tavurvur cone during the first quarter of 2010. Reports only covered parts of the reporting interval, 1 January to 8 April 2010. A report discussed in a subsection below provides an overview for 2008, including ashfall, mudflow, aviation, stress on inhabitants, and monitoring instruments. Our previous report noted intermittent ash plumes and incandescent ejections during 2009 (BGVN 34:11).
According to the Rabaul Volcano Observatory (RVO), ash emissions were absent on most days at Tavurvur cone during 1-25 January 2010, but steam plumes, white to blue in color were occasionally seen. Approximately three brown-gray ash clouds were produced on 3 January. Minor ash emissions on 8 January rose less than 200 m above the cone. A few small low-frequency earthquakes took place during 1-10 January, but they then remained absent through at least 25 January. Volcano-tectonic earthquakes were noted on 8 and 14 January. One ash cloud was noted on 31 January. GPS measurements and tide gauge data continued to show minor uplift?rates of ~1 cm every 1 to 2 weeks during January 2010.
Based on information from the United Kingdom's National Weather Service office in Port Moresby, the Darwin Volcanic Ash Advisory Centre (VAAC) reported that on 18 January, an ash plume from Tavurvur cone rose to 2.4 km altitude.
RVO reported that during 21-27 February and 2-8 April, the volcano was quiet with small-to-moderate volumes of white vapor emissions and small low-frequency earthquakes. During the later interval the cone was not emitting ash and sulfur dioxide (SO2) fluxes remained at the lowest levels since measurements on the gas began in June 2009. After intervals of rainfall, steam emissions became voluminous.
RVO advised people to avoid entering the crater because of slope instability and gas accumulation in low lying areas. As of early 2010, the last posted MODVOLC thermal alerts at Rabaul took place 24 November 2009.
Summary of 2008 activity. Although Bulletin reports covered the year 2008 (BGVN 33:03, 33:11, 34:08), a recent report (Arumba, 2009) provides an authoritative summary touching on a broader range of topics.
Arumba (2009) stated that "Tavurvur... erupted throughout 2008. The level of eruption was relatively mild during the first half of the year, but this changed during the second half when the mode of eruption changed from sporadic ash emissions occurring at long intervals to almost sub-continuous emissions. Between July and October/November SE winds blew the ash-rich plumes towards Rabaul Town and the surrounding areas and deposited significant volumes of ash and affected the everyday livelihood of people and gave rise to the emergence of health-related issues. The ash deposits turned into mudflows as soon as rain began to fall in October and severely affected the entire town of Rabaul and the surrounding areas.
"The eruption also affected the domestic aviation industry when ash-rich plumes frequented the air space of the flight path and deposited considerable amounts of ash on the runway. A flight service to the only main airport that serves East New Britain Province was disrupted, severely affecting the traveling public.
"The seismic monitoring network at Rabaul was maintained at a reasonable level. A couple of stations which had been off from the start of 2008 were restored. The tide gauge network consisting of three stations was partially restored after a long period of inactivity. An upgrade of the real-time Global Positioning System (GPS) of four stations for deformation measurements began during the last quarter of the year. By the end of the year three of the stations were restored . . . ."
Reference. Arumba, J., 2009, Agenda Item 3, Coordinating Committee for Geoscience Programmes in East and Southeast Asia (CCOP), 46th CCOP Annual Session, 18-23 October 2009, Vungtau, Vietnam; Member Country Report of Papua New Guinea, October 2009, Annual member country report, 16 p.
Information Contacts: Ima Itikarai, Rabaul Volcano Observatory (RVO), P.O. Box 386, Rabaul, Papua New Guinea; Darwin Volcanic Ash Advisory Centre (VAAC), Bureau of Meteorology, Northern Territory Regional Office, PO Box 40050, Casuarina, NT 0811, Australia (URL: http://www.bom.gov.au/info/vaac/).
After months of quiet, ash-bearing eruptions on 23-25 July 2010
Eruptions at Rabaul's Tavurvur cone resumed on 23 July 2010 after nearly seven months without ash emissions. As previously noted, Tavurvur was quiet between 1 January to 8 April 2010 (BGVN 35:02).
On 9 April 2010, the Rabaul Volcano Observatory (RVO) reported that deformation measurements at Rabaul caldera during the previous 3-4 months had showed an inflationary trend with a total of 4 cm of uplift. During 2-8 April seismicity was low and variable amounts of white vapor rose from Tavurvur cone.
According to RVO, Tavurvur cone erupted on 23 July 2010 after increased seismicity, likely beneath Tavurvur cone, was detected the previous day. The series began with a few small hybrid earthquakes, followed by small low-frequency earthquakes, then continuous volcanic tremor starting at 1034 on 22 July; the eruption followed at 1300 on 23 July.
The eruption began with discharge of diffuse white plumes, followed by pink-gray fumes with low ash content. A strong odor of hydrogen sulfide was noted, and a diffuse cloud rose 1 km and drifted NW. A few hours later, observers saw billowing gray clouds, accompanied by roaring and rumbling noises. Ashfall was reported in areas to the cone's NW and NNW.
RVO reported that, during 23-25 July, seismicity was variable. Ash emissions and ashfall continued in areas to the NW. Visibility remained poor in Rabaul town (3-5 km NW of Tavurvur) due to ash made airborne by the passage of moving vehicles. Ash emissions ceased on 25 July. Later that day and into 26 July only diffuse brown-tinted vapor plumes were emitted and seismicity was very low.
After the eruption of 23-25 July, GPS data showed deflation of Tavurvur cone. Seismicity was very low, and diffuse white plumes were emitted during 26-30 July.
A video (by BlinkyBill55) showed the ash-bearing eruption of 24 July and the associated caption described it as a "short but explosive event." The eruption scene depicted on the 9-second-long video showed various eruptive phases that were sometimes dominated by steam and at other times by dark ash. No clear MODVOLC thermal alerts occurred in the year ending 21 November 2010.
Reference. Johnson, RW, Itikarai, I, Patia, H, and McKee, C, 2010, Rabaul Volcano Workshop Report; Volcanic systems of the Northeastern Gazelle Peninsula, Papua New Guinea: synopsis, evaluation, and a model for Rabaul volcano, Rabaul Observatory Twinning Program, Dept. Of Mineral Policy and Geohazards Management (DMPGM), Government. of Papua New Guinea and Australian Agency for International Development (AusAID), Australian Government, 84 p., ISBN 978-1-921672-89-7.
Information Contacts: Rabaul Volcano Observatory (RVO), PO Box 386, Rabaul, Papua New Guinea; BlinkyBill55 (URL: http://www.youtube.com/user/BlinkyBill55).
Two small eruptions since one in July 2010
A significant volume of ash from the Tavurvur cone of Rabaul volcano fell in the surrounding region during an eruption on 23-24 July 2010 (BGVN 35:09). Moderate SE winds and moving vehicles raised dust and presented difficult conditions for residents. Similar conditions were reported by the Rabaul Volcano Observatory (RVO, a facility that sits 6.75 km NW of Tavurvur) through the rest of 2010 and early into 2011. This report discusses behavior as late as mid-2011. This report also draws attention to a comprehensive overview of the Rabaul volcano by Johnson and others (2010), the result of the Rabaul Volcano Workshop held in the town of Rabaul (about 6 km NW of Tavurvur), Papua New Guinea during 17-18 November 2009. Several of the maps and figures from that report appear below.
RVO reported that post-eruption processing of Global Positioning System (GPS) data showed slight deflation after the eruption of 23-25 July 2010. Sulfur dioxide (SO2) gas measurements on 28 July were low. RVO opined that the lack of seismicity suggested Tavurvur would remain quiet; however, changes in the status of the volcano can happen very rapidly as was the case on 23 July. For the period from 26 July to 12 August 2010 no ash emissions occurred from Tavurvur cone. Only very small volumes of white vapor were released. No audible noises were reported and no incandescence was observed. In addition, seismicity was very low.
GPS measurements on Matupit Island continued to show inflation; long-term information indicated further increase in the rate of uplift from mid-February 2011 onwards.
RVO had noted a swarm of high frequency volcano-tectonic earthquakes on 28 February 2011 in the caldera's NE sector. This swarm followed the occurrence of both small, discrete, high-frequency earthquakes and an emergence of low-frequency earthquakes. Previous observations during the past 16 years suggest strong connections between such NE-sector earthquakes and either renewed eruption or increased activity from Tavurvur. However, in this case RVO did not report increased activity following the 28 February seismic swarm.
RVO reported that Tavurvur remained quiet throughout the month of March 2011. Activity consisted mainly of very small volumes of thin white vapor, which became denser during rain and cool conditions. No audible noises were heard and no glow was observed at night. That said, based on analyses of satellite imagery, the Darwin VAAC reported that on 29 March an ash plume rose to an altitude of 3 km and drifted over 53 km NW.
During an on-site inspection in March 2011 steady dull glow was observed in three small vents on the floor of the crater, indicating the presence of magma near the surface. Incandescence on the crater floor was still present when the volcano was observed during another on-site inspection in April 2011, however the vent opening had become enlarged due to collapse of material surrounding the earlier vents.
During April and most of July 2011, RVO reported variable amounts of white vapor emissions, occasionally tinted blue, and no audible noises. About twelve earthquakes were recorded in July; the most notable events occurred on 12, 15, 19, 20, and 27 July. A new eruption characterized by emergent low-frequency tremors and slowly rising gray ash plumes occurred on 29 July 2011 at 1332. A single explosion occurred on 30 July at 0106 which probably produced light ashfall to the NW. The explosion produced a short explosion noise. A brief period of harmonic volcanic tremors was recorded between 0740 and 0758 hours on 1 August 2011, presumably caused by forceful vent degassing. There was no short-term anomalous seismicity prior to the start of the eruption.
GPS measurements on Matupit Island continued to show long-term inflation; about 10-11 cm of uplift was recorded since August 2010. There was a slight drop in the rate of the uplift in early-to mid-July 2011. The drop did not affect the long-term trend of uplift significantly.
RVO reported that white vapor plumes rose from the Tavurvur cone during 1-3 August 2011. An explosion on 3 August produced a gray ash plume that rose 1 km above the crater and drifted NNW. Sustained emissions of pale-gray ash continued for about an hour afterwards. In addition, ash deposited at the former airport was re-suspended and blown NW into the E part of Rabaul town (3-5 km NW) and towards Namanula hill (3 km W). Seismicity was very low, although two periods of harmonic tremor on 2 August and the explosion and ash emissions on 3 August were detected.
During 4-5 August 2011 gray ash emissions periodically continued, punctuated by a few large and notable explosions. Ash plumes from the explosions rose 1 km above the crater and drifted N and NW producing fine ashfall in the E part of Rabaul town, Namanula Hill, and further downwind towards Tavui Point. Moderate seismicity consisting of low-frequency earthquakes, explosions, and volcanic tremors with variable durations was detected. During 5-9 August activity increased, characterized by an increased frequency and duration of ash emissions and more explosions. About 34 explosions were recorded between 5 and 8 August. Ash-rich clouds that rose 1.5 km above the crater drifted NW, causing ashfall in most parts of Rabaul town and in areas between Toliap and Nonga (10 km NW).
With the resumption of ash emissions, the trend of uplift during the past year, discrete volcano-tectonic earthquakes detected during the past two months, and the magnitude of the earthquake swarm that occurred in the caldera's NE sector in late February 2011, RVO warned that possible sporadic ashfall may occur in the future.
Report of the 2009 Rabaul workshop. The Rabaul Volcano Workshop of 2009 was held to review, synthesize, and assess geoscientific information on the volcanoes of the NE Gazelle Peninsula and identify needed instrumental monitoring and scientific research directions. Several figures from the workshop report (Johnson and others, 2010) give current ideas about Rabaul and vicinity. This includes an array of volcanoes at the N end of the Gazelle Volcanic Zone (figure 51), New Britain volcanism (figure 52), the Nengmutka-to-Tavui volcanic centers (figure 53), and the spatial distribution of earthquakes (figure 54). In addition, two kinds of cross-sectional models of Rabaul are included (figures 55 and 56).
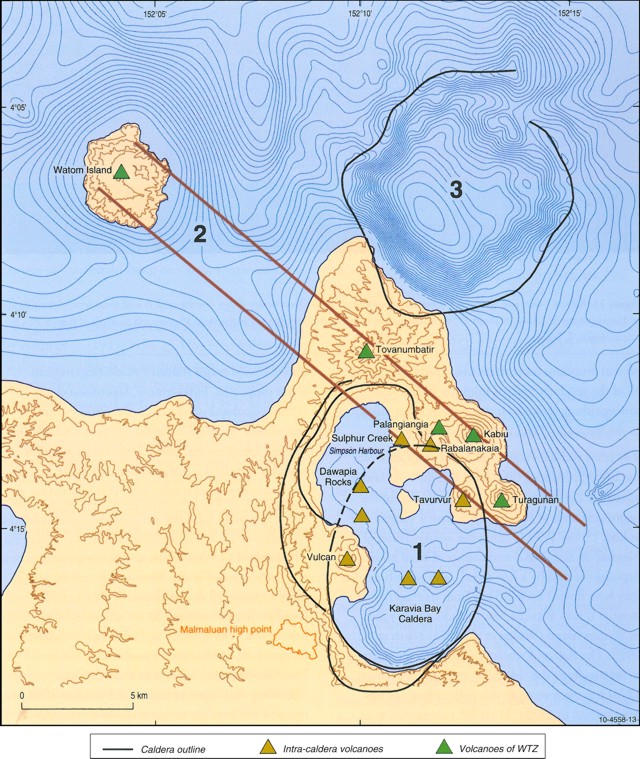 |
Figure 51. Map of the N end of the Gazelle volcanic zone with the location of the Rabaul caldera and the active cones of Tavurvur and Vulcan. Shown schematically are (1) the nested calderas of Rabaul volcano (called the Blanche Bay Caldera Complex), (2) volcanoes of the Watom-to-Turagunan Zone (WTZ), and (3) Tavui caldera (50 m isobaths in the ocean). From Johnson and others (2010-their figure 13, page 17). |
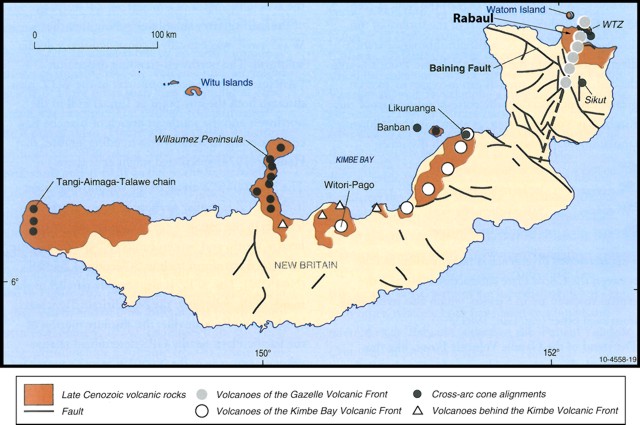 |
Figure 52. Volcanic centers and faults of New Britain. Dashed line represents the S extension of the Gazelle volcanic front to the Wide Bay fault. Based on the geological map compiled by D'Addario and others (1976). From Johnson and others (2010-their figure 19, page 27). |
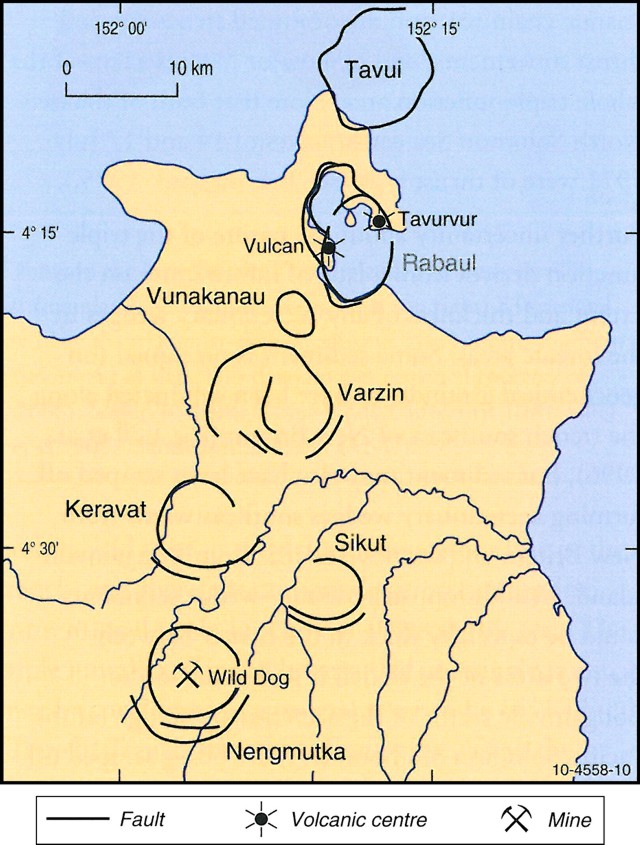 |
Figure 53. Collapse structures comprising the Nengmutka-to-Tavui volcanic centers in the Gazelle volcanic zone. From Johnson and others (2010-their figure 10, page 12). |
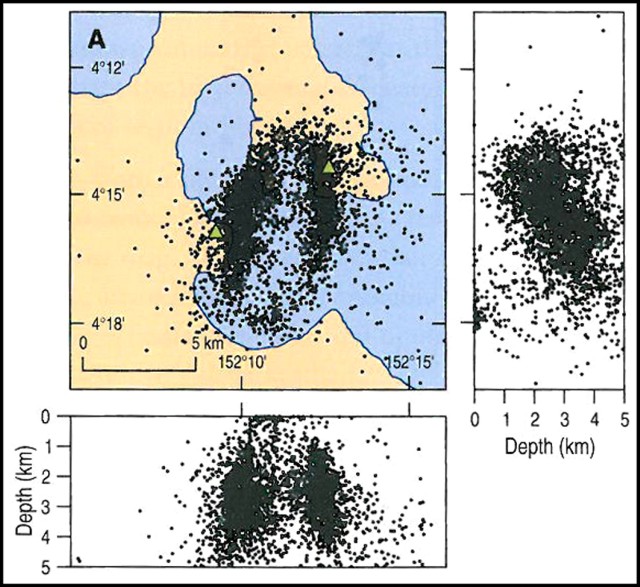 |
Figure 54. Relocated hypocenters for Rabaul from a study conducted during August 1997 to January 1998, a map in a horizontal view and two cross-sections, one N-S (right) and one W-E (bottom). Hypocenters form an elongate ring-fault pattern; the cross-sections suggest that the ring faults are straight sided in the N-looking (lower) figure and more complex in the W-looking figure (at right). From Johnson and others (2010-their figure 32A, page 44). |
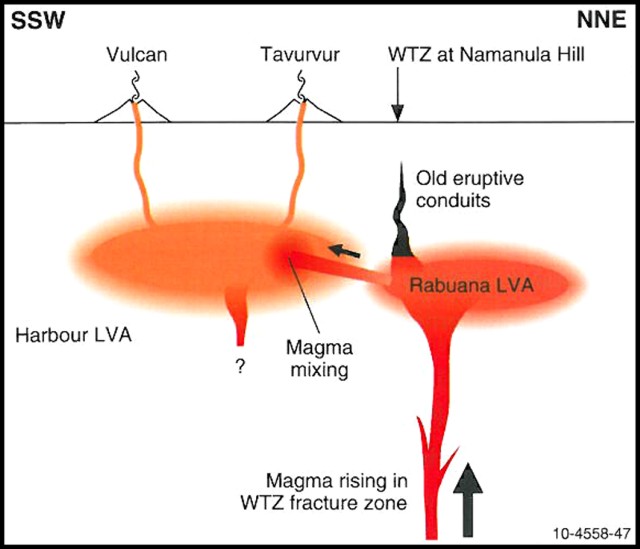 |
Figure 55. An interpretive cross-section depicting magma trelationships for Rabaul (location of the roughly N-S line shown in the next figure). The model given involves mixing between mafic magma, which is being injected (inclined arrow) from the Rabuana LVA (seismic low-velocity anomaly) into the dacite magma of the Harbour LVA. Gradational boundaries signify crystal/melt mushes of old magma and the absence of precise boundaries for the two magma reservoirs. Vulcan and Tavurvur cones are projected onto the plane of the cross section. The exact position of the magma-feeder zone beneath the Rabuana LVA is unknown and is here drawn rather arbitrarily just to the NE of the WTZ itself. From Johnson and others (2010-their figure 47, page 68). |
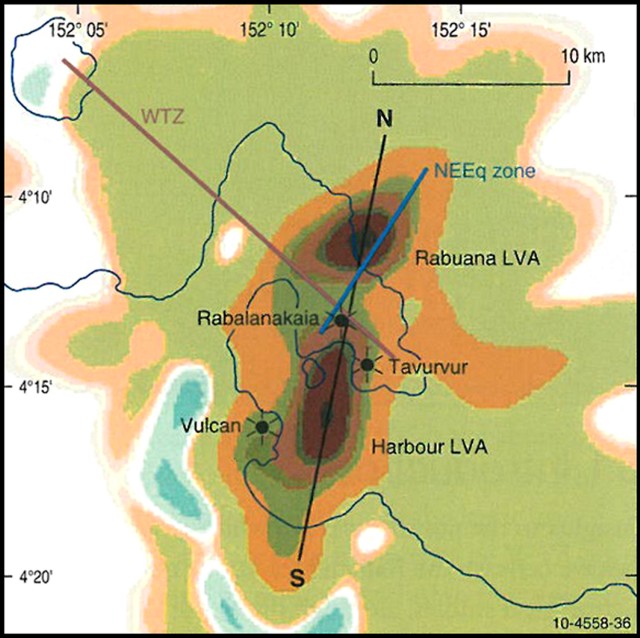 |
Figure 56. A Rabaul map based on seismic profiling. The map shows P-wave velocity perturbation for a 5-km-deep, horizontal slice. It shows the so-called Harbor LVA (seismic low-velocity anomaly) and the Rabuana LVA. Rabalanakaia (a cone of Rabaul volcano) lies between the two anomalies, and the Harbour LVA lies between Tavurvur and Vulcan cones. The WTZ (Watom-to-Turagunan Zone-see figure 51) and North East Earthquakes (NEEq) fault zone intersect near Rabalanakaia. The line labeled N-S signifies the cross-section in the previous figure. From Johnson and others (2010-their figure 36, page 49). |
According to the workshop report, over the last 15 years Tavurvur has been erupting with a Volcanic Explosivity Index (VEI) of 3 to 4. The Rabaul caldera has produced a variety of products due to magma mixing.
The report noted that Tavurvur's eruption style differs from the other volcanoes in the caldera. It has two different styles of eruptions: phreatomagmatic and Vulcanian-Strombolian. Tavurvur's eruptions last significantly longer. These facts, in addition to Tavurvur's emission of sulfur dioxide (SO2), lead to the conclusion that Tavurvur is part of an active geothermal system. This geothermal system overlies a magma chamber that is in contact with basalt (leading to magma mixing). That magmatic system is actively degassing.
References. D'Addario, G.W., Dow, D.B., and Swoboda, R., 1976, Geology of Papua New Guinea, Bureau of Mineral Resources, Canberra, Australia.
Johnson, R.W., Itikarai, I., Patia, H., and McKee, C.O., 2010. Volcanic systems of the Northeastern Gazalle Peninsula, Papua New Guinea: Synopsis, evaluation, and a model for Rabaul volcano; Rabaul Volcano Workshop Report, Papua New Guinea Dept.of Mineral Policy and Geohazards Management and the Australian Agency for International Development, 84 p. [Copies available from Wally Johnson (wallyjohnson _at_ grapevine.com.au), and Rabaul Volcano Observatory, P.O. Box 3386, Kokopo, East New Britain Province, Papua New Guinea].
Information Contacts: R.W. Johnson, Rabaul Volcanological Observatory Twinning Program, Visiting Fellow, College of Asia and the Pacific, Australian National University, Canberra, Australia; Darwin Volcanic Ash Advisory Centre (VAAC) (URL: http://www.bom.gov.au/info/vaac/); Rabaul Volcano Observatory, Department of Mineral Policy and Geohazards Management, Volcanological Observatory Geohazards Management Division, P.O. Box 3386, Kokopo, East New Britain Province, Papua New Guinea.
Variable but often modest eruptions during mid-2011 through 2013
The last Bulletin report on Rabaul Caldera (BGVN 36:07) recorded dozens of explosions in the first week of August 2011. The explosions produced ash-rich clouds that drifted NW and deposited ash in areas from Rabaul Town (3-5 km NW) to Nonga Village (10 km NW) (figure 57). This report covers activity from the end of August 2011 to December 2013, using data primarily compiled from the Rabaul Volcano Observatory (RVO) and the Darwin Volcanic Ash Advisory Center (VAAC). During this time, hundreds of small earthquakes were detected, almost all of which occurred congruently with ash emissions or explosions. One notable development occurred in July 2013, when a new lava dome formed on Tavurvur in the middle of a long period of eruptive activity running from April to September of the same year. Shortly after the dome's formation, strong venting of ash at Tavurvur gave way to explosions on 10 July that continued until 5 September, 2013. A second period of explosive activity began on 13 November, 2013, and terminated at the end of November.
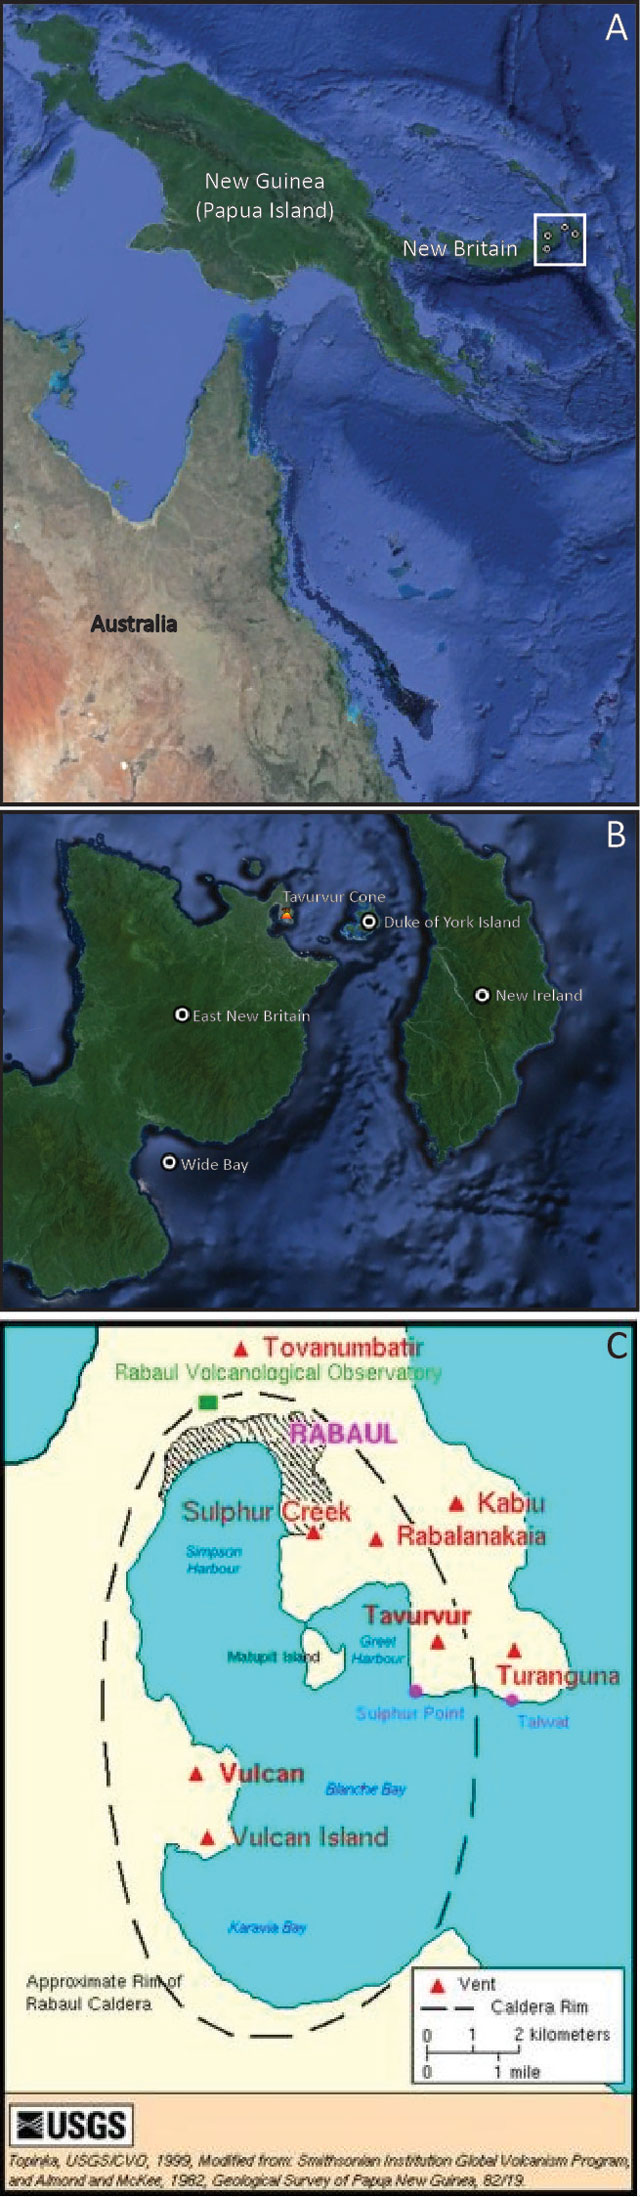 |
Figure 57. Location maps of Rabaul and Tavurvur Cone (a and b). White boxes in a and b zoom to show maps b and c, respectively. Maps derived from Google Earth Landsat images and modified to show regional reference points in relation to Rabaul's Tavurvur Cone. (c) map of Rabaul caldera derived from work by Almond and McKee and prepared by Lyn Topinka (US Geological Survey 1998). |
August 2011 to November 2012. Rabaul Caldera was generally tranquil from 12 August 2011 to November 2012. During this time, only emissions of white vapor were seen rising from the cone, which became denser with the rain and humidity or periods of cool temperatures. Seismicity was low although several high frequency earthquakes NE of Tavurvur were recorded on 6 June 2012. GPS instruments recorded at least 2 cm of inflation (greater than the long-term decadal trend in inflation) and sub-continuous tremor was recorded by four local seismic stations 17-20 September 2011. Diffuse SO2 emissions recorded in late November 2012.
January and February 2013. At 2128 on 19 January 2013, Rabaul town residents and volcanologists at RVO heard loud rumbling and roaring noises from Tavurvur, marking the beginning of a period of activity that lasted until 2 February 2013 (table 12). RVO determined on the morning of 20 January that small discrete explosions had produced ash plumes during the night. Those plumes reached a maximum height of 500 m above the crater, and the prevailing winds pushed them E and SE.
Table 12.Maximum height above the crater, date, direction, and color for plumes from Tavurvur Cone from 19 January, 2013 to 7 February 2013. Seismicity during some of the events is also described. Courtesy of RVO.
| Date | Plume Height (m) | Direction | Color | Seismicity |
|---|---|---|---|---|
| 1/19 | 500 | E, SE | N/A | N/A |
| 1/20 | 200 | E, SE | Light Gray | N/A |
| 1/22 | 200 | S, SSE | Gray | N/A |
| 1/22 (2148) | 2000 | SE, ESE | Gray | N/A |
| 1/23 | 2000 | SE | Light Gray | Numerous, associated with ash emissions |
| 1/24 | 1000 | E, ESE | Light Gray | Numerous, associated with volcanic degassing |
| 1/25 | 700 | E, ESE | Light Gray | Low, associated with ash emissions |
| 1/26 | 500 | ESE | Gray | Low, associated with ash emissions |
| 1/27 | 500 | ESE | White and Light Gray | Low, associated with ash emissions |
| 1/28 | 500 | ESE | White and Light Gray | Low |
| 1/29 | 500 | E, ESE | Light Gray | Low |
| 1/30 | 500 | ESE | Light Gray | Low |
| 2/1 | 500 | E, ESE | Light Gray | Low |
| 2/2 | 500 | E, ESE | Light Gray | Low |
| 2/3 | 2000 | E, NE | Dark Gray | Low, associated with ash emissions |
| 2/4 | 2000 | E, SE | Light Gray | Low, associated with ash emissions |
| 2/5 | 2688 | E, ENE | Pale Gray | Low, associated with ash emissions |
| 2/6 | 2000 | NW | Pale Gray | Low, associated with ash emissions |
| 2/7 | 2000 | NW | Pale Gray | Low, associated with ash emissions |
On 21 January at 0930, RVO noted an increase in emissions from Tavurvur consisting of mostly water vapor and low volumes of ash that created a plume ranging in color from white to light gray. The plume rose to a maximum height of 200 m and drifted SW. These conditions remained constant for the next 24 hours, except for a loud explosion and several minutes of roaring and rumbling at 2335 that night. The vegetation on the north side of South Daughter (also known as Turangunan, see figure 57) turned brown, suggesting the release of SO2 from the volcano.
Further increase in emissions was noted at 0930 on 22 January, and plumes rose to a maximum height of 200 m drifting to the SE. That night at 2147 a large explosion ejected both a light gray plume low in ash content and small amounts of incandescent spatter. Explosive noises were heard throughout the night and continued through 23 January. Both diffuse and dense ash plumes drifted SE. RVO remarked that calm meteorological conditions allowed the plume to ascend to a maximum altitude of 2,000 m. Activity at Tavurvur through 7 February was characterized by small-to-moderate explosions producing light-to-dark-gray ash clouds of low ash content and variable plume heights, constant white vapor, and low-to-moderate levels of roaring and rumbling. Ash affected areas downwind; ABC Australia Network News reported that the ash shut down New Britain airports until 31 January.
Ash fell on Turangunan on 3 February. On 5 February, the Darwin VAAC reported a pale gray plume that rose to 2,000 m altitude and drifted E and ENE. Very fine ash fell in Rabaul Town on 6 and 7 February due to a southeasterly wind blowing the plume NW from Tavurvur. There were no other affected areas.
March 2013. RVO recorded increased ash emissions on 3 March. Those emissions were brown and continued until 7 March. Volcanologists at RVO reported that the emissions increased over time throughout the latter part of 3 March and by 6 March were occurring nearly every minute. At the same time, many small earthquakes associated with ash emissions were detected. Four regional earthquakes were felt on 5 March at 1358, 1606, and 1621, and on 6 March at 1953. These earthquakes ranged from a magnitude of 5.1 to 5.4, originating SSE from Rabaul to the east of Wide Bay (see figure 57 for reference) at depths of 50-60 km. They were felt in Rabaul Town with intensities III - IV. RVO did not report any change in volcanic activity at this time. Earthquakes on 7 March occurred with instances of ash emissions, which had declined in frequency to once every few hours.
Tavurvur remained quiet until 12 March, when an explosion at 1108 expelled a dark gray-to-black billowing ash column for 40 minutes. Afterwards, emissions changed to billowing white ash clouds that rose 300 m and drifted SE.
April 2013 to September 2013. Activity at Tavurvur from 14 April until 9 July was characterized by ongoing roaring, rumbling, and diffuse to dense white plumes, including some occasionally laden with fine ash particles (table 13). Throughout the period, some low intensity earthquakes and some explosions were detected, which ejected ash clouds to variable heights. Many ash plumes were blown to the SE until 30 April, when the wind began blowing to the NW. As a result, downwind areas including Rabaul town experienced ashfall from 30 April to 9 September.
Table 13.Table describes the height, color, direction, and plume densities from Rabaul's Tavurvur cone as well as the areas affected by ash fall from 14 April to 5 September 2013. Note that towns referenced here can be found in figure 57. Courtesy of RVO and Darwin VAAC.
| Date | Plume Height (m) | Ash Color | Direction | Notes | Areas affected by ash fall |
| 4/14 - 4/17 | 100 | White | SE | diffuse to dense | None |
| 4/18 | 5288 | White | 35km E | None | |
| 4/19 - 4/23 | 100 | White | SE | diffuse to dense | None |
| 4/24 - 4/28 | 200 | White | SE | diffuse to dense | None |
| 4/29 - 5/16 | 200 | White | NW | diffuse to dense | Rabaul Town |
| 5/17 - 6/15 | 800 | White | NW to SE | diffuse to dense | Rabaul Town |
| 6/16 - 6/30 | 1000 | White to Light Gray | NW to SE | diffuse to dense | Rabaul Town |
| 7/1 - 7/9 | 2000 | White to Gray | NW | diffuse to dense | Rabaul Town |
| 7/10 -7/14 | 2000 | Gray | NW | Moderate to dense | Rabaul Town |
| 7/15 - 7/21 | 2000 | Light to Pale Gray | E, NNE, NW, W, SW, | Energetic explosions, fine ashfall | Between Nodup and Rapolo, Rabaul town |
| 7/22 - 7/31 | 2000 | Light to Pale Gray | E, NNE, NW, W, SW, | Energetic explosions, fine ashfall | Between Namanula and Malaguna No. 1, Rabaul Town, Malaguna No. 2, Vulcan Area |
| 8/1 - 8/24 | 1000 | Pale Gray | NW | Forceful emissions | east Old Rabaul, Namanula Hill, Nonga Area, Rabaul Town, Malaguna No. 1 |
| 8/29 | 1800 | Pale Gray | 150 km NW | Forceful emissions | east Old Rabaul, Namanula Hill, Nonga Area, Rabaul Town, Malaguna No. 2 |
| 8/26 - 8/28 | 1000 | Pale Gray | NW | Forceful emissions | east Old Rabaul, Namanula Hill, Nonga Area, Rabaul Town, Malaguna No. 3 |
| 8/29 | 2100 | Pale Gray | 40 km NW | Forceful emissions | east Old Rabaul, Namanula Hill, Nonga Area, Rabaul Town, Malaguna No. 4 |
| 8/30 - 8/31 | 1000 | Pale Gray | NW | Forceful emissions | east Old Rabaul, Namanula Hill, Nonga Area, Rabaul Town, Malaguna No. 5 |
| 9/1 - 9/5 | 50 | Pale Gray | NW | Strong winds re-suspended old ash | Rabaul Town, exposure low - moderate |
On 12 June 2013 a small lava dome, estimated to be 25-30 m high, began forming on the floor of Tavurvur. Photos taken that day appear as figures 58 and 59.
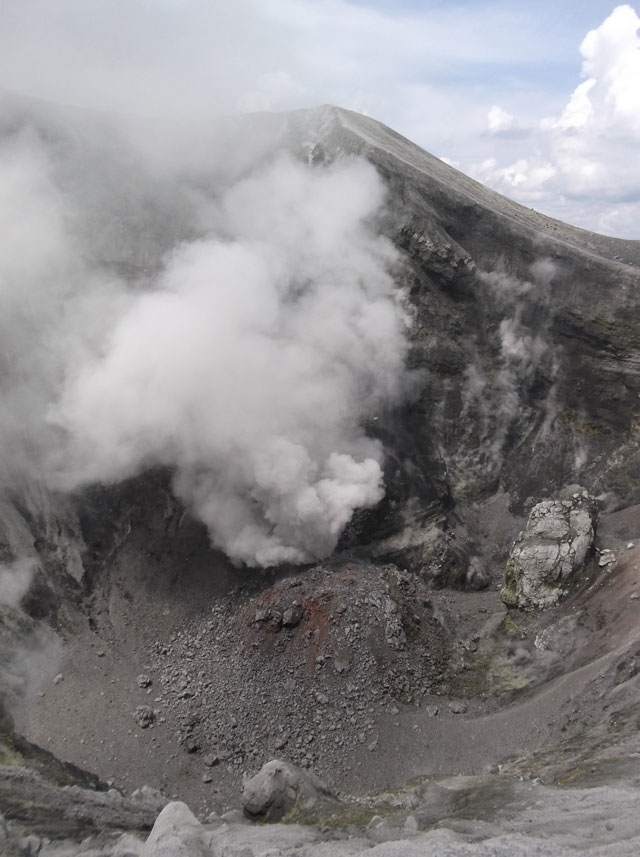 |
Figure 58. Photo of the new lava dome forming on 12 June 2013. Courtesy of RVO. |
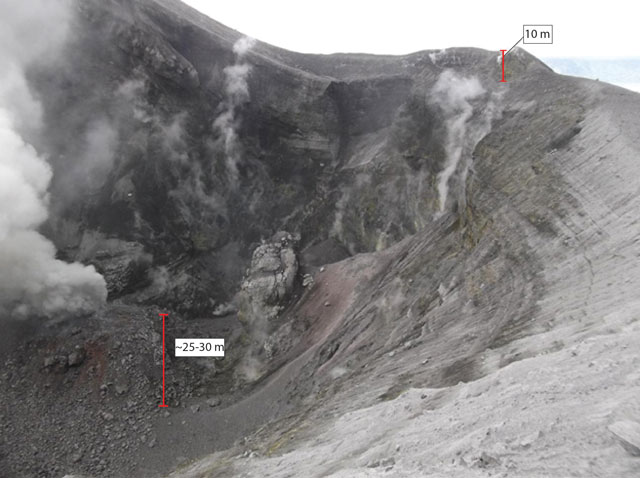 |
Figure 59. A new lava dome in Tavurvur, taken on 12 June 2013 with estimated scale bars. Courtesy of the RVO. |
On 26 June, incandescence was observed at a vent on the dome and was associated with strong venting of steam and ash, which continued to 14 July.
A few discrete explosions occurred on 10 July, producing moderate to dense gray ash clouds. This low level eruptive activity persisted until 9 September, with energetic explosions producing mostly light-to-pale-gray ash clouds that drifted NW and affected areas downwind. The eruptions occurred at a varying range of intervals from ten's of seconds to hours.
From 14 April to 14 July, several small low-frequency earthquakes occurred. The majority of these were too small to be located, but time series data suggest that they originated near Tavurvur. In early July, a recently restored seismic station near Tavurvur confirmed that earthquakes were occurring beneath Tavurvur volcano. The station also detected smaller earthquakes that other seismic stations had not recorded. On 15 July, the level of seismicity increased, with events concurrent with ash emissions. On 1 August, seismicity increased and remained elevated until 9 September; seismic events continued to be associated with ash emissions.
Ground deformation during this entire period remained relatively stable, reflecting the long-term trend of uplift. On 11 May, the base station antenna broke, resulting in a loss of GPS data. Ground measurements using water tube tilt meters showed a slight inflation recorded at Matupit Island (see figure 57). Throughout the entire month of August, ground measurements showed slight deflation, but the long term inflation trend resumed beginning on 1 September.
During 1-5 September, RVO stated that "people in Rabaul town reported an odor reflective of chlorine. The substance that caused the odor is normal output of volcanic processes but an uncommon one. Its presence does not represent anything unusual or increase in volcanic activity."
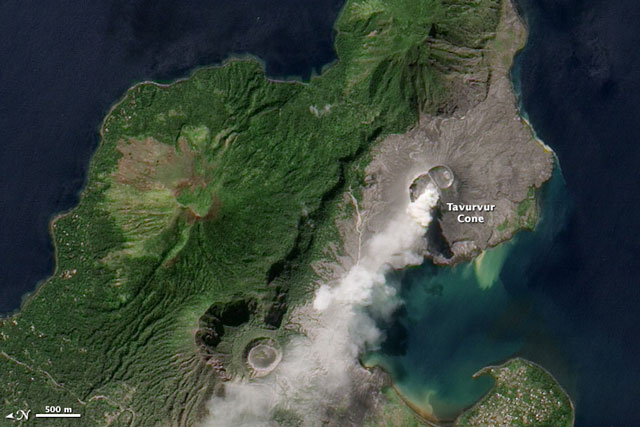 |
Figure 60. This natural color image of Tavurvur Cone emitting an ash plume on 6 August 2013 was acquired by the Advanced Land Imager (ALI) on the Earth Observing-1 (EO-1) satellite, and posted on the NASA Earth Observatory website. Note scale and N arrow at far left. Courtesy of Jesse Allen and Robert Simmon (Nasa Earth Observatory). |
September to November 2013. The Darwin VAAC observed one ash plume on 27 September 2013. The plume rose to an altitude of 2,400 m and drifted 110 km NE and NW. No other activity was recorded until mid- November.
On 13 November 2013, a moderate explosion at Tavurvur produced a dense, gray billowing plume of ash which rose 1000 m and blew NW. More explosions followed at irregular intervals, and continued until 18 November. Ash plumes from those explosions were blown E, SE, and NW at lower altitudes and rose to a maximum height of 1000 m. Between explosions, wisps of white vapor rose from the volcano. Large explosions occurred at 0738, 0851, 1308, and 1903 on 13 November, and the next day at 2044. RVO reported minor inflation at the center of the caldera. There was some roaring and rumbling, but seismicity was low with small low-frequency earthquakes occurring with explosions.
During 19-30 November, Tavurvur produced fewer explosions, accompanied by white to light gray emissions, and small traces of diffuse to dense white vapors were occasionally observed. Those plumes drifted E, SE, and NW at a maximum height of 1,000 m above the crater summit. Two small, high-frequency volcano-tectonic earthquakes were detected during 23-27 November and located NE of Tavurvur.
December 2013. Little activity occurred at Rabaul during December. Minor emissions of mainly diffuse, though occasionally dense, white vapor occurred. A blue tint to the emissions was reported on some days during the reporting periodThere were no audible noises except for two two moderate explosions at 1850 on 15 December and 0732 on 22 December. Neither explosion was ash rich. RVO noted a weak fluctuating glow visible at night on 31 December.
Information Contacts: Rabaul Volcano Observatory, Department of Mineral Policy and Geohazards Management, Volcanological Observatory Geohazards Management Division, P.O. Box 386, Kokopo, East New Britain Province, Papua New Guinea; and Darwin Volcanic Ash Advisory Centre (VAAC) (URL: http://www.bom.gov.au/info/vaac/); Nasa Earth Observatory (URL: http://earthobservatory.nasa.gov); and ABC Australia Network News (URL: http://www.abc.net.au/news-01-31/an-png-airport-reopens-after-volcano-forces-closure/4492838).
Minor eruptions continue until 29 August 2014, explosion sends ash plume to 18 km altitude
Our last Bulletin report (BGVN 38:10) covered from August 2011 to December 2013, during which Rabaul's intracaldera cone, Tavurvur, often discharged modest eruptions. During that period there were several distinct events ranging from significant ashfall to the creation of a new lava dome in June 2013. This report describes activity at the Tavurvur cone between January 2014 and the end of September 2014, using data primarily gathered from the Rabaul Volcanic Observatory (RVO) and the Darwin Volcanic Ash Advisory Center (VAAC). Excepting the event on 29 August 2014 when Tavurvur sent an ash plume to ~18 km altitude, activity consisted mostly of a few minor explosions and ashfall. Caldera unrest, which included earthquakes and deformation, also continued. Ashfall is a continuing hazard in Rabaul town (3-5 km NW), which according to a recent survey has a population of ~10,000 people; an estimated 52,693 people live within a 10-km radius of Tavurvur.
Activity during January-August 2014. Tavurvur remained mostly quiet in January-February 2014 with varying amounts of white to blue vapor rising up to 100 m over the crater rim. Seismicity was low with a few small earthquakes. On 12 February a diffuse gray/brown ash plume rose 50-100 m. Only the summit was affected by the resulting ashfall. GPS measurements showed a constant yet slow uplift of the middle of the caldera.
Tavurvur continued to have small to moderate explosions in March, with gray ash plumes rising 1000 m. Deposits were characterized by a thin layer of brown ash. Explosion earthquakes were recorded on 1 (1), 6 (2), 7 (1), 8 (1), 9 (1), 10 (1), and 11 (2) March. Ash emissions continued and led to browned flora on the nearby peak, Turanguna (aka. South Daughter). During the latter part of March, Tavurvur quieted, and was either without vapor or only released white vapor. Seismicity during this period was very low, but a few low-frequency earthquakes occurred during explosions. There were three M~5 earthquakes on 20 March and a few very small earthquakes between 28 and 30 March (unstated quantity and magnitude). Short-term inflation was seen on Matupit Island, and continuous long-term inflation on the Tavurvur cone. In past years, Rabaul's caldera floor has undergone long-term recovery from the 1994 eruption and on Matupit Island there has been deflation associated with the 2006 eruption, during which a benchmark subsided by ~55 cm. RVO noted that the most likely cause of the recent Matupit inflation was processes (e.g. intrusion/vesiculation) affecting the volume of the magma at depth.
During April-June 2014 there were no VAAC reports or RVO data available. SO2 data from NASA showed only very modest plumes, suggesting little activity. There was hardly any activity in July and most of August except for an ash emission that drifted NNW and resulted in ashfall in Rabaul town on 7 July. Distinct ashfall events occurred on 15, 16, 17, and 26 July. RVO noted minor plumes (up to 1 km altitude) of white vapor and a little blue vapor which they attributed to new hot material near the surface. Seismicity was low with three earthquakes (intensity III–IV) on 15 July and a single low-frequency event on each of 15, 16, 21, 22, and 29 July, with five such events on 26 July. Larger magnitude earthquakes on 15-17 and 26 July corresponded to volcanic explosions. An examination of the summit crater on 25 July showed a weak glow on the summit and that the crater had deflated since the earlier 10 July examination. There were also regular low noises produced by gas release. No additional RVO data was issued until 29 August.
Explosion on 29 August 2014. The most dramatic event during the past several years occurred when a Strombolian explosion starting between 0330 and 0400 and lasting until 0657 on 29 August sent an ash plume to ~18 km altitude (figure 61). Smaller explosions at irregular intervals continued through 0641 on 30 August (figure 62). Table 14 provides an overview of key events during the eruption. A crater inspection during late September indicated that the 29 August eruption left the crater shallower. The visible fill consisted of blocky lava and the once smooth rim was covered with large chunks. Observers also noted active emissions at 3-4 areas.
Table 14. Details of Rabaul's explosion and seismic activity on 29 August 2014. Noises such as explosive, roaring, or rumbling sounds were largely omitted. The primary data source is RVO, but most of the information shown was conveyed through Darwin VAAC reports. All times are local unless otherwise noted, UTC + 10 hours.
| Date (Time) | Remarks |
| 29 Aug (0330-0400) | Start of Strombolian eruption. Shock waves. |
| 29 Aug (0400-0530) | Eruption plume ~3000 m above Tavurvur's vent moving WNW. Ash and scoria affected Rabaul town before the wind shifted, to later affect Malaguna, Matupit, and S of the vent. |
| 29 Aug (0645-0657) | Eruption's subsidence/conclusion. Diffuse white emissions. |
| 29 Aug (daylight) | Strong explosions. Lessened seismic activities. Conclusion of volcanic tremors. 1000 m altitude ash plumes drifted NW. 0848: First Volcanic Ash Advisory (VAA) issued. Satellite image acquired 44 min. later (MTSAT-2). |
| 30 Aug (night) | Strong discrete explosions. Thick, white 1000 m ash plumes drifted NW. Increased time interval in between events accompanied by incandescent lava fragments (figure 4). 1254-1435: Data was acquired for the OMI satellite image with the largest SO2 plume (Fig. 8) |
| 30 Aug (0641) | End of strong explosions. White vapor and minor diffuse blue vapor. |
| 30-31 Aug | High seismicity with several low-frequency earthquakes, 80/hour. |
| 31 Aug (0300) | Decreased seismicity. Low-frequency earthquakes, 15/hour. |
| 01-12 Sep | Subsidence of all activity. White vapor and minor blue vapor. Fine ash on the ground swept into atmosphere by SE winds. No night glow. Discrete explosions and mild ash puffs on 1-2 Sep. Minimal ground deformation. Low seismicity with low-frequency earthquakes occurring at a rate of 10/hour during 1-2 Sep; 15-20/hour during 3-4 Sep; 20-30/hour during 5-12 Sep. |
| 13-19 Sep | Mild activity. Low seismicity with 25-35 total low-frequency earthquakes. Ground deformation fluctuating within 2 cm of the new elevation reached during the 29 August eruption. On 18 Sep, an explosion at 1242 produced a pale gray ash plume reaching ~500 m above the vent before moving NW. |
| 20-26 Sep | Mild activity, tectonic earthquake, and crater inspection. Diffuse white vapor and minute traces of blue vapor. Low seismicity with 15-20 total low-frequency earthquakes. |
| 27 Sep-03 Oct | Mild activity, tectonic earthquake. Diffuse white vapor and minute traces of blue vapor. Low seismicity with less than 10 total low-frequency earthquakes. |
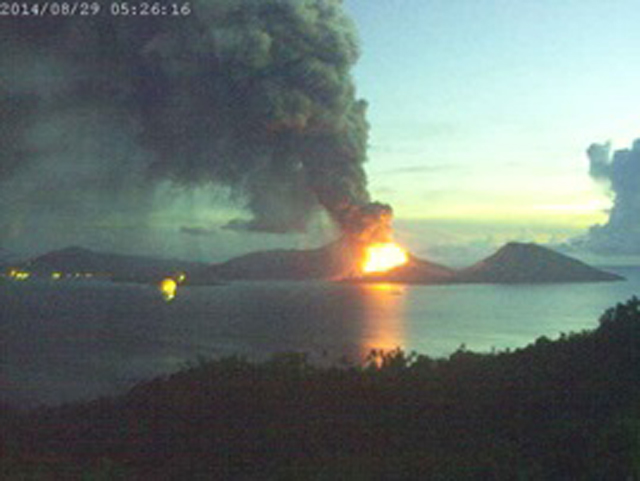 |
Figure 61. Rabaul's 29 August 2014 eruption glowing intensely and emitting a plume at 0526. This was captured about two hours after the eruption's onset, facing approximately NNE. Rabaul town is to the left and the harbor entrance of Blanche bay is towards the right. Courtesy of PNG Climate Network. |
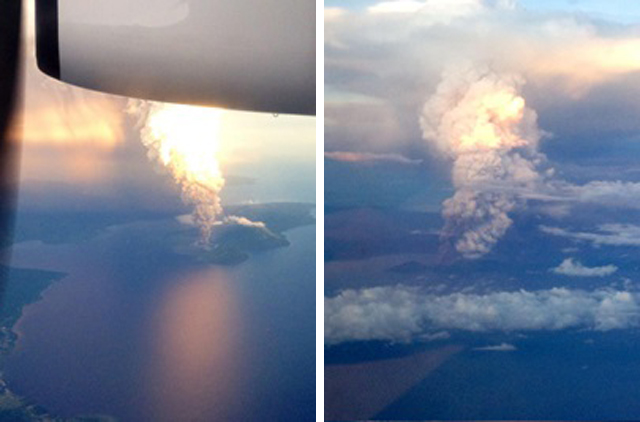 |
Figure 62. Two views of the ash plume on 30 August 2014 from Rabaul's Tavurvur as seen from an airplane. In the topmost picture, Tavurvur's vent and Blanche bay are easily distinguishable. Courtesy of Derek Schock (as posted on Twitter). |
Satellite imagery (MTSAT-2 VDIFF) taken ~6 hours after the eruption's onset showed that the plume had slightly detached from the vent and been swept into a funnel-like shape fanning W to SW of the vent. According to VAAC reports from the same time, the ash plume had an altitude of ~18 km. Darwin VAAC noted that the direction and speed of all three plumes on 29 August were assessed using ash and SO2 data. A few hours after the eruption, the ash diffused, leaving behind SO2 in the atmosphere.
Ashfall in New Britain was mainly to the W of Tavurvur (figure 63). On 31 August no new airborne ash was detected and all volcanic ash advisories were terminated. By the end of September, the remains of atmospheric ash and SO2 released by the 29 August eruption had completely disappeared.
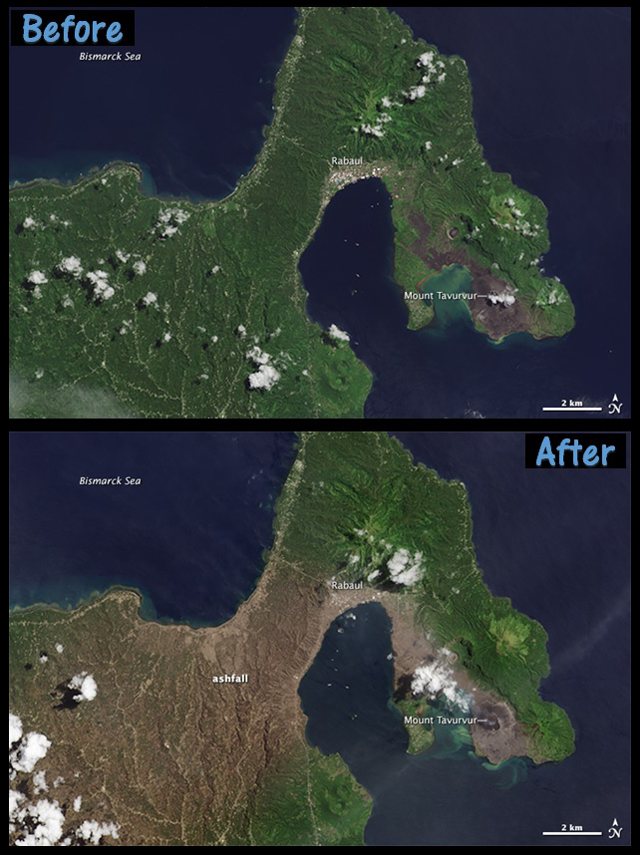 |
Figure 63. Landsat images of New Britain from 27 April 2014 and 2 September 2014, depicting the ashfall from the 29 August 2014 eruption. As seen in the lower image, the ash (brown area) deposited towards the W and at a distance curved SW. Courtesy of Jesse Allen and Adam Voiland, NASA Earth Observatory. |
Satellite SO2 emissions and mass estimates. Tavurvur's SO2 emissions varied throughout the reporting period with only small masses recorded in the atmospheric column except for those related to the late August eruption. The purpose of these SO2 mass values is to establish the size and potential atmospheric impacts of eruptions. Satellite SO2 data from Rabaul was reported by the NASA Goddard MEASURES website and the Darwin VAAC.
Tavurvur's SO2 emissions were registered by the Ozone Monitoring Instrument (OMI) (table 15). The greatest atmospheric column SO2 mass resulted from the 28 August eruption's plume one day later with a total of 20.5 kilotons, more accurately defined at ~18 kilotons by Simon Carn after his initial analysis of the data. On 27 September 2014, the SO2 was also significant from other volcanoes in the region and the total mass value for the region was 0.12 kt. Thus, in this case, it was hard to compute the individual contribution from Tavurvur without further processing.
Table 15. Days during 2014 with Rabaul SO2 plumes of substantial size, above 1 Dobson Unit (DU). Time and dates are in UTC. The mass column corresponds to the automated output of the total mass for the entire image region, except for the adjusted value on 29 August. The plume from Tavurvur was dominant except for 27 September when there were multiple plume inputs. Data from 29 and 30 August are discussed in greater detail in the text. Data courtesy of NASA MEASURES and Simon Carn.
| Date (2014) | Direction from Rabaul | Maximum distance from Rabaul (km) | Mass of SO2 within image (kiloton, kt) |
| 05 Feb | SW | 50 | 0.127 |
| 25 Mar | S | 100 | 0.507, may be affected by cloud cover |
| 29 Aug | NW, W, SW, S | More than 500 | 20.5 (adjusted to 18.5) |
| 30 Aug | W and S | More than 500a | 9.34 |
| 27 Sep | W and SW | 100 | 0.120, may be affected by cloud covera |
On 29 August 2014, the 20.5 kt plume (figure 64) was observed to the NW, W, SW, and S at 0254-0435 UTC (1254-1435 local). By 30 August the plume had decreased to ~10 kt, a number which was most likely inaccurate since OMI imagery depicts the plume ~1000 km S of Rabaul and a part of the plume was outside the observed region.
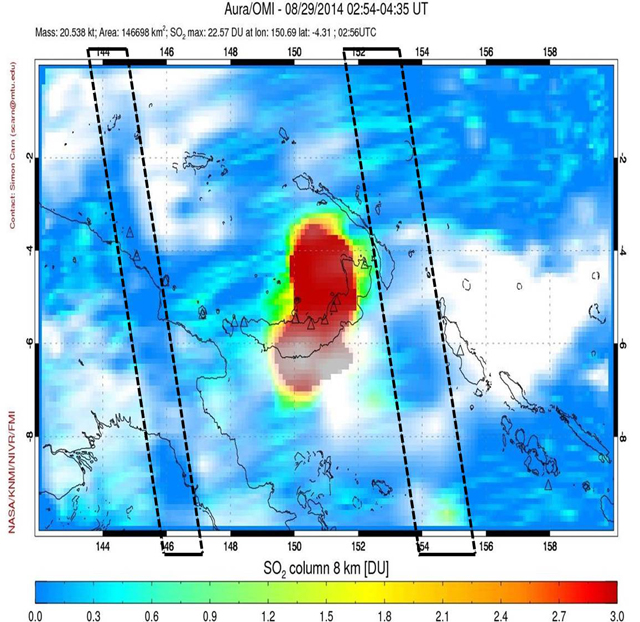 |
Figure 64. OMI SO2 image for the Rabaul eruption captured between 0254-0435 UTC on 29 August (1254-1435 local), ~9.5 hours after the eruption's onset at 1730 UTC the previous day. According to the automated output, parts of the plume registered greater than ~3 DU (the red area). The plume also extended N to S for ~400 km and covered ~147,000 km2. Inaccuracies in the density (DU) of the plume might have been caused by the OMI row anomalies or the regions between the dotted lines to the E and W of the plume. Courtesy of the NASA MEASURES website. |
According to Simon Carn, various inaccuracies may have appeared in the automated input for the plume altitudes. For example, the OMI data was compiled assuming a plume altitude of 8 km, which differs from the ~18 km altitude of the eruption plume and the ~1 km altitudes of all other ash plumes as noted by the Darwin VAAC. This difference would result in an overestimate of the 29-30 August total column masses and an underestimate of all other total column masses. Cloud cover may have also affected the estimates. When a meteorological cloud resides either above or below the volcanogenic SO2 gas plume, the total column mass estimate may be, respectively, underestimated or overestimated. Carn computed and adjusted to compensate for these complicating factors, resulting in a more accurate (but still preliminary) estimate for the SO2 column mass at 18.5 kt, or ~2 kt less than the original measurement of ~20.5 kt. For greater details regarding these and other inaccuracies in images processed with automated algorithms, see the Reventador report in BGVN 39:07 and the reference list therein.
Darwin VAAC Advisories. The Darwin VAAC issued Support to Aviation Control Service SO2 (SACS SO2) and Volcanic Ash Advisories (VAA) beginning at 0848 on 29 August (2248 UTC on 28 August). Regular updates continued through mid-day on 31 August. During the immediate aftermath, the SO2 was similar in location to the ash plume (figure 65). The Aviation Color Code was raised from Orange to Red during the eruption, but was later returned to Orange.
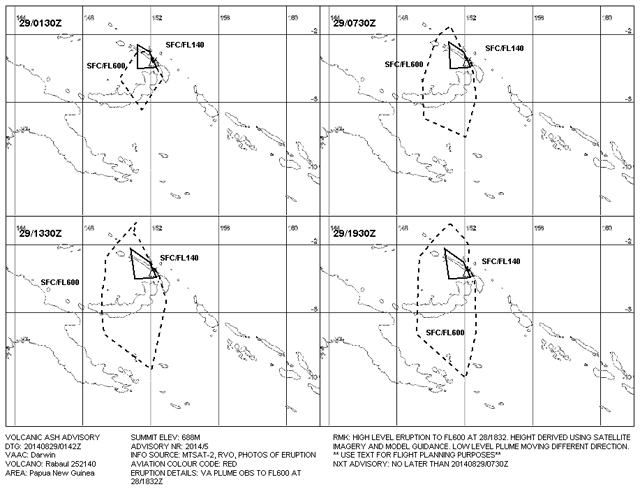 |
Figure 65. Ash movement forecasts shown for 6-hour intervals starting at 1142 LT (0142 UTC) on 29 August. (Read panels from left to right on both rows starting at the top left.) The ash (and/or SO2) movement was projected to advance to the NW, W, SW, and S at comparatively slow velocities. Abbreviations located below the forecast include SFC (ground surface) and FL (flight level, where FL100 would correspond to 10,000 ft). Courtesy of Darwin VAAC. |
Videos. Several videos were taken of the 29 August eruption and post-eruption phases. One impressive video was made from a moving boat looking NE across Blanche bay, taken during daylight hours well after the initial violent Strombolian phase of the 29 August eruption. GVP was unable to establish direct contact with the videographers, Phil and Linda McNamara, leaving open questions about the video's acquisition time and other details. The video, originally posted on 5 September, had received over 6 million views by 8 September according to Daily Mail, perhaps owing to a sharp, loud explosion and shock wave that was recorded, followed by the impact of ballistic material into the bay between the boat and Tavurvur. Many lower quality versions of the video are now online containing misleading artifacts, but the one posted by Bacobjee (2014) was labeled HD (720p) and plays at a rate of 30 frames per second.
A compilation of video clips recorded by Christopher Hamilton (figure 66) from a boat, the Obelisk, located S of Tavurvur in Blanche Bay shows the progression of activity during the main explosive event (table 16). Hamilton stated that he was on board and asleep on the night of 29 August when he was "woken up by golf ball-sized pumice and heavy ash coming through the hatches of the boat." Hamilton recorded the activity, and provided GVP with additional footage not available online.
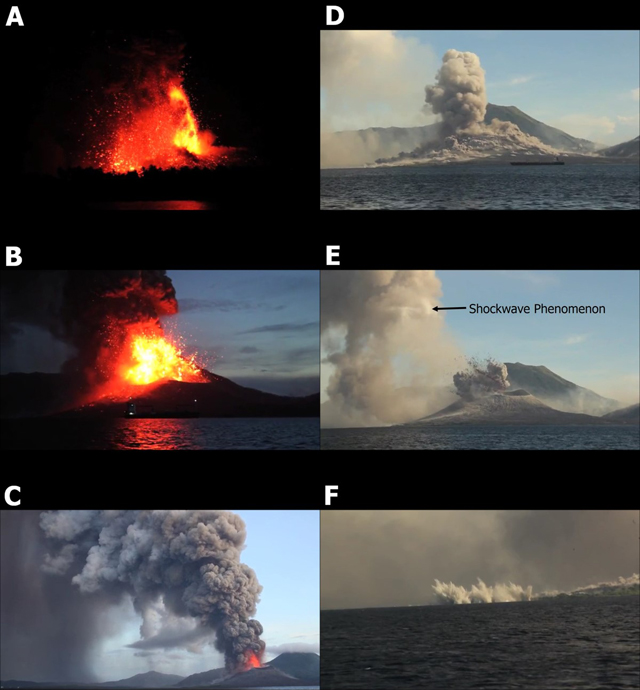 |
Figure 66. A set of still images from a video of the 29 August 2014 Tavurvur eruption at Rabaul captures different eruptive stages during both darkness and daylight. Images were taken from a video compilation of high-definition clips posted on Flickr (Hamilton, 2014). |
Table 16. Christopher Hamilton's videos documenting Rabaul's 29 August eruption are briefly discussed in the text. Most of the described activity can be seen in both videos, but some activity for 0739 and 0750 was only present on the non-public video provided by Hamilton, along with other observations as noted. Still image designation refers to figure 66. All video times have been adjusted to local time. All heights are in altitude.
| Time | Still Image | Video Details |
| 0441 | A | Glowing fountain rose to ~0.7 km. Yellow center surrounded by massive zone of red ejections with many arcing ballistics. The provided video contains views of small discrete lingering ash clouds up to ~0.1 km in diameter. Main, larger ash plume difficult to distinguish and may have been largely outside the field of view. The cone's upper surfaces glowed red and yellow with the growth of spatter-fed lava flows. |
| 0532 | B | Yellow center of columnar glowing fountain rose to ~0.5 km. Ash plume extended well beyond frame and portions moved rapidly upwards. Visible ash clouds progressively lightened from black to light gray overhead and were traversed by several lightning flashes. |
| 0543 | C | Outstanding view of both Tavurvur and Rabaul town using wide angle lens. Reddish glow visible from cone rim to at least ~0.5 km. Gray ash plume rose to ~2.1 km and then curved left. In the provided video, the plume suddenly changed from gray below to white above at ~2.7 km elevation. Diffuse, gray ashfall returned to ground in far left and cone was covered with dusty light clouds. |
| 0739 | -- | Thin, white cloud released. Summit hidden by Turanguna peak in forefront. |
| 0750 | -- | Gray plume erupted to ~0.5 km. Reddish lava ejections formed ashfall. Cone was covered with lumpy cloudlike matter. |
| Unknown | D | Gray plume rose to ~0.8 km. Cone was covered in dense clouds. |
| 0754 | E | Gray plume erupted to ~0.5 km and continued to progress upwards (in provided video) to ~0.9 km. Reddish lava ejections formed ashfall. Material descended the cone. Internal shockwave phenomenon (2 seconds later) moved slowly at ~17 m/s. Clouds crossed by shockwave to the left of cone appeared lighter in color. |
| 0758 | F | Zoom of reddish lava ejections which spread outwards in sheet, before rapidly forming a volley of distinct ballistics. When these landed, they resulted in dusty ejecta on land and upward-jetting splashes of water in Blanche bay. |
References. Bacobjee, 5 September 2014, Volcanic Eruption in Papua New Guinea, Youtube (URL: http://www.youtube.com/watch?v=BUREX8aFbMs) [accessed in November 2014]
Daily Mail, 8 September 2014, (URL: http://www.dailymail.co.uk/sciencetech/article-2747577/Holy-smokes-Watch-explosive-moment-volcano-erupts-triggers-SONIC-BOOM-sending-shockwaves-sky.html) [accessed in February 2015]
Giddings, T. E., Rusak, Z., & Fish, J., 2001, A transonic small-disturbance model for the propagation of weak shock waves in heterogeneous gases, Journal of Fluid Mechanics [accessed in February 2015]
Headlines America, 6 September 2014, (URL: http://www.headlinesamerica.com/holy-smoking-toledos-tourists-capture-video-of-volcano-erupting) [accessed in December 2014]
Hamilton, Christopher, 2 September 2014, Rabaul Volcanic Eruption, Flickr/Leah Chris (URL: http://www.flickr.com/photos/125506007@N06/14935764197/) [accessed in November 2014]
Nave, Carl R., 2014, Speed of Sound in Air, Hyperphysics, (URL: http://hyperphysics.phy-astr.gsu.edu/hbase/sound/souspe.html) [accessed in March 2015]
News.com.au, 29 August 2014, PNG Volcano Tavurvur eruption may disrupt Australian flights, News.com.au (URL: http://www.news.com.au/travel/travel-updates/png-volcano-tavurvur-eruption-may-disrupt-australian-flights/story-e6frfq80-1227040827996) [accessed in November 2014]
Revkin, AC, 4 September 2014, Dynamic Planet: Under the Volcano in Papua New Guinea, The New York Times/ Opinion Pages/ Dot Earth, (URL: http://dotearth.blogs.nytimes.com/2014/09/04/dynamic-planet-under-the-volcano-in-papua-new-guinea/) [accessed in February 2015]
Information Contacts: Rabaul Volcano Observatory, Department of Mineral Policy and Geohazards Management, Volcanological Observatory Geohazards Management Division, P.O. Box 386, Kokopo, East New Britain Province, Papua New Guinea; Darwin Volcanic Ash Advisory Centre (VAAC) (URL: http://www.bom.gov.au/info/vaac/); Jesse Allan and Adam Voiland, NASA Earth Observatory (URL: http://earthobservatory.nasa.gov); NASA MEASURES (URL: https://so2.gsfc.nasa.gov/); Simon Carn, Department of Geological and Mining Engineering and Sciences, Michigan Technological University, Houghton, MI 49931 USA (URL: https://so2.gsfc.nasa.gov/) and Global Volcanism Program, Smithsonian Institution, National Museum of Natural History, Washington, DC; William C. Burton, US Geological Survey, 12201 Sunrise Valley Dr, Reston, Virginia 20192; Christopher Hamilton, CHPhotographic (URL: http://www.chphotographic.com/).
Details of 29 August 2014 Strombolian eruption; update through 2016
The large eruption of 29 August 2014 at the Tavurvur stratovolcano of Rabaul caldera, on the NE tip of New Britain Island in Papua New Guinea, followed a period of minor ash eruptions earlier in the year (BGVN 39:08). The volcano has been intermittently active since a major eruption in September 1994, which was its first eruption in over 50 years. During the 1994 eruption, a lava flow, tephra ejection, and an ash plume rising to 18 km caused the evacuation of over 50,000 people from the surrounding area, significant damage to nearby Rabaul Town, several deaths, and disrupted air traffic for several days (BGVN 19:08, 19:09). Additional information for the 2014 eruption, and subsequent activity covered in this report, was compiled by the Rabaul Volcano Observatory (RVO) and issued by the Department of Mineral Policy and Geohazards Management of Papua New Guinea (DMPGM). Aviation alerts for Rabaul are issued by the Darwin Volcanic Ash Advisory Center (VAAC). A number of news outlets also covered the eruption with photographs, videos, and interviews of local residents.
A Strombolian eruption at Tavurvur began shortly after 0330 local time on 29 August 2014. This was followed by an ash plume rising to 18 km altitude. Smaller explosions at irregular intervals continued through 0641 on 30 August. After this, plumes of white vapor and slightly bluish gas returned, except for an ash plume reported on 12 September and a small explosion on 18 September. The volcano remained quiet after this and through 2016, although ground deformation data indicated a gradual inflation of about 6 cm over the period.
Activity during August-December 2014. Prior to August 2014, DMPGM reported that ground deformation measurements from the GPS station on Matupit Island (3 km W) had been showing increasing inflation, first detected in March 2014 (figure 67). In the days immediately before the 29 August 2014 eruption, Tavurvur had been emitting a diffuse plume of white vapor. An explosion occurred on 6 August, and an inspection of the summit crater on 8 August revealed an incandescent area covered by debris.
|
Figure 67. Locations of ground deformation (red), seismic (green) and thermal (orange) monitoring stations around Tavurvur volcano at Rabaul Caldera, New Britain Island, Papua New Guinea. Matupit Island is the peninsula immediately W of Tavurvur. Image courtesy WOVOdat. |
The activity on 29 August 2014 started slowly between 0330 and 0400 local time and then developed into a Strombolian eruption accompanied by loud explosions, roaring, and rumbling. The stronger explosions generated shockwaves which rattled windows and doors in the area. At dawn, the eruption plume could be seen blowing W over the Malguna villages, about 8 km NW, at an altitude of 3,000 m (figure 68). Rabaul Town, 7 km NW of Tavurvur, was initially affected by ash, as was Volavolo (20 km W), but a shift in wind direction sent the plume in a more WNW direction by mid-morning. Villages to the E and S were not affected by ash, but ashfall was reported in Keravat, about 25 km SW. High levels of seismic tremor were recorded during the eruption.
|
Figure 68. Eruption of Mt. Tavurvur, the active stratovolcano of Rabaul caldera, on 29 August 2014. The ash plume rose to 18 km altitude and dispersed ash to the W and NW of the volcano. Courtesy of OLIVER BLUETT/AFP/Getty Images, printed in The Washington Post. |
DMPGM reported that the Strombolian eruption had begun to subside around 0645, and by 0700 only a diffuse white plume was being emitted and seismicity had decreased. Another report at 1600 noted that strong explosions continued throughout the day at irregular intervals, producing ash plumes that rose rapidly to 1,000 m above the summit before drifting NW. The explosions also ejected lava fragments of various sizes in all directions 500 to 1,000 m from the summit crater (figure 69). Shock waves accompanied the loud explosions and rattled buildings within several kilometers of the volcano. Intermittent explosions at increasing intervals continued into the following night generating incandescent lava fragments around the summit. Seismicity was dominated by discrete events that were associated with the explosions. The strong explosions ceased at 0641 on 30 August, and no incandescence was observed after that. By the morning of 31 August, seismicity had decreased from 80 events/hour to 15/hour. According to DMPGM, the eruption deposited a significant amount of ash and scoria on the hillsides of Rabaul Town and Malaguna Villages to the NW.
|
Figure 69. Incandescent lava exploding from Tavurvur (Rabaul Caldera) on 29 August 2014. Courtesy of Emma Edwards, reported at Traveller.com. |
The initial ash plume from the eruption was first observed in satellite imagery by the Darwin VAAC around 0900 local time on 29 August, and rose to over 18 km altitude. The upper part of the plume was originally drifting SW, then changed to NW, and the lower part at 4.3 km altitude was moving NW. By late morning, the plume was moving in three directions at different altitudes; NW at 4.3 km, S at 16.7 km, and W at 18.3 km. The high-level ash from the original eruption had dissipated by the evening on 30 August, but low-level plumes to 2.1 km were still reported.
A substantial SO2 plume was recorded by the OMI Instrument on the Aura Satellite on 29 August, and was still measurable a day later (figure 70) drifting S. The MODVOLC thermal anomaly system recorded anomalous pixels at Rabaul captured by MODIS satellite data between 29 August and 1 September 2014.
|
Figure 70. SO2 plumes captured by the OMI instrument on the AURA satellite from Rabaul on 29 and 30 August 2014. Rabaul is the triangle at the top right corner of the crescent shaped island of New Britain at the center of the image. Courtesy of NASA/GSFC. |
From 1 to 17 September emissions consisted of variable amounts of diffuse to dense white vapor and small traces of diffuse blue vapor. Southeast winds were recirculating significant amounts of fine ash back into the atmosphere. A plume was reported by the Darwin VAAC on 12 September at 3 km altitude, drifting NW. Seismicity had decreased to very low levels with only 10-30 events recorded per day during the first half of September. A single small explosion occurred at 1242 on 18 September according to DMPGM that produced a small, light-gray ash plume that rose a few hundred meters above the summit crater before dissipating to the NW.
A site inspection of Tavurvur crater was conducted by DMPGM on 23 September 2014, and they observed significant changes in the crater since the 29 August eruption. The crater floor was filled with blocky lavas, and thus much shallower than when last observed prior to the eruption. Three or four areas of active emissions were present within the crater, and the rim was covered with large blocks of lava. By the end of September, seismicity had dropped to less than 10 low-frequency earthquakes per week. In mid-October DMPGM observed that the ground deformation data from the Matupit GPS station indicated that there had been an inflation of about 4 cm since the benchmark reached on 29 August during the eruption. Ground deformation was stable during November. During a field inspection of the summit crater on 9 December 2014, scientists measured a temperature of 310°C at a hot spot on the upper flank. Numerous patches of diffuse white vapor emissions were present at different places on the inner walls of the crater, and the crater floor seemed to have subsided slightly since the prior visit.
Activity during 2015 and 2016. A report by DMPGM from March 2015 noted that Tavurvur remained quiet with the summit crater releasing various amounts of diffuse white vapor, which was slightly denser during periods of rain. There was no observed incandescence or noise, and seismicity was low, with only a small number of both high-frequency and volcano-tectonic earthquakes recorded on 10 and 13 February. Ground deformation data indicated a general inflationary trend since September 2014 of about 5 cm. Monthly reports issued by DMPGM in March and April indicated little activity at Tavurvur, and stability of the ground deformation data. On 17 May 2015 a strong, earthquake of M 5.1 originating NE of Rabaul Caldera 1-2 km offshore from Korere and Nodup (about 9 km NW of Tavurvur) generated a swarm of aftershocks in the same area. They occurred at a depth of about 9 km and caused several small landslides in various places on the N flank of Kombiu, another stratovolcano at Rabaul about 2.5 km NE of Tavurvur.
Tavurvur remained quiet from September through November with occasional diffuse white vapor plumes rising from the summit caldera, and no volcanic earthquakes reported. While a long-term inflationary trend continued through November, shorter term fluctuations up and down of a few centimeters in the ground deformation data were also observed. The trend of vertical uplift between January 2015 and December 2016 showed an increase of approximately 6 cm during the period (figure 71).
|
Figure 71. Vertical uplift at the Matupit GPS station for Rabaul between 1 January 2015 and 1 December 2016. The trend shows a gradual inflation of about 6-7 cm. Courtesy of DMPGM (Volcano Information Bulletin No. 12-122016, 4 December 2016). |
Information Contacts: Department of Mineral Policy and Geohazards Management (DMPGM), Volcano Observatory, Geohazards Management Division, PO Box 3386, KOKOPO, East New Britain Province, Papua New Guinea; Darwin Volcanic Ash Advisory Centre (VAAC), Bureau of Meteorology, Northern Territory Regional Office, PO Box 40050, Casuarina, NT 0811, Australia (URL: http://www.bom.gov.au/info/vaac/); Hawai'i Institute of Geophysics and Planetology (HIGP), MODVOLC Thermal Alerts System, School of Ocean and Earth Science and Technology (SOEST), Univ. of Hawai'i, 2525 Correa Road, Honolulu, HI 96822, USA (URL: http://modis.higp.hawaii.edu/, http://modis.higp.hawaii.edu/cgi-bin/modisnew.cgi); NASA Goddard Space Flight Center (NASA/GSFC), Global Sulfur Dioxide Monitoring Page, Atmospheric Chemistry and Dynamics Laboratory, Goddard, Maryland, USA (URL: https://so2.gsfc.nasa.gov/); World Organization of Volcano Observatories (WOVOdat), hosted by Earth Observatory of Singapore, Nanyang Technological University, 50 Nanyang Avenue, Singapore 639798 www.wovodat.org; The Washington Post, http://www.washingtonpost.com/news/morning-mix/wp/2014/08/29/photos-in-papua-new-guinea-mount-tavurvur-explodes-in-spectacular-style/); Traveller.com, http://www.traveller.com.au/qantas-reroutes-flights-as-pngs-rabaul-volcano-erupts-109utz .
This compilation of synonyms and subsidiary features may not be comprehensive. Features are organized into four major categories: Cones, Craters, Domes, and Thermal Features. Synonyms of features appear indented below the primary name. In some cases additional feature type, elevation, or location details are provided.
Synonyms |
||||
| Blanche Bay | ||||
Cones |
||||
| Feature Name | Feature Type | Elevation | Latitude | Longitude |
|
Davapia Rocks
Beehives, The |
Cone | 4° 14' 0" S | 152° 10' 0" E | |
| Karavia Bay | Stratovolcano | 280 m | 4° 19' 0" S | 152° 10' 0" E |
|
Kombiu
Kabiu Mother, The |
Stratovolcano | 688 m | 4° 13' 1" S | 152° 13' 0" E |
| Matupit Island | Cone | 4° 15' 0" S | 152° 11' 0" E | |
| Palangiagia | Stratovolcano | 4° 13' 0" S | 152° 12' 0" E | |
|
Rabalanakaia
Rabatana |
Cone | 400 m | 4° 13' 16" S | 152° 12' 11" E |
|
Tavurvur
Tuvurvur Matupi Gaia Kaia Ghaie |
Stratovolcano | 223 m | 4° 14' 17" S | 152° 12' 50" E |
|
Tovanumbatir
North Daughter |
Stratovolcano | 480 m | 4° 10' 59" S | 152° 10' 19" E |
|
Turangunan
South Daughter |
Stratovolcano | 475 m | 4° 14' 0" S | 152° 13' 23" E |
|
Varzin, Mount
Vunakokor |
Stratovolcano | 605 m | 4° 24' 29" S | 152° 9' 25" E |
|
Vulcan
Raluan Keravia |
Pyroclastic cone | 243 m | 4° 16' 16" S | 152° 10' 0" E |
| Vulcan Island | Cone | 20 m | 4° 16' 0" S | 152° 10' 0" E |
| Vunakanau | Cone | |||
| Watom Island | Cone | 341 m | 4° 7' 0" S | 152° 4' 0" E |
Craters |
||||
| Feature Name | Feature Type | Elevation | Latitude | Longitude |
| Sulphur Creek | Crater Row | 4° 13' 16" S | 152° 11' 20" E | |
|
|
||||||||||||||||||||||||||
There is data available for 19 confirmed Holocene eruptive periods.
2014 Jul 7 - 2014 Sep 18 Confirmed Eruption Max VEI: 4
| Episode 1 | Eruption Episode | Tavurvur | ||||||||||||||||||||||||||||||||||||||||||||||||||||||||||||||||||||||||||||||||||||||||||||||||||||||||||||||||||||||||||||||||||||||
|---|---|---|---|---|---|---|---|---|---|---|---|---|---|---|---|---|---|---|---|---|---|---|---|---|---|---|---|---|---|---|---|---|---|---|---|---|---|---|---|---|---|---|---|---|---|---|---|---|---|---|---|---|---|---|---|---|---|---|---|---|---|---|---|---|---|---|---|---|---|---|---|---|---|---|---|---|---|---|---|---|---|---|---|---|---|---|---|---|---|---|---|---|---|---|---|---|---|---|---|---|---|---|---|---|---|---|---|---|---|---|---|---|---|---|---|---|---|---|---|---|---|---|---|---|---|---|---|---|---|---|---|---|---|---|---|
| 2014 Jul 7 - 2014 Sep 18 | Evidence from Observations: Reported | ||||||||||||||||||||||||||||||||||||||||||||||||||||||||||||||||||||||||||||||||||||||||||||||||||||||||||||||||||||||||||||||||||||||
|
List of 25 Events for Episode 1 at Tavurvur
| |||||||||||||||||||||||||||||||||||||||||||||||||||||||||||||||||||||||||||||||||||||||||||||||||||||||||||||||||||||||||||||||||||||||
2013 Jan 19 - 2014 Mar 11 Confirmed Eruption Max VEI: 2
| Episode 1 | Eruption Episode | Tavurvur | ||||||||||||||||||||||||||||||||||||||||||||||||||||||||||||||||||||||||||||||||||||||||||||||||||||||||||||||||||||||||||||||||||||||||||||||||||||||||||||||||||||||||||||||||||||||||||||||||||||||||||||||||||||||||||||||||||||||||||||||||||||||||||||||||||||||||||||||||||||||||||||||||||||||
|---|---|---|---|---|---|---|---|---|---|---|---|---|---|---|---|---|---|---|---|---|---|---|---|---|---|---|---|---|---|---|---|---|---|---|---|---|---|---|---|---|---|---|---|---|---|---|---|---|---|---|---|---|---|---|---|---|---|---|---|---|---|---|---|---|---|---|---|---|---|---|---|---|---|---|---|---|---|---|---|---|---|---|---|---|---|---|---|---|---|---|---|---|---|---|---|---|---|---|---|---|---|---|---|---|---|---|---|---|---|---|---|---|---|---|---|---|---|---|---|---|---|---|---|---|---|---|---|---|---|---|---|---|---|---|---|---|---|---|---|---|---|---|---|---|---|---|---|---|---|---|---|---|---|---|---|---|---|---|---|---|---|---|---|---|---|---|---|---|---|---|---|---|---|---|---|---|---|---|---|---|---|---|---|---|---|---|---|---|---|---|---|---|---|---|---|---|---|---|---|---|---|---|---|---|---|---|---|---|---|---|---|---|---|---|---|---|---|---|---|---|---|---|---|---|---|---|---|---|---|---|---|---|---|---|---|---|---|---|---|---|---|---|---|---|---|---|---|---|---|---|---|---|---|---|---|---|---|---|---|---|---|---|---|---|---|---|---|---|---|---|---|---|---|---|---|---|---|---|---|---|---|---|---|---|---|---|---|---|---|---|---|---|---|---|---|
| 2013 Jan 19 - 2014 Mar 11 | Evidence from Observations: Reported | ||||||||||||||||||||||||||||||||||||||||||||||||||||||||||||||||||||||||||||||||||||||||||||||||||||||||||||||||||||||||||||||||||||||||||||||||||||||||||||||||||||||||||||||||||||||||||||||||||||||||||||||||||||||||||||||||||||||||||||||||||||||||||||||||||||||||||||||||||||||||||||||||||||||
|
List of 57 Events for Episode 1 at Tavurvur
| |||||||||||||||||||||||||||||||||||||||||||||||||||||||||||||||||||||||||||||||||||||||||||||||||||||||||||||||||||||||||||||||||||||||||||||||||||||||||||||||||||||||||||||||||||||||||||||||||||||||||||||||||||||||||||||||||||||||||||||||||||||||||||||||||||||||||||||||||||||||||||||||||||||||
2011 Mar 29 - 2011 Aug 12 Confirmed Eruption Max VEI: 2
| Episode 1 | Eruption Episode | Tavurvur | |||||||||||||||||||||||||||||||||||||||||||||||||||||||||||||||||||||||||||||||||||||||||
|---|---|---|---|---|---|---|---|---|---|---|---|---|---|---|---|---|---|---|---|---|---|---|---|---|---|---|---|---|---|---|---|---|---|---|---|---|---|---|---|---|---|---|---|---|---|---|---|---|---|---|---|---|---|---|---|---|---|---|---|---|---|---|---|---|---|---|---|---|---|---|---|---|---|---|---|---|---|---|---|---|---|---|---|---|---|---|---|---|---|---|
| 2011 Mar 29 - 2011 Aug 12 | Evidence from Observations: Reported | |||||||||||||||||||||||||||||||||||||||||||||||||||||||||||||||||||||||||||||||||||||||||
|
List of 16 Events for Episode 1 at Tavurvur
| ||||||||||||||||||||||||||||||||||||||||||||||||||||||||||||||||||||||||||||||||||||||||||
2010 Jul 23 - 2010 Jul 25 Confirmed Eruption Max VEI: 1 (?)
| Episode 1 | Eruption Episode | Tavurvur | |||||||||||||||||||||||||||||||||||||||
|---|---|---|---|---|---|---|---|---|---|---|---|---|---|---|---|---|---|---|---|---|---|---|---|---|---|---|---|---|---|---|---|---|---|---|---|---|---|---|---|---|
| 2010 Jul 23 - 2010 Jul 25 | Evidence from Observations: Reported | |||||||||||||||||||||||||||||||||||||||
|
List of 6 Events for Episode 1 at Tavurvur
| ||||||||||||||||||||||||||||||||||||||||
2006 Aug 11 - 2010 Jan 31 Confirmed Eruption Max VEI: 4 (?)
| Episode 1 | Eruption Episode | Tavurvur | |||||||||||||||||||||||||||||||||||||||||||||||||||||||||||||||||||||||||||||||
|---|---|---|---|---|---|---|---|---|---|---|---|---|---|---|---|---|---|---|---|---|---|---|---|---|---|---|---|---|---|---|---|---|---|---|---|---|---|---|---|---|---|---|---|---|---|---|---|---|---|---|---|---|---|---|---|---|---|---|---|---|---|---|---|---|---|---|---|---|---|---|---|---|---|---|---|---|---|---|---|---|
| 2006 Aug 11 - 2010 Jan 31 | Evidence from Observations: Reported | |||||||||||||||||||||||||||||||||||||||||||||||||||||||||||||||||||||||||||||||
|
List of 14 Events for Episode 1 at Tavurvur
| ||||||||||||||||||||||||||||||||||||||||||||||||||||||||||||||||||||||||||||||||
2005 Jan 25 - 2006 Feb 17 Confirmed Eruption Max VEI: 2
| Episode 1 | Eruption Episode | Tavurvur | |||||||||||||||||||||||||||||||||||||||||||||||||
|---|---|---|---|---|---|---|---|---|---|---|---|---|---|---|---|---|---|---|---|---|---|---|---|---|---|---|---|---|---|---|---|---|---|---|---|---|---|---|---|---|---|---|---|---|---|---|---|---|---|---|
| 2005 Jan 25 - 2006 Feb 17 | Evidence from Observations: Reported | |||||||||||||||||||||||||||||||||||||||||||||||||
|
List of 8 Events for Episode 1 at Tavurvur
| ||||||||||||||||||||||||||||||||||||||||||||||||||
2002 Oct 6 (?) - 2004 Feb 17 Confirmed Eruption Max VEI: 2
| Episode 1 | Eruption Episode | Tavurvur | ||||||||||||||||||||||||||||||||||||||||||||||||||||||
|---|---|---|---|---|---|---|---|---|---|---|---|---|---|---|---|---|---|---|---|---|---|---|---|---|---|---|---|---|---|---|---|---|---|---|---|---|---|---|---|---|---|---|---|---|---|---|---|---|---|---|---|---|---|---|---|
| 2002 Oct 6 (?) - 2004 Feb 17 | Evidence from Observations: Reported | ||||||||||||||||||||||||||||||||||||||||||||||||||||||
|
List of 9 Events for Episode 1 at Tavurvur
| |||||||||||||||||||||||||||||||||||||||||||||||||||||||
1995 Nov 28 - 2001 Sep 5 ± 4 days Confirmed Eruption Max VEI: 2
| Episode 1 | Eruption Episode | Tavurvur | ||||||||||||||||||||||||||||||||||||||||||||||||||||||||||||||||||||||||||||||||||||
|---|---|---|---|---|---|---|---|---|---|---|---|---|---|---|---|---|---|---|---|---|---|---|---|---|---|---|---|---|---|---|---|---|---|---|---|---|---|---|---|---|---|---|---|---|---|---|---|---|---|---|---|---|---|---|---|---|---|---|---|---|---|---|---|---|---|---|---|---|---|---|---|---|---|---|---|---|---|---|---|---|---|---|---|---|---|
| 1995 Nov 28 - 2001 Sep 5 ± 4 days | Evidence from Observations: Reported | ||||||||||||||||||||||||||||||||||||||||||||||||||||||||||||||||||||||||||||||||||||
|
List of 15 Events for Episode 1 at Tavurvur
| |||||||||||||||||||||||||||||||||||||||||||||||||||||||||||||||||||||||||||||||||||||
1994 Sep 19 - 1995 Apr 16 Confirmed Eruption Max VEI: 4 (?)
| Episode 1 | Eruption Episode | Tavurvur and Vulcan | ||||||||||||||||||||||||||||||||||||||||||||||||||||||||||||||||||||||||||||||||||||||||||||||||||||||||
|---|---|---|---|---|---|---|---|---|---|---|---|---|---|---|---|---|---|---|---|---|---|---|---|---|---|---|---|---|---|---|---|---|---|---|---|---|---|---|---|---|---|---|---|---|---|---|---|---|---|---|---|---|---|---|---|---|---|---|---|---|---|---|---|---|---|---|---|---|---|---|---|---|---|---|---|---|---|---|---|---|---|---|---|---|---|---|---|---|---|---|---|---|---|---|---|---|---|---|---|---|---|---|---|---|---|
| 1994 Sep 19 - 1995 Apr 16 | Evidence from Observations: Reported | ||||||||||||||||||||||||||||||||||||||||||||||||||||||||||||||||||||||||||||||||||||||||||||||||||||||||
|
List of 19 Events for Episode 1 at Tavurvur and Vulcan
| |||||||||||||||||||||||||||||||||||||||||||||||||||||||||||||||||||||||||||||||||||||||||||||||||||||||||
1943 Nov 24 - 1943 Dec 23 (in or after) Confirmed Eruption Max VEI: 2
| Episode 1 | Eruption Episode | Tavurvur | |||||||||||||||||||||||||||||
|---|---|---|---|---|---|---|---|---|---|---|---|---|---|---|---|---|---|---|---|---|---|---|---|---|---|---|---|---|---|---|
| 1943 Nov 24 - 1943 Dec 23 (in or after) | Evidence from Observations: Reported | |||||||||||||||||||||||||||||
|
List of 4 Events for Episode 1 at Tavurvur
| ||||||||||||||||||||||||||||||
1941 Jun 6 - 1942 Mar 31 ± 30 days Confirmed Eruption Max VEI: 2
| Episode 1 | Eruption Episode | Tavurvur | |||||||||||||||||||||||||||||||||||||||||||||||||||||||||||||||||||||
|---|---|---|---|---|---|---|---|---|---|---|---|---|---|---|---|---|---|---|---|---|---|---|---|---|---|---|---|---|---|---|---|---|---|---|---|---|---|---|---|---|---|---|---|---|---|---|---|---|---|---|---|---|---|---|---|---|---|---|---|---|---|---|---|---|---|---|---|---|---|---|
| 1941 Jun 6 - 1942 Mar 31 ± 30 days | Evidence from Observations: Reported | |||||||||||||||||||||||||||||||||||||||||||||||||||||||||||||||||||||
|
List of 12 Events for Episode 1 at Tavurvur
| ||||||||||||||||||||||||||||||||||||||||||||||||||||||||||||||||||||||
1940 Feb 4 ± 4 days - 1940 May 18 Confirmed Eruption Max VEI: 1
| Episode 1 | Eruption Episode | Tavurvur | |||||||||||||||||||
|---|---|---|---|---|---|---|---|---|---|---|---|---|---|---|---|---|---|---|---|---|
| 1940 Feb 4 ± 4 days - 1940 May 18 | Evidence from Observations: Reported | |||||||||||||||||||
|
List of 2 Events for Episode 1 at Tavurvur
| ||||||||||||||||||||
1937 May 29 - 1937 Jun 2 Confirmed Eruption Max VEI: 4 (?)
| Episode 1 | Eruption Episode | Vulcan and Tavurvur | ||||||||||||||||||||||||||||||||||||||||||||||||||||||||||||||||||||||||||||||||||||
|---|---|---|---|---|---|---|---|---|---|---|---|---|---|---|---|---|---|---|---|---|---|---|---|---|---|---|---|---|---|---|---|---|---|---|---|---|---|---|---|---|---|---|---|---|---|---|---|---|---|---|---|---|---|---|---|---|---|---|---|---|---|---|---|---|---|---|---|---|---|---|---|---|---|---|---|---|---|---|---|---|---|---|---|---|---|
| 1937 May 29 - 1937 Jun 2 | Evidence from Observations: Reported | ||||||||||||||||||||||||||||||||||||||||||||||||||||||||||||||||||||||||||||||||||||
|
List of 15 Events for Episode 1 at Vulcan and Tavurvur
| |||||||||||||||||||||||||||||||||||||||||||||||||||||||||||||||||||||||||||||||||||||
1878 Jan 30 (?) - 1878 Feb 26 ± 2 days Confirmed Eruption Max VEI: 3
| Episode 1 | Eruption Episode | Vulcan Island and Tavurvur | |||||||||||||||||||||||||||||||||||||||||||||||||||||||||||||||||||||||||||||||
|---|---|---|---|---|---|---|---|---|---|---|---|---|---|---|---|---|---|---|---|---|---|---|---|---|---|---|---|---|---|---|---|---|---|---|---|---|---|---|---|---|---|---|---|---|---|---|---|---|---|---|---|---|---|---|---|---|---|---|---|---|---|---|---|---|---|---|---|---|---|---|---|---|---|---|---|---|---|---|---|---|
| 1878 Jan 30 (?) - 1878 Feb 26 ± 2 days | Evidence from Observations: Reported | |||||||||||||||||||||||||||||||||||||||||||||||||||||||||||||||||||||||||||||||
|
List of 14 Events for Episode 1 at Vulcan Island and Tavurvur
| ||||||||||||||||||||||||||||||||||||||||||||||||||||||||||||||||||||||||||||||||
1850 (?) Confirmed Eruption Max VEI: 2
| Episode 1 | Eruption Episode | Sulfur Creek | ||||||||||||||||||||||||||||||||||||||||||||||||||||||
|---|---|---|---|---|---|---|---|---|---|---|---|---|---|---|---|---|---|---|---|---|---|---|---|---|---|---|---|---|---|---|---|---|---|---|---|---|---|---|---|---|---|---|---|---|---|---|---|---|---|---|---|---|---|---|---|
| 1850 (?) - Unknown | Evidence from Observations: Reported | ||||||||||||||||||||||||||||||||||||||||||||||||||||||
|
List of 9 Events for Episode 1 at Sulfur Creek
| |||||||||||||||||||||||||||||||||||||||||||||||||||||||
1791 May 22 Confirmed Eruption Max VEI: 2 (?)
| Episode 1 | Eruption Episode | Tavurvur | |||||||||||||||||||
|---|---|---|---|---|---|---|---|---|---|---|---|---|---|---|---|---|---|---|---|---|
| 1791 May 22 - Unknown | Evidence from Observations: Reported | |||||||||||||||||||
|
List of 2 Events for Episode 1 at Tavurvur
| ||||||||||||||||||||
1767 Sep 10 Confirmed Eruption Max VEI: 2
| Episode 1 | Eruption Episode | Tavurvur ? | |||||||||||||||||||
|---|---|---|---|---|---|---|---|---|---|---|---|---|---|---|---|---|---|---|---|---|
| 1767 Sep 10 - Unknown | Evidence from Observations: Reported | |||||||||||||||||||
|
List of 2 Events for Episode 1 at Tavurvur ?
| ||||||||||||||||||||
1450 ± 150 years Confirmed Eruption
| Episode 1 | Eruption Episode | NE caldera rim (Rabalanakia) | ||||||||||||||||||||||||
|---|---|---|---|---|---|---|---|---|---|---|---|---|---|---|---|---|---|---|---|---|---|---|---|---|---|
| 1450 ± 150 years - Unknown | Evidence from Correlation: Tephrochronology | ||||||||||||||||||||||||
|
List of 3 Events for Episode 1 at NE caldera rim (Rabalanakia)
| |||||||||||||||||||||||||
0683 ± 2 years Confirmed Eruption Max VEI: 6
| Episode 1 | Eruption Episode | |||||||||||||||||||||||||||||||||||
|---|---|---|---|---|---|---|---|---|---|---|---|---|---|---|---|---|---|---|---|---|---|---|---|---|---|---|---|---|---|---|---|---|---|---|---|
| 0683 ± 2 years - Unknown | Evidence from Isotopic: 14C (calibrated) | ||||||||||||||||||||||||||||||||||
|
List of 5 Events for Episode 1
| |||||||||||||||||||||||||||||||||||
There is data available for 2 deformation periods. Expand each entry for additional details.
| Start Date: 2007 | Stop Date: 2011 | Direction: Subsidence | Method: InSAR |
| Magnitude: Unknown | Spatial Extent: Unknown | Latitude: Unknown | Longitude: Unknown |
Remarks: InSAR time series shows long-term deflation at Matupit Island. | |||
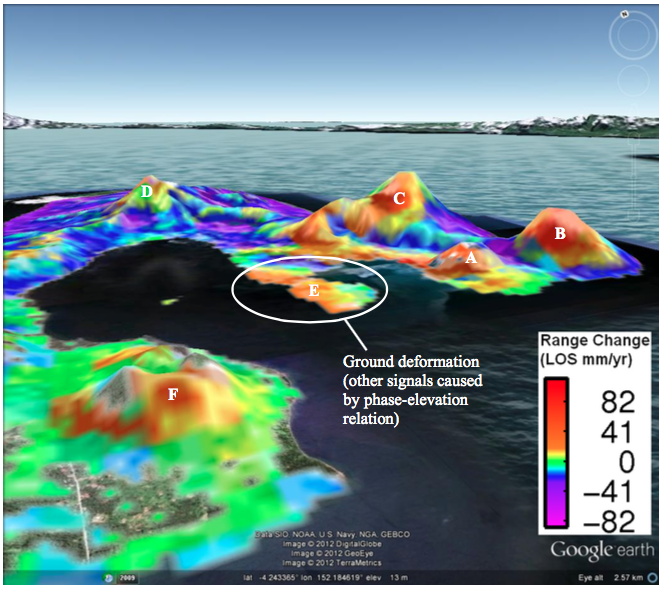 |
Visualisation of 79 interferogram stack (see Figure 4.3.3a) draped over Google Earth topography, which has been vertically exaggerated by a factor of 2. The range change signals at Tavurvur (A), Vulcan (F), Turangunan (B), Kabiu (C) and Tovanumbatir (D) are strongly associated with areas of high elevation. These misleading signals are due to the relationship between phase and elevation caused by variation in radar propagation through the vertically stratified troposphere (Beauducel & Briole 2000). On the other hand, Matupit Island (E) is very low elevation and the positive LOS range change appears to be indicative of ground deflation. From: Romeyn and Garthwaite 2012. |
||
Reference List: Romeyn and Garthwaite 2012; Hutchinson and Dawson 2009.
Full References:
Hutchinson, D. K., and J. H. Dawson, 2009. Satellite Radar Interferometry: Application to Rabaul Caldera. Geoscience Australia Record 2009/39, 19 pp.
Romeyn, R. P., and M. C. Garthwaite,, 2012. Broad-scale volcano monitoring in Papua New Guinea using satellite Interferometric Synethetic Aperture Radar. Record 2012/49, Geoscience Australia: Canberra, 50 pp.
| Start Date: 1973 | Stop Date: 1982 | Direction: Uplift | Method: Leveling |
| Magnitude: 100.000 cm | Spatial Extent: Unknown | Latitude: Unknown | Longitude: Unknown |
Remarks: The southern end of Matupit Island uplited about 1 meter since at least 1973 to 1982. | |||
Reference List: McKee et al. 1985.
Full References:
McKee, C. O., Johnson, R. W., Lowenstein, P. L., Riley, S. J., Blong, R. J., de Saint Ours, P., & Talai, B., 1985. Rabaul caldera, Papua New Guinea: volcanic hazards, surveillance, and eruption contingency planning. J. Volcanol. Geotherm. Res., 23(3-4): 195-237. https://doi.org/10.1016/0377-0273(85)90035-6
There is data available for 3 emission periods. Expand each entry for additional details.
| Start Date: 2014 Aug 29 | Stop Date: 2014 Aug 29 | Method: Satellite (Aura OMI) |
| SO2 Altitude Min: 18 km | SO2 Altitude Max: 18 km | Total SO2 Mass: 31 kt |
Data Details
| Date Start | Date End | Assumed SO2 Altitude | SO2 Algorithm | SO2 Mass |
| 20140829 | 18.0 | 31.000 |
| Start Date: 2006 Oct 07 | Stop Date: 2006 Oct 07 | Method: Satellite (Aura OMI) |
| SO2 Altitude Min: 18 km | SO2 Altitude Max: 18 km | Total SO2 Mass: 300 kt |
Data Details
| Date Start | Date End | Assumed SO2 Altitude | SO2 Algorithm | SO2 Mass |
| 20061007 | 18.0 | 300.000 |
| Start Date: 1994 Sep 19 | Stop Date: 1994 Sep 19 | Method: Satellite (Meteor-3 TOMS) |
| SO2 Altitude Min: 20 km | SO2 Altitude Max: 20 km | Total SO2 Mass: 200 kt |
Data Details
| Date Start | Date End | Assumed SO2 Altitude | SO2 Algorithm | SO2 Mass |
| 19940919 | 20.0 | 200.000 |
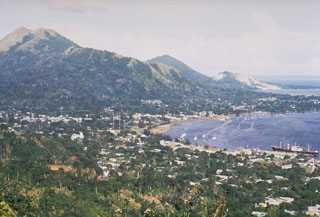 The city of Rabaul is seen here in 1969. The low-lying Rabaul caldera forms a sheltered harbor once utilized by New Britain's largest city. A powerful explosive eruption in 1994 forced its evacuation. The 8 x 14 km caldera opens on the W, where its floor is flooded by Blanche Bay. Two major Holocene caldera-forming eruptions took place as recently as 3,500 and 1,400 years ago. Several post-caldera cones, including Tavurvur to the far right, have recorded eruptions.
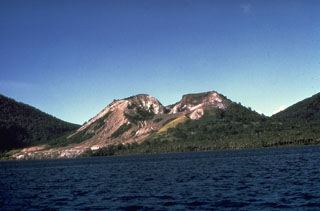 Tavurvur, seen here from the SW on a boat in Matupit Harbor, is one of several post-caldera cones constructed along the NE margin of Rabaul caldera. The cone has an irregular crater rim with a low point on the SW side; its summit and flanks have several overlapping craters. Tavurvur has been the most active of Rabaul's volcanoes, with recorded eruptions since the 18th century. Tavurvur erupted simultaneously with Vulcan on the SW side of the caldera in 1937 and again in 1994.
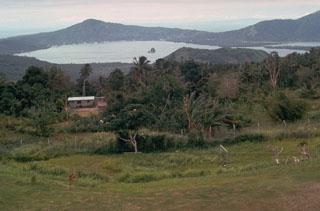 The second of two Holocene caldera-producing eruptions at Rabaul volcano took place about 1,400 years ago. The eruption produced voluminous ashfall and pyroclastic flow deposits, followed by collapse that created the 8 x 14 km caldera, seen here from near its SW rim. The eruption originated from a location near the small, steep-sided island in the center of the bay, Davapia Rocks (also known as The Beehive), an erosional remnant of a post-caldera cone.
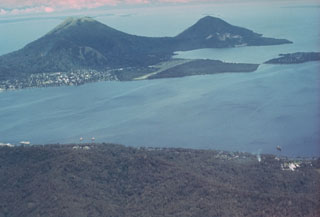 Rabaul caldera and Blanche Bay are seen here from the west. Two pre-caldera cones lie across the bay, Mount Kombiu (known as The Mother) on the left and Mount Turangunan (known as the South Daughter) on the right. Rabaul city lies below Kombiu, and the post-caldera Tavurvur is the partly unvegetated volcano below and to the right of Turangunan. Flat-lying Matupit Island (upper right) has undergone significant uplift during recent periods of caldera unrest.
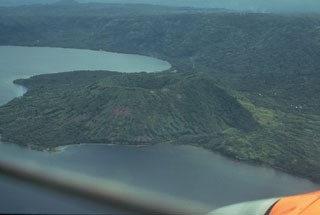 The largest historical Rabaul eruption took place from 29 May to 2 June 1937 from two vents on opposite sides of the caldera, Vulcan and Tavurvur. Present-day Vulcan, seen here from the NE, was built up from sea level to a height of 243 m during four days of powerful explosive eruptions that ended the evening of 2 June. About 500 people were killed by pyroclastic flows and heavy ashfall. Rabaul city was buried by ash and pumice, and a tsunami swept ships onto the shore. Tavurvur was active for less than one day.
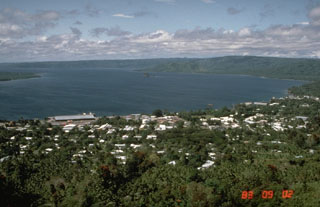 Simpson harbor, seen here from Rabaul Volcano Observatory overlooking the city of Rabaul in 1983, fills the NW part of 8 x 14 km Rabaul caldera. Matupit Island appears at the left margin of the photo, and Vulcan, the site of major eruptions in 1937 and 1994, is the low cone across the harbor at the right-center.
 A volcanologist from the Rabaul Volcano Observatory beside an instrument used to make electronic distance measurements (EDM) across Rabaul caldera. Repeated precise measurements of the distance to stations on opposite sides of the caldera are used for monitoring the slow decade-long deformation that preceded a major eruption in 1994. Two pre-caldera peaks, Mount Kombiu (left) and Mount Turanguna (right) are located near the NE caldera rim.
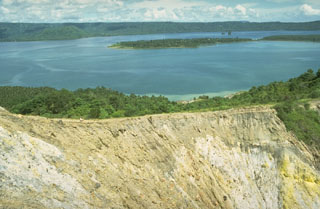 Rabaul caldera is seen here in 1984 beyond the sulfur-coated walls of Tavurvur crater, located on a post-caldera cone on the NE side of the caldera. Matupit Island lies across Greet Harbor, and the flat-topped Vulcan cone appears on the opposite side of the caldera below the low western caldera rim.
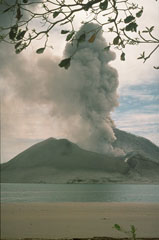 An ash plume rises above Tavurvur volcano on 3 October 1994, two weeks after the onset of a major eruption of Rabaul caldera. Tavurvur, one of two volcanoes that were active on opposite sides of the caldera, is seen here from the west at Kaputin Point on Matupit Island. The brown area in the foreground is a raft of floating pumice from the 19 September-2 October eruption of Vulcan volcano on the W side of the caldera.
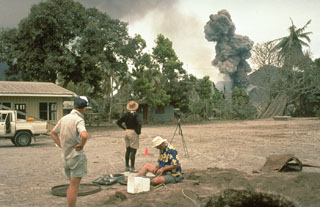 Scientists from the Rabaul Volcano Observatory and the U.S. Geological Survey observe an eruption plume from Tavurvur volcano on 4 October 1994, while conducting deformation measurements on Matupit Island. This location was a tilt site where repeated measurements of uplift or subsidence were made during the course of the eruption. The pit at the lower right was excavated to study ashfall deposits from the eruption.
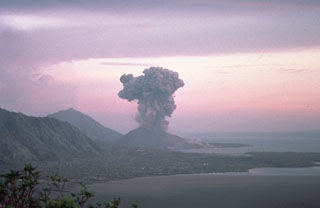 Eruptions from Tavurvur and Vulcan began within about an hour of each other on 19 September 1994. Powerful explosions from Vulcan produced ash plumes estimated to be as high as 21-30 km, pyroclastic flows that extended about 3 km, and the large rafts of floating pumice seen in the foreground of this photo. About 53,000 people were evacuated from Rabaul and surrounding areas, and there were few fatalities. Vulcan stopped erupting on 2 October, but Tavurvur, seen here from the NW in October, continued erupting into 1995.
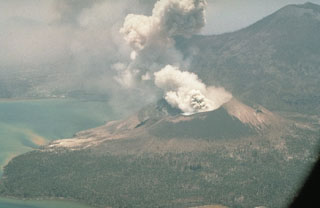 Tavurvur ejects an ash plume in October 1994, following an eruption that began on 19 September. It is seen here from a helicopter with Kombiu volcano (upper right) to the N. Intermittent eruptive activity continued at Tavurvur for several years after the 1994 eruption.
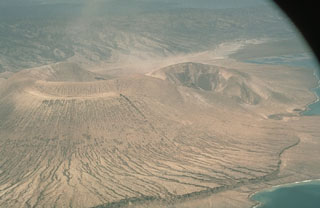 Vulcan, seen here from the SE, was the source of the largest eruptions at Rabaul in 1994. Vulcan began erupting on 19 September from a N-flank vent. Activity intensified rapidly, producing a large eruption column that reached an altitude of 20 km. Pyroclastic flows traveled radially down the flanks of the cone as far as 3 km and resulted in darkness in Rabaul city. The eruption originated from a N-S-trending fissure, seen here at the right. The scarp in the foreground was produced by a 5-m uplift the day before the eruption.
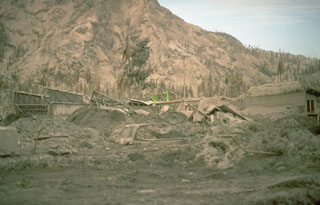 Thick deposits of ash from the 1994 eruption of Rabaul volcano covered the city of Rabaul, partially burying cars and houses. The eruption forced the abandonment of the town, once the largest on the island of New Britain, and a total of 53,000 people were evacuated from the city and surrounding areas. An estimated 30,000 people evacuated the day the eruption began, and the remainder left by land and by sea the following day.
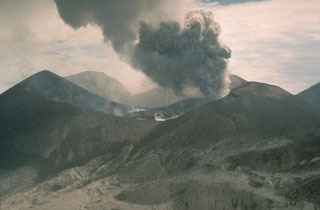 Lava in the center of the crater of Tavurvur volcano on 7 October 1994 as an ash plume rises from a vent to the E. Impact craters from volcanic bombs ejected by the volcano can be seen in the foreground on the flanks of the cone. Explosive eruptions from Tavurvur began on 19 September. Ash plumes initially reached a maximum height of 6 km, although typical heights were 1-2 km. A small lava flow was first seen in the summit crater of Tavurvur on 30 September.
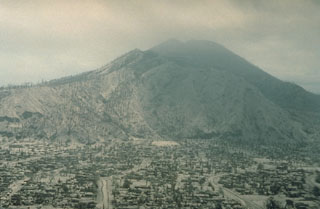 The city of Rabaul lies buried beneath a thick blanket of ash from the 1994 eruption. Mount Kombiu rises to the west above the deserted streets of the town. Ashfall from Tavurvur volcano during the first few days of the eruption caused widespread damage. Virtually every building in the south part of the town collapsed. Heavy rainfall at the time of the eruption produced lahars that caused additional damage.
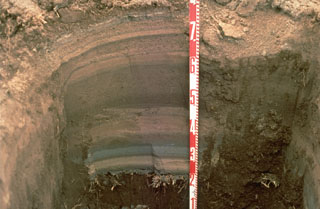 Tephra layers from the 1994 eruption of Rabaul volcano are exposed in this pit dug at the eastern end of Rabaul town in Papua New Guinea. Individual layers are ashfall deposits from discrete explosive eruptions that occurred over three weeks. The light-colored layer near the bottom was produced by an eruption from Vulcan cone at the western end of the caldera. Most other layers originated from periodic explosions at the Tavurvur cone, closer to this site. The numbers on the scale mark 10-cm increments.
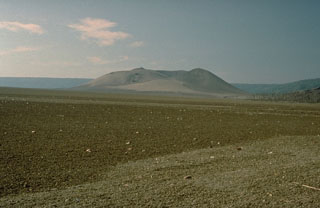 A large raft of floating brownish pumice from the 1994 eruption of Rabaul volcano obscures the surface of Blanche Bay. The pumice originated from Vulcan volcano (center) during a series of explosive eruptions beginning on 19 September. The larger, light-colored objects in the pumice raft are floating coconuts. This photo was taken on 11 October, three weeks after the start of the eruption, and nine days after activity ceased at Vulcan.
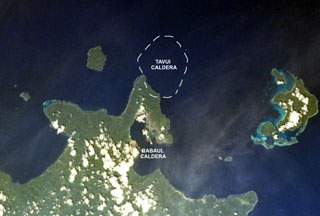 The mostly submarine Tavui caldera at the NE end of New Britain lies off the tip of the Gazelle Peninsula. The SW wall of the roughly 10 x 12 km wide caldera, its margins crudely shown on this image, cuts the NE tip of the peninsula. Tavui caldera, much less known than Rabaul caldera to the S, was first discovered during a bathymetric cruise in 1985. Light ash-covered areas from the 1994 Rabaul eruption can be seen at the western and NE margins of Rabaul caldera in this 1999 NASA Space Shuttle image.
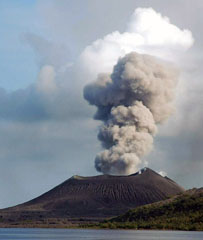 An ash plume rises above Tavurvur volcano at the eastern end of the island of New Britain in Papua New Guinea on 5 June 2005, seen from the SE. Explosive activity had resumed at Tavurvur on 25 January 2005 and continued intermittently until November of that year, occasionally depositing ash on the town of Rabaul. Incandescent ejecta was periodically observed at night time.
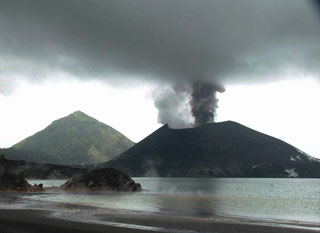 Tavurvur cone at Rabaul is seen in eruption in this 25 May 2005 view looking from the NW across Matupit Harbor. Two plumes, one white and the other dark gray, are originating from separate vents. Intermittent small-to-moderate explosive eruptions took place throughout much of the year. The conical peak in the background is Turanguna.
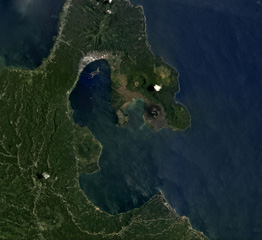 The 8 x 14 km Rabaul caldera is in the center of this September 2018 Planet Labs satellite image monthly mosaic (N is at the top), with several cones that have formed along the perimeter. Tavurvur is the unvegetated cone on the peninsula to the E, then to the NW of that is the crater of Palangiagia. The cone in the middle of the coastline within the harbor is Vulcan. The eroded cone to the north is Tovanumbatir.
The maps shown below have been scanned from the GVP map archives and include the volcano on this page. Clicking on the small images will load the full 300 dpi map. Very small-scale maps (such as world maps) are not included. The maps database originated over 30 years ago, but was only recently updated and connected to our main database. We welcome users to tell us if they see incorrect information or other problems with the maps; please use the Contact GVP link at the bottom of the page to send us email.
The following 8 samples associated with this volcano can be found in the Smithsonian's NMNH Department of Mineral Sciences collections, and may be availble for research (contact the Rock and Ore Collections Manager). Catalog number links will open a window with more information.
| Catalog Number | Sample Description | Lava Source | Collection Date |
|---|---|---|---|
| NMNH 112012 | Dacite | MATUPI | 1 Feb 1970 |
| NMNH 112013 | Sulfur | MATUPI | 1 Feb 1970 |
| NMNH 112014 | Sulfur | MATUPI | 1 Feb 1970 |
| NMNH 112015 | Sulfur | MATUPI | 1 Feb 1970 |
| NMNH 112016 | Sulfur | MATUPI | 1 Feb 1970 |
| NMNH 112017 | Sulfur | MATUPI | 1 Feb 1970 |
| NMNH 112018 | Sulfur | MATUPI | 1 Feb 1970 |
| NMNH 112019 | Sulfur | MATUPI | 1 Feb 1970 |
| Copernicus Browser | The Copernicus Browser replaced the Sentinel Hub Playground browser in 2023, to provide access to Earth observation archives from the Copernicus Data Space Ecosystem, the main distribution platform for data from the EU Copernicus missions. |
| MIROVA | Middle InfraRed Observation of Volcanic Activity (MIROVA) is a near real time volcanic hot-spot detection system based on the analysis of MODIS (Moderate Resolution Imaging Spectroradiometer) data. In particular, MIROVA uses the Middle InfraRed Radiation (MIR), measured over target volcanoes, in order to detect, locate and measure the heat radiation sourced from volcanic activity. |
| MODVOLC Thermal Alerts | Using infrared satellite Moderate Resolution Imaging Spectroradiometer (MODIS) data, scientists at the Hawai'i Institute of Geophysics and Planetology, University of Hawai'i, developed an automated system called MODVOLC to map thermal hot-spots in near real time. For each MODIS image, the algorithm automatically scans each 1 km pixel within it to check for high-temperature hot-spots. When one is found the date, time, location, and intensity are recorded. MODIS looks at every square km of the Earth every 48 hours, once during the day and once during the night, and the presence of two MODIS sensors in space allows at least four hot-spot observations every two days. Each day updated global maps are compiled to display the locations of all hot spots detected in the previous 24 hours. There is a drop-down list with volcano names which allow users to 'zoom-in' and examine the distribution of hot-spots at a variety of spatial scales. |
|
WOVOdat
Single Volcano View Temporal Evolution of Unrest Side by Side Volcanoes |
WOVOdat is a database of volcanic unrest; instrumentally and visually recorded changes in seismicity, ground deformation, gas emission, and other parameters from their normal baselines. It is sponsored by the World Organization of Volcano Observatories (WOVO) and presently hosted at the Earth Observatory of Singapore.
GVMID Data on Volcano Monitoring Infrastructure The Global Volcano Monitoring Infrastructure Database GVMID, is aimed at documenting and improving capabilities of volcano monitoring from the ground and space. GVMID should provide a snapshot and baseline view of the techniques and instrumentation that are in place at various volcanoes, which can be use by volcano observatories as reference to setup new monitoring system or improving networks at a specific volcano. These data will allow identification of what monitoring gaps exist, which can be then targeted by remote sensing infrastructure and future instrument deployments. |
| Volcanic Hazard Maps | The IAVCEI Commission on Volcanic Hazards and Risk has a Volcanic Hazard Maps database designed to serve as a resource for hazard mappers (or other interested parties) to explore how common issues in hazard map development have been addressed at different volcanoes, in different countries, for different hazards, and for different intended audiences. In addition to the comprehensive, searchable Volcanic Hazard Maps Database, this website contains information about diversity of volcanic hazard maps, illustrated using examples from the database. This site is for educational purposes related to volcanic hazard maps. Hazard maps found on this website should not be used for emergency purposes. For the most recent, official hazard map for a particular volcano, please seek out the proper institutional authorities on the matter. |
| IRIS seismic stations/networks | Incorporated Research Institutions for Seismology (IRIS) Data Services map showing the location of seismic stations from all available networks (permanent or temporary) within a radius of 0.18° (about 20 km at mid-latitudes) from the given location of Rabaul. Users can customize a variety of filters and options in the left panel. Note that if there are no stations are known the map will default to show the entire world with a "No data matched request" error notice. |
| UNAVCO GPS/GNSS stations | Geodetic Data Services map from UNAVCO showing the location of GPS/GNSS stations from all available networks (permanent or temporary) within a radius of 20 km from the given location of Rabaul. Users can customize the data search based on station or network names, location, and time window. Requires Adobe Flash Player. |
| DECADE Data | The DECADE portal, still in the developmental stage, serves as an example of the proposed interoperability between The Smithsonian Institution's Global Volcanism Program, the Mapping Gas Emissions (MaGa) Database, and the EarthChem Geochemical Portal. The Deep Earth Carbon Degassing (DECADE) initiative seeks to use new and established technologies to determine accurate global fluxes of volcanic CO2 to the atmosphere, but installing CO2 monitoring networks on 20 of the world's 150 most actively degassing volcanoes. The group uses related laboratory-based studies (direct gas sampling and analysis, melt inclusions) to provide new data for direct degassing of deep earth carbon to the atmosphere. |
| Large Eruptions of Rabaul | Information about large Quaternary eruptions (VEI >= 4) is cataloged in the Large Magnitude Explosive Volcanic Eruptions (LaMEVE) database of the Volcano Global Risk Identification and Analysis Project (VOGRIPA). |
| EarthChem | EarthChem develops and maintains databases, software, and services that support the preservation, discovery, access and analysis of geochemical data, and facilitate their integration with the broad array of other available earth science parameters. EarthChem is operated by a joint team of disciplinary scientists, data scientists, data managers and information technology developers who are part of the NSF-funded data facility Integrated Earth Data Applications (IEDA). IEDA is a collaborative effort of EarthChem and the Marine Geoscience Data System (MGDS). |

