INGEOMINAS reported that during 15-21 May seismicity at Galeras was at a low level; during 19-20 May earthquakes with magnitudes 2.6 or less were concentrated in an area 3 km SW at depths near 4 km. Gas plumes rose 500 m above the crater and contained small amounts of ash during 15-16 and 20-21 May. Sulfur dioxide emissions were low. The Alert Level remained at III (Yellow; "changes in the behavior of volcanic activity").
Source: Servicio Geológico Colombiano (SGC)
Eruption with ash plumes May 2012-January 2014; steam emissions through 2017
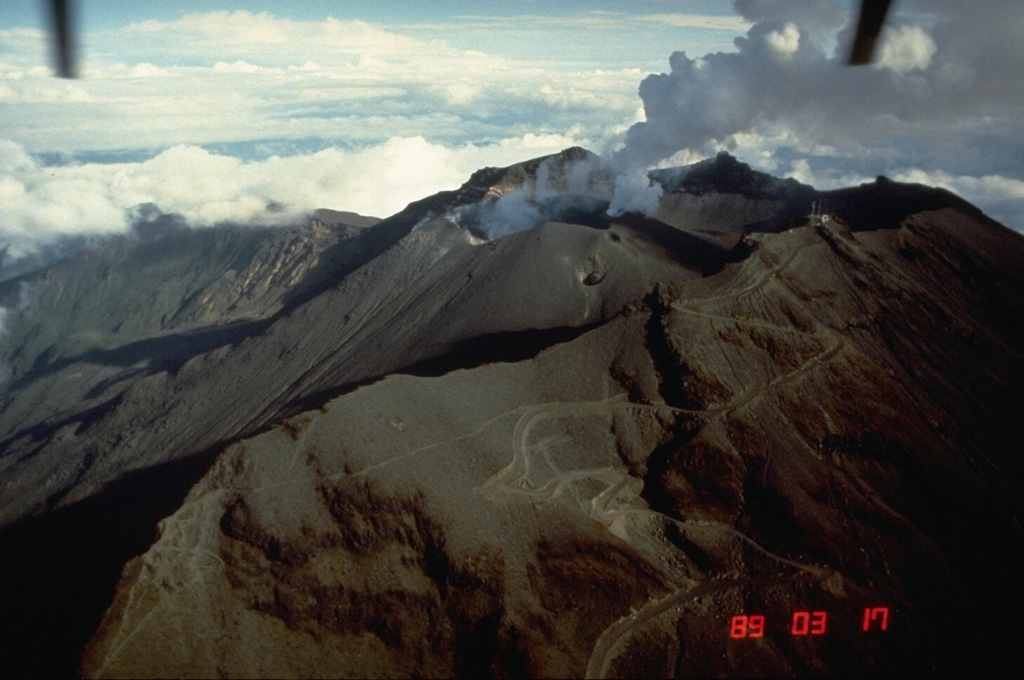
A central cone slightly lower than the summit caldera rim has been the site of numerous small-to-moderate historical eruptions recorded since the time of the Spanish conquistadors at Colombia's Galeras volcano. Persistent steam and gas, and occasional ash emissions from multiple vents around the summit have characterized activity for many years. Steam plumes are generally visible from two sites at the summit of the pyroclastic cone. Two small craters, known as Chavas and El Paisita, are located on the N and W rim of the larger central summit crater. Information for this report was gathered primarily from monthly technical reports provided by the Observatorio Vulcanológico y Sismológico de Pasto (OVSP) of the Sevicio Geologico Colombiano (SGC). Four webcams document the activity from the Observatorio Vulcanológico y Sismológico de Pasto (OVSP) located in Pasto (8 km ESE), from Consacá (11 km W), from the top of Galeras in the area called Barranco Alto (2.6 km NW), and from the SW flank at an area called Bruma.
The last time an Alert Level 1 (Red: imminent eruption or in progress) was issued was on 25 August 2010 when a plume of gas and ash rose 300 m above the summit and dispersed ash over numerous communities up to 30 km away. Seismicity decreased the following day, and steam and gas-only emissions returned. Fumarolic activity persisted throughout 2011, with only a single mention of possible low ash content in the plumes observed on 31 March and 1 April. Steam plumes rose a few hundred meters from the summit crater during January-May 2012. Seismic swarms were recorded in April and May.
An eruption with ash emissions began on 13 May 2012 and persisted until 30 January 2014 (BGVN 37:04, 38:03, 39:01). A summary of activity during that eruptive episode is provided below, along with additional information not previously reported. Activity after the end of that eruption, from February 2014 through December 2017, included only steam and gas emissions from the summit crater, and low levels of seismicity.
Activity during 2012. During January and February 2012, steam plumes rose 900-1,000 m above the summit, emerging from the El Paisita and Chavas vents at the N and W rims of the summit crater (figure 130). Plumes rose higher during March, reaching 1,900 m. VT seismic swarms were reported between 11 and 16 April 2012, and deformation sensors recorded inflation towards the W flank beginning in April. Most of the seismicity was located within the vicinity of the summit crater at depths less than 5 km. Steam plumes rose to 2,300 m above summit in April (figure 131).
 |
Figure 130. Volcán Galeras, viewed at 1828 local time from Barranco Alto (2.6 km NW) on 16 February 2012, showed typical low-level steam plumes rising from vents on the N and W rims of the summit crater. Courtesy of SGC (Informe mensual de actividad de Los Volcanes Galeras, Cumbal, Doña Juana, Azufral, Las Ánimas, Chiles Y Cerro Negro, febrero de 2012). |
 |
Figure 131. A substantial steam plume rose from Galeras in this image taken from OVSP (Observatorio Vulcanológico y Sismológico de Pasto) headquarters (8 km SE) on 20 April 2012 at 0738 local. Courtesy of SGC (Informe mensual de actividad de Los Volcanes Galeras, Cumbal, Doña Juana, Azufral, Las Ánimas, Chiles Y Cerro Negro, abril de 2012). |
Steam plumes rose less than 200 m above the summit at the beginning of May; a second swarm of VT seismic events on 9 and 10 May 2012 preceded a new sequence of ash emissions that began on 13 May. Pulsating plumes of ash rose less than 800 m and deposited material primarily on the upper NW flank. Inflation continued to be measured in the inclinometers on the W flank, coinciding with the area of the epicenters of the 9-10 May seismic swarm. Ash-bearing emissions were reported on 13, 14, 17, 26 (figure 132), 27, and 30 May.
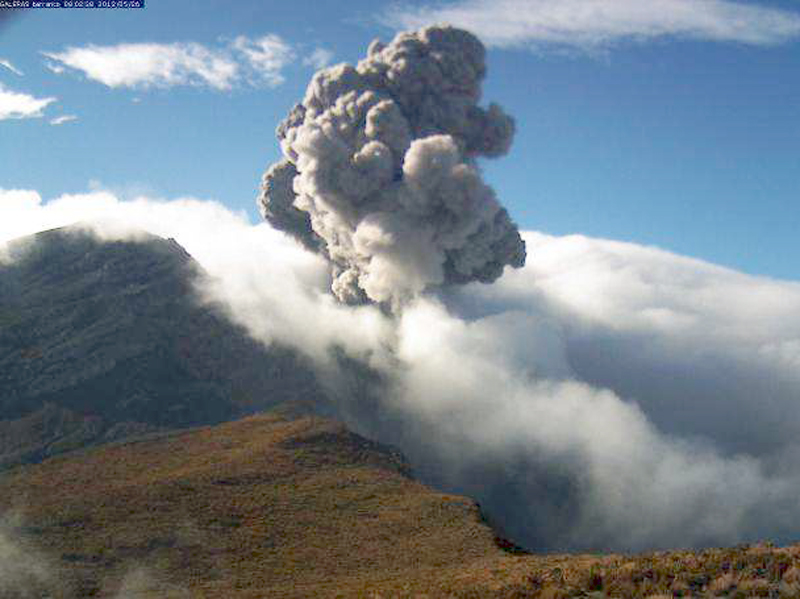 |
Figure 132. An ash emission rose from Galeras at 0802 local time on 26 May 2012 and was recorded by the Barranco Alta webcam on the NW flank. Courtesy of SGC (Informe mensual de actividad de Los Volcanes Galeras, Cumbal, Doña Juana, Azufral, Las Ánimas, Chiles Y Cerro Negro, mayo de 2012). |
Ash emissions continued during June-August 2012. Plume heights during the period ranged from 1,300-2,500 m above the summit. Plumes recorded on 12 and 17 June (figure 133) resulted in ashfall in Sandoná (14 km NW) and Samaniego (32 km NW), Mapachico (9 km NE), and Genoy (7 km NNE). Additional days with reports of ash emissions included 5, 6, 8, 19, 22, 27 and 29 June. Ash-bearing emissions were reported on at least 16 days during July with reports of ashfall in Maragato, Chorillo (18 km W) and Genoy. Ash plumes rose to 2,500 m above the summit during at least nine different days of August, and ashfall was reported again in the Genoy area.
 |
Figure 133. Seismogram and spectrogram of a tremor (TRE) event recorded at 1605 local time on 17 June 2012 that was associated with an ash emission from Galeras as viewed from the Barranca (upper left), OVSP (upper and lower right), and Consacá (lower left) webcams (11 km W). Courtesy of SGC (Informe mensual de actividad de Los Volcanes Galeras, Cumbal, Doña Juana, Azufral, Las Ánimas, Chiles Y Cerro Negro, junio de 2012). |
Tremor associated with gas and ash emissions persisted throughout September 2012; another VT seismic swarm was reported on 28 September. Ash-bearing emissions were reported during at least seven days of the month, and reached 2,000 m above the crater (figure 134). During at least 16 days of October, tremors were associated with ash emissions that rose as high as 1,800 m. On 19 October, fine-grained ashfall was reported by personnel of the Observatory who were working on the upper NE flank.
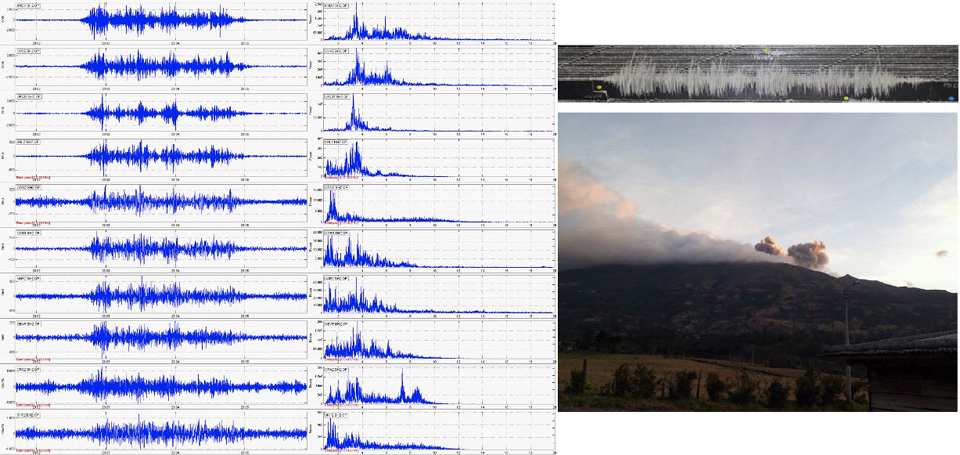 |
Figure 134. Gas and ash emissions at Galeras on 12 September 2012 were recorded photographically from the El Vergel Shelter in Pasto around 1805 local time, at most of the digital seismograph stations around the volcano, and also at the analog recorder at the Anganoy station (upper right) in Pasto (Provided by Architect Darío Gómez of the Municipal Council for Risk and Disaster Management (DMGRD) of the municipality of Pasto). Courtesy of SGC (Informe mensual de actividad de Los Volcanes Galeras, Cumbal, Doña Juana, Azufral, Las Ánimas, Chiles Y Cerro Negro, septiembre de 2012). |
Gas and ash plumes rose 1,000-1,300 m during November and December 2012 and were also associated with tremor signals. The most significant emissions were observed on 1, 7, 14, 22, 23, 29 and 30 November, and 17 (figure 135), 19, 21, 26, 27 and 29 December.
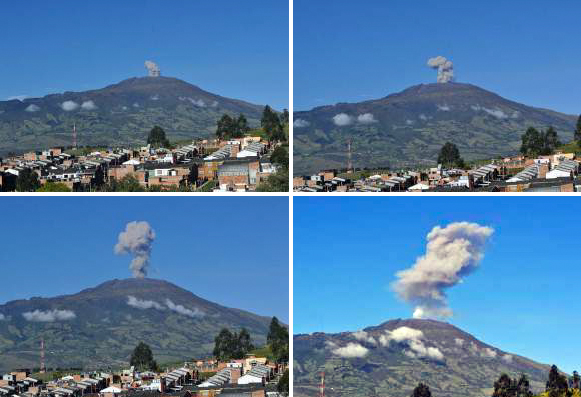 |
Figure 135. Ash emissions rose from Galeras on the morning of 17 December 2012 as seen in this series of images from the OVSP webcam while seismographs recorded tremor-type events. Courtesy of SGC (Informe mensual de actividad de Los Volcanes Galeras, Cumbal, Doña Juana, Azufral, Las Ánimas, Chiles Y Cerro Negro, diciembre de 2012). |
Activity during 2013. Continuous inflation towards the western flank was measured beginning in April 2012. Similar deformation processes continued at Galeras during much of 2013. The 'Crater' inclinometer located about 0.8 km E of the summit crater showed the most significant amount of westward inflation (figure 136).
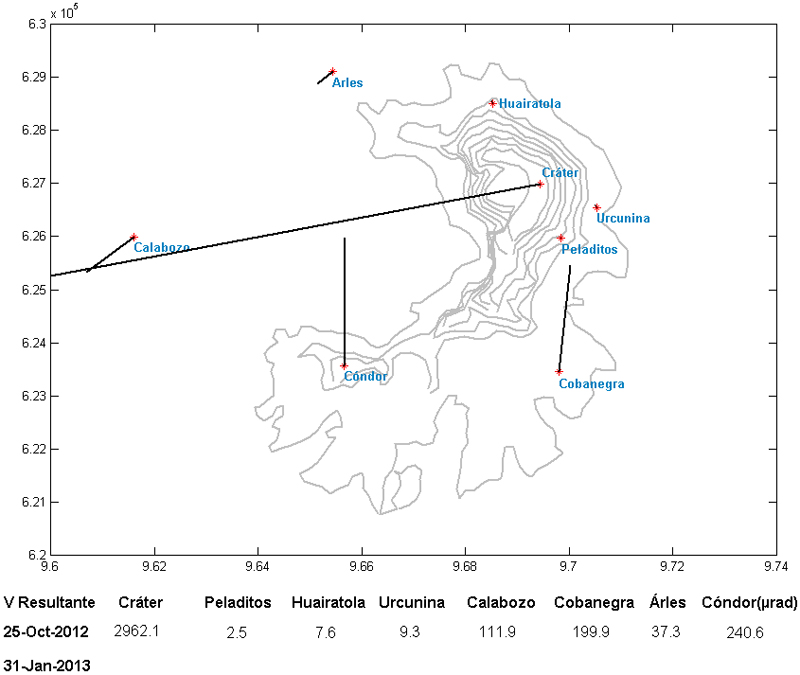 |
Figure 136. Resultant vectors for the electronic inclinometers at Galeras for the period between 25 October 2012 and 31 January 2013 show 2,962.1 microradians (µrad) of movement to the W at the 'Crater' inclinometer as well as movement to the N and SW at several other instruments. Courtesy of SGC (Informe mensual de actividad de Los Volcanes Galeras, Cumbal, Doña Juana, Azufral, Las Ánimas, Chiles Y Cerro Negro, enero de 2013). |
Eruptive activity continued in a similar manner to 2012 throughout 2013. During January, ash-bearing emissions rose up to 1,000 m at least nine times and drifted in various directions. The emission event of 22 January caused ashfall in Sandoná (13 km NW). During February, the most notable seismic activity was several tremor events associated with ash emissions. Plume heights remained below 1,500 m and were observed on at least 11 days of the month. There were reports of ashfall in San Isidro, the upper part of the municipality of Sandoná, NW of the volcano, during the morning of 24 February. Most of the ash emissions during March 2013 were deposited on the upper NW flank. The Crater, Cobanegra, and Calabozo inclinometers continued to show movement associated with inflation towards the W flank during March and April. Gas and ash plumes reached 1,000 m above the summit on 6, 7, 11, 22 and 25 March. Activity was similar during April, with plumes rising to 1,200 m and seismic tremors associated with ash and gas emissions reported on at least 13 days (figures 137 and 138).
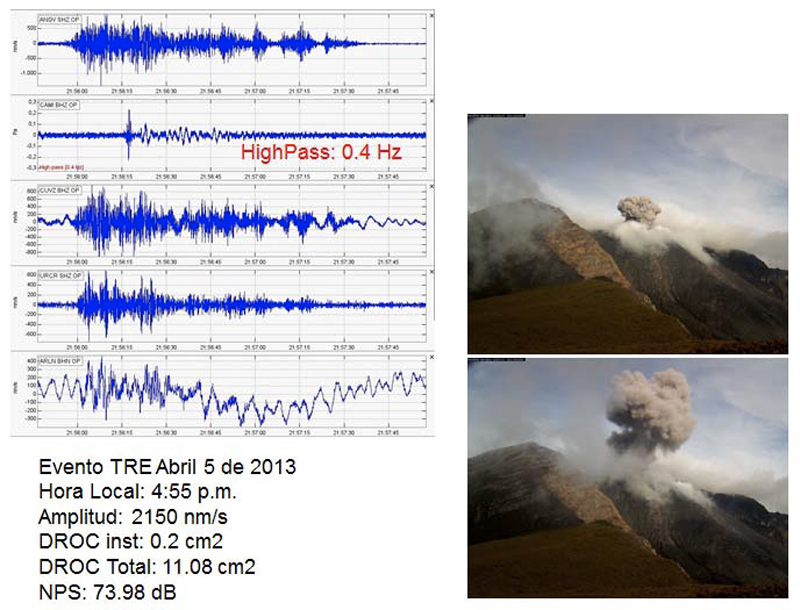 |
Figure 137. Seismograms registered a tremor-type event (TRE) on 5 April 2013 at Galeras that was associated with ash emissions captured in the Barranca webcam. Courtesy of SGC (Informe mensual de actividad de Los Volcanes Galeras, Cumbal, Doña Juana, Azufral, Las Ánimas, Chiles Y Cerro Negro, abril de 2013). |
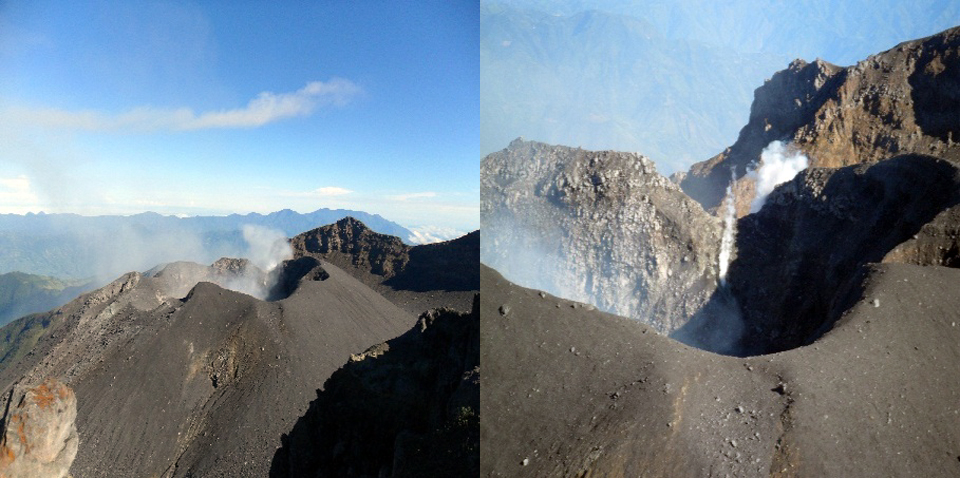 |
Figure 138. Gas and steam emissions rose from the crater at the summit of the pyroclastic cone at Galeras on 24 April 2013. Image taken from the caldera rim at the summit. Courtesy of SGC (Informe mensual de actividad de Los Volcanes Galeras, Cumbal, Doña Juana, Azufral, Las Ánimas, Chiles Y Cerro Negro, abril de 2013). |
Seismic activity decreased somewhat during May 2013, although tremor signals associated with ash and gas emissions were noted on at least eight occasions. The pulsating ash plumes were small, and deposited material mostly on the NW flank. The deformation network recorded stability at the Crater inclinometer for the first time in many months. SGC noted a seismic swarm during the evening of 22 May that included a tremor event that lasted for 11 minutes and possibly included ash emissions.
Emissions during June 2013 were mostly steam that rose to 1,300 m, but ash plumes were reported on seven days. The frequency of seismic activity remained steady during July, but the amount of energy released increased significantly. The Crater inclinometer showed deflation. Ash and gas plumes were noted on 6, 12, 13, 17 and 22 July rising as high as 1,500 m. Seismic frequency and energy both decreased during August and September 2013, and inclinometers showed little change in deformation. Plume heights, mostly gas and steam, remained below 500 m. Tremors associated with ash emissions were reported on five days of August and on 3, 11 and 14 September.
Seismicity increased in both amplitude and frequency during October and November 2013. The majority of the VT seismicity was located on the NE flank at 5-10 km depth. Steam plume heights remained below 600 m; emissions reported on 8 and 11 October included ash (figure 139). In addition to steam plumes observed throughout November, ash plumes were reported rising to 1,000 m on 17, 23, and 30 November. Seismicity decreased during December 2013 while deformation remained stable. Ash plumes were reported on 4, 13, 26, 27, and 31 December associated with tremor events (figure 140).
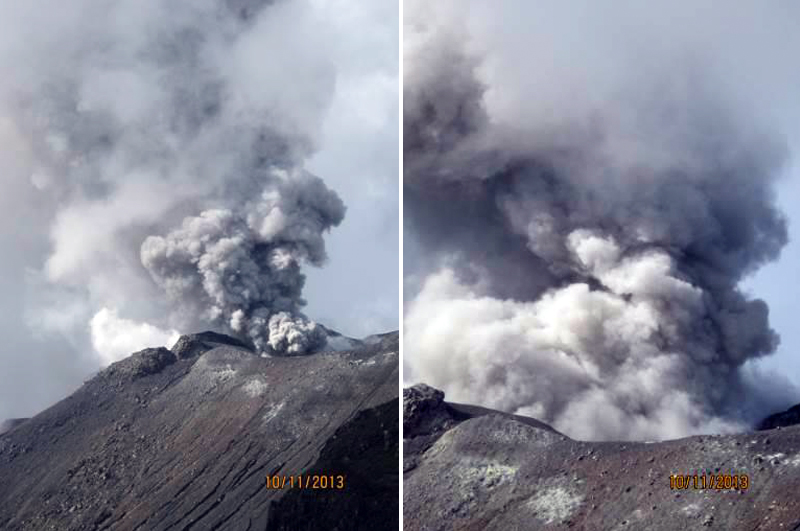 |
Figure 139. Ash emissions rose from the summit crater at Galeras on 11 October 2013. They were photographed by Mr. Mario Alberto Caicedo, Radio and TV Analyst, from the RTVC Galeras station, at the caldera rim near the summit. Courtesy of SGC (Informe mensual de actividad de Los Volcanes Galeras, Cumbal, Doña Juana, Azufral, Las Ánimas, Chiles Y Cerro Negro, octubre de 2013). |
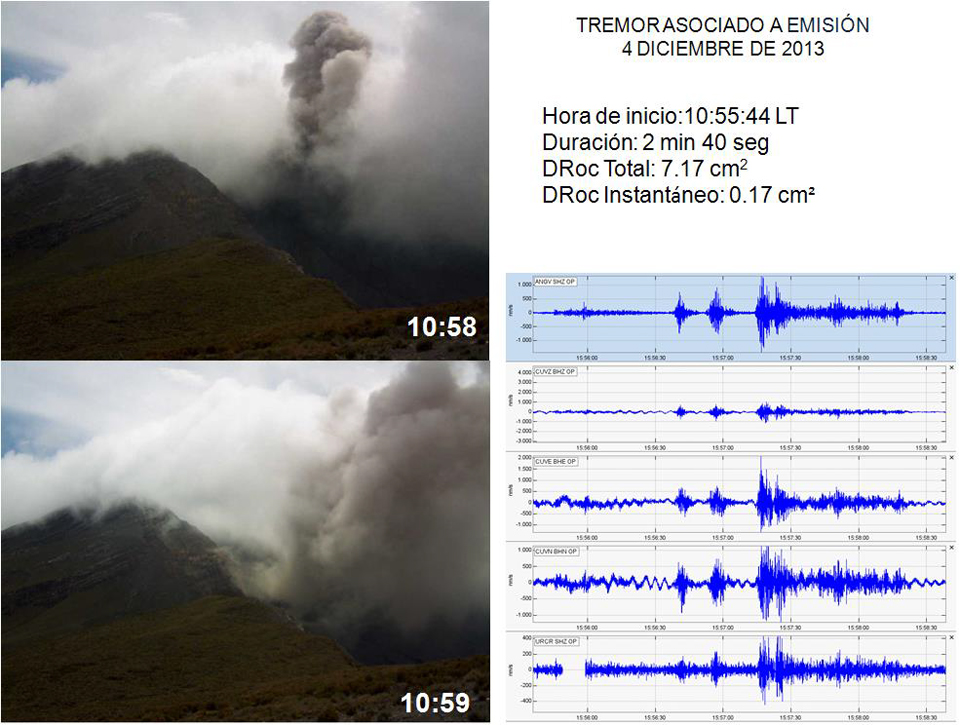 |
Figure 140. Seismograms recorded frequencies associated with tremor (TRE) events on 4 December 2013 while the Barranca webcam recorded ash emissions. Courtesy of SGC (Informe mensual de actividad de Los Volcanes Galeras, Cumbal, Doña Juana, Azufral, Las Ánimas, Chiles Y Cerro Negro, diciembre de 2013). |
Activity during 2014. Tremor events during 11-14, 21, 23, and 27-30 January 2014 were associated with ash and gas emissions (figure 141) that reached 850 m above the summit. During the early hours of 11, 13, and 23 January, incandescence was observed at the crater. The last confirmed ash emission of the year occurred on 30 January 2014.
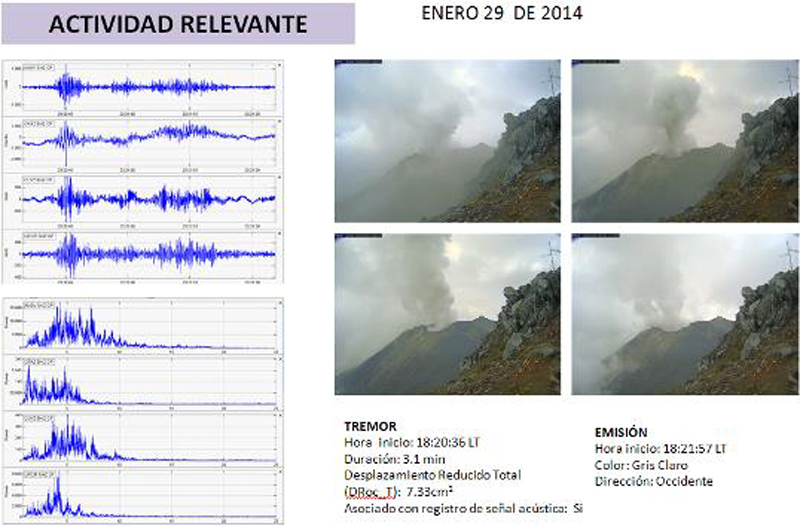 |
Figure 141. Emissions of steam and ash on 29 January 2014 were captured by the Bruma webcam (SW of the cone) while seismograms registered tremor events. Courtesy of SGC (Informe mensual de actividad de Los Volcanes Galeras, Cumbal, Doña Juana, Azufral, Las Ánimas, Chiles Y Cerro Negro, enero de 2014). |
A decrease in both frequency and energy levels of seismicity were reported during March 2014. SGC noted several tremor-type seismic events associated with gas emissions; steam plumes rose up to 1,000 m above the summit. Although they reference "gas and ash" emissions in a few photographs, only steam is visible in the photographs from March. Reports of activity by SGC for April and May 2014 refer to only steam plumes rising 1,000 m from the summit from the vents on the N and W sides of the crater rim. No further reports are available for Galeras for 2014.
Activity during 2015-2017. Throughout 2015, SGC reported only steam plumes rising from the two vents at the summit of the Galeras pyroclastic cone, known as the Chaldean fumarole fields (Las Chavas) on the W rim, and the El Paisita on the N rim (figure 142). Plume heights were as high as 700 m in January, but dropped below 200 m by May, where they remained for the rest of the year. Inflation to the W began again in September 2014 and continued through May 2015.
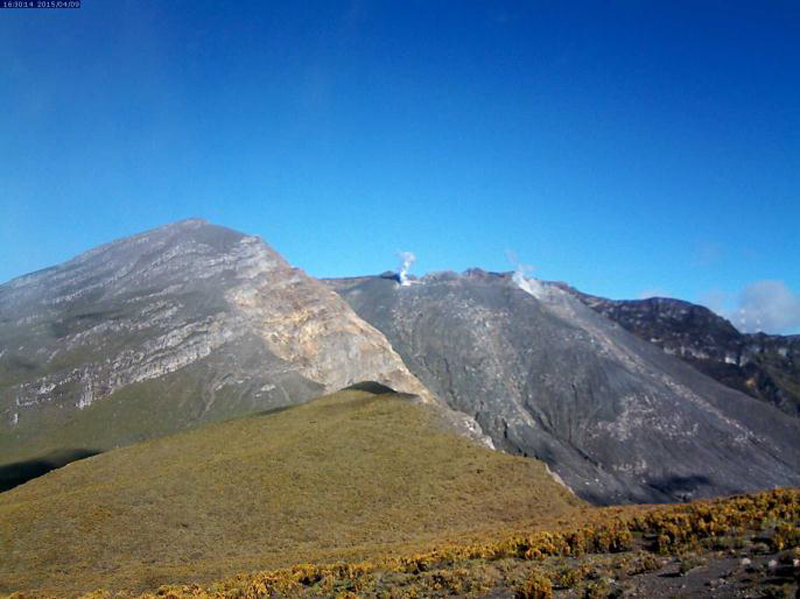 |
Figure 142. Steam plumes rose a few hundred meters above the summit of the pyroclastic cone at Galeras on 9 April 2015. This type of activity was typical for all of 2015. Photo from the Barranco webcam NW of the summit. Courtesy of SGC (Informe mensual de actividad de Los Volcanes Galeras, Cumbal, Doña Juana, Azufral, Las Ánimas, Chiles Y Cerro Negro, abril de 2015). |
Minor variations in seismic frequency and energy levels fluctuated throughout 2016 and 2017, but there were no reported particulate emissions. Steam emissions from the two primary vents at the summit crater (Las Chavas and El Paisita) rarely rose more than 200 m above the summit, often drifting NW.
An inspection of the summit crater by SGC on 25 August 2016 revealed a deep vent with several points of gas emissions (figure 143), including areas on the N wall (El Paisita) and the E wall (Las Alterada). The W wall (Las Chavas) had a cave-like entrance of 50 m diameter with fumarolic activity on the back wall and the ceiling that condensed into a sulfur-rich water on the floor of the opening. The El Pinta vent had no observed emissions. A rare 200-m-high steam plume rose from the crater in October 2016, but otherwise activity remained very low at Galeras throughout 2017 (figure 144).
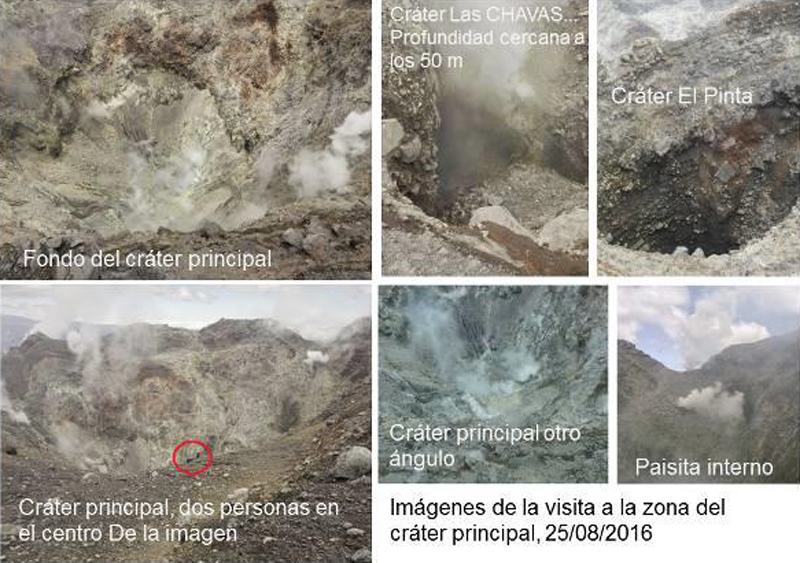 |
Figure 143. An inspection of the summit crater at Galeras by SGC on 25 August 2016 revealed a deep vent with several points of gas emissions including areas on the N wall (El Paisita) and the E wall (Las Alterada). The W wall (Las Chavas) had a cave-like entrance of 50 m diameter with fumarolic activity on the back wall and the ceiling that condensed into a sulfur-rich fluid on the floor of the opening. The El Pinta vent had no emissions. Courtesy of SGC (Informe mensual de actividad de Los Volcanes Galeras, Cumbal, Doña Juana, Azufral, Las Ánimas, Chiles Y Cerro Negro, agosto de 2016). |
 |
Figure 144. Low-level steam emissions seen from the Bruma webcam SW of the summit of Galeras on 3 August 2017 were typical activity for the entire year. Courtesy of SGC (Informe mensual de actividad de Los Volcanes Galeras, Cumbal, Doña Juana, Azufral, Las Ánimas, Chiles Y Cerro Negro, agosto de 2017). |
Information Contacts: Servicio Geologico Colombiano (SGC), Diagonal 53 No. 34-53 - Bogotá D.C., Colombia (URL: https://www2.sgc.gov.co/volcanes/index.html).
2013: April
| May
2012: January
| May
| June
| July
| August
| September
| October
2011: January
| February
| March
| November
| December
2010: February
| August
2009: January
| February
| March
| April
| May
| June
| July
| September
| October
| November
| December
2008: January
| September
| October
| November
| December
2007: March
| October
| November
| December
2006: January
| February
| March
| April
| May
| June
| July
| December
2005: January
| February
| May
| June
| July
| August
| November
| December
2004: July
| August
| September
| October
| November
INGEOMINAS reported that during 15-21 May seismicity at Galeras was at a low level; during 19-20 May earthquakes with magnitudes 2.6 or less were concentrated in an area 3 km SW at depths near 4 km. Gas plumes rose 500 m above the crater and contained small amounts of ash during 15-16 and 20-21 May. Sulfur dioxide emissions were low. The Alert Level remained at III (Yellow; "changes in the behavior of volcanic activity").
Source: Servicio Geológico Colombiano (SGC)
INGEOMINAS reported that during 10-16 April earthquakes at Galeras were located in various areas as far as 13 km from the crater, at depths no greater than 14 km and with maximum magnitudes of 2. Moderate levels of sulfur dioxide were detected; plumes drifted NW. Cameras recorded ash emissions all week, especially on 9, 11, 12, and 14 April, when pulsating activity produced plumes that drifted W. Plumes rose no more than 1 km above the crater. The Alert Level remained at III (Yellow; "changes in the behavior of volcanic activity").
Source: Servicio Geológico Colombiano (SGC)
INGEOMINAS reported that during 30 October-6 November seismicity at Galeras fluctuated but was slightly lower compared to the previous week. Sulfur dioxide gas emissions were low. Cameras around Galeras recorded gas-and-ash plumes rising from the crater on 30 October and 1 November. The Alert Level remained at III (Yellow; "changes in the behavior of volcanic activity").
Source: Servicio Geológico Colombiano (SGC)
INGEOMINAS reported that during 24-30 October cameras around Galeras recorded daily emissions, including pulsating ash emissions. Multiple gas-and-ash plumes rose 500 m above the crater on 25 and 27 October. Seismicity fluctuated but was slightly lower compared to the previous week. Sulfur dioxide gas emissions were low to moderate. The Alert Level remained at III (Yellow; "changes in the behavior of volcanic activity").
Source: Servicio Geológico Colombiano (SGC)
INGEOMINAS reported that during 17-23 October cameras around Galeras recorded daily emissions. On 19 and 21 October the plumes contained ash and rose 1.8 km above the crater. On 19 October observatory staff reported fine ashfall on the NE flank and a sulfur odor was reported in Consacá Sandoná (W flank). Staff at the Galeras National Park Wildlife Sanctuary reported sulfur odors on the E side of the volcano. The Alert Level remained at III (Yellow; "changes in the behavior of volcanic activity").
Source: Servicio Geológico Colombiano (SGC)
INGEOMINAS reported that during 9-16 October cameras around Galeras recorded daily emissions; on 9 and 12 October ash was present in the emissions in small quantities. On 12 October a gas-and-ash plume rose 1 km above the crater, and staff at the Galeras National Park Wildlife Sanctuary reported sulfur gas odor in a cabin located on the E side of the volcano. Earthquakes were at most M 1.7 and occurred within 10 km of the crater at depths of less than 6 km. The Alert Level remained at III (Yellow; "changes in the behavior of volcanic activity").
Source: Servicio Geológico Colombiano (SGC)
INGEOMINAS reported that during 2-9 October cameras around Galeras recorded daily emissions that drifted NW and often contained ash. Earthquakes were at most M 2.2 and occurred within 15 km of the crater at depths of less than 10 km. An M 2.2 earthquake on 8 October was located at a depth of 8 km, 7 km NE of the crater. The Alert Level remained at III (Yellow; "changes in the behavior of volcanic activity").
Source: Servicio Geológico Colombiano (SGC)
INGEOMINAS reported that during 25 September-2 October cameras around Galeras recorded emissions that were mostly water vapor drifting NW. However, on 27 and 28 September the emissions contained ash. An earthquake swarm detected on 28 September was characterized by M 1.4 events that occurred within 13 km of the crater at depths less than 8 km. The Alert Level remained at III (Yellow; "changes in the behavior of volcanic activity").
Source: Servicio Geológico Colombiano (SGC)
INGEOMINAS reported that during 18-22 and 24-25 September cameras around Galeras recorded emissions that were mostly water vapor. On 18 and 24 September the emissions contained ash. An earthquake swarm detected on 25 September was characterized by events less than M 1 that occurred 2 km W of the crater at depths near 3 km. The Alert Level remained at III (Yellow; "changes in the behavior of volcanic activity").
Source: Servicio Geológico Colombiano (SGC)
INGEOMINAS reported that during 21-28 August seismicity at Galeras increased. Sulfur dioxide emissions fluctuated, but remained at low-to-moderate levels. Cameras around the volcano recorded emissions during 21-26 August; the emissions contained ash on 26 August. The Alert Level remained at III (Yellow; "changes in the behavior of volcanic activity").
Source: Servicio Geológico Colombiano (SGC)
INGEOMINAS reported that both earthquake occurrence and magnitude were low at Galeras during 14-21 August. Sulfur dioxide emissions fluctuated, but remained at moderate levels. An ash plume rose from the crater on 16 August. White plumes were observed during 16 and 18-21 August. The Alert Level remained at III (Yellow; "changes in the behavior of volcanic activity").
Source: Servicio Geológico Colombiano (SGC)
INGEOMINAS reported that during 8-14 August seismicity at Galeras continued to be elevated. Some of the earthquakes were located near the active cone, with magnitudes less than 1 and depths not exceeding 2 km. During 7-9 and 11 August gas-and-ash plumes rose 0.9-1.3 km above the crater and drifted W and S. Sulfur dioxide emissions fluctuated between moderate and high levels. The Alert Level remained at III (Yellow; "changes in the behavior of volcanic activity").
Source: Servicio Geológico Colombiano (SGC)
INGEOMINAS reported that during 31 July-6 August the magnitude and occurrence of earthquakes detected at Galeras had increased since the previous week. Gas plumes sometimes containing tephra rose from the crater. Observatory staff working near the crater reported a strong sulfur odor on 1 and 6 August. On 3 August a steam plume rose 1.1 km above the crater. On 4 August ash emissions were observed in the morning, and at 1519 a seven-minute-long episode of tremor was accompanied by a gas-and-ash plume that rose 1.4 km above the crater and drifted N. Ashfall was reported in Genoy, 6 km NE. An ash plume rose from the crater on 7 August. The Alert Level remained at III (Yellow; "changes in the behavior of volcanic activity").
Source: Servicio Geológico Colombiano (SGC)
INGEOMINAS reported that during 18-24 July earthquakes at Galeras were less than M 1.3 and located at depths not exceeding 3 km. Gas emissions, observed by a network of video cameras, contained ash almost daily. Sulfur dioxide levels fluctuated. On 18 July observatory staff working near the crater reported a strong sulfur odor and fine ash falling on the upper N flank. Ashfall was also reported to the N in the Quebrada Maragato area (municipality of Nariño). The Alert Level remained at III (Yellow; "changes in the behavior of volcanic activity").
Source: Servicio Geológico Colombiano (SGC)
INGEOMINAS reported that during 4-10 July seismicity at Galeras indicated continuing gas emissions; sulfur dioxide levels were moderate. The emissions, observed by a network of video cameras, contained some ash during 4-5 July. The Alert Level remained at III (Yellow; "changes in the behavior of volcanic activity").
Source: Servicio Geológico Colombiano (SGC)
INGEOMINAS reported that during 20-26 June the magnitude of earthquakes detected at Galeras had decreased since the previous week, but seismicity continued to indicate ash and gas emissions. During 19-22 and 24 June cameras recorded gas-and-ash emissions that drifted NW. The Alert Level remained at III (Yellow; "changes in the behavior of volcanic activity").
Source: Servicio Geológico Colombiano (SGC)
INGEOMINAS reported that during 5-19 June seismicity at Galeras had increased in both magnitude and frequency since the previous week-long period, and indicated continuing ash and gas emissions. On 5, 6, and 12-19 June cameras recorded gas-and-ash emissions; an ash plume rose 1.4 and 2.4 km above the crater on 14 and 17 June, respectively. Ashfall was reported in Sandona (13 km NW), Samaniego (32 km NW), Mapachico (8 km NW), and Genoy (5 km NE). Sulfur dioxide emissions were moderate to high. The Alert Level remained at III (Yellow; "changes in the behavior of volcanic activity").
Source: Servicio Geológico Colombiano (SGC)
On 5 June INGEOMINAS reported that seismicity at Galeras increased since the previous week and indicated continuing ash and gas emissions. Ash originated from an area N and W of the cone within the main crater and was emitted in a pulsating manner. Ash was deposited on the NW flanks. Ash emissions were especially frequent on 2 and 5 June, with plumes rising 1 km above the crater. The Alert Level remained at III (Yellow; "changes in the behavior of volcanic activity").
Source: Servicio Geológico Colombiano (SGC)
INGEOMINAS reported that on 17 May ash emissions originating from an area N and W of the cone within Galeras's main crater rose 200 m above the crater rim. During 26-27 May ash plumes rose 800 m above the crater; ashfall was reported in Sandona (13 km NW). Ash emissions occurred on 2 June, and on 5 June plumes rose 1 km and drifted W. The Alert Level remained at III (Yellow; "changes in the behavior of volcanic activity").
Sources: Washington Volcanic Ash Advisory Center (VAAC); Servicio Geológico Colombiano (SGC)
INGEOMINAS reported that low-level activity continued at Galeras during 4-10 January, with steam rising from the main crater and two craters to the N and SW (Paisita and Chavas, respectively). The Alert Level remained at III (Yellow; "changes in the behavior of volcanic activity").
Source: Servicio Geológico Colombiano (SGC)
INGEOMINAS reported that activity continued at Galeras during 28 December- 3 January, with steam rising from the main crater and two craters to the N and SW (Paisita and Chavas, respectively). A web camera showed gas emissions on 28, 30, and 31 December and on 1 January. The Alert Level remained at III (Yellow; "changes in the behavior of volcanic activity").
Source: Servicio Geológico Colombiano (SGC)
INGEOMINAS reported that activity continued at Galeras during 21-27 December, with steam rising from the main crater and two craters to the N and SW (Paisita and Chavas, respectively). The Alert Level remains at III (Yellow; "changes in the behavior of volcanic activity").
Source: Servicio Geológico Colombiano (SGC)
INGEOMINAS reported that activity continued at Galeras during 14-20 December, with steam rising from the main crater and two craters to the N and SW (Paisita and Chavas, respectively). The Alert Level remains at III (Yellow; "changes in the behavior of volcanic activity").
Source: Servicio Geológico Colombiano (SGC)
INGEOMINAS reported that activity continued at Galeras during 7-13 December, with steam rising from the main crater and two craters to the N and SW (Paisita and Chavas, respectively). On 9 and 11 December earthquakes of M 2.3 and 2.5, felt by local residents, occurred near the crater at a depth of 1.5 km. The Alert Level remains at III (Yellow; "changes in the behavior of volcanic activity"). olcanic activity").
Source: Servicio Geológico Colombiano (SGC)
INGEOMINAS reported that observations of Galeras during an overflight on 29 November revealed thermal analomies in the main crater. During an overflight on 6 December scientists observed that gas emissions rose from the main crater and two craters to the N and SW (Paisita and Chavas, respectively) and had increased in comparison to the previous week. Thermal anomalies were also detected in the main crater. INGEOMINAS raised the Alert Level to III (Yellow; "changes in the behavior of volcanic activity") on 6 December.
Source: Servicio Geológico Colombiano (SGC)
INGEOMINAS reported that during 15-22 November steam from Galeras rose from the main crater, two craters to the N and SW (Paisita and Chavas, respectively), and a crack on the N flank of the active cone. Seismicity was at low levels, although some earthquakes were characterized as "tornillo-type." During 23-24 November the seismic network detected an emerging seismic pattern of "tornillo-type" earthquakes similar to patterns detected prior to past eruptions. Gas emissions also decreased. INGEOMINAS raised the Alert Level to II (Orange; "probable eruption in term of days or weeks") on 24 November.
Source: Servicio Geológico Colombiano (SGC)
INGEOMINAS reported that on 31 March and 1 April emissions from Galeras were characterized by gas-and-steam plumes with low ash content. On 1 April a M 2.3 earthquake occurred 3 km E of the crater at a depth of 6 km and was felt by nearby residents. During an overflight on 2 April scientists noted a sulfur gas odor and observed that gas emissions rose from multiple areas of the active cone. During 30 March-5 April, sulfur dioxide gas values were between 50 and 2,000 tons per day, the latter value was considered high for Galeras. The Alert Level remained at III (Yellow; "changes in the behavior of volcanic activity").
Source: Servicio Geológico Colombiano (SGC)
On 8 February, INGEOMINAS reported that "tornillo-type" earthquakes from Galeras had not been detected since 5 February. Seismic levels continued to fluctuate. On 6 February an overflight revealed that gas emissions had increased in comparison to the previous week, forming plumes that drifted NW. The Alert Level was lowered to III (Yellow; "changes in the behavior of volcanic activity").
Source: Servicio Geológico Colombiano (SGC)
INGEOMINAS reported that on 25 January an emerging seismic pattern from Galeras, characterized by "tornillo-type" earthquakes, was similar to patterns detected prior to past eruptions. Staff noted a strong sulfur gas odor and observed emissions from various areas of the crater that drifted N. Based on changes in seismicity and observed gas emissions, INGEOMINAS raised the Alert Level to II (Orange; "probable eruption in term of days or weeks"). Scientists again observed emissions from various areas of the crater during an overflight on 27 January, but with a slight increase in the number of vents. Gas plumes drifted NW. "Tornillo-type" earthquakes ceased on the morning of 30 January.
Source: Servicio Geológico Colombiano (SGC)
An eruption from Galeras that began at 0400 on 25 August prompted INGEOMINAS to raise the Alert Level to I (Red; "imminent eruption or in progress"). Meteorological cloud cover initially prevented visual observations of the summit. Seismicity associated with the eruption continued for a period of about 12 hours and gradually declined in the afternoon. The Alert Level was lowered to II (Orange; "probable eruption in term of days or weeks"). Scientists aboard an overflight later that day observed ash-and-gas emissions from multiple areas of the active cone, and thermal anomalies that were detected on the N side of the cone. Ash fell to the NW, as far away as 30 km. According to news articles, about 7,000 were requested by officials to evacuate, although few left their homes. During 26-31 August at least 12 earthquakes, M 2-4, were located within a 2-km radius from the crater, at depths not more than 3 km. Gas plumes drifted NW, then S.
Sources: Servicio Geológico Colombiano (SGC); CNN
INGEOMINAS reported that an earthquake swarm from Galeras which began on 20 August had been preceded by increased gas emissions a few days prior. During 21-22 August seismicity remained high. Five volcano-tectonic earthquakes were felt by local residents and caused windows to vibrate. They were located within a 300-900 m radius from the crater, at depths of less than 2 km. The largest event was M 4.3. On 23 August a M 4.6 earthquake was located E of Galeras at a depth of 2 km. The Alert Level was raised to II (Orange; "probable eruption in term of days or weeks"). An eruption began on 25 August, prompting INGEOMINAS to raise the Alert Level to I (Red; "imminent eruption or in progress"). Meteorological cloud cover initially prevented visual observations of the summit, although an eruption plume was seen amongst the clouds, and thermal anomalies were detected by an infrared camera. Ashfall was reported in areas 7-12 km NW. Observers in Pasto (~ 10 km E) reported that gas-and-ash plumes rose 300 m above the crater.
Source: Servicio Geológico Colombiano (SGC)
On 9 February, INGEOMINAS lowered the Alert Level for Galeras to III (Yellow; "changes in the behavior of volcanic activity"). During the previous few days, seismicity was low and sulfur dioxide emissions were low to moderate.
Source: Servicio Geológico Colombiano (SGC)
An explosive eruption from Galeras detected by the seismic network on 2 January prompted INGEOMINAS to raise the Alert Level to I (Red; "imminent eruption or in progress"). An ash plume rose to an altitude of 12 km (39,400 ft) a.s.l. and drifted W and NW. Ashfall was reported in areas downwind, as far away as 110 km W. Ejected incandescent blocks fell onto the flanks 3.2-3.5 km away from the summit and ignited fires. An overflight on 3 January revealed diffuse gas plumes from the main crater. Fires started the previous day continued to burn on the N flank. The Alert Level was lowered to II (Orange; "probable eruption in term of days or weeks").
Source: Servicio Geológico Colombiano (SGC)
INGEOMINAS reported that observations of Galeras during an overflight on 3 December revealed thermal anomalies in the main crater measuring 155 degrees Celsius. During 8-11 December, seismic activity decreased, although some seismic signals resembled patterns seen prior to previous eruptions. Sulfur dioxide emissions were low. Seismicity increased on 12 December; earthquakes M 2.2 and less were detected within 2 km of the summit and at depths up to 3 km below the summit during 12-15 December. The Alert Level was raised to II (Orange; "probable eruption in term of days or weeks").
Source: Servicio Geológico Colombiano (SGC)
On 27 November, INGEOMINAS lowered the Alert Level for Galeras to III (Yellow; "changes in the behavior of volcanic activity"). During the previous few days, seismicity was low and occasionally punctuated by signals indicative of minor gas and ash emissions. An overflight on 26 November revealed gas emissions from the interior walls of the main crater and thermal anomalies with temperatures of 200 degrees Celsius. During 27 November-1 December, seismicity remained low; signals indicated gas emissions.
Source: Servicio Geológico Colombiano (SGC)
An explosive eruption from Galeras detected by the seismic network on 20 November prompted INGEOMINAS to raise the Alert Level to I (Red; "imminent eruption or in progress"). Residents reported five explosions, sound waves, and incandescence from multiple areas in the crater. Plume modelling from the Washington VAAC suggested that the resulting ash plume may have risen as high as 14.3 km (46,900 ft) a.s.l. and drifted N. Ashfall was reported in areas 10 km E, N, and NNW. Seismicity increased after the eruption and then gradually decreased. On 21 November, INGEOMINAS lowered the Alert Level to II (Orange; "probable eruption in term of days or weeks"). According to news articles, 900-1,000 people out of about 9,000 ordered to evacuate went to shelters.
Sources: Agence France-Presse (AFP); Servicio Geológico Colombiano (SGC)
INGEOMINAS reported that an overflight of Galeras on 14 November revealed thermal anomalies in the main crater measuring 110 degrees Celsius and very low rates of gas discharge. The Alert Level remained at II (Orange; "probable eruption in term of days or weeks").
Source: Servicio Geológico Colombiano (SGC)
INGEOMINAS reported that during 7-10 November seismic activity from Galeras decreased, although some seismic signals resembled patterns seen prior to previous eruptions. Sulfur dioxide emissions were not detected. The Alert Level remained at II (Orange; "probable eruption in term of days or weeks").
Source: Servicio Geológico Colombiano (SGC)
On 30 October, INGEOMINAS reported that the Alert Level for Galeras was raised to II (Orange; "probable eruption in term of days or weeks"). Since 27 October, degassing decreased and seismicity increased, reflecting conditions seen prior to previous eruptions. On 3 November, INGEOMINAS stated that gas emissions had been low during the previous days, and seismicity had decreased that day.
Source: Servicio Geológico Colombiano (SGC)
An explosive eruption from Galeras on 30 September prompted INGEOMINAS to raise the Alert Level to I (Red; "imminent eruption or in progress"). National Park personnel reported two explosions and incandescent material ejected from the area of the active cone. An ash plume rose to an approximate altitude of 12.3 km (40,400 ft) a.s.l. and drifted E, then N. The sulfur dioxide emission rate was between 1,100 and 9,300 tons per day. Ash was deposited in Sandoná (15 km NW), and Ancuya, Linares, and Sotomayor (40 km NW). Seismicity decreased after the eruption. On 1 October, seismicity was low and the sulfur dioxide emission rate was 300 tons per day. The Alert Level was lowered to II (Orange; "probable eruption in term of days or weeks"), and then to III (Yellow; "changes in the behavior of volcanic activity") on 6 October.
Source: Servicio Geológico Colombiano (SGC)
On 4 August, INGEOMINAS reported that activity from Galeras had remained at a low level since the previous report on 28 July; the Alert Level was lowered to III (Yellow; "changes in the behavior of volcanic activity"). During the previous few days, active fumaroles were seen on the W flank of the active cone.
Source: Servicio Geológico Colombiano (SGC)
INGEOMINAS reported that during 22-23 June gas plumes rising from Galeras contained some ash. An overflight on 23 June revealed that temperatures in the main crater measured between 60 and 120 degrees Celsius, except for a small zone where the temperature measured 220 degrees Celsius. Gas emissions originated from the periphery of the main crater. On 26 June, seismicity similar to that seen prior to previous eruptions, along with low rates of gas emissions, prompted INGEOMINAS to raise the Alert Level to II (Orange; "probable eruption in term of days or weeks").
Source: Servicio Geológico Colombiano (SGC)
Increased sulfur-dioxide degassing and seismicity related to fluid movement, resulting in the overall lowering of pressure in the system, prompted INGEOMINAS to further lower the alert level to Yellow (Level III) on 19 June. By 23 June some rock-fracture seismicity had been detected, though events related to fluid movement had declined significantly. That same day clear weather allowed observation of a small gas column with minor ash content, while scientists on a monitoring flight saw gas emissions near the crater rim and recorded a thermal anomaly within the main crater.
Source: Servicio Geológico Colombiano (SGC)
On 10 June, INGEOMINAS reported that the Alert Level for Galeras was lowered to II (Orange; "probable eruption in term of days or weeks"). Pulsating steam plumes rose from the crater and drifted NW. Seismicity remained low.
Source: Servicio Geológico Colombiano (SGC)
INGEOMINAS reported that an eruption of Galeras on 7 June was preceded by a M 4 earthquake located about 3 km SSE of the crater at a depth of 2 km, and felt by nearby residents. The eruption produced an ash plume that rose to an altitude of 6.8 km (22,300 ft) a.s.l. and drifted NW. Vibrations from an accompanying acoustic wave were detected by residents. Ashfall was reported in areas downwind. The Alert Level was raised to I (Red; "imminent eruption or in progress"). On 8 June, two explosions about 5 minutes apart were heard by people up to 45 km away. The event was preceded by an M 3.9 earthquake located 1 km E at a depth near 2 km. Ashfall was reported in areas to the NW, up to 180 km away. Based on analysis of satellite imagery, the Washington VAAC reported that the ash plume rose to an altitude of 10 km (33,000 ft) a.s.l. and drifted NW. They also reported that a second and larger eruption produced an ash plume that rose to an altitude of 13.7 km (45,000 ft) a.s.l. and drifted SE. On 9 June, INGEOMINAS reported that seismicity and sulfur dioxide output were low, and that clear conditions revealed no emissions.
Sources: Washington Volcanic Ash Advisory Center (VAAC); Servicio Geológico Colombiano (SGC)
On 19 May, INGEOMINAS reported that gas plumes from Galeras occasionally contained some ash during the previous four days. An overflight on 17 May revealed gas emissions emanating from multiple points inside and outside of the main crater. Some thermal anomalies surpassed 180 degrees Celsius. During 17-18 May, two M 2.9 earthquakes occurred 6 km SSE at depths of 2-3 km, and on 18 May one M 2.3 earthquake occurred at a depth of 3-5 km, 5 km SSW. The Alert Level was lowered to III (Yellow; "changes in the behavior of volcanic activity").
Source: Servicio Geológico Colombiano (SGC)
On 6 May, INGEOMINAS reported that gas-and-ash plumes from Galeras rose to an altitude of 5.8 km (19,000 ft) a.s.l. and drifted NE. An overflight revealed incandescence from a vent, 90-100 m in diameter, in the main crater that corresponded to a 500 degree Celsius temperature anomaly. Blocks, 9-13 m in diameter, scattered on the S and SE flanks were part of the 2008 lava dome that had been ejected during the 24 April 2009 eruption. White plumes originated from multiple points inside and outside of the crater. Volcanic tremor seldom occurred during the previous week. The Alert Level was lowered to III (Yellow; "changes in the behavior of volcanic activity").
On 9 May, a M 2.2 volcano-tectonic earthquake occurred 6 km to the NE of the main crater at a depth of 10 km. On 11 May, seismicity increased, and hybrid earthquakes and tremor were detected. The recent seismicity, along with incandescence in the crater, and low sulfur dioxide values suggested to INGEOMINAS that the volcano may become overpressurized. The Alert Level was raised to II (Orange; "probable eruption in term of days or weeks"). Steam plumes rose 250 m and drifted NW on 12 May.
Source: Servicio Geológico Colombiano (SGC)
INGEOMINAS reported that on 29 April an eruption from Galeras was detected by the seismic network. Observers to the N and NW reported that an ash plume drifted NW; ash fell in areas up to 35 km downwind. During 4-5 May, ash plumes drifted NE and ashfall was reported in multiple areas of Pasto (about 10 km E). The Alert Level remained at II (Orange; "probable eruption in term of days or weeks").
Source: Servicio Geológico Colombiano (SGC)
INGEOMINAS reported that on 24 April seismicity from Galeras was similar to that seen prior to previous eruptions. Video camera views of the crater showed decreased gas emissions. The Alert Level was raised to II (Orange; "probable eruption in term of days or weeks"). Later that day, an explosive eruption was detected, prompting INGEOMINAS to raise the Alert Level to I (Red; "imminent eruption or in progress"). Incandescent blocks caused fires on the N flank. An accompanying shock wave was reported by residents up to 25 km away. A second eruption, of greater duration but less energy than the first, was detected about a half an hour later. Incandescence from both eruptions was seen from the city of Pasto (10 km E). An ash plume rose to an altitude of 10.3 km (33,800 ft) a.s.l. Ashfall was reported in areas up to 20 km W, WNW, and NW. According to a news article, populations living near the volcano were ordered to evacuate; about 200 people responded. On 25 April, ash-and-gas plumes rose 1 km above the crater. Thermal anomalies in the crater near the W flank measured 100 degrees Celsius. Ejected rocks had landed 2-3 km from the crater. The Alert Level was lowered to II.
Sources: Servicio Geológico Colombiano (SGC); Colombia Reports
INGEOMINAS reported that pulsating gas plumes from Galeras, sometimes containing ash, were seen when weather allowed during 3-7 April and rose to altitudes less than 6 km (19,700 ft) a.s.l. Overflights on 5, 6, and 7 April revealed that the emissions came from different areas in the main crater. Zones of high temperatures (180 degrees Celsius) were noted; an incandescent area measured 500 degrees Celsius on 7 April. The Alert Level remained at III (Yellow; "changes in the behavior of volcanic activity").
Source: Servicio Geológico Colombiano (SGC)
On 24 March, INGEOMINAS lowered the Alert Level for Galeras to III (Yellow; "changes in the behavior of volcanic activity"). During the previous week daily sulfur dioxide levels were high. Earthquake levels were low in both intensity and occurrence. During 21-23 March, white-colored gas plumes rose to an altitude of 5.4 km (17,700 ft) a.s.l. and drifted in multiple directions.
Source: Servicio Geológico Colombiano (SGC)
INGEOMINAS reported an explosive eruption from Galeras that began at 1555 on 13 March; the Alert Level was raised from II (Orange; "probable eruption in term of days or weeks") to I (Red; "imminent eruption or in progress"), on a scale of 4-1. Inclement weather prevented direct observations of the volcano. The Washington Volcanic Ash Advisory Center (VAAC) indicated that a plume rose to an altitude of 12.3 km (40,400 ft) a.s.l. and drifted NW. The eruption produced sounds heard in areas 10 km E and W. Ashfall was reported in multiple areas E and NW; a sulfur odor was also reported in some areas. On 14 March, gas plumes with some ash content rose to an altitude of 6.3 km (20,700 ft) a.s.l. The Alert Level was lowered to back to II.
According to news articles, authorities ordered the evacuation of about 8,000 people living in high-risk areas, but few went to evacuation shelters.
Sources: Servicio Geológico Colombiano (SGC); El Tiempo
INGEOMINAS reported that on multiple occasions during 6-10 March white gas plumes from Galeras were occasionally tinged gray or brown and rose to altitudes less than 6.3 km (21,000 ft) a.s.l. An estimated 2 million cubic meters of material, or about 40 percent of the volume of the lava dome, was deposited during the eruptions that took place on 14 and 20 February. The Alert Level remained at III (Yellow; "changes in the behavior of volcanic activity").
Source: Servicio Geológico Colombiano (SGC)
INGEOMINAS reported that on several occasions during 25 February-2 March white gas plumes from Galeras with variable ash content rose to a peak altitude of 5.4 km (17,700 ft) a.s.l. and drifted NNW. On 3 March, the Alert Level was lowered from II (Orange; "probable eruption in term of days or weeks") to III (Yellow; "changes in the behavior of volcanic activity").
Source: Servicio Geológico Colombiano (SGC)
INGEOMINAS reported an explosive eruption from Galeras that began at 0705 on 20 February; the Alert Level was raised from II (Orange; "probable eruption in term of days or weeks") to I (Red; "imminent eruption or in progress"), on a scale of 4-1. The eruption was accompanied by shock waves detected in several local communities and produced sounds heard in Popayán (about 160 km NNE). Observers from areas on the E flank reported two explosions, incandescent blocks ejected above the summit, ash emissions, and sulfur gas odor. An ash plume rose to an altitude of 12.5 km (41,000 ft) a.s.l. and drifted E, W, and N. Ashfall was reported in areas to the W. Gas plumes with a low ash content continued, especially in the afternoon, and rose 700 m above the summit. On 21 February, the Alert Level was lowered to back to II. During 22-24 February, occasional steam plumes rose 500 m above the summit and drifted NNW.
Source: Servicio Geológico Colombiano (SGC)
INGEOMINAS reported an explosive eruption from Galeras that began at 1910 on 14 February; the Alert Level was raised from III (Yellow; "changes in the behavior of volcanic activity") to I (Red; "imminent eruption or in progress"), on a scale of 4-1. An accompanying shock wave was detected in multiple areas, including in parts of Pasto (about 10 km E). The altitude of the resultant ash plume was not known nor observed on satellite images due to cloud cover. From about 1930 until 2030 ashfall, rain, and an odor of sulfur gas were reported on the slopes of the volcano as well as in Pasto. Ash deposits were mainly in areas to the E and as far away as 25 km. Seismicity returned at 1950 to similar levels recorded prior to the eruption and remained low. On 16 February, the Alert Level was lowered to II (Orange; "probable eruption in term of days or weeks"). During 16-17 February, small steam plumes rose to altitudes of 4.6-6.7 km (15,100-22,000 ft) a.s.l. and drifted SE, E, and NE.
According to news articles, authorities ordered the evacuation of about 8,000 people living on the slopes, but few went to evacuation shelters.
Sources: Caracol Radio; Agence France-Presse (AFP); Servicio Geológico Colombiano (SGC)
INGEOMINAS reported that during 21, 23-24, and 26-27 January some grayish plumes from Galeras rose to altitudes of 5-6 km (16,400-19,700 ft) a.s.l. and drifted S and SW.
Source: Servicio Geológico Colombiano (SGC)
INGEOMINAS reported that during 14-15 and 17-19 January some grayish plumes from Galeras rose to altitudes below 5.7 km (18,700 ft) a.s.l. and drifted S and SW.
Source: Servicio Geológico Colombiano (SGC)
INGEOMINAS reported that thermal images of the lava dome in Galeras's crater were taken during an overflight on 11 December. The images revealed temperatures as hot as 530 degrees Celsius on the N side of the dome and temperatures near 80 degrees Celsius on the W side. Temperatures had declined compared to thermal images taken in October 2008. On 16 December, INGEOMINAS reported that during the previous few days, gas plumes rose to altitudes of 5.9-6.7 km (19,400-22,000 ft) a.s.l. and drifted NW.
Source: Servicio Geológico Colombiano (SGC)
INGEOMINAS reported that on 30 November ash emissions from Galeras were associated with seismic tremor that lasted about 30 minutes. Resultant ash plumes drifted 6-12.5 km S and SSW.
Source: Servicio Geológico Colombiano (SGC)
On 11 November, INGEOMINAS reported that during the previous week pulsating white plumes, occasionally tinged gray, rose from Galeras to altitudes of 4.5-5.7 km (14,800-18,700 ft) a.s.l. and drifted W.
Source: Servicio Geológico Colombiano (SGC)
On 4 November, INGEOMINAS reported that during the previous week pulsating white plumes, occasionally tinged gray or blue, rose from Galeras to altitudes of 4.5-6.8 km (14,800-22,300 ft) a.s.l. and drifted W. During an overflight on 30 October, incandescence was observed on some parts of the lava dome.
Source: Servicio Geológico Colombiano (SGC)
On 28 October, INGEOMINAS reported that during the previous week pulsating white plumes occasionally tinged gray rose from Galeras to altitudes of 4.7-5.5 km (15,400-18,000 ft) a.s.l. and drifted NW.
Source: Servicio Geológico Colombiano (SGC)
On 21 October, INGEOMINAS reported that during the previous week pulsating white plumes occasionally tinged gray rose from Galeras to altitudes of 4.6-7.4 km (15,100-24,300 ft) a.s.l. and drifted S. On 20 October, a M 2.3 earthquake located 600 m SSW of the main crater occurred at a depth of less than 1 km.
Source: Servicio Geológico Colombiano (SGC)
INGEOMINAS reported that incandescence was observed in Galeras's crater during an overflight on 19 September. Thermal images revealed a significant anomaly from the cone in the main crater that measured 550 degrees Celsius; other anomalies on the sides of the cone measured 270 degrees Celsius. Sulfur dioxide values were near 8,200 tonnes. Further measurements during 19-23 September revealed temperatures between 500 and 600 degrees Celsius and sulfur dioxide values between 3,000 and 5,200 tonnes.
Source: Servicio Geológico Colombiano (SGC)
INGEOMINAS reported that a M 2 earthquake located S of Galeras occurred on 9 September at a depth of less than 1 km. The sulfur dioxide emission measurement was 14,500 tonnes the next day. During 11-16 September, the sulfur dioxide emission rate fluctuated between 3,200 and 6,800 tons. Gas plumes drifted W and NW.
Source: Servicio Geológico Colombiano (SGC)
INGEOMINAS reported that white plumes from Galeras's main crater and gas emissions from several points along the margins of the crater were observed during aerial observations on 23 January. Plumes drifted W. Several impact craters were spotted; the largest one was about 15 m in diameter and 5 m deep. Thermal images of the main crater revealed a maximum temperature of 150 degrees Celsius.
Source: Servicio Geológico Colombiano (SGC)
INGEOMINAS issued a report at 1000 on 17 January, noting that the seismic pattern from Galeras observed during the previous 24 hours was similar to patterns noted before past eruptions. Later that day, at 2006, an explosive eruption was registered by the seismic network and prompted INGEOMINAS to raise the Alert Level from 3 ("changes in the behavior of volcanic activity have been noted") to 1 ("imminent eruption or in course"), on a scale of 4-1.
Based on observations of satellite imagery and information from INGEOMINAS, the Washington VAAC reported that an ash plume rose to an altitude of 11 km (36,000 ft) a.s.l. at 2216 and drifted W on 17 January.
On 19 January, INGEOMINAS lowered the Alert Level to 2 ("likely eruption in days or weeks") because seismic events decreased in occurrence and energy. On 21 January, INGEOMINAS further lowered the Alert Level to 3 and reported that the initial ash plume from the eruption drifted SW, then W. Fine Ashfall was collected in Túquerres (about 32 km to the SW) and very fine ash was observed in neighborhoods of Ricaurte (about 71 km to the W). About 2 km away, military personnel reported that blocks 1.5 m in diameter were noted on a highway.
According to a news article, small settlements to the N were ordered to evacuate; about 100 people moved to shelters.
Sources: Associated Press; Washington Volcanic Ash Advisory Center (VAAC); Servicio Geológico Colombiano (SGC)
INGEOMINAS reported that steam-and-gas plumes from Galeras rose to an altitude of 6.3 km (20,700 ft) a.s.l. on 12 January. The emissions occasionally contained ash and were associated with episodes of spasmodic volcanic tremor.
Source: Servicio Geológico Colombiano (SGC)
INGEOMINAS reported that an ash-and-gas plume from Galeras rose to an altitude of 4.9 km (16,100 ft) a.s.l. and drifted NW on 31 December. The emission was associated with an episode of spasmodic tremor. Another plume rose to an altitude of 4.5 km (14,800 ft) a.s.l. and drifted S.
Source: Servicio Geológico Colombiano (SGC)
Based on visual observations during clear weather, INGEOMINAS reported that steam-and-gas plumes from Galeras rose to a maximum altitude of 5.3 km (17,400 ft) a.s.l. during 21-23 November and 3 December. The plumes occasionally contained small volumes of ash and were associated with seismic tremor. Gas and ash plumes that rose to an altitude of 4.4 km (14,400 ft) a.s.l. and drifted NW were observed during an overflight on 27 November. Thermal images indicated an increase in temperatures since a 2 October overflight at the point sources of emissions. The Alert Level remained at 3 (changes in the behavior of volcanic activity have been noted) on a scale of 4-1.
Source: Servicio Geológico Colombiano (SGC)
Based on visual observations during clear weather, INGEOMINAS reported that steam-and-ash plumes from Galeras rose to a maximum altitude of 5.7 km (18,700 ft) a.s.l. during 29 October-4 November. The Alert Level remained at 3 (changes in the behavior of volcanic activity have been noted) on a scale of 4-1.
Source: Servicio Geológico Colombiano (SGC)
INGEOMINAS reported that during 4-5 October, steam plumes from Galeras rose to altitudes of 5.8-6.3 km (19,000-20,700 ft) a.s.l. Occasional pulses of ash accompanied the steam emissions. Plumes drifted N and NW. The Alert Level remained at 3 (changes in the behavior of volcanic activity have been noted) on a scale of 4-1.
Source: Servicio Geológico Colombiano (SGC)
On 20 March, INGEOMINAS reported that the Alert Level for Galeras was decreased from 2 (probable eruption in days to weeks) to 3 (changes in the behavior of volcanic activity have been noted) on a scale of 4-1 due to decreased seismicity, low gas emissions, and no indication of changes below the surface of the lava dome.
Source: Servicio Geológico Colombiano (SGC)
On 22 November INGEOMINAS reported that the Alert Level for Galeras was increased from 3 (changes in the behavior of volcanic activity have been noted) to 2 (probable eruption in days to weeks) on a scale of 4-1, due to seismic patterns previously indicative of eruptive episodes. Emissions of gas and steam were seen coming from the periphery of the main crater during aerial observations on 4, 5, 10, and 11 December.
Source: Servicio Geológico Colombiano (SGC)
On 17 July, INGEOMINAS (Instituto Colombiano de Geología y Minería) reported that after the 12 July eruption of Galeras, seismic activity decreased considerably. Observations of the dome and secondary craters in the W sector post-12 July, showed small physical changes. Gas plumes with little steam content were observed without associated seismic activity. Galeras remained at Alert Level 3 (changes in the behavior of volcanic activity have been noted).
Source: Servicio Geológico Colombiano (SGC)
According to a news article, on 12 July the Colombian government ordered the evacuation of ~10,000 people living near Galeras due to an increase in volcanic activity. INGEOMINAS reported an increase in seismic activity and at least two explosive eruptions. Ash accumulated about 10 km N and NE in the towns of La Florida and Nariño and 5 km NE in the town of Genoy. The Alert Level was increased from 2 (probable eruption in days to weeks) to 1 (eruption imminent or occurring). On 13 July, due to a decrease in activity, the Alert Level was lowered from 1 to 3 (changes in the behavior of volcanic activity have been noted). Approximately 2,000 people had been taken to shelters.
Sources: BBC News; Associated Press; Servicio Geológico Colombiano (SGC); Reuters
INGEOMINAS reported that during 12-19 June, the number of pulsating ash emissions at Galeras decreased from the 5-12 June reporting period. Ash columns reached heights of 1.4 km above the summit (18,600 ft a.s.l.) on 12 June and 0.6 km above the summit (16,000 ft a.s.l.) on 15 June. Galeras remained at Alert Level 2 (likely eruption in days or weeks).
Source: Servicio Geológico Colombiano (SGC)
INGEOMINAS reported that during 15-22 May, a partially solidified lava dome remained in the main crater of Galeras. Seismicity and the sulfur-dioxide flux continued at very low levels. Galeras remained at Alert Level 2 (likely eruption in days or weeks).
Source: Servicio Geológico Colombiano (SGC)
INGEOMINAS reported that during 9-15 May, a partially solidified lava dome remained in Galeras' main crater. Seismicity and the sulfur-dioxide flux continued at low levels. Gas and sporadic ash emissions rose to low levels. Galeras remained at Alert Level 2 (likely eruption in days or weeks).
Source: Servicio Geológico Colombiano (SGC)
INGEOMINAS reported that Galeras remained at a critical state during 1-8 May, with a partially solidified lava dome in the main crater and low levels of seismicity. The sulfur-dioxide flux continued at very low levels. Galeras remained at Alert Level 2 (likely eruption in days or weeks).
Source: Servicio Geológico Colombiano (SGC)
INGEOMINAS reported that Galeras remained at a critical state during 21 April to 1 May, with a partially solidified lava dome in the main crater and low levels of seismicity. The sulfur-dioxide flux continued at low levels. Galeras remained at Alert Level 2 (likely eruption in days or weeks).
Source: Servicio Geológico Colombiano (SGC)
INGEOMINAS reported that Galeras remained at a critical state during 18-24 April, with a partially solidified lava dome in the main crater and low levels of seismicity. Galeras remained at Alert Level 2 (likely eruption in days or weeks).
Source: Servicio Geológico Colombiano (SGC)
INGEOMINAS reported that Galeras remained at a critical state during 10-17 April, with a partially solidified lava dome in the main crater. Seismicity continued to decrease, with an average of 70 small earthquakes occurring at the beginning of the report week, and an average of 45 occurring at the end of the week. In addition, there were small gas emissions from the volcano. Galeras remained at Alert Level 2 (likely eruption in days or weeks).
Source: Servicio Geológico Colombiano (SGC)
INGEOMINAS reported that Galeras remained at a critical state during 5-10 April, with a partially solidified lava dome in the main crater. Decreases were observed in various measured parameters at the volcano, including seismicity, deformation, gas emissions, and temperatures. According to INGEOMINAS, most of the explosive eruptions at Galeras in the past 17 years occurred when parameters were at similarly low levels. In addition, the current lava dome has a significantly greater volume than the dome that was destroyed during an eruption in 1992. Also, the volume of magma in the interior of the volcanic system is greater than during 1989-1993. Galeras remained at Alert Level 2 (likely eruption in days or weeks).
Source: Servicio Geológico Colombiano (SGC)
An increase in the energy of earthquakes at Galeras, which began on 28 March, ended on the 29th. The number of earthquakes beneath the volcano decreased during 28 March to 3 April (an average of 66 earthquakes was recorded daily), in comparison to the previous week (an average of 89 earthquakes was recorded daily). During the report period, steam columns rose up to ~500 m above the volcano (or 15,700 ft a.s.l.) and the outer layer of the lava dome at the volcano's summit cooled in comparison to previous weeks. Galeras remained at Alert Level 2 ("likely eruption in days or weeks").
Source: Servicio Geológico Colombiano (SGC)
Due to an increase in tremor at Galeras beginning on the morning of 28 March, INGEOMINAS raised the Alert Level from 3 ("changes in the behavior of volcanic activity have been noted") to 2 ("likely eruption in days or weeks"). On the 28th, energetic signals and tremor began that had been absent during previous weeks. In addition, seismic instruments detected very shallow low-energy hybrid signals, similar to ones recorded during 1991-1993 when dome emplacement occurred on the main crater's floor.
Sources: Servicio Geológico Colombiano (SGC); Reuters
During 13-20 March, seismicity at Galeras decreased in comparison to previous weeks and deformation was measured at the volcano. Plumes of mainly steam, gas, and small amounts of ash were emitted from the volcano and rose to a maximum height of 1.2 km above the volcano (or 18,000 ft a.s.l.). Galeras remained at Alert Level 3 ("changes in the behavior of volcanic activity have been noted").
Source: Servicio Geológico Colombiano (SGC)
During 27 February to 6 March, there were variations in the rate of degassing at Galeras and an increase in the volume of the lava dome located in the main crater in comparison to the previous week. Galeras remained at Alert Level 3 ("changes in the behavior of volcanic activity have been noted").
Source: Servicio Geológico Colombiano (SGC)
During 20-27 February, seismicity continued at Galeras, with an average of 280 small earthquakes occurring per day. On 26 February seismic stations detected a cluster of earthquakes. A shallow M 4.8 volcano-tectonic earthquake was registered below the volcano at 1009, followed by 35 smaller earthquakes. Slight deformation was recorded at the volcano. A flux of about 600 metric tons of sulfur dioxide was measured per day. Steam and gas rose to ~700 m above the volcano (or 16,300 ft a.s.l.). Galeras remained at Alert Level 3 ("changes in the behavior of volcanic activity have been noted").
Source: Servicio Geológico Colombiano (SGC)
During 13-20 February, seismicity continued at Galeras, with an average of about 190 small earthquakes occurring per day. A flux of about 200 metric tons of sulfur dioxide was measured daily. Steam and gas rose to ~1.1 km above the volcano (or ~17,600 ft a.s.l.) on 19 February. Incandescence was visible at parts of the lava dome. The volume of the lava dome in the main crater was approximately 1.5 times larger than when it was first observed on 13 January. Galeras remained at Alert Level 3 ("changes in the behavior of volcanic activity have been noted").
Note: It was incorrectly reported in the 8-14 February Weekly Volcanic Activity Report that on 8 February pyroclastic-flow deposits were found at Galeras. Pyroclastic-fall deposits were observed.
Source: Servicio Geológico Colombiano (SGC)
INGEOMINAS reported on 10 February that a lava dome was growing inside the main crater of Galeras. The lava dome was not seen during the previous observation flight on 16 January. Seismicity was dominated by long-period earthquakes, with an average of 150 occurring daily during 13 January to 8 February. On 5 February, strong degassing was visible from different parts of the active cone and around the lava dome. Cracks were visible on the high parts of the lava dome. During a field visit on 8 February, scientists found fall material [originally incorrectly reported in the WVAR as pyroclastic-flow deposits] high on the SE flank of the volcano. The exact date of the small emission was not known, but it occurred after 26 November when scientists previously visited the area. Galeras remained at Alert Level 3 ("changes in the behavior of volcanic activity have been noted").
Source: Servicio Geológico Colombiano (SGC)
During 30 January to 6 February, seismicity continued at Galeras, with an average of 200 small earthquakes occurring per day. In addition, slight deformation was recorded at the volcano. A flux of about 300 metric tons of sulfur dioxide was measured per day. Strong degassing occurred in several sectors of the active cone and around the lava dome. Steam rose to ~900 m above the volcano (or ~17,000 ft a.s.l.). Galeras remained at Alert Level 3 ("changes in the behavior of volcanic activity have been noted").
Source: Servicio Geológico Colombiano (SGC)
During 23-30 January, a lava dome continued to grow in the main crater of Galeras, and strong degassing occurred in several areas of the active cone and around the dome. Seismicity continued that was associated with the movement of fluid within the volcano, and slight deformation was recorded. Galeras remained at Alert Level 3 ("changes in the behavior of volcanic activity have been noted").
Source: Servicio Geológico Colombiano (SGC)
During a flight over Galeras on 13 January, scientists saw a lava dome in the volcano's main crater. Around this time, there was an increase in the amount of seismicity and deformation. Galeras remained at Alert Level 3 ("changes in the behavior of volcanic activity have been noted").
Source: Servicio Geológico Colombiano (SGC)
During 2-9 January, Galeras emitted gas and small amounts of ash. In addition, heightened seismicity continued and small changes in deformation were measured. The sulfur-dioxide flux from the volcano varied between 490 and 1,500 metric tons per day. Galeras remained at Alert Level 3 ("changes in the behavior of volcanic activity have been noted").
Source: Servicio Geológico Colombiano (SGC)
During 23 December to 2 January, Galeras emitted gas and small amounts of ash. On the 23rd, four events produced ash plumes that rose to ~3 km above the volcano (or 23,900 ft a.s.l.) and drifted toward the sector of Consacá, ~13 km WSW. A cluster of 33 volcano-tectonic earthquakes occurred beneath the volcano's crater during 29-30 December. The earthquakes reached a maximum magnitude of 1.2. The sulfur-dioxide flux at the volcano varied between 300 and 1,500 tons per day. Galeras remained at Alert Level 3 ("changes in the behavior of volcanic activity have been noted").
Source: Servicio Geológico Colombiano (SGC)
Based on information from the US Geological Survey, the Washington VAAC reported that a pilot observed an ash plume from Galeras on 23 December at a height of ~7.3 km (24,000 ft) a.s.l. drifting W.
Source: Washington Volcanic Ash Advisory Center (VAAC)
Due to a decrease in volcanic activity at Galeras, on 28 November INGEOMINAS reduced the Alert Level at the volcano from 2 (probable eruption in days to weeks) to 3 (changes in the behavior of volcanic activity have been noted). Through 12 December, seismicity was recorded that was indicative of fluids moving within the volcano, small changes in deformation occurred, and emitted gas rose to a height of ~500 m above the volcano (or 15,700 ft a.s.l.).
Source: Servicio Geológico Colombiano (SGC)
The hazard status at Galeras was at Level III as of 5 December. Low levels of seismicity and deformation were continuing. Although poor weather conditions obscured the volcano most of the time, steam and gas emissions were photographed on 2 December coming from several locations on the active cone, including the main crater. The plume rose 1 km above the summit on 3 December.
Source: Servicio Geológico Colombiano (SGC)
On 24 November at 0246 seismicity was recorded at Galeras that was associated with the beginning of an eruption. Ash from the eruption fell in the towns of Fontibon, San Cayetano, Postobon, and in north Pasto (E of the volcano). INGEOMINAS raised the Alert Level from 2 (probable eruption in days to weeks) to 1 (eruption imminent or occurring). The Washington VAAC observed a small puff of ash NE of the volcano at a height around ~4.6 km (15,000 ft) a.s.l. Activity decreased by the next day, so the Alert Level was reduced to 2. Thousands of people had been evacuated from the vicinity of the volcano during the week prior to the eruption.
Sources: Associated Press; Servicio Geológico Colombiano (SGC); Reuters
Heightened seismic activity continued at Galeras during 16-22 November. According to news articles, only ~1,000 of the ~9,000 residents who were ordered to evacuate had left as of 18 November.
Sources: Associated Press; Servicio Geológico Colombiano (SGC)
INGEOMINAS reported that during 9-14 November, a large number of tornillo earthquakes (long-period seismic events related to pressurized fluid flow at shallow depth) continued to occur below Galeras. In the previous 2 weeks, 25 tornillos were recorded. The earthquakes had characteristics similar to those that occurred before eruptions in 1992-1993. A small amount of deformation was recorded at Galeras during the report period. Activity in the previous month suggested that the volume of magma beneath the volcano was greater than that inferred to have been present during the 1992-1993 eruptions. Due to the increased activity at Galeras, the Alert level was raised from 3 (changes in the behavior of volcanic activity have been noted) to 2 (probable eruption in days or weeks).
According to new reports, on 14 November local authorities recommended the voluntary evacuation of as many as 9,000 people living in towns near the volcano, including in parts of Pasto (to the W), La Florida (to the N), and Nariño (to the N).
Sources: Servicio Geológico Colombiano (SGC); El Tiempo; IOL News
During 31 October to 7 November, low-level seismicity occurred at Galeras, including several tornillo earthquakes (long-period seismic events related to pressurized fluid flow at shallow depth). In addition, small amounts of deformation were recorded at the volcano. Galeras remained at Alert Level 3 (changes in the behavior of volcanic activity have been noted).
Source: Servicio Geológico Colombiano (SGC)
Volcano-tectonic earthquakes that began at Galeras around 19 August continued through 29 August. The earthquakes occurred at depths of 5-8 km and reached M 4.6. No surficial changes were observed at the volcano.
Source: Servicio Geológico Colombiano (SGC)
During 19-21 August, 30 volcano-tectonic earthquakes were recorded at Galeras. The earthquakes occurred 3-4 km NW of the volcano's active cone, near the towns of Santa Bárbara, Nariño, and La Florida. About five earthquakes felt by nearby populations occurred at depths of 8-6 km, with the largest (M 4.7) occurring at a depth of 6 km on 21 August. No significant deformation was observed at the volcano during the report period, and gas emission continued from the main and secondary craters.
Source: Servicio Geológico Colombiano (SGC)
During 8-15 August, seismicity remained at low levels at Galeras and small amounts of deformation were recorded. The Alert Level remained at 3 (changes noted in the behavior of volcanic activity).
Source: Servicio Geológico Colombiano (SGC)
During 4-11 July, seismicity remained at low levels at Galeras. An M 2.5 volcano-tectonic earthquake on 4 July was felt in sections of some towns near the volcano. During the report period, small amounts of deformation were recorded and low rates of gas discharge were noted.
Source: Servicio Geológico Colombiano (SGC)
At Galeras during 6-13 June, there were low levels of seismicity, small amounts of deformation, and moderate gas emissions from the main crater. The alert remained at level 3 (changes in the behavior of volcanic activity have been noted).
Source: Servicio Geológico Colombiano (SGC)
During 30 May to 6 June, there was a decrease in seismicity and deformation at Galeras in comparison to the previous week. The number and magnitude of earthquakes decreased and there were smaller changes in deformation. The level of alert was decreased from 2 (probable eruption in days or weeks) to 3 (changes in the behavior of volcanic activity have been noted).
Source: Servicio Geológico Colombiano (SGC)
According to a news article, on 24 May the Colombian government ordered the evacuation of ~9,000 people living near Galeras due to an increase in volcanic activity. INGEOMINAS reported that during 16-23 May, small shallow earthquakes occurred beneath the volcano. There was an increase in earthquakes associated with fracturing within the volcano during the night of 21 May to the morning of 22 May. Gas emissions slightly decreased on 17 and 20 May in comparison to 29 April and 2 May, and slightly increased around 23 May. Deformation continued to be recorded at the volcano's summit. There were no ash emissions. Galeras remained at Alert Level 2 (probable eruption in terms of days or weeks) as it has since 19 April 2005.
Sources: Servicio Geológico Colombiano (SGC); Reuters
During 31 January to 7 February, small gas-and-ash emissions continued at Galeras. Ash was deposited in the sectors of Consacá (~15 km W of the volcano) and La Florida (~10 km NW), and in the city of Pasto (~ 10 km E). Low-level seismicity and a small amount of deformation were recorded.
Sources: Washington Volcanic Ash Advisory Center (VAAC); Servicio Geológico Colombiano (SGC)
During 25-31 January, low-level relatively shallow seismicity continued at Galeras, and a small amount of deformation towards the W portion of the volcanic cone occurred. On 30 January an emission of gas and ash rose ~800 m above the volcano.
Sources: Washington Volcanic Ash Advisory Center (VAAC); Servicio Geológico Colombiano (SGC)
Galeras volcano erupted explosively on 21 November at 1544, Instituto Colombiano de Geología y Minería reported. The eruption produced a shock wave felt as far away as Cimarrones (18 km N of the volcano), Chachagui (17 km N of the volcano), and Laguna de La Cocha (20 km SW of the volcano). Effects of the shock wave varied from a loud roar, to the vibration of large windows, to the feeling of an earthquake. Ballistic rock blocks were expelled and fell nearly 3 km from the volcano on its eastern flank, producing short-lived forest fires. The eruption produced an ash-and-gas column that rose to an estimated height of 9-10 km a.s.l and drifted to the S and W. The Washington VAAC reported that satellite imagery through 2015 on 21 November revealed that high level ash estimated to be near 9 km a.s.l had moved to the W, while low level ash estimated to be near 4-5 km a.s.l remained in the vicinity of the summit of the volcano and showed little motion.
Sources: Washington Volcanic Ash Advisory Center (VAAC); Servicio Geológico Colombiano (SGC)
During 8-11 October, emissions of gas and fine ash continued at Galeras. Plumes rose to a maximum height of ~1.5 km above the volcano. Small-amplitude tremor associated with gas-and-ash emissions was recorded.
Source: Servicio Geológico Colombiano (SGC)
During 23-27 September, tremor associated with ash-and-gas emissions was recorded at Galeras. On the 23rd, ash deposits were seen on the upper portions of the volcano's N flank. By the 27th the amount of tremor had decreased significantly, which may have coincided with a decrease in ash emissions.
Source: Servicio Geológico Colombiano (SGC)
INGEOMINAS reported that at Galeras during 19 August to 1 September, there was a decrease in the level of seismicity and the number of ash emissions. Gas-and-steam emissions continued.
Source: Servicio Geológico Colombiano (SGC)
INGEOMINAS reported that gas-and-ash emissions continued at Galeras as of 18 August. Ash fell in villages near the volcano, including La Florida, Sandoná, El Ingenio (within 15 km of the volcano), and farther afield in Samaniego and Sotomayor (between 20 and 40 km from the volcano).
Sources: Washington Volcanic Ash Advisory Center (VAAC); Servicio Geológico Colombiano (SGC)
INGEOMINAS reported that volcanic and seismic activity increased at Galeras on 11 August at 2349 when an eruption began that sentan ash-and-gas cloud to an unknown height and generated visible incandescence. According to the Washington VAAC, satellite imagery showed that an ash plume rose to a height of ~10.7 km a.s.l. It spread in all directions, but mainly to the NE, E, and SW. Later in the day, a thin plume at a height of ~7.3 km a.s.l drifted SW into northern Ecuador. A plume also drifted NW at a height of ~6.1 km a.s.l. By 1315 ash was no longer visible on satellite imagery. Fine ash was deposited in villages near the volcano including, La Florida (~10 km NW of the volcano), Nariño, Sandoná, and Consacá, and farther afield in Ancuya, Linares, and Sotomayor (~ 40 km NW of the volcano).
News articles reported that ~230 families were evacuated mainly from the volcano's N flank. Ash contaminated potable water in some villages, impacted farm animal's health, and left hundreds of dead fish floating in rivers. The village of La Florida was most strongly impacted by the eruption. On 16 August, ash emissions continued, depositing ash in several villages. A thin plume was visible on satellite imagery extending ~75 km NW.
Sources: Washington Volcanic Ash Advisory Center (VAAC); EL PAÍS; Servicio Geológico Colombiano (SGC); El Spectador
According to the Washington VAAC, several ash plumes emitted from Galeras were visible on satellite imagery during 7-10 August. The highest rising plume reached about 6 km a.s.l.
Source: Washington Volcanic Ash Advisory Center (VAAC)
Satellite imagery showed a faint ash plume emitted from Galeras on 29 July around 0745. The height and direction of the plume was unknown.
Source: Washington Volcanic Ash Advisory Center (VAAC)
Based on information from IG, the Washington VAAC reported that an activity increase at Galeras during several days prior to 24 July consisted of emissions that rose ~600 m above the volcano's summit. Ash was not visible on satellite imagery. According to a news report, a wide area around the volcano was declared off limits to visitors.
Sources: Washington Volcanic Ash Advisory Center (VAAC); Associated Press
Reports are organized chronologically and indexed below by Month/Year (Publication Volume:Number), and include a one-line summary. Click on the index link or scroll down to read the reports.
New vent ejects ash; A- and B-type seismicity
Increased fumarolic activity was noted [on] 18 February. By the 23rd, a small fumarole within the main crater had rapidly grown to a 30-m-wide vent that ejected lithic ash. The next day, activity declined to voluminous white emissions with a strong sulfurous odor, rising to 50 m above the crater floor. On 25 February, a five-person team from the Observatorio Vulcanológico de Colombia installed a deformation network and three seismometers (two of them telemetering) in addition to one WWSSN station already present at the E foot of the volcano. The new seismometers were installed 1-8 km from the summit. About 15-20 A-type and 50 B-type events were detected daily 22 February-7 March. After the 7th, A-type events dropped to 0-5/day, while B-types increased to 60-70/day. Seismicity was continuing as of 16 March. Some earthquakes (M 2-3) were felt locally. None of the events have been located. Tremor signals have been occasionally recorded. Initial deformation measurements showed no changes. Voluminous sulfurous steam emission continued 2-16 March [see also 14:05].
[In an unpublished manuscript, Cepeda et al. (1989) note that people living near the volcano reported brief activity at varying intervals each year between 1974 and at least 1983. S. Williams reports that soldiers manning a communications facility on the caldera rim described increased gas emission, felt seismicity, and more frequent rockfall activity in early 1988, a year before initial reports in the Bulletin.]
Information Contacts: C. Carvajal, INGEOMINAS, Manizales; J. Ewert and A. Lockhart, USGS; Reuters.
Small phreatic explosions; seismicity
Most of the following is from a draft report by Hector Cepeda and others.
Eruptive activity. Increased fumarolic activity accompanied by minor ash emission and seismicity began in mid-February. A summit-area explosion was felt on 19 February before 1700. Weather over the cone cleared at 1700, and strong fumarolic activity from one of the secondary craters was visible from the army/police communications station on the edge of the caldera. The height of the column varied between 100 and 200 m. This information triggered the mobilization of the Comité Regional de Emergencia de Nariño (CREN) which requested help from higher authorities.
During a 25 February summit climb, a column of water vapor, sulfur compounds, and sulfuric acid was being vigorously emitted from a vent (named El Pinta) immediately E of the main crater. The area around the active crater was covered by recently ejected pyroclastic material, consisting of very fine, gray, wet ash and lithic fragments of centimeters (occasionally to tens of centimeters) in size. No fresh magma was found in the tephra.
Before 19 February, El Pinta crater had shown no fumarolic activity. After the onset of activity, the crater was elongate N-S, with horizontal dimensions of 40 x 25 m and a depth of >30 m. A chain of small fumaroles within the crater emitted gases at high pressure and had deposited sulfur. Resonance effects produced a sound like a jet aircraft. Fumarolic activity at other vents had also increased substantially.
As activity continued, ejecta from El Pinta were dispersed nearly 1 km to the WSW. Maximum tephra thicknesses were ~5 cm within 5 m of the crater rim (apparently by the 20 March report date). Impacts of the largest blocks left visible marks. The direction in which pyroclastics had been ejected by the phreatic activity and the behavior of the gas jet suggested that the conduit of El Pinta was inclined to the E.
On 12 March, the staff of the nearby police post reported that another old secondary crater (El Peladito) had reopened on the edge of the main crater, 50 m S of El Pinta. This crater did not show any fumarolic activity. A pre-1964 collapse of the wall that formerly separated it from the main crater left it perched on the main crater's inner wall. The bottom of El Peladito was not visible, but was more than 50 m below the main crater's rim.
Ash was emitted for 4 hours on 27 March, lightly dusting Pasto, at the E foot of the volcano. A tremor-like signal accompanied the ash emission, without a precursory swarm or eruption earthquakes. In response, INGEOMINAS elevated the alert level from "watchfulness" to "white." A strong swarm on 5 April at 1000 prompted an increase to "yellow" alert [see also 14:04], which had not changed as of 12 April. The Nariño seismograph, 5 km from the crater, was saturated by 6-7 of the earthquakes, but no ash was emitted.
Two small lakes were present in the summit complex, one (La Trucha) between the base of the active cone and the smaller caldera, the second (Rafa) in the bottom of the main crater. Levels of these lakes were higher than usual because of the recent unusually heavy rains, and geologists suggested that the additional water in the volcano's hydrothermal system may have influenced its activity.
Since 1988, INGEOMINAS and the Univ Nacional (Manizales campus) have monitored several fumaroles at Galeras, measuring H2S, SO2, HCl, CO2, and total S. Only small temperature increases were noted, reaching roughly 10°C at one fumarole (Calvache) on the NNE flank of the active cone, which had a temperature of 100.6°C on 15 March. COSPEC measurements on 19 and 20 March yielded values of only 30 and 40 t/d.
Deformation. Baseline deformation data was limited to routine geodetic work by the Instituto Geográfico Agustín Codazzi. A series of proposed level lines and dry tilt stations have been identified, and initial measurements were made 2 March on the upper E flank. Remeasurements since then have identified no changes that exceeded instrumental error.
Seismicity. A WWSSN seismic station ~5 km SE of the crater has been collecting data for ~15 years. At the request of the CREN and the Oficina Nacional para la Atención de Desastres, personnel from the Observatorio Vulcanológico de Colombia installed three additional seismic stations on the volcano on 28 February. Early February seismicity had consisted of low-frequency, small magnitude (M < 0.5) events, at rates of no more than 10/day. The newly installed seismic net recorded a gradual increase in the number of events/day, mostly B-types (see figure 1). Energy release generally remained low, with most events of M<1, although high-frequency shocks on 17 and 20 March reached magnitudes of 1.5 and 2.2.
A small number of A-type events were recorded. Very shallow focal depths were indicated by the small separations between P- and S-wave arrivals at stations (Crater 1 and 2) 0.5 and 1 km from the active vent, and attenuation was strong (at Nariño 1) 5.5 km away. Many of the shallow high-frequency events were preceded by small bursts of signals characteristic of gas emission. A very few (4 or 5) high-frequency events from a different source were detected, with S-P of 1.5 seconds at Crater 1 station. These decreased after 8 March, and seismicity was dominated by low-frequency events. Long-period events were a little less numerous but of about the same magnitude as the high-frequency shocks. These were also believed to be very shallow and were greatly attenuated at Nariño 1. No felt shocks were reported until 20 March at 0033 when persons in the Telecom communications station 1 km from the crater noticed an A-type event.
A signal similar to spasmodic tremor began to be observed on 8 February, and the next day there were a series of events that looked like long-period seismicity. Tremor was clearer after 8 March, in brief pulses that had a more spasmodic than harmonic character. Energy was relatively low, although amplitudes occasionally reached moderate to high levels near the source of the seismicity (on stations Crater 1 and 2). The predominant frequency was 4-5 Hz, with some 2-Hz components. The most conspicuous pulse occurred on 11 March at 1803, possibly related to the reopening of El Peladito crater, reported 12 March (see above). Low-frequency events and the short pulses of tremor could be correlated with small changes in fumarolic activity.
Information Contacts: H. Cepeda and B. Pulgarin, INGEOMINAS, Popayán; F. Muñoz, A. Acevedo, F. Gil, A. Nieto, M. Calvache, H. Mora, and C. Carvajal, INGEOMINAS, Manizales; A. Londoño, Univ Nacional, Manizales; I. Mejía, INGEOMINAS, Medellín; N. Banks, J. Ewert, and M. Doukas, USGS.
Ash emission and strong seismicity; area residents alerted
Frequent ash ejection in early May was accompanied by increased seismicity (figure 1) and SO2 emission. The strong seismic swarm that began 5 April at 1000 and saturated one seismograph was not associated with eruptive activity. COSPEC measurements the next day showed a sharp rise in SO2 emission to >1,200 metric tons/day (t/d) from 30-40 t/d 19-20 March [SO2 flux rose above 1,000 t/d on four days in April, see figure 12]. Glow was observed within the active (El Pinta) vent and by mid-April rocks 2 m below the rim had reached almost 600°C. The seismic swarm and glow prompted officials to increase the alert status to "yellow." A hazard map was published in a local newspaper and residents of areas designated as hazardous were urged to move, if possible, to a safer region. As of late April, a dense water-rich gas plume continued to rise 1-2 km above the crater and low-level seismicity persisted, but no deformation was evident.
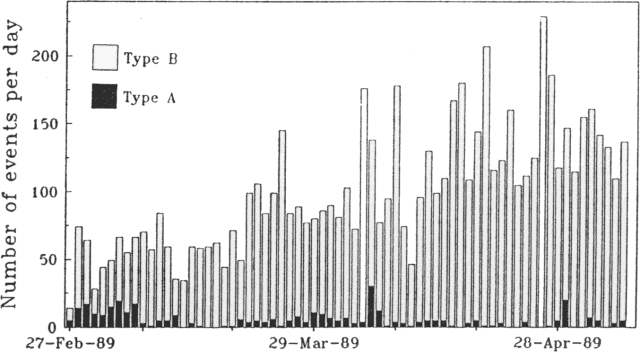 |
Figure 1. Number of recorded seismic events at Galeras, 27 February-5 May 1989. Courtesy of the Observatorio Vulcanológico de Colombia and the USGS Volcano Disaster Assistance Program. |
4-5 May. After 10 hours of gradual increases in both background tremor (<1 mm peak to peak) and small long-period seismic events, ash was erupted between 0613 and 0830 on 4 May. Although emission rates were low, column heights reached 3.3 km. Ash composed of lithic particles and some plagioclase crystals fell towards the SW and E; a light dusting of ash fell on Pasto (population 350,000) at the volcano's E foot. Seismicity fluctuated between low and moderate levels for the next 11 hours before ash emission resumed at 1743. There were no recognizable immediate seismic precursors but the onset of the activity was accompanied by increased tremor. The rate of ash emission was again low, with the column pulsing at times to 2.9 km height. Both the plume and tremor diminished to low levels at 1855, but ash emission continued until 1940. Most of the ash was blown SW, and 1 mm of dust-sized tephra fell on Consaca, roughly 13 km WSW of the vent. EDM lines showed no change during the activity.
The ash eruption resumed at 0638, accompanied by an impulsive seismic signal, and tremor increased rapidly to an average peak-to-peak amplitude of 2 mm. The column grew to 1.2 km height by 0712, 1.9 km by 0726, and stabilized as a pulsing column to 2.8 km height between 0728 and 0825. The eruption column and tremor then decreased rapidly to low levels. The plume was broad and dense, dropping sheets of ash mainly within a few kilometers W of the vent. On the vent's E rim, the new deposit was ~25 cm thick, with the first layer a wet mud, probably from the lake that had occupied the bottom of the vent. Surge units were found in the deposit, as were lithic blocks that averaged about 15 cm in diameter. Only a thin film of ash fell at Consaca and other areas to the W and SW. However, the press reported that rescue workers evacuated ~2,000 residents of the Consacá area because of the ashfall. Activity around 1100 was accompanied by pulses of 4-5-Hz tremor and some long-period events. Ash was blown to the N, falling over La Florida and Nariño (8 km NNW and 7.5 km N of the vent). The EDM line across the caldera showed no change after the 4-5 May activity, but there may have been slight deflation on lines from the caldera rim to the active cone.
6 May. Ash emission resumed on 6 May at about 0900, producing a broad, pulsing column that fluctuated between 2.5 and 3.2 km height until darkness prevented further observations (about 1800). The rate of ash emission was intermediate between that of 4 May and the more vigorous activity of 5 May. Only low-level tremor and occasional long-period events accompanied the 6 May activity.
7-9 May. Harmonic tremor (1.3-1.4 Hz) began on 7 May at 0730 and continued for 38 minutes. Amplitudes reached 5 mm peak-to-peak and the tremor could be detected throughout the seismic net to 10 km from the vent. A similar signal reappeared at 0900, lasting for 40 minutes, and a pattern of intermittent tremor continued until 1400, with each episode building to larger amplitudes (as much as 1.5 cm peak-to-peak). The tremor typically occurred in 1.35-Hz packets with wavelengths of 10 seconds. The next-to-last tremor episode ceased abruptly after two large A-type events were recorded. During the last and strongest episode, many small A-type shocks were imbedded in the tremor. The A-type events were centered 3-3.5 km below the vent and 1-7 km to its S. The strong tremor was succeeded by bands of higher frequency tremor with much lower amplitude (<1 mm peak-to-peak). Minor ash emission continued 7 and 8 May. Ash was blown N on 7 May but did not reach La Florida, Nariño, or Jenoy (6 km NNE of the vent). The 8 May ash fell only near the crater. Frequent tremor episodes continued 8 May: 45 minutes of 2-3-Hz tremor that began gradually at 0614; low-frequency (1.54 Hz) banded tremor that began at 0800 and reached 23 mm amplitude about noon, decreasing in amplitude around 1540; amplitude increased again at 1600, to 20 mm, before declining at 1650 and stabilizing at 2-3 mm. Tremor decreased gradually from 9 May at 2000, to a maximum of 1 mm amplitude. Ash emission then stopped, and eruptive activity had not resumed as of 16 May.
The five days of ash emission prompted school closings and an increase in alert status to "orange" on 9 May. No immediate evacuations were ordered but officials asked residents to be ready for instructions if an eruption occurs. The Galeras Volcano Workshop that began 8 May with 50 participants from Central and South America will study the activity and hazards response.
Tephra deposits. An area of ~33 km2 was enclosed within the 3 mm ashfall isopach, including the TELECOM and television sites, 1.5 km to the S, and Nariño, 7.5 km N of the crater. The volume of tephra deposits was calculated at ~4 x 10⁵ m3. The 7 cm of fine ash deposited at the S rim of El Pinta crater 19 February-3 May was overlain by more than 5 m of tephra that accumulated 4-9 May. A preliminary grain-size analysis shows a large fraction of fine (<1 mm) material (table 1). Some coarser layers of the early May tephra included scoria; in one layer (G) it was clearly altered, but in another horizon (E) it included abundant crystals in a very glassy matrix.
Table 1. Grain-size distribution of tephra deposited 4-9 May at Galeras, on the S rim of El Pinta crater. Thicknesses of individual layers (in cm) are supplemented by cumulative thickness of post-19 February tephra; only 7 cm of the section fell 19 February-3 May. The weight percent of six size fractions: <0.5, 0.5-1, 1-2, 2-4, 4-6.5, and >6.5 cm are shown. Courtesy of INGEOMINAS.
| Layer ID | Layer Thickness | Cumulative Thickness | 0-0.5 cm | 0.5-1 cm | 1-2 cm | 2-4 cm | 4-6.5 cm | 6.5+ cm |
| B | 3 cm | 501 cm | 26.6 | 32.2 | 27.3 | 8.6 | 5.5 | -- |
| C | 7 cm | 498 cm | 96.0 | 2.3 | 1.0 | 0.5 | 0.3 | -- |
| D | 12 cm | 491 cm | 44.6 | 27.3 | 20.4 | 6.1 | 1.6 | -- |
| E | 22 cm | 469 cm | 5.0 | 4.1 | 6.1 | 7.9 | 30.9 | 46.0 |
| F | 32 cm | 447 cm | 38.8 | 33.0 | 17.9 | 5.2 | 5.2 | -- |
| G | 43 cm | 415 cm | 6.9 | 8.1 | 7.5 | 6.5 | 6.5 | 24.1 |
Information Contacts: H. Cepeda and B. Pulgarin, INGEOMINAS, Popayán; M. Calvache, F. Muñoz, and R. Méndez, INGEOMINAS, Manizales; I. Mejía and E. Parra, INGEOMINAS, Medellín; M. Mercado, Popayán; N. Banks, USGS; Deutche Presse-Agentur; Agence France-Presse.
Ash emission ends; seismicity declines briefly
Activity declined after the moderate ash emissions of early May. Little if any plume was visible in most weather conditions, although acid rain continued to irritate eyes and damage vegetation on the N flank. Seismicity gradually declined until late May, when it began to increase again, reaching the same level as at the end of April (figure 2). Most of the seismicity was of low frequency; few high-frequency events were detected. Pulses of tremor that lasted about 5 minutes and had dominant frequencies of 4-5 Hz were often recorded. Attenuation was high at distant stations, indicating a shallow source. Rates of SO2 emission declined to a few hundred tons/day (see figure 12). No significant cumulative changes in deformation have been measured.
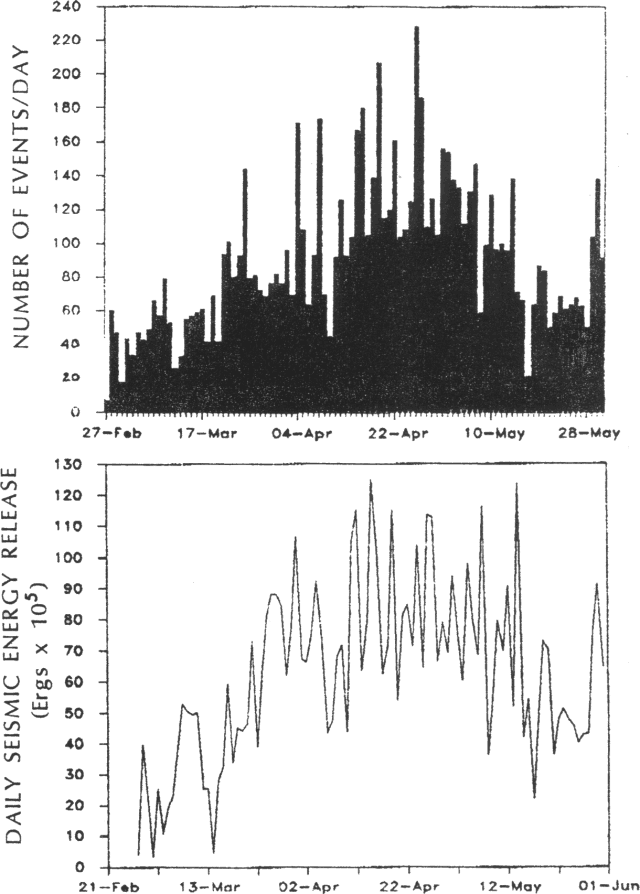 |
Figure 2. Number of seismic events/day (top) and daily seismic energy release (bottom) at Galeras, late February-May 1989. Courtesy of INGEOMINAS. |
Information Contacts: INGEOMINAS, Pasto.
Vigorous fumarolic emission; seismic swarm
In June and July, fumarolic activity on the SW flank of the central cone increased significantly. A new fumarolic vent (named Las Portillas) opened on the inner W wall of the central crater. The vent was ~2 m in diameter and vigorously emitted gas with temperatures >470°C on 22 July. Both Las Portillas and the 10-m-wide La Chava vent emitted superheated gases, producing a loud noise. During the last two weeks in July, numerous small fumarolic fractures on the S rim of the crater, and small radial and concentric fractures on the W crater rim, were observed.
Seismic activity during June and July was nearly stable (figure 3), except for a slight decline (20%) in the daily average of B-type events between mid-May and the last week of July. The seismic energy release associated with B-type events was also stable. The number of A-type events was low until 23 July when a swarm of 30 earthquakes occurred between 0811 and 1500, including a M 3 event at 1233. The swarm was centered about 2 km W of the crater, at 1-7.5 km depth (figure 4). The number of low-frequency events had increased slightly before the swarm. Dry tilt showed no significant changes, although electronic tilt varied slightly on the 21st (figure 5). SO2 emissions increased slightly with an average of 600 t/d in July (see figure 12).
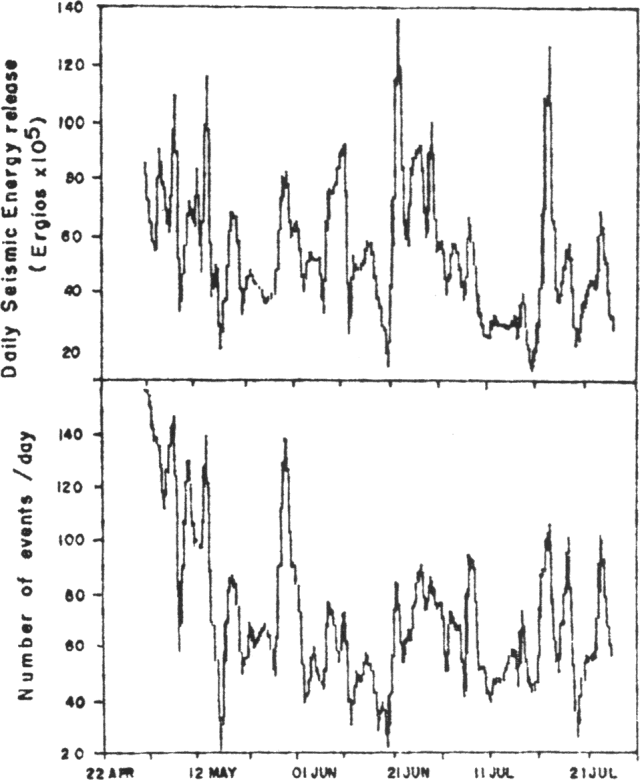 |
Figure 3. Daily seismic energy release (top) and number of events (bottom) at Galeras, 22 April-31 July. Courtesy of the Observatorio Vulcanológico de Colombia. |
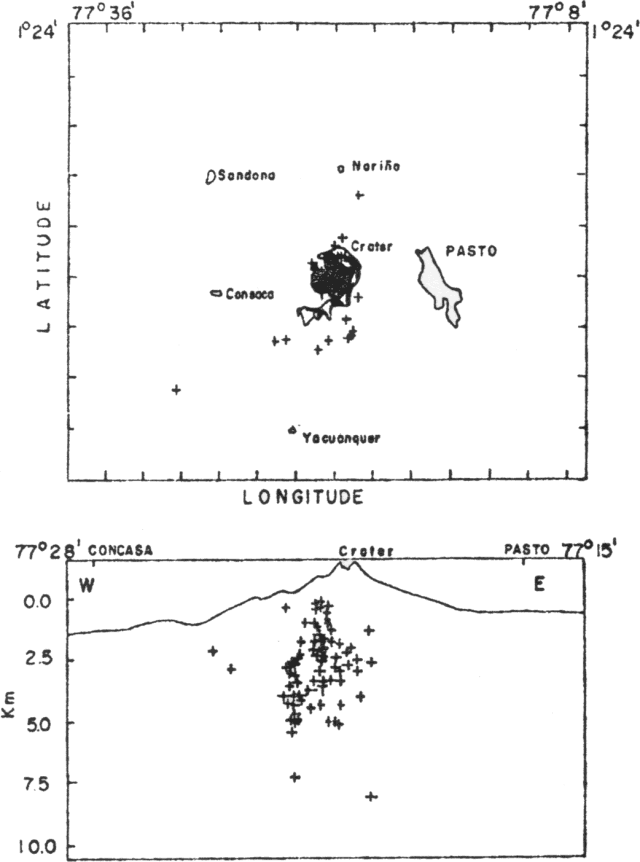 |
Figure 4. Map showing epicenters (top) and an E-W cross-section (bottom) of seismic events at Galeras in July. Courtesy of the Observatorio Vulcanológico de Colombia. |
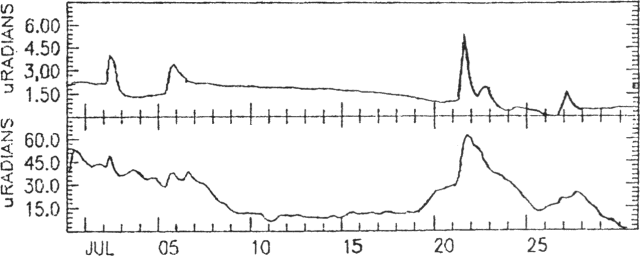 |
Figure 5. Deformation measurements at Galeras, July 1989, showing radial (E-W) tilt at Peladitos station, at about 3,800 m elevation 2 km E of the crater at Galeras (top), and tangential (E-W) tilt at Telecom station, at about 3,900 m elevation 2 km S of the crater (bottom). Increasing values indicate uplift to the W. Courtesy of the Observatorio Vulcanológico de Colombia. |
Information Contacts: INGEOMINAS, Pasto.
Earthquake swarm; inflation; new fumaroles; more SO2
Ash ejections declined in mid-May and had not resumed by early September. Seismic energy release and the number of volcanic events generally remained relatively stable in August and early September (figure 6). Relatively few high-frequency events were recorded until an increase began on 14 August, peaking on 25 August, associated with a 21-event swarm ~6 km NE of the crater at 12-15 km depth (figure 7). Similar events have also occurred near the crater at depths of 2-7 km. Low-frequency events declined slightly from July levels. Electronic tilt data showed inflationary changes of 100 µrad 2 km S of the crater at 3,900 m elevation (Telecom station) but only 4 µrad 2 km E of the crater at 3,800 m elevation (Peladitos station), possibly associated with a very shallow source. Neither EDM or dry tilt measurements showed significant changes. SO2 emissions increased through mid-August then declined slightly, yielding an average rate through 12 September of 1,046 t/d (see figure 12).
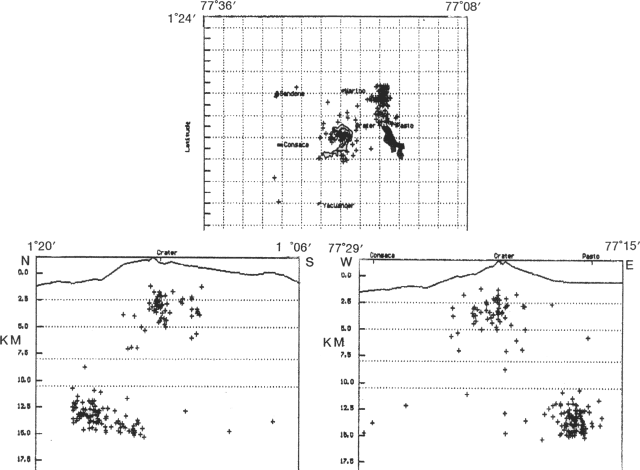 |
Figure 6. Daily seismic energy release, 21 February-9 September 1989, recorded by the Nariño station, 5 km from the crater at Galeras. Courtesy of INGEOMINAS. |
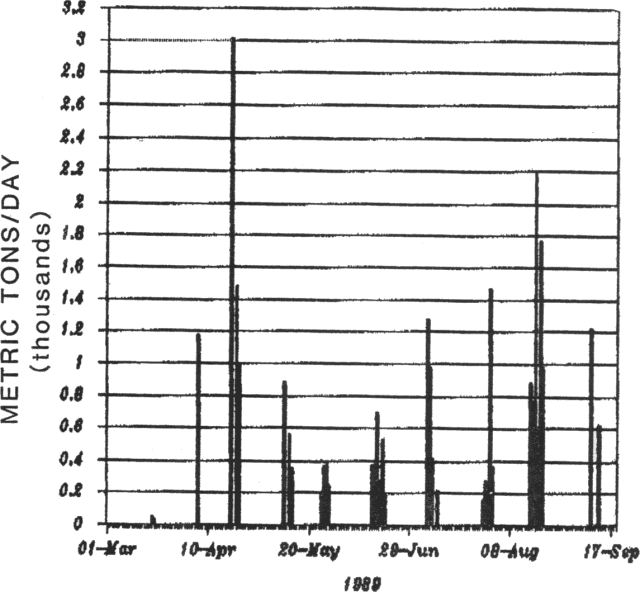 |
Figure 7. Epicenters (right) and N-S and E-W cross sections showing focal depths (below, left and right) of 164 seismic events near Galeras, August 1989. Note that the scales of the cross sections differ from the scale of the epicenter map by a factor of 2. Courtesy of INGEOMINAS. |
Geologists climbed into the crater on 5 September. Fumarolic activity was continuing to increase on the SW flank of the central cone, with the areas numbered 3, 4, and 8 (figure 8) showing expansion in size. The volume and pressure of gas emission increased since the last visit, as has the strong noise associated with the expulsion of superheated gases. Incandescence was observed within vents in the La Chava area (number 4 on figure 8) and an E-W fracture crossing the same area. The fracture had increased its width to 30 cm. A new fumarolic area (number 5) had developed on the W flank of the central cone, associated with radial and tangential fractures. The western inner flank of the main crater had also shown an increase in fumarolic activity. Deposits from small phreatic emissions were observed near the vents.
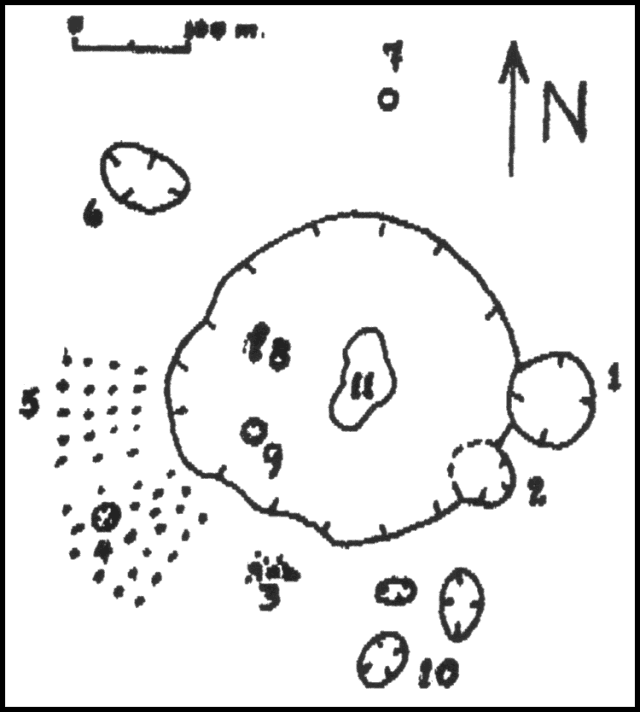 |
Figure 8. Sketch map of the summit area of Galeras during fieldwork 5 September 1989. Thermal features are numbered. Courtesy of INGEOMINAS. |
Information Contacts: INGEOMINAS, Pasto; INGEOMINAS, Manizales.
Frequent seismicity continues
Although ash emission declined in May, fumarolic activity and seismicity have generally remained elevated.
In September, energy release and number of volcanic (high- and low-frequency) earthquakes remained stable (figure 9). Energy from long-period events increased slightly early in the month, but rapidly decreased to very low levels. Spasmodic tremor episodes, with periods of 0.25-0.50 seconds, increased slightly from August values. High-frequency events were centered roughly 9 km N of the crater at about 13 km depth until 11 September, when they became concentrated near the crater at 1-5 km depth (figure 10). On 30 September, an M 3 earthquake, 9 km SW of the crater at 8 km depth, was felt in Consacá (~4 km W of the summit). SO2 emissions were moderate, averaging ~800 t/d. Deformation data revealed no significant changes.
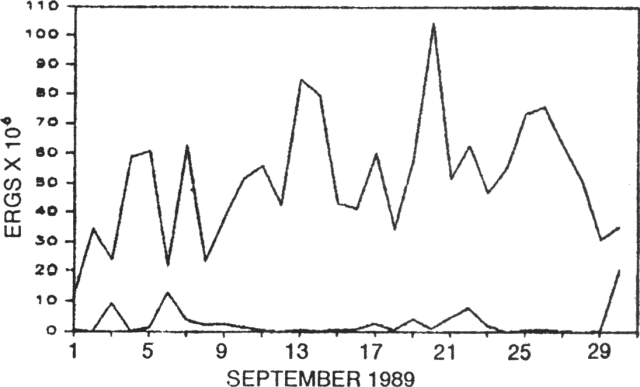 |
Figure 9. Daily energy release of high-frequency (upper curve) and low-frequency (lower curve) seismic events at Galeras, 1-30 September 1989. Courtesy of OVP. |
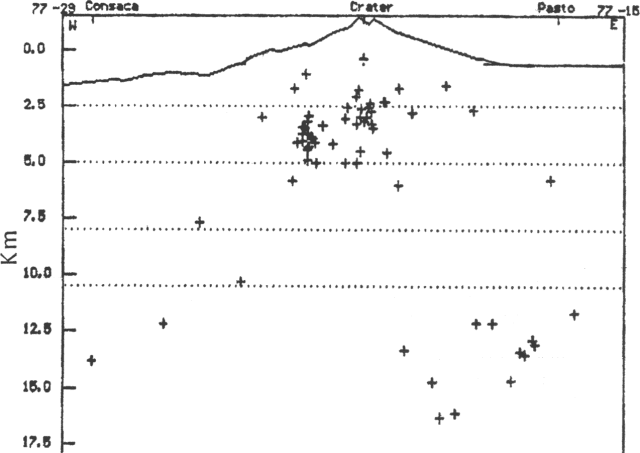 |
Figure 10. E-W cross-section of Galeras showing focal depths of 66 September earthquakes. Courtesy of OVP. |
Information Contacts: INGEOMINAS, Pasto.
Seismic activity remains strong; high SO2
Seismicity remained stable during October, except for a brief decline at mid-month. Low-frequency events averaged ~40/day, while high-frequency events averaged 6/day, with 31 recorded on the 24th (figure 11). About 13 pulses of spasmodic tremor were recorded each day over nearly continuous background tremor.
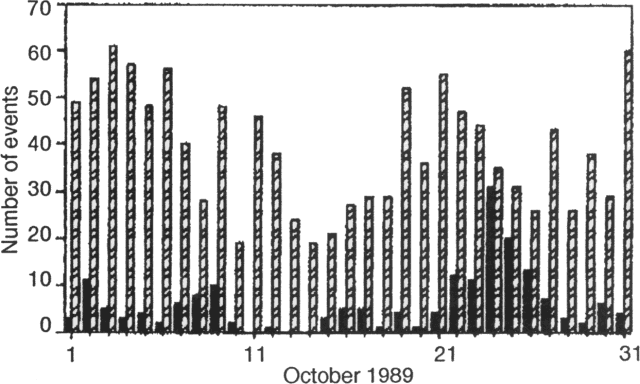 |
Figure 11. Daily number of low-frequency (cross-hatched bars) and high-frequency (solid bars) events at Galeras, October 1989. Courtesy of the Observatorio Vulcanológico de Colombia. |
Aerial and field inspections showed little change in fumarolic emissions from previous months. The most active area, on the SW slope of the central cone, was surrounded by abundant sulfur deposits and emitted high-temperature gases. Incandescence was periodically observed. During the last week of October, SO2 emissions were the highest since COSPEC monitoring began in April 1988 (figure 12). Although electronic tilt varied slightly, EDM and dry tilt measurements showed no significant changes.
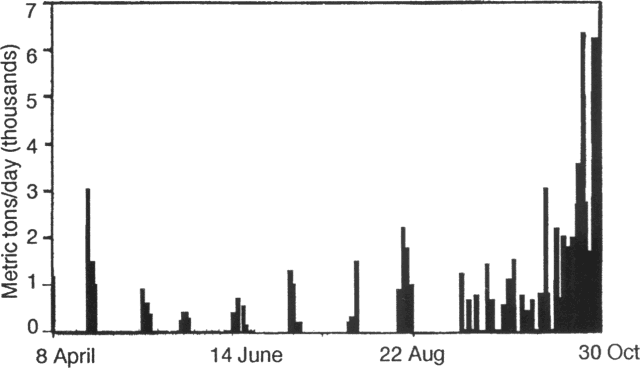 |
Figure 12. Daily rates of SO2 emissions (in metric tons/day) measured by COSPEC at Galeras, 5 April-October 1989. Courtesy of the Observatorio Vulcanológico de Colombia. |
Information Contacts: C. Carvajal, INGEOMINAS, Pasto.
Slight decrease in SO2 emissions; night glow; seismicity
Overflights and fieldwork showed changes in the resurgent cone's activity during November. Linear zones of orange and light-yellow incandescence on the inner wall of the cone's W slope were observed on the night of 29 November, concentrated along radial and tangential fractures reported 10 September. A semicircular area of glow extended from the bottom of the crater to the top of the W wall. The sound produced by escaping gases had diminished ~30% since October. The Las Deformes fumaroles, ~50 m from the crater on the upper SSW flank (number 3 on figure 8), had increased in size and had deposited a thick crust of sulfur. Their measured temperature during the past 3 months ranged from 190 to 239°C.
SO2 flux measured by COSPEC had increased sharply in late October, exceeding 6,000 t/d during the last week in the month. Rates declined in November, remaining above 3,000 t/d until the 20th, then dropping below 1,700 t/d for the rest of the month.
Moderate seismicity was concentrated under the SW flank of the resurgent cone (2-4 km depths) and W of the cone (2.5-5 km depth) (figure 13), varying somewhat in number and magnitude. Tremor associated with surficial hydrothermal processes remained stable. There were no significant changes in the deformation measurements (EDM, dry tilt, and levelling vectors). Electronic tiltmeters continued to register variations that did not correlate with other parameters.
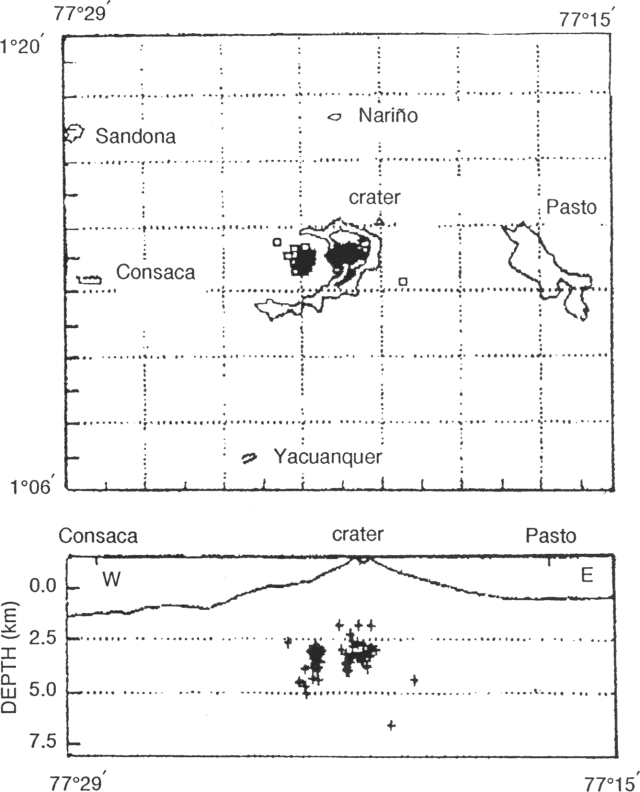 |
Figure 13. Epicenter map (top) and E-W cross section (bottom) showing focal depths of 56 seismic events near Galeras, November 1989. No hypocenters are below 7.5 km. Courtesy of INGEOMINAS. |
Information Contacts: INGEOMINAS, Pasto; INGEOMINAS, Manizales.
Ash emission and increased seismicity; earthquake swarm 3-5 km W of the crater
The number of high- and low-frequency earthquakes increased in January (see figure 18). Pulses of spasmodic tremor accompanied ash emission on the 7th. A swarm of high-frequency events occurred W of the crater at depths of 3-5 km on the 10th (figure 14). The electronic tiltmeter showed an increase of 3 µrad on 26 January, coinciding with an M 2 earthquake beneath the tiltmeter station. Gas emission was not measured in January.
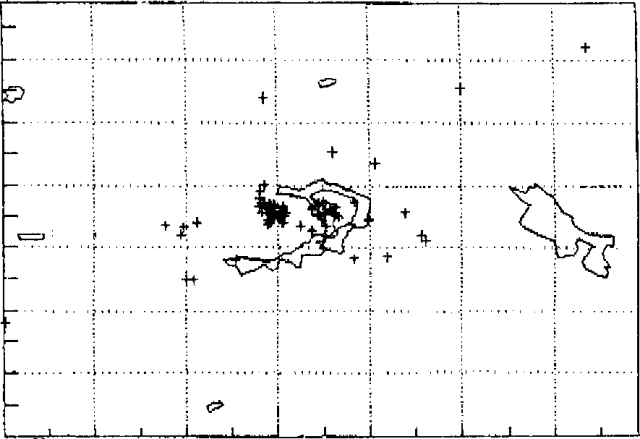 |
Figure 14. Epicenters of 95 seismic events near Galeras, January 1990. Courtesy of INGEOMINAS. |
Information Contacts: INGEOMINAS, Pasto; INGEOMINAS, Manizales.
Small ash emissions associated with tremor; moderate seismicity
Seismicity was at low-moderate levels in February, although substantial seismic energy was released by high-frequency events. The earthquakes were concentrated 2.5 km W of, and beneath the summit crater at 2.5-5.0 km depths (figures 15 and 16). Ash emissions were associated with spasmodic tremor on 3, 8, and 27 February. SO2 emissions reached 5,374 t/d on 10 February, the highest value measured since late October.
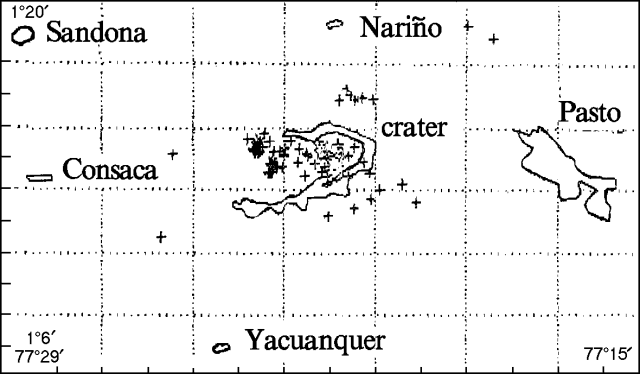 |
Figure 15. Epicenters of 92 high-frequency earthquakes at Galeras, February 1990. Courtesy of INGEOMINAS. |
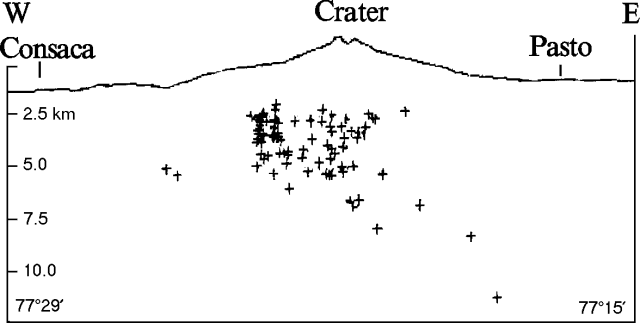 |
Figure 16. E-W cross-section at Galeras, showing focal depths of the 92 high-frequency earthquakes in figure 15. Courtesy of INGEOMINAS. |
Information Contacts: INGEOMINAS, Pasto.
Small phreatic ash emissions with spasmodic tremor and long-period seismicity
Small phreatic ash emissions continued in March, accompanied by spasmodic tremor and long-period seismicity (table 2). Incandescence was mainly observed in the W part of the crater. The number of low-frequency earthquakes increased 47% relative to February values, with an 86% increase in seismic energy release. However, the number of high-frequency events decreased 38% from February and energy release declined 28% (figures 17 and 18). Most earthquakes were centered in two zones under, W of, and S of the summit (figure 19). SO2 emissions measured on 15 and 22 March by COSPEC were at low-moderate levels, ranging from 630 to 1,380 t/d.
Table 2. Phreatic ash emissions and associated seismicity at Galeras, March 1990. Courtesy of INGEOMINAS.
| Date | Time | Seismic Signal |
| 09 Mar 1990 | 0233 | Spasmodic tremor |
| 11 Mar 1990 | 1448 | Spasmodic tremor |
| 11 Mar 1990 | 1618 | Spasmodic tremor |
| 11 Mar 1990 | 1652 | Long-period |
| 11 Mar 1990 | 2036 | Spasmodic tremor |
| 17 Mar 1990 | 1817 | Long-period |
| 17 Mar 1990 | 1921 | Spasmodic tremor |
| 18 Mar 1990 | 0631 | Spasmodic tremor |
| 27 Mar 1990 | 0609 | Long-period |
| 27 Mar 1990 | 1552 | Spasmodic tremor |
| 28 Mar 1990 | 1359 | Spasmodic tremor |
| 29 Mar 1990 | 0948 | Spasmodic tremor |
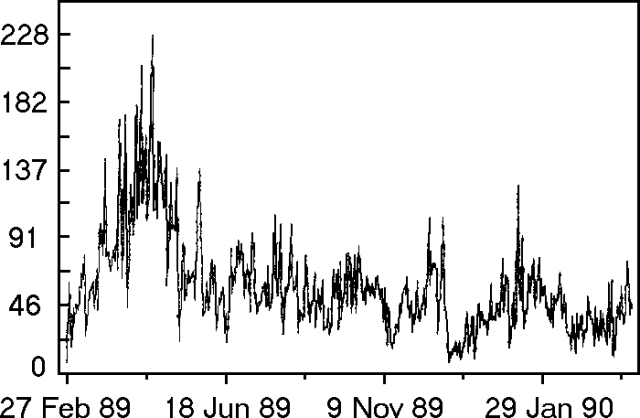 |
Figure 17. Number of seismic events at Galeras, February 1989-March 1990. Courtesy of INGEOMINAS. |
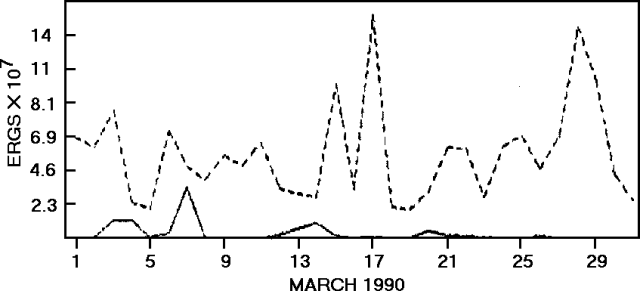 |
Figure 18. Daily energy release of high-frequency (dashed line) and low-frequency (solid line) seismicity at Galeras, March 1990. Courtesy of INGEOMINAS. |
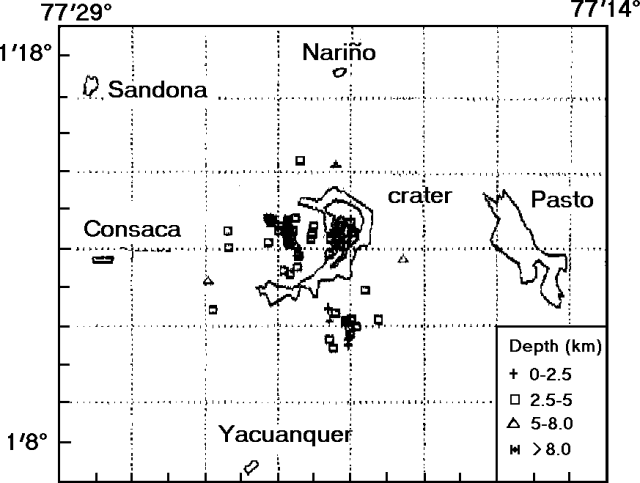 |
Figure 19. Epicenters of 67 seismic events at Galeras, March 1990. Courtesy of INGEOMINAS. |
Information Contacts: INGEOMINAS-OVP.
Phreatic ash emission ends; earthquakes smaller but more frequent
Small phreatic ash emissions were frequent through March, but the last episode was recorded on the 29th (table 2), and none were detected in April. Incandescence continued in April, mainly from the SE part of the crater, which showed changes in morphology, fumarolic activity, and temperature.
The number of seismic events increased 21% in April (to 1,343 low-frequency and 154 high-frequency earthquakes) from March values, but energy release declined 17% in April, to 1.48 x 10⁸ and 7.49 x 10⁷ ergs for high- and low-frequency shocks respectively. The month's largest earthquake reached M 2. Long-period events and tremor bursts decreased in both number and maximum reduced displacement. Continuous tremor remained at very low levels and showed no changes in characteristics. Most high-frequency earthquakes were centered in one of two main source regions, W of the active crater at 2-6 km depth, or SSE of the crater at 2-4 km depth. Two peaks in seismicity were noted. On 4 April, 47 high-frequency earthquakes were recorded, and on the 24th there were 115 low-frequency shocks, 83 long-period events, and 16 bursts of spasmodic tremor.
Deformation data showed no significant changes. Twelve COSPEC measurements of SO2 emission yielded rates of 961-4,078 t/d, with a mean of 2,146 t/d (calculated using measured wind speeds). Maximum and minimum values occurred on 14 and 16 April respectively.
Information Contacts: INGEOMINAS-OVP.
Earthquake swarm but no ash emissions
Activity was at a low level during May, with no observed ash emissions or morphologic changes in the crater. A high-frequency earthquake swarm occurred on 4-5 May with magnitudes <=2.2. On 27 May, 3 June, and 6 June, single high-frequency earthquakes felt by flank residents had magnitudes of 3.0, 3.05, and 3.2 respectively, and depths ranging between 2.5 and 6.0 km. The swarm events and the felt earthquakes were centered 2 km W of the crater, one of the loci of seismic activity during April (15:4). The number and intensity of low-frequency earthquakes and tremor remained at normal levels. No significant changes in ground deformation were recorded.
Information Contacts: INGEOMINAS-OVP.
Three small ash emissions; high-frequency seismicity and gas pressure decrease
Three small ash emissions, the first reported since March, occurred 11, 21, and 27 July. The volcano remained in a state of high fumarolic activity during June and July, although a slight decrease in gas pressure was noted. Incandescence continued to be visible on the W wall of the inner crater, the location of the principal fumaroles. Fumaroles were also located within the crater to the SW, and on the upper flanks of the cone (Las Deformes to the S and La Calvache to the SW). Analyses showed a magmatic content for Las Deformes gases and a more varied, dilute content for La Calvache. The SO2 flux measured by COSPEC was moderate during the single June measurement, ~1,800 t/d, and in July, ~1,400-2,700 t/d.
The number of recorded low-frequency and long-period earthquakes decreased slightly in June (1,085, down from 1,313 in May) then rose again in July (1,468; figure 20). The cumulative energy output of these events reached 1.5 x 10⁹ ergs in July. The number of high-frequency earthquakes continued to decrease, from 121 in May, to 113 in June, and 65 in July (figure 20); energy output fluctuated (9.95 x 10⁷, 2.11 x 10⁸, and 1.1 x 10⁸ ergs during May, June, and July respectively; figure 21). The earthquakes were centered below the crater, generally to the W, with a few to the SSE, at depths of less than 5 km (figure 22). Deep tremor was fairly constant at low intensity and there was an average of 10 pulses of spasmodic tremor/day through June and July (figure 23). The spasmodic tremor had periods of 0.3-0.6 seconds, with a few as high as 1.0 second, in June, and periods of 0.15-0.90 seconds in July.
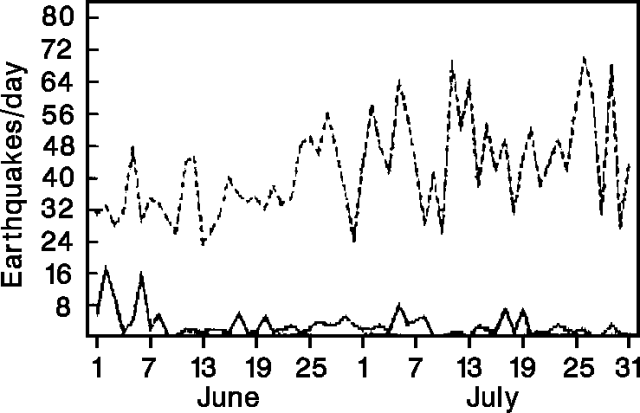 |
Figure 20. Number of earthquakes recorded/day at Galeras, June-July 1990. Lower (solid) line shows high-frequency events and upper (dashed) represents low-frequency and long-period events. Courtesy of INGEOMINAS. |
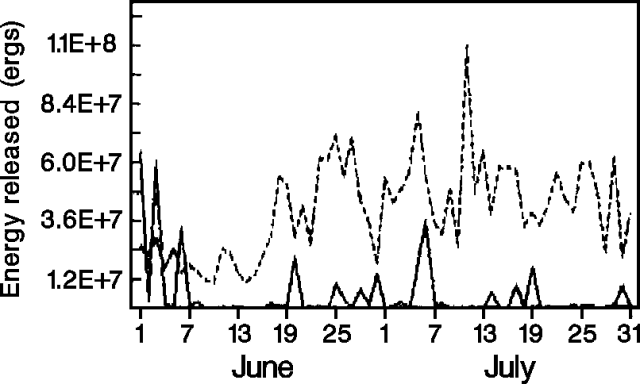 |
Figure 21. Daily energy release of earthquakes recorded at Galeras, June-July 1990. Lines same as on Figure 1. Courtesy of INGEOMINAS. |
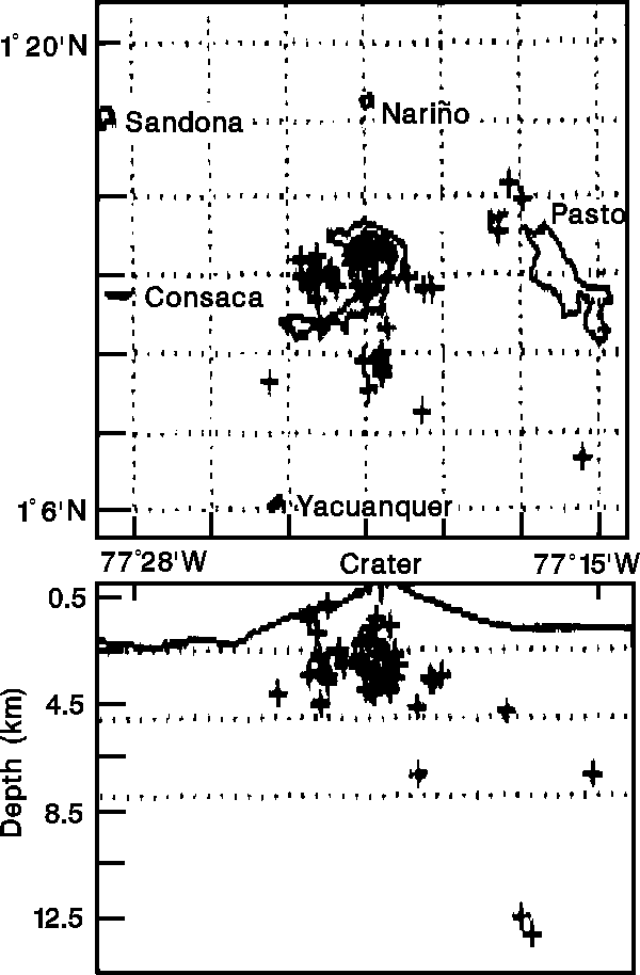 |
Figure 22. Epicenter map (top) and E-W cross-section showing focal depths (bottom) of 45 high-frequency earthquakes recorded at Galeras, July 1990. Courtesy of INGEOMINAS. |
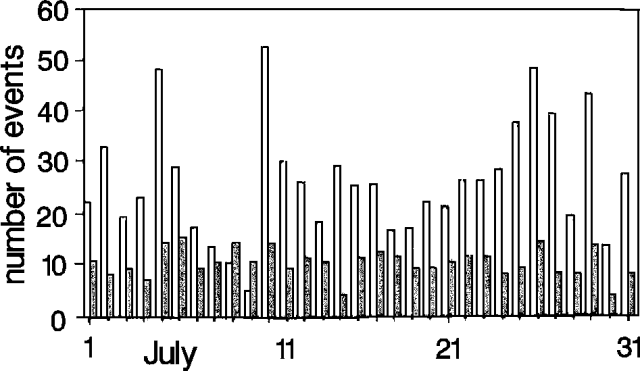 |
Figure 23. Number of long-period earthquakes (open bars) and spasmodic tremor events (shaded bars) at Galeras, July 1990. Courtesy of INGEOMINAS. |
No significant overall deformation was recorded in either June or July, although a period of moderate deformation 10-12 July coincided with the 11 July ash emission and increased numbers of long-period earthquakes. Deformation was measured at both electronic tiltmeters, but was most noticeable ~2 km E of the crater (Peladitos station) where it accumulated 7-8 µrad. The highest SO2 fluxes measured during the month were on 6 and 13 July, surrounding the period of deformation (figure 24).
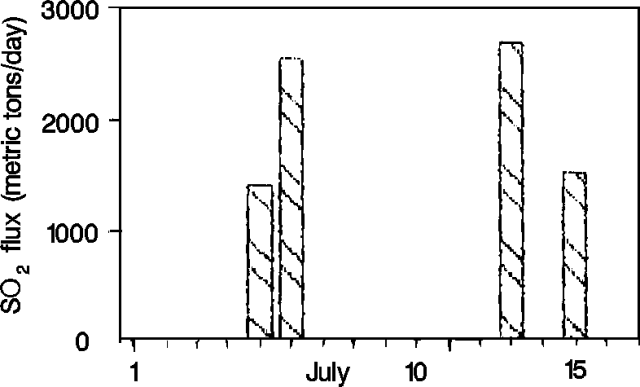 |
Figure 24. SO2 flux measurements at Galeras, July 1990. No data were taken after 15 July. Courtesy of INGEOMINAS. |
Information Contacts: INGEOMINAS-OVP.
Small tephra emissions, perhaps with minor magmatic component; strong seismicity and fumaroles
Ash emissions and geology. Small ash emissions occurred 2 and 15 August. The activity on 2 August was preceded by an increase in the number of long-period earthquakes (figure 25) and accompanied by low-frequency tremor. Explosions ejected blocks as large as 15 cm in diameter up to the S-SW rim of the inner crater, and deposited a 3-4-cm layer of fine gray ash over a tight sector N and W of the crater. Seismic signals and the dispersion of deposits suggested that there could have been as many as three explosive events. S. Williams reported that "close examination of the 2 August ash under the petrographic microscope revealed a small (<1%) component of shiny fresh glass shards and enclosed crystals. The remainder of the deposit was entirely composed of lithic material, crystal fragments, and accessory material. Within the glassy specimens, there appeared to be two different types – one brown and the other (less common) clear. The petrographic characteristics of these shards was consistent with their having been erupted as fresh magmatic material."
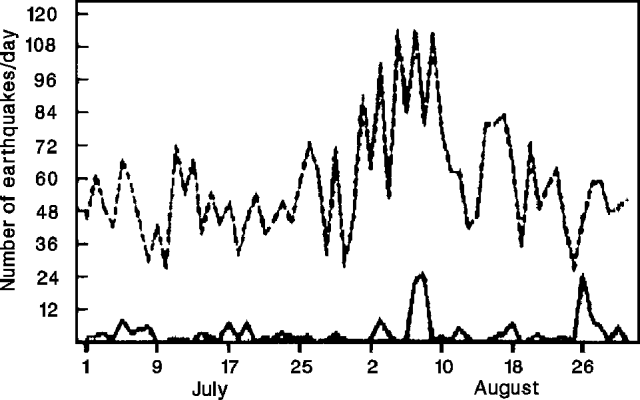 |
Figure 25. Number of earthquakes recorded/day at Galeras, July-August 1990. Lower (solid) line shows high-frequency events and upper (dashed) line represents low-frequency and long-period events. Courtesy of INGEOMINAS. |
The 2 August explosions took place at the "Las Portillas" fumarolic area at the W wall within the inner crater. An increase in size of the fumaroles was noted.
Seismic activity. Long-period earthquakes increased in number during August, to the highest level since the initiation of monitoring at the volcano. Frequencies of the long-period events ranged from 1.25 to 1.67 Hz. Some were monochromatic and others alternated with high frequencies. Occasionally, they were linked to low-frequency tremor signals. The majority of the tremor episodes were of low frequency, with less frequent spasmodic tremor; signals often had poorly defined forms. Tremor episodes were associated with ash emissions on 2 and 15 August, and had up to 16 cm2 of reduced displacement (2 August).
High-frequency earthquakes were concentrated W of the crater at 2-5 km depth; others were located to the SE at similar depths (figure 26). A M 3.6 earthquake (the largest yet recorded at Galeras) occurred on 30 August, 4 km SE of the crater and at close to 4 km depth. A number of dynamic parameters of the high-frequency sources were determined: seismic momentum ranged from 1018-1021 dyne-cm with an average of 1020 dyne-cm, fault longitudes ranged from 125 to 325 m with an average of 200 m, fault dislocations and stress drop ranged from 0.1 cm and 1.5 bars (respectively) for an M 1.2 earthquake to 58.3 cm and 796 bars for an M 2.2 earthquake.
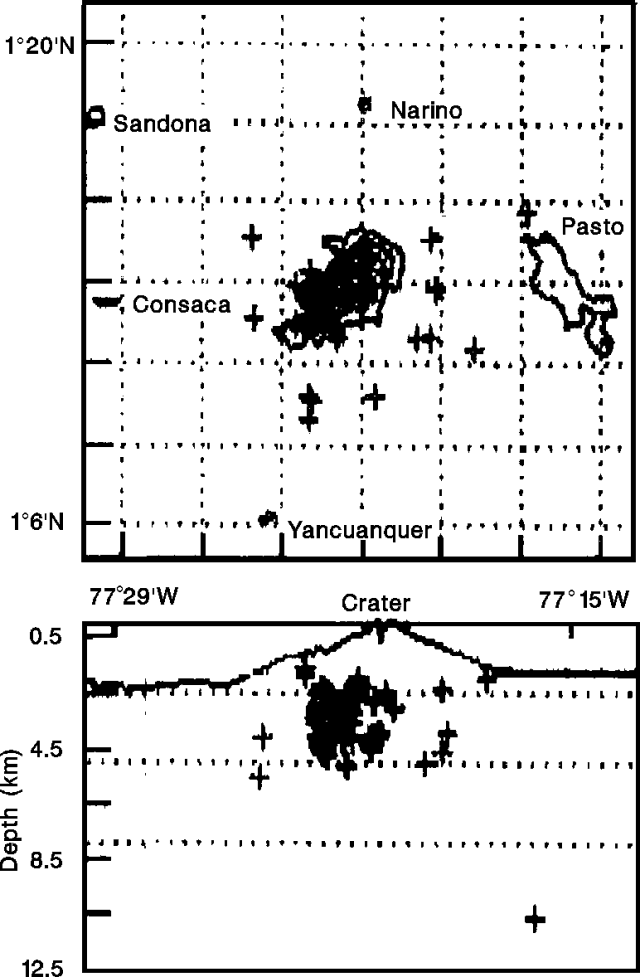 |
Figure 26. Epicenter map (top) and E-W cross-section showing focal depths (bottom) of 76 high-frequency earthquakes recorded at Galeras, August 1990. Courtesy of INGEOMINAS. |
Deformation. There were no significant changes in deformation, with the exception of peaks noted 2 km E of the crater (Peladitos EDM station) on 17 and 19 August. No clear relationship with seismicity was evident.
Gas geochemistry. The SO2 flux, as measured by COSPEC, fluctuated between 1,343 and 3,023 t/d during 10 measurements in August. The following is a report by S. Williams.
"The Las Deformes fumarole, ~10 m outside of the S lip of the inner crater, appeared to be roughly 25% larger than it was when visited in December 1989. Temperatures as high as 243°C were measured, where the maximum in December was 225°C. The fumarole had a very high-pressure noisy output of gas, with a very high SO2 content. Sublimate minerals within the highest temperature zones of the fumarole were black shiny crystals. Unfortunately, none were successfully collected. The Calvache fumaroles, NE of the crater, had maximum temperatures of 88°C, unchanged from December 1989. Increased activity was noted around the Calvache fumaroles. Giggenbach-type samples were collected from both fumaroles and condensate was collected at Las Deformes. The inner crater fumaroles could not be approached closely, due to the large volumes of gas and poor visibility. Their overall appearance was consistent with significantly higher temperatures (>500°C?) than encountered outside of the crater. At Pandiaco hot spring at the E foot of the volcano (in Pasto) the pH was 6.1 and temperature was 30°C, unchanged from December 1989 and April 1988 (when the site was first visited).
"A mudflow occurred on 28 April, apparently triggered by a heavy rain with no relation to eruptive activity. The flow swept down the river draining Galeras on its breached W side and went past Consacá (10 km W of the crater), to the Río Guitara. At the bridge just above Consacá, the mudflow scoured up to 5 m above the normal banks.
"Galeras is still in a very (and perhaps increasingly) active state, dominated by magmatic processes."
Information Contacts: INGEOMINAS-OVP; S. Williams, Louisiana State Univ.
Fissure opens in crater; ash emissions; many intense A-type earthquakes
An E-W-trending fissure with intense and audible gas emission formed in the W sector of the main crater. The fissure was 12 m long with 130°C fumaroles when first noted at the beginning of September, but grew to 36 m in length with 738°C fumaroles by the end of the month. Sulfur deposits and incandescence were visible. Gas analyses of pre-existing fumaroles revealed a relative decrease in the concentration of sulfur species and an increase in CO2. The fumaroles in the SW sector had a strong magmatic component, while the N fumaroles were predominantly hydrothermal.
Ash emissions occurred on 2, 11, and 24 September and were accompanied by near-simultaneous (within 10-40 seconds) long-period earthquakes or tremor episodes. The number and intensity of long-period earthquakes gradually decreased following a minor peak in early August (15:8 and figure 27). These events, occasionally linked to tremor episodes, were shallow (<2.0 km depth) and centered beneath to slightly NW of the crater.
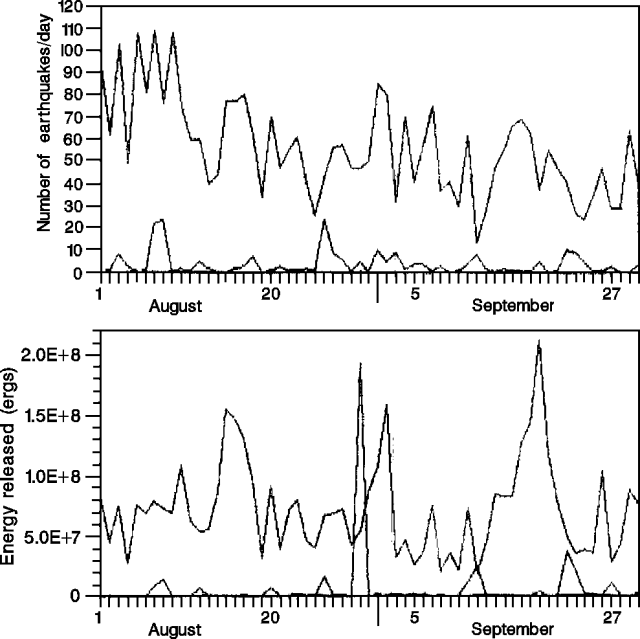 |
Figure 27. Seismicity at Galeras, August-September 1990. The lower line shows high-frequency events, the upper line low-frequency and long-period activity. Courtesy of INGEOMINAS. |
There were a large number of intense high-frequency earthquakes, several felt, during September. The earthquakes were concentrated in two focal areas, one W of the crater, the other 2-4 km E (depths of 2.5-7.0 km; figure 28). Magnitude 2.7 and 2.8 events occurred at the E focus on 11 and 12 September, respectively. The E focus was also the site of a swarm of 8 high-frequency earthquakes (M 1.8-2.5) during a 1.5-hour period 22 September, and a M 3.6 earthquake on 30 August.
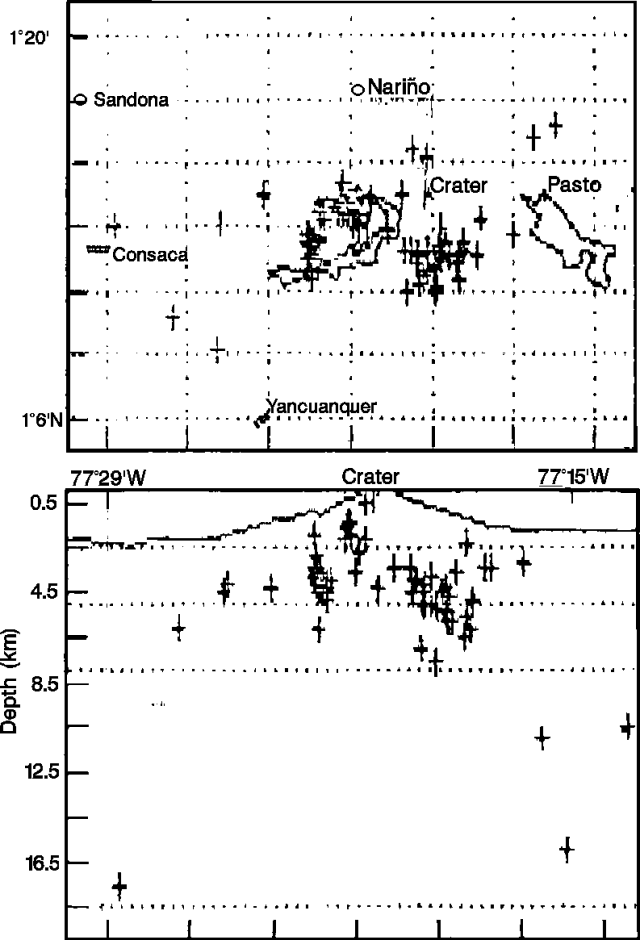 |
Figure 28. Epicenter map (top) and E-W cross-section showing focal depths (bottom) of 75 high-frequency earthquakes recorded at Galeras, September 1990. Courtesy of INGEOMINAS. |
Deformation measurements during September did not show any significant changes. Dry tilt data showed low levels of deformation with a slight inflationary trend. Periodic changes of 2-6 µrad were recorded by EDM, coincident with increases in seismicity on 4, 9, 12, and 22 September.
Information Contacts: INGEOMINAS-OVP.
Ash emitted; seismicity declines slightly
Seismicity decreased slightly during October. One high-frequency earthquake (M 2.8) was felt in Pasto (10 km E) on 5 October. Earthquakes were centered in distinct zones: under, NE, and E of the crater. Low-frequency earthquakes remained at low levels of occurrence and energy. Spasmodic tremor was variable, and was associated with ash emissions on 17 and 18 October.
Deformation measurements showed little change, although dry tiltmeters continued to show low levels of deformation with an inflationary trend. Electronic tilt 2 km E of the crater (Peladitos station) showed changes of 1-8 Nrad.
The SO2 flux, measured by COSPEC, decreased slightly from 2,378 t/d on 1 October, to 1,994 t/d at the end of the month.
Information Contacts: INGEOMINAS-OVP.
Blocks and lapilli ejected; new vents and additional ash emissions
Lapilli and blocks were deposited on the crater rim during ash emissions on 25 November. Preliminary analysis of the ash seemed to indicate the presence of fresh glass. Numerous episodes of spasmodic tremor were associated with the emissions.
The ash emissions followed an increase in the number and size of long-period earthquakes that began on 20 November, and a swarm of 35 high-frequency earthquakes on 24 November. Epicenters were W of the crater. Low-frequency spasmodic tremor was also recorded. On 28 and 29 November, after the emission, there was a variation in the amplitude and period of the deep tremor. Landslides on the W wall of the crater coincided with the appearance of new vents in the crater wall that emitted gases and ash. Incandescence was observed at the vents throughout December and temperatures of 550-570°C were measured. A fissure with new vents had previously appeared on the W sector in September. Analyses of gas samples from fumaroles in the N and SW sectors of the cone indicated a increase in the concentration of CO2, and a corresponding increase in SO2. Temperatures of 250-265°C were measured at fumaroles in the SW sector.
Seismicity remained at high levels through December, and began to decline in early January. The long-period earthquakes were often associated with small ash emissions that continued into January.
Information Contacts: INGEOMINAS-OVP.
Some seismicity stronger; minor deformation; fumarole data
Low-frequency earthquakes were stronger (as measured by reduced displacement; figure 29) and more numerous during January. A slight increase in energy released by high-frequency earthquakes was also recorded. The high-frequency events were located around the crater and to the SE (figure 30), at depths of 1.7-4.1 km. Long-period events and tremor activity decreased.
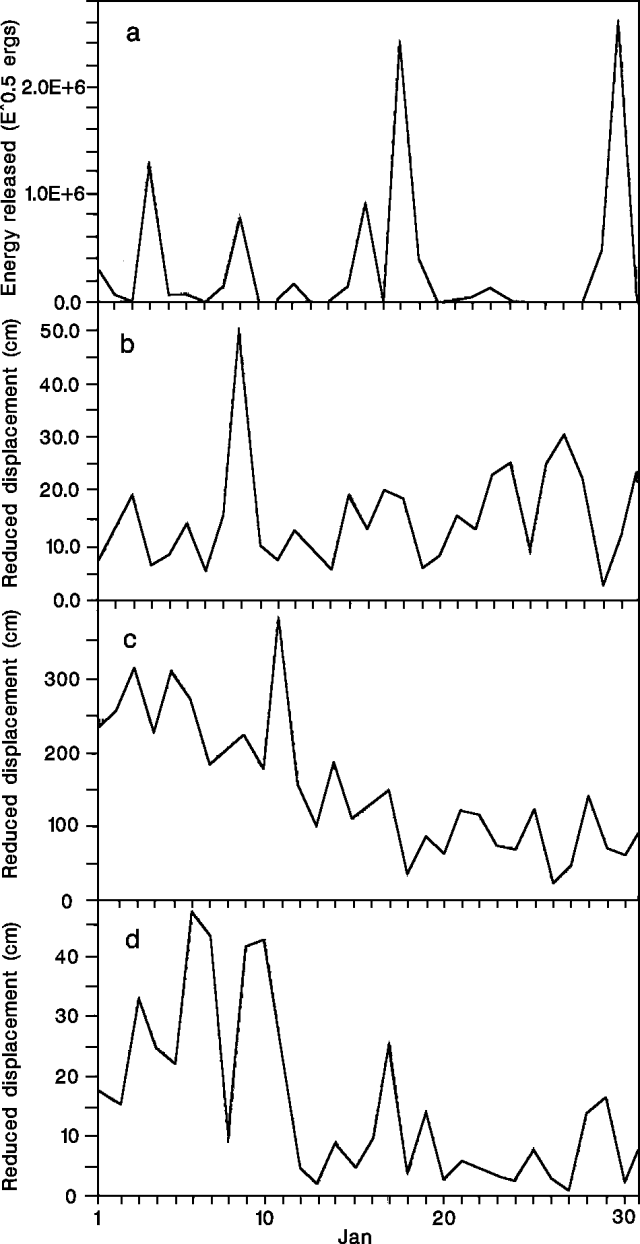 |
Figure 29. Daily released energy of high-frequency earthquakes (a), and daily reduced displacement of: low-frequency earthquakes (b), long-period earthquakes (c), and tremor pulses (d) at Galeras, January 1991. Courtesy of INGEOMINAS. |
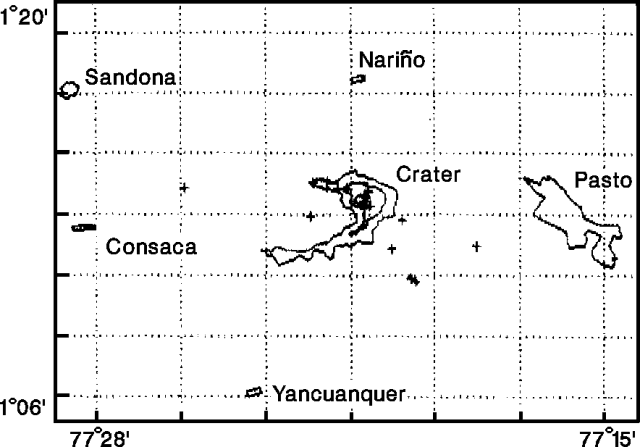 |
Figure 30. Epicenters of 13 high-frequency earthquakes at Galeras, January 1991. Courtesy of INGEOMINAS. |
Dry tilt and level-line measurements showed small variations in deformation during January. The tangential component of the Crater station tiltmeter recorded steady inflation, with a total increase of 9 µrad during the month. A tiltmeter 2 km E of the crater (Peladitos) recorded inflation between 12 and 24 January (14 µrad radial and 12 µrad tangential), and rapid deflation on 24 January (figure 31).
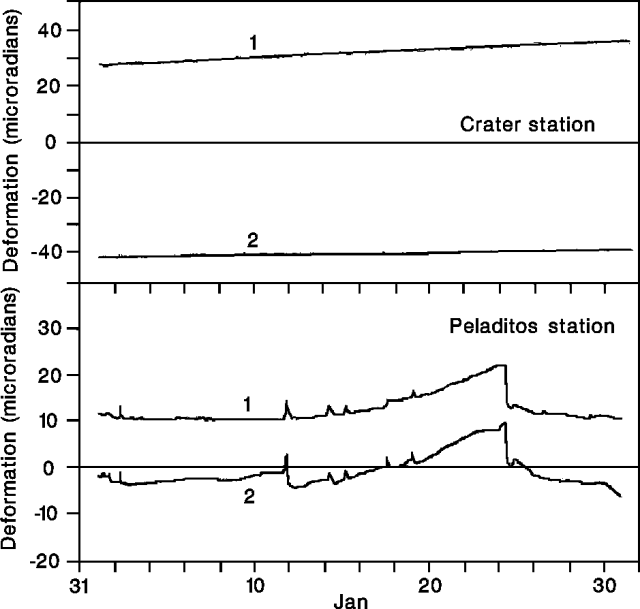 |
Figure 31. Radial (1) and tangential (2) deformation at Peladitos station tiltmeter, 2 km E of the active crater at Galeras, January 1991. Courtesy of INGEOMINAS. |
The January SO2 flux, measured by COSPEC, was moderate, and temperatures at Calvache and Deformes fumaroles (figure 32) remained stable with respect to December measurements (table 3). A small increase in temperature was measured at the incandescent Besolima fumaroles, located in the W-sector fissure that opened in early September 1990.
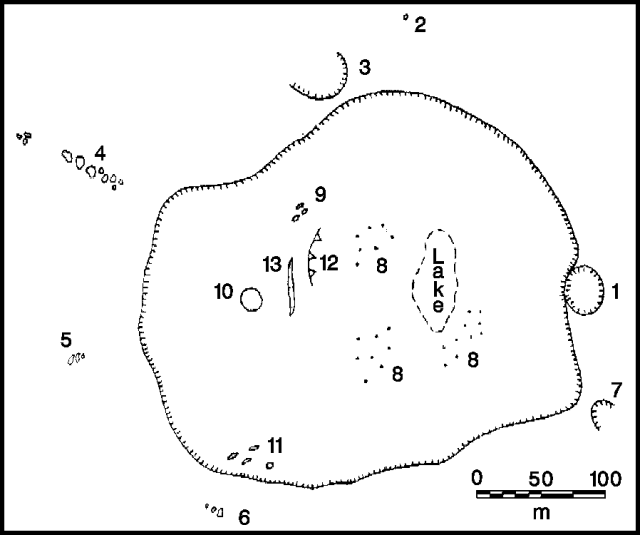 |
Figure 32. Sketch of the active crater at Galeras, January 1991, showing the locations of fumaroles and major morphologic features. See table 3 for fumarole names. Fumarole 7 is unnamed. 12 – zone of collapse, 13 – fissure. Courtesy of INGEOMINAS. |
Table 3. Fumarole activity (visual estimate of emission rate) and temperature ranges measured by thermocouple in accessible vents at Galeras, January 1991. Numbers correspond to locations shown in figure 32.
| Fumarole | Name | Dec 1989 | Aug 1990 | Sep 1990 | Dec 1990 | Jan 1991 | Jan 1991 Activity |
| 1 | El Pinta | -- | -- | -- | -- | very low | |
| 2 | Calvache | 88°C | 88°C | -- | -- | 88-92°C | low to moderate |
| 3 | El Paisita | -- | -- | -- | -- | 70-80°C | very low |
| 4 | Besolima | -- | -- | 738°C | 550-575°C | 520-738°C | very high (incandescence) |
| 5 | Chaves | -- | -- | -- | -- | 90-102°C | moderate |
| 6 | Deformes | 243°C | 243°C | -- | 250-265°C | 250-265°C | high |
| 8 | Campo Fumarlico | -- | -- | -- | -- | -- | high |
| 9 | Bernardo | -- | -- | -- | -- | -- | very high (incandescence) |
| 10 | Portillas | -- | -- | -- | -- | -- | very high (incandescence) |
| 11 | Campo Joyeria | -- | -- | -- | -- | -- | very high (incandescence) |
Information Contacts: INGEOMINAS-OVP.
Ash emissions and incandescence; more frequent earthquakes
Three ash emissions and an increase in the level of incandescence were reported during February (table 4). Temperatures measured at Besolima fissure oscillated between 521 and 538°C (down from 738°C during January), while Las Deformes fumarole field had a maximum temperature of 262°C (similar to January, 250-265°C). SO2 fluxes, measured by COSPEC the last 4 days of the month, showed a steady decrease from 1,342 t/d (25 February) to 275 t/d (28 February).
Table 4. Reported activity and associated seismicity at Galeras, February 1991. Courtesy of INGEOMINAS.
| Date | Activity | Associated seismicity/duration |
| 10 Feb 1991 | Incandescence | -- |
| 10 Feb 1991 | Ash emission | Long-period / 40 seconds |
| 14 Feb 1991 | Ash emission and high noise level | Tremor / 100 seconds |
| 18 Feb 1991 | Ash emission | Long-period / 50 seconds |
| 19 Feb 1991 | Incandescence | -- |
| 21 Feb 1991 | Incandescence | -- |
During February, 42 high-frequency earthquakes were recorded, of which 27 were M 1.1-2.3. The earthquakes were centered on the W flank of the volcano (figure 33). The number of low-frequency earthquakes (figure 34) increased 45% compared to January. Long-period seismicity remained at moderate levels, similar to the last half of January.
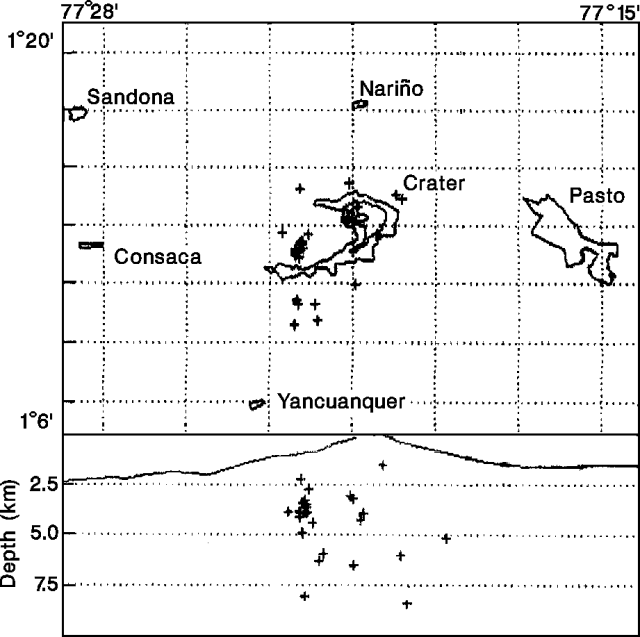 |
Figure 33. Epicenter map (top) and E-W cross-section showing focal depths (bottom) of 27 high-frequency earthquakes recorded at Galeras, February 1991. Courtesy of INGEOMINAS. |
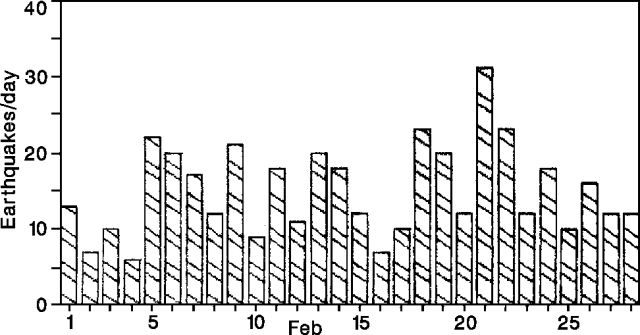 |
Figure 34. Daily number of low-frequency earthquakes recorded at Galeras, February 1991. Courtesy of INGEOMINAS. |
Information Contacts: INGEOMINAS-OVP.
Frequent ash emissions; slight inflation
Ash emissions, accompanied by tremor episodes and long-period earthquakes, were frequent in March. Occasional lapilli accumulations were noted around the vents. Incandescence continued to be visible on the inner W wall of the crater, and the Portillas fumarole increased notably in diameter. Fissures and loose material made the crater wall appear gravitationally unstable. Outside of the crater, Besolima fissure fumarole temperatures declined from 538°C in February to 514°C in March; temperatures of 738°C were recorded in September, shortly after the fissure opened. The SO2 flux, measured by COSPEC, ranged from 450 to 1,647 t/d during the first week of March.
The number of long period earthquakes ranged between 30 and 90/day, while high-frequency seismicity decreased in March. At the end of March, a large increase in the number of tremor episodes was recorded (figure 35). Inflation continued to be recorded 0.9 km E of the main crater (at the "Crater" electronic tiltmeter), totalling 70 µrad since September.
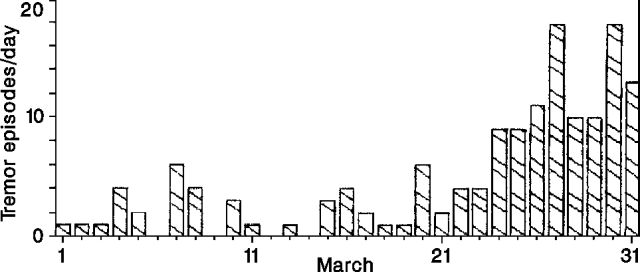 |
Figure 35. Daily number of tremor episodes recorded at Galeras, March 1991. Courtesy of INGEOMINAS. |
Information Contacts: INGEOMINAS-OVP.
Frequent ash emission and seismicity
Following the pattern begun in March, activity continued to increase during April, when ash emissions from the main crater and associated seismicity were very frequent (table 5). Fieldwork revealed new fissures and vents on the crater's W wall, increases in the area of incandescence, and slumping of loose material. Analyses of gas samples from Deformes and Besolima fissure fumaroles suggest an increasingly magmatic composition. At Calvache fumarole, the ratio of CO2/SO2 has increased steadily (figure 36), while H2S and HCl have shown no significant variations. Besolima fissure fumarole temperatures continued to decline, from 514°C in March to 468°C on 2 April.
Table 5. Eruptive activity and associated seismicity at Galeras, 1-19 April 1991. Atmospheric conditions prevented direct observations 20-30 April. "Inc" means increased, column heights are in meters, and durations are in seconds.
| Date | Time | Activity | Column height | Signal Type | Signal Duration |
| 01 Apr 1991 | 0640 | Ash emission | -- | Long-period | 34 s |
| 01 Apr 1991 | 0905 | Inc sulfur odor | -- | Tremor | 1800 s |
| 02 Apr 1991 | 0620 | Inc column size | 300 m | Tremor | 159 s |
| 02 Apr 1991 | 0711 | Ash emission | 900 m | Tremor | 275 s |
| 02 Apr 1991 | 1014 | Ash emission | -- | Tremor | 116 s |
| 02 Apr 1991 | 1029 | Ash emission | -- | Long-period | 42 s |
| 03 Apr 1991 | 0741 | Ash emission | -- | Tremor | 89 s |
| 05 Apr 1991 | 0500 | Inc noise | -- | Tremor | 475 s |
| 06 Apr 1991 | 0002 | Inc incandescence | -- | Tremor | 182 s |
| 07 Apr 1991 | 1757 | Ash emission | 700 m | Long-period | 52 s |
| 07 Apr 1991 | 1823 | Ash emission | 500 m | Tremor | 140 s |
| 08 Apr 1991 | 1717 | Ash emission | -- | Tremor | 135 s |
| 09 Apr 1991 | 1827 | Ash emission | 400 m | Tremor | 130 s |
| 10 Apr 1991 | 0608 | Ash emission | 1100 m | Tremor | 89 s |
| 10 Apr 1991 | 0644 | Ash emission | 200 m | Tremor | 71 s |
| 10 Apr 1991 | 1010 | Ash emission | 700 m | Tremor | 230 s |
| 10 Apr 1991 | 1643 | Inc noise | -- | Tremor | 110 s |
| 10 Apr 1991 | 1820 | Ash emission | -- | Long-period | 50 s |
| 10 Apr 1991 | 1820 | Inc noise | -- | Long-period | 61 s |
| 10 Apr 1991 | 1820 | Inc incandescence | -- | Tremor | 165 s |
| 10 Apr 1991 | 1916 | Ash emission | -- | Long-period | 30 s |
| 11 Apr 1991 | 0320 | Ash emission, inc incandescence | -- | Tremor | 170 s |
| 11 Apr 1991 | 0324 | Ash emission | -- | Long-period | 17 s |
| 11 Apr 1991 | 0324 | Inc incandescence | -- | Long-period | 29 s |
| 11 Apr 1991 | 0605 | Ash emission | 200 m | Long-period | 44 s |
| 11 Apr 1991 | 0611 | Ash emission | 400 m | Long-period | 58 s |
| 11 Apr 1991 | 1508 | Ash emission | -- | Tremor | 131 s |
| 11 Apr 1991 | 1758 | Ash emission | 1700 m | Tremor | 120 s |
| 11 Apr 1991 | 1836 | Ash emission | 200 m | Long-period | 26 s |
| 11 Apr 1991 | 1841 | Ash emission | 800 m | Tremor | 115 s |
| 12 Apr 1991 | 0806 | Ash emission | -- | Tremor | 295 s |
| 12 Apr 1991 | 0826 | Ash emission | -- | Tremor | 250 s |
| 12 Apr 1991 | 0854 | Ash emission | -- | Long-period | 46 s |
| 13 Apr 1991 | 0359 | Ash emission | -- | Tremor | 625 s |
| 13 Apr 1991 | 0555 | Inc column size | 500 m | Tremor | 260 s |
| 13 Apr 1991 | 0622 | Inc column size | 400 m | Long-period | 20 s |
| 13 Apr 1991 | 0658 | Ash emission | 400 m | Long-period | 50 s |
| 13 Apr 1991 | 0958 | Ash emission, inc noise | -- | Tremor | 91 s |
| 14 Apr 1991 | 0632 | Ash emission | 800 m | Tremor | 83 s |
| 14 Apr 1991 | 0735 | Ash emission | 1100 m | Tremor | 130 s |
| 14 Apr 1991 | 0808 | Ash emission | 700 m | Long-period | 56 s |
| 14 Apr 1991 | 0845 | Ash emission, explosions, inc sulfur odor | 1500 m | Tremor | 179 s |
| 15 Apr 1991 | 0757 | Ash emission | 1500 m | Tremor | 137 s |
| 15 Apr 1991 | 1355 | Ash emission, explosions | -- | Long-period; tremor | 380 s |
| 15 Apr 1991 | 1509 | Ash emission, explosions | -- | Tremor | 82 s |
| 15 Apr 1991 | 1921 | Ash emission, inc incandescence | -- | Tremor | 130 s |
| 16 Apr 1991 | 0559 | Ash emission | -- | Tremor | 111 s |
| 16 Apr 1991 | 0711 | Ash emission | -- | Long-period | 40 s |
| 16 Apr 1991 | 0815 | Ash emission | 800 m | Long-period | 34 s |
| 16 Apr 1991 | 0835 | Ash emission | 1500 m | Tremor | 600 s |
| 16 Apr 1991 | 1004 | Ash emission | 1500 m | Tremor | 171 s |
| 16 Apr 1991 | 1107 | Ash emission | -- | Tremor | 145 s |
| 17 Apr 1991 | 0711 | Ash emission | -- | Long-period | 47 s |
| 17 Apr 1991 | 0740 | Ash emission | -- | Long-period | 57 s |
| 17 Apr 1991 | 0752 | Ash emission | -- | Tremor | 122 s |
| 17 Apr 1991 | 1742 | Ash emission | -- | Tremor | 205 s |
| 17 Apr 1991 | 1802 | Ash emission | -- | Tremor | 370 s |
| 17 Apr 1991 | 1948 | Ash emission | -- | Tremor | 1500 s |
| 18 Apr 1991 | 0706 | Ash emission | -- | Tremor | 190 s |
| 18 Apr 1991 | 0918 | Ash emission | -- | Long-period | 70 s |
| 19 Apr 1991 | 0627 | Ash emission | -- | Long-period | 21 s |
| 19 Apr 1991 | 0728 | Ash emission | -- | Tremor | 76 s |
| 19 Apr 1991 | 0855 | Ash emission | -- | Tremor | 180 s |
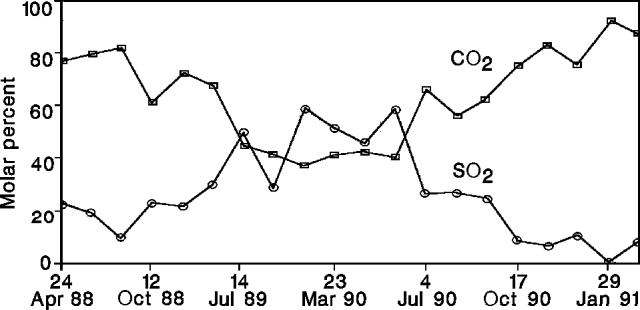 |
Figure 36. Concentration of CO2 (squares) and SO2 (circles) in Calvache fumarole gas at Galeras, April 1988-early April 1991. Courtesy of INGEOMINAS. |
A significant increase in high-frequency seismicity was recorded during the second half of April, including swarms of events on the 18th and 29th. The earthquakes (M<=2.9) were mostly located SSW of the crater at 1-5 km depth (figure 37). Long-period seismicity was at high levels, and the daily reduced displacement on 13 April was the highest recorded since monitoring began in February 1989 (figure 38). The amplitudes and durations of tremor pulses fluctuated; deep tremor and low-frequency, modulating tremor were also recorded.
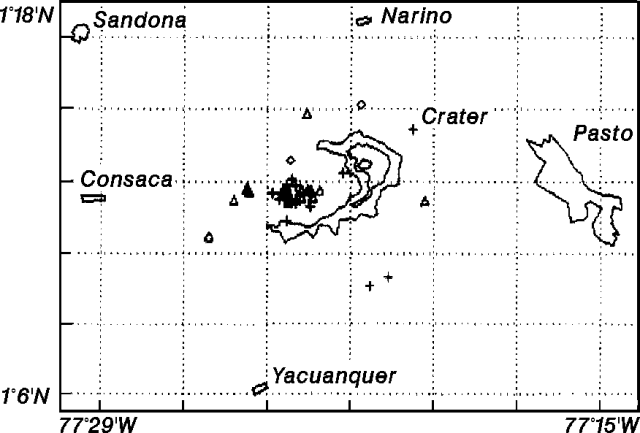 |
Figure 37. Epicenter map of 36 high-frequency earthquakes at Galeras, April 1991. Courtesy of INGEOMINAS. |
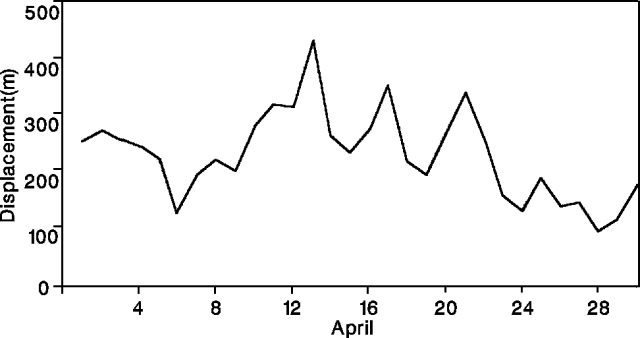 |
Figure 38. Daily reduced displacement of long-period earthquakes at Galeras, April 1991. Courtesy of INGEOMINAS. |
The electronic tiltmeter 0.9 km E of the crater (at "Crater" station) showed continued inflation, with 85 and 48 µrad of accumulated tangential and radial inflation, respectively, since September 1990 (figure 39). Three km E of the crater, dry tilt (El Pintado station) showed very low, but consistent inflation. Geologists interpreted the inflation as volcanic deformation or neotectonic tilt along the Buesaco fault.
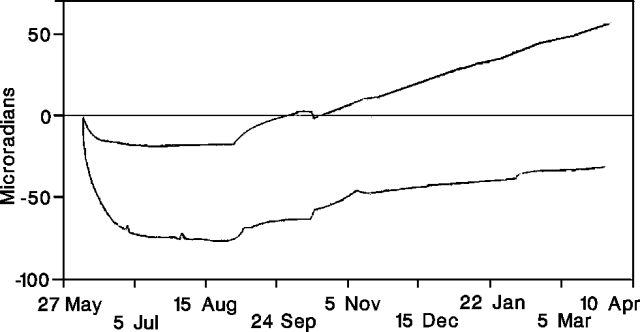 |
Figure 39. Tangential (top curve) and radial (bottom curve) deformation 0.9 km E of the crater ("Crater" electronic tiltmeter) at Galeras, May 1990-April 1991. Courtesy of INGEOMINAS. |
Information Contacts: INGEOMINAS-OVP.
More seismic events but lower energy release; thermal activity remains moderate
The number of seismic events (high-frequency, low-frequency, and long-period) increased during May, while seismic energy release and reduced displacement decreased from April values (figures 40 and 41). The high-frequency activity (M 0.5-1.9) was centered W of the crater at 2-8 km depth. Tremor episodes were less frequent and had lower reduced displacements than in April. The tiltmeter 0.9 km E of the crater (Crater Station) continued to show deformation, with 20 µrad inflation (tangential component) in May, for a total inflation since September of 102 µrad. Other stations showed oscillations or only very low cumulative inflation.
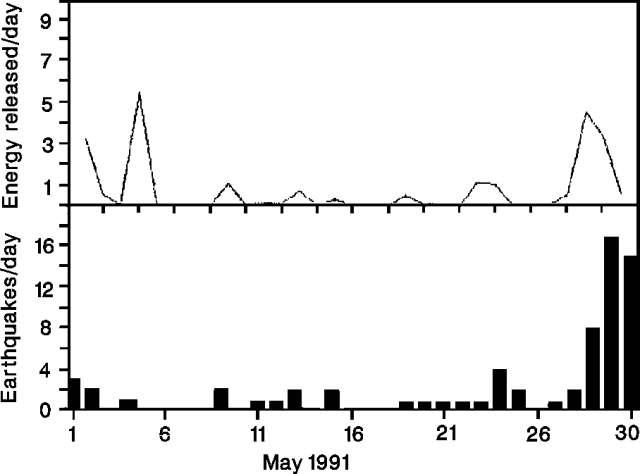 |
Figure 40. Daily number of high-frequency events (bottom) and energy release (top) at Galeras, May 1991. Courtesy of INGEOMINAS. |
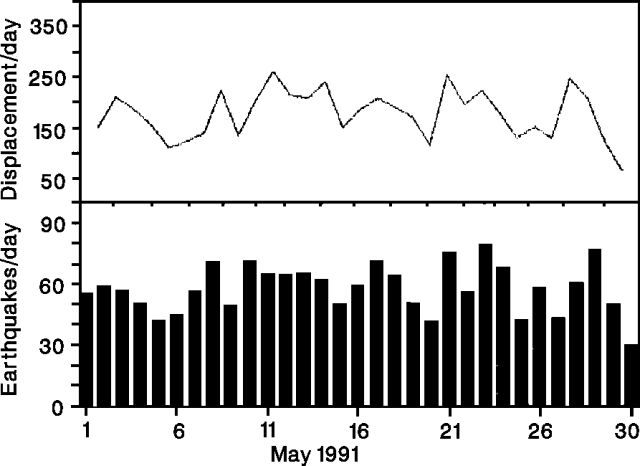 |
Figure 41. Daily number of long-period events (bottom) and reduced displacement (top) at Galeras, May 1991. Courtesy of INGEOMINAS. |
SO2 flux, measured by COSPEC, varied between low and moderate levels. Fumarole temperatures in Besolima fissure continued to decrease (436°C in May compared to 468°C in April), while temperatures remained fairly constant at Deformes (254°C compared to 250-265°C since December 1990) and Calvache (89°C compared to 88-92°C since December 1989).
Information Contacts: INGEOMINAS-OVP.
Frequent tephra emissions; more long-period seismicity; small summit inflation
Frequent ash and lapilli emissions continued in June, as indicated by seismic signals and confirmed by periodic observations during clear weather (2, 17, 18, and 20 June). Gas plumes rose to 800-1,700 m height (1 and 17 June) during periodic pulses of activity. Significant increases in the incandescent area were noted near the crater floor and on the W wall. The SO2 flux fluctuated between low and moderate values.
Fewer low-frequency events but more long-period events were recorded in June than in May. The majority of high-frequency events were centered 6 km E of the crater at 0.9-2.3 km depths. Some tremor episodes and long-period events were associated with ash emissions and increases in plume height. Deformation measurements continued to show low levels of inflation (20 µrad in June) at the "Crater" tiltmeter, . . . .
Information Contacts: INGEOMINAS-OVP.
More small explosions; increased seismicity and deformation
Seismicity and emissions began to increase at the end of July, leading to the evacuation of 11 people working on the summit . . . in early August. Released seismic energy (see figure 52) and reduced displacement (figure 42) of long-period earthquakes reached the highest values since the start of monitoring in February 1989. Amplitudes and durations for long-period events showed slow increases, as well. Tremor was recorded in low-frequency bands and modulated packs, with small variations in amplitude and period.
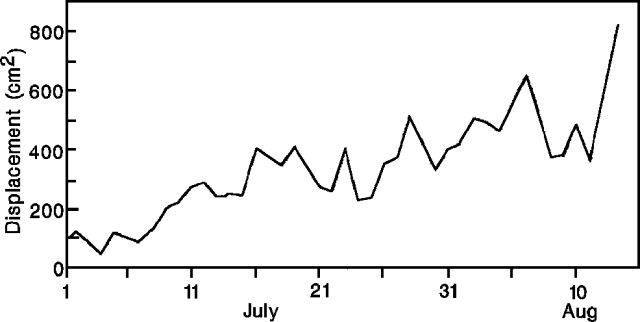 |
Figure 42. Daily reduced displacement of long-period earthquakes at Galeras, July-August 1991. Courtesy of INGEOMINAS. |
Long-period events, shallow in origin and often associated with gas-and-ash emissions, increased to >100/day by mid-August. The number of gas-and-ash emissions increased correspondingly. Plume heights reached 2 km and ash was deposited to 8 km N and NW. Head-sized blocks, hot to the touch, were periodically ejected onto the crater rim.
Inflation, continuing since September 1990, increased dramatically during the first half of August, when 265.8 µrad tangential and -180.6 µrad radial deformation were measured (figure 43) 0.9 km E of the crater ("Crater" electronic tiltmeter). The resultant inflation vector was 321.35 µrad with an azimuth of 115.81°.
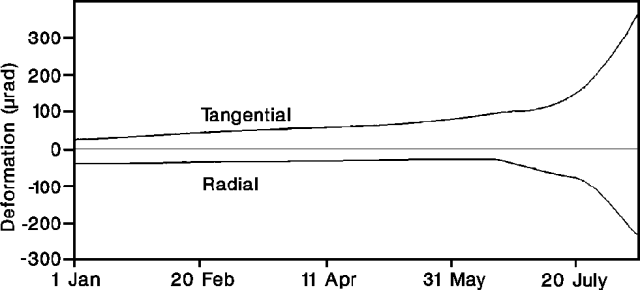 |
Figure 43. Tangential (top curve) and radial (bottom curve) deformation at the Crater electronic tiltmeter at Galeras, January-August 1991. Courtesy of INGEOMINAS. |
Information Contacts: INGEOMINAS-OVP; S. Williams and M. Calvache, Arizona State Univ.
Explosions eject incandescent tephra; increased seismicity and deformation
Seismic activity increased significantly in August, reaching the highest number of events (>150/day), the greatest reduced displacement (>800 cm2), and the highest released energy (~5.0 x 10⁸ ergs; see figure 52) by long-period events since monitoring began in February 1989. Explosions and continuous ash emission from the crater were accompanied by periodic ejections of incandescent blocks up to tens of centimeters in diameter. Incandescence was visible within the crater at dispersed sites. Although weather conditions impeded direct observations, it was possible to confirm that many of the long-period earthquakes and tremor episodes had associated surface activity. SO2 flux was low, ranging from 7 to ~370 t/d.
Substantial deformation changes were measured by the electronic tiltmeter [at Crater Station], with a resultant vector of 231 µrad of inflation (118° azimuth) in the 2 weeks ending 14 August. Lower levels of deformation, 3.7 µrad at 183° azimuth, were measured [at Peladitos Station].
Information Contacts: INGEOMINAS-OVP.
Lava extrusion follows increased tephra emission, seismicity, and deformation
Increased tephra emission, seismicity, and deformation culminated in the extrusion of a summit-crater lava dome in mid-October.
Activity continued to increase in September, with the highest number of events, the greatest released energy, and largest reduced displacement of long-period earthquakes since the start of monitoring in February 1989 (figure 44), surpassing the previous highs recorded in August. Tremor episodes and long-period events were associated with explosions, continuous ash emission, and occasional block ejections to 200 m from the vent. The SO2 flux was relatively low, <=650 t/d, except on 20-25 September when values of 960-1,045 t/d were recorded. Low SO2 fluxes were also recorded during August (<=370 t/d). The electronic tiltmeter [at Crater Station] became saturated, after recording 231 µrad of inflation during the first 2 weeks of August. Two km E of the crater, the Peladitos electronic tiltmeter showed 46.2 µrad of inflation at 242° azimuth (figure 45), compared to 3.7 µrad at 183° azimuth during the first 2 weeks of August. A change in the inclination of the radial component was recorded 9-13 September.
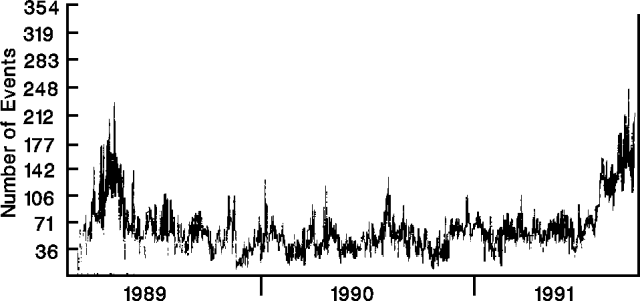 |
Figure 44. Daily number of earthquakes at Galeras, February 1989-September 1991. Courtesy of INGEOMINAS. |
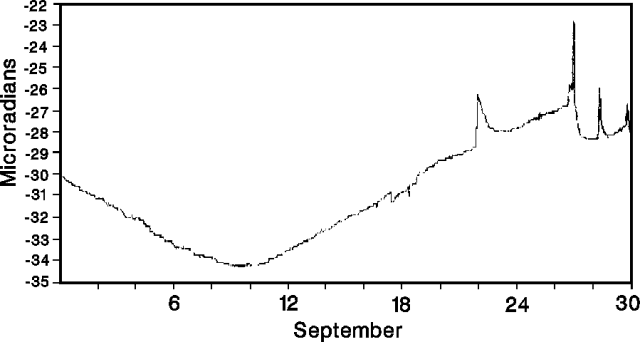 |
Figure 45. Radial component of deformation measured 2 km E of the crater ("Peladitos" electronic tiltmeter) at Galeras, September 1991. Courtesy of INGEOMINAS. |
Fieldwork in mid-October revealed a lava dome in the main crater [but see 16:10]. [The dome was 30 m thick and 80-100 m in diameter by the 17th]. Incandescence was visible in cracks on the dome's surface, but bad weather prevented detailed observation.
Information Contacts: INGEOMINAS-OVP; S. Williams and M. Calvache, Arizona State Univ.
New lava dome in summit crater; strong SO2 emission
The summit crater lava dome continued to grow through the second week of November, and was ~50 m thick by 23 October (figure 46). The surface of the dome was covered by angular blocks, some >4 m in diameter, most notable on the dome's E and SE edges. The central portion of the dome was covered by smaller fragments. The dome was first observed during an overflight on 9 October, but the start of dome growth may have been 3-4 October when high levels of sustained tremor (episodes of ~2 Hz lasting to 30 minutes) were recorded.
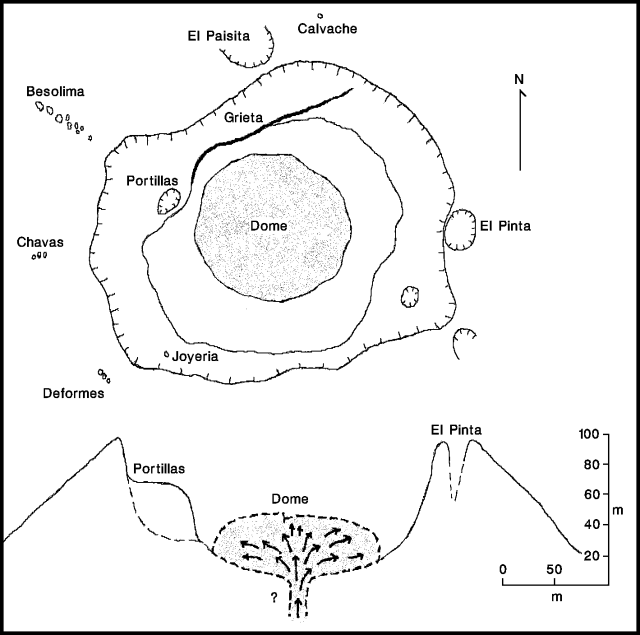 |
Figure 46. Sketch of the crater area of Galeras, showing dome and fumarole locations on 23 October 1991. Courtesy of INGEOMINAS. |
Gas and ash emissions occurred from different points on the dome surface, occasionally ejecting blocks to short distances. Surface activity closely corresponded with tremor and long-period seismic events that were recorded about 10-15 times/hour. Seismic energy release and the number of earthquakes continued to increase in October (see figure 52), again establishing new monthly highs at Galeras.
Electronic tiltmeters showed continued deformation during October, with 234 µrad of accumulated inflation at 190° azimuth measured [at Crater Station]; (figure 47), and 41 µrad at 292° azimuth measured [at Peladitos Station]. Slight inflation was also measured 2.3 km E of the crater (at "Piedras"). A decrease in the rate of inflation at Crater Station occurred on 9 October.
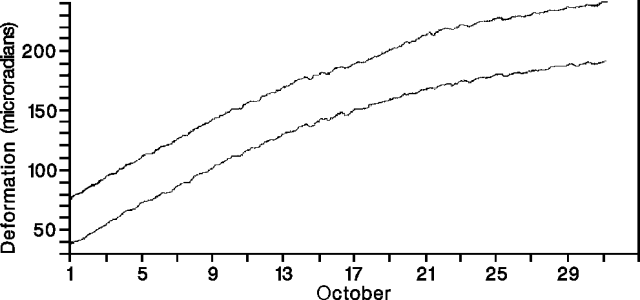 |
Figure 47. Tangential (top curve) and radial (bottom curve) deformation measured 0.9 km E of the crater (by the "Crater" electronic tiltmeter) at Galeras, October 1991. Courtesy of INGEOMINAS. |
The daily average SO2 flux varied widely from ~100 t/d (23 October) to ~1,700 t/d (28 October; figure 48), reaching higher values than in August or September (maxima of 370 and 1,045 t/d respectively). Airborne COSPEC measurements on 12 November indicated SO2 fluxes of up to 2,500 t/d.
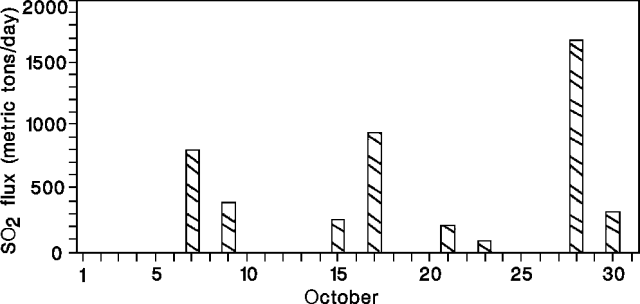 |
Figure 48. Daily average SO2 flux at Galeras, October 1991. No measurements were made on days without data. Courtesy of INGEOMINAS. |
Reference. Calvache, M.L., 1990, Geology and volcanology of the recent evolution of Galeras volcano, Colombia: M.S. Thesis, Louisiana State University, Baton Rouge, LA, 172 p.
Information Contacts: INGEOMINAS-OVP; S. Williams and M. Calvache, Arizona State Univ.
Continued deformation and seismicity; dome petrology
Seismicity remained at very high levels in November, with peaks in the number and intensity of long-period events on the 19th (figure 49). The average earthquake rate dropped briefly in early November, before returning to late-October levels. High-frequency seismicity, rare during November, showed a small increase centered beneath the volcano's W sector, near the end of the month. One shock was felt nearby (at the Galeras Military Base) on 18 November at 0627, and was associated with a tremor episode. Low-frequency (1-2 Hz) tremor bands, with 6 mm amplitudes, were recorded on 10 and 19 November; spasmodic tremor fluctuated, reaching a peak on 20 November.
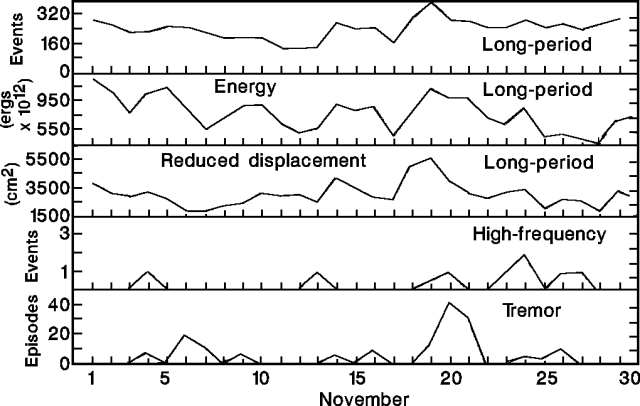 |
Figure 49. Seismicity at Galeras, November 1991. Courtesy of INGEOMINAS. |
The electronic tiltmeters located 0.9 km E ("Crater") and 2 km E ("Peladitos") of the crater showed continued inflation through 18 November, when a sudden change occurred (see figure 58), coinciding with a minimum in the reduced displacement of the long-period events. Inflation resumed at Crater Station, but measurements at Peladitos Station showed little change.
The dome in the summit crater was still growing in mid-November, as frequent explosions continued. Preliminary analyses of a block believed to have been ejected from the dome by an explosion show it to be a 2-pyroxene andesite. The rock is highly crystalline (>50% crystals), containing abundant plagioclase, and lesser clinopyroxene, orthopyroxene, titanomagnetite, and possible relict olivine. The glass is generally brown, and somewhat vesicular. Geologists noted that the rhyolitic glass composition and high crystallinity indicate a high degree of differentiation and high magma viscosity, consistent with the dome being part of an older gas-poor magma body forced upward by new magma that has not yet reached the surface.
Information Contacts: INGEOMINAS-OVP; J. Stix, Univ de Montréal.
Vigorous SO2 emission; fumaroles to 400°C; seismicity declines
December seismicity had decreased notably from October and November. The number and energy of long-period events showed an overall decline through the end of the month (figure 50). High-frequency earthquakes and tremor episodes were small and infrequent.
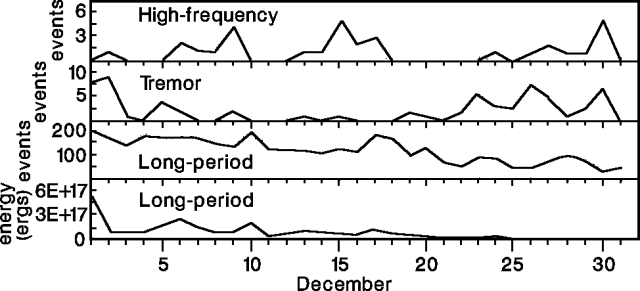 |
Figure 50. Daily number of high-frequency earthquakes (top), and tremor episodes (second from top), and the daily number (second from bottom) and energy release (bottom) of long-period events at Galeras, December 1991. Courtesy of INGEOMINAS. |
Fumarole temperatures of 195-220°C at "Las Deformes", 405-411°C at the "Besolima" fissure (both down slightly from mid-1991), and 89°C at "la Calvache" (similar to previous values), were measured during visits to the summit cone on 11 and 12 December. The maximum SO2 flux detected during the month was 3,440 t/d (9 December; figure 51), higher than in recent months, but measurements on five other days in December did not yield rates exceeding 600 t/d.
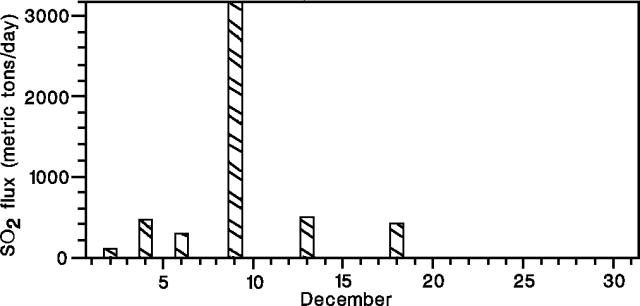 |
Figure 51. SO2 flux measured by COSPEC at Galeras, December 1991. The maximum value, on 9 December, was 3,440 t/d. Courtesy of INGEOMINAS. |
Information Contacts: INGEOMINAS-OVP.
Sporadic ash emission; seismicity down from October-November peak; no new dome growth
Gas emission in January was punctuated by sporadic fine ash emission, a decrease from the intense degassing and almost continuous ash emission in September-November 1991. Sulfur accumulations were observed on the E edge of the October-November 1991 dome; no dome growth has been reported since mid-November 1991. The SO2 flux, measured by COSPEC, was at low levels.
Seismicity stablized in January, at levels somewhat higher than those recorded before the October-November 1991 peak in activity (figure 52). High-frequency earthquakes were centered around the active crater at 3.3-6.8 km depth. Long-period events, often associated with ash emissions, reached a maximum for the month on 20 January. Tremor was recorded as spasmodic pulses, most intense in the first half of the month.
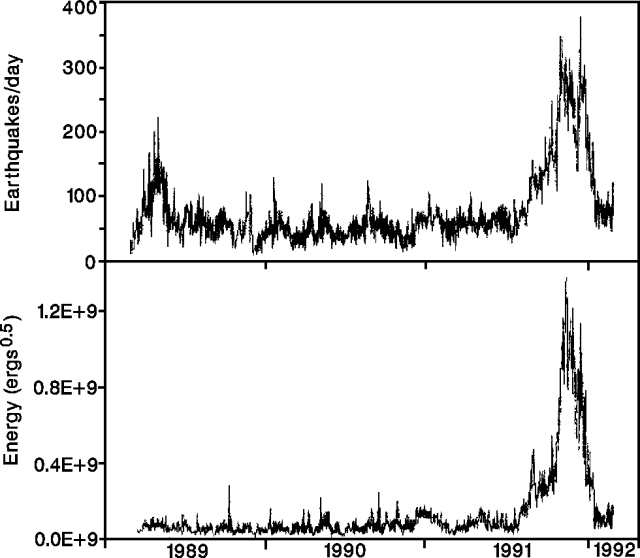 |
Figure 52. Daily number (top) and released energy (bottom) of earthquakes at Galeras, 27 February 1989-31 January 1992. Courtesy of INGEOMINAS. |
Electronic tilt measurements [at Crater Station] showed slight deflation in January (20 µrad, N component; no change, E component), ending a trend of inflation measured since September 1990. The rate of inflation increased rapidly in August 1991, then deformation stopped in November. Deformation [at Peladitos Station] fluctuated, but suggested slight inflation during the second half of the month (8 µrad in both components).
Information Contacts: INGEOMINAS-Observatorio Vulcanológico del Sur.
Occasional ash emissions
Occasional emissions of fine ash, sometimes associated with long-period earthquakes or variations in tremor, punctuated the continuous emission of gas and vapor in February. Although seismicity oscillated in February, it has remained stable since the increased activity associated with dome growth in October-November. On 11 February, a M 3.1 earthquake occurred roughly 2 km W of the crater, and was felt 9 km away (in Pasto and Consacá). Electronic tiltmeter measurements [at the Crater and Peladitos stations] were essentially stable, with the latter showing a slight tendency toward inflation.
Information Contacts: J. Romero, INGEOMINAS-Observatorio Vulcanológico del Sur.
Seismicity and SO2 release fluctuate; minor deformation
Seismic energy release and the number of long-period events fluctuated widely in March, similar to behavior in January-February. Tremor remained at low levels throughout the month. Eleven high-frequency earthquakes were recorded (M 1.2-2.2), centered primarily N and NE of the crater. Electronic tiltmeter measurements [at Crater Station] showed 21.8 µrad deflation in the N component, while measurements [at Peladitos Station] were essentially stable, with a slight tendency toward inflation (11 and 6 µrad for the two components). SO2 flux from the volcano was variable in March, ranging from 120 to ~2,500 t/d, but showed a general increase late in the month.
Information Contacts: J. Romero, INGEOMINAS-Observatorio Vulcanológico del Sur.
Gas and ash emissions; audible explosions; tremor and bursts of earthquakes
Gas and ash were emitted daily in April, accompanied by strong sulfurous odors, with some explosions audible to 500 m away. Activity was concentrated in the W part of the crater and 1991 dome, along a fracture to the NW, and in Portillas crater. Sulfur deposits were visible around gas vents at the extreme SE and S margins of the dome, where explosive activity was minor.
Long-period seismicity in April was similar to the previous several months (figure 53), although a slight increase in amplitude, released energy, and number of events was noted. The majority of the signals arrived in groups, and tended to occur at certain hours of the day. Tremor, generally spasmodic in character, remained at low levels, but at higher amplitudes than previous months. Eleven high-frequency earthquakes (M 1.1-2.5) were recorded in April, centered principally in the W part of the summit crater. Electronic tiltmeter measurements indicated little deformation since early 1992, with only minor amounts of deflation recorded [at Crater Station].
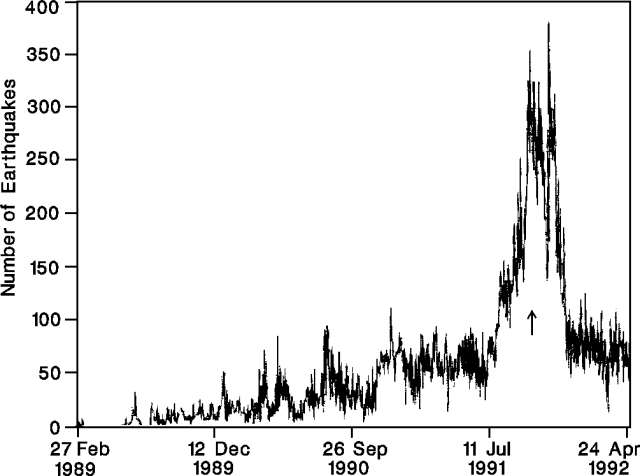 |
Figure 53. Daily number of long-period earthquakes at Galeras, 27 February 1989-24 April 1992. An arrow marks the first observation of the lava dome, on 9 October 1991. Courtesy of INGEOMINAS. |
Information Contacts: J. Romero, INGEOMINAS-Observatorio Vulcanológico del Sur.
Occasional explosions eject ash; strong fumarolic activity on 1991 dome; earthquakes and tremor decline
Gas emission continued in May, occasionally accompanied by explosions that produced very fine ash, and noise from various points in the active crater. The observed explosions were associated with long-period earthquakes or variations in background tremor. SO2 flux was at low to moderate levels, ranging from ~250 to 650 t/d. Increased fumarole temperatures were measured on the SW (at Deformes fumarole) and W (at Besolima fissure) flanks of the cone, while strong fumarolic activity continued on the NW side of the 1991 dome.
Long-period seismicity and spasmodic tremor declined noticeably in May (figure 54). The few recorded high-frequency events were centered towards the W side of the crater, near the active cone, at <4.5 km depth, and M <2.0. A tremor episode that began on 31 May at 0451 was composed of two bands with durations of 33 and 18 minutes, separated by six tremor-free minutes. The tremor's dominant period was 0.5-1.0 seconds, and the released energy roughly 2.0 x 10¹¹ ergs (reduced displacement of Rayleigh waves of 56 cm2 at the station 1.5 km from the crater). Another tremor episode, lasting 27 minutes with dominant periods of 0.2-0.4 seconds, was recorded in April. These tremor events were similar to those recorded in July-December 1991, associated with the formation and growth of the lava dome. A large long-period event recorded at 1920 on 6 June had a period of 1.5 seconds, and reduced displacements of 59 cm2 for Rayleigh waves, and 42 cm2 for body waves.
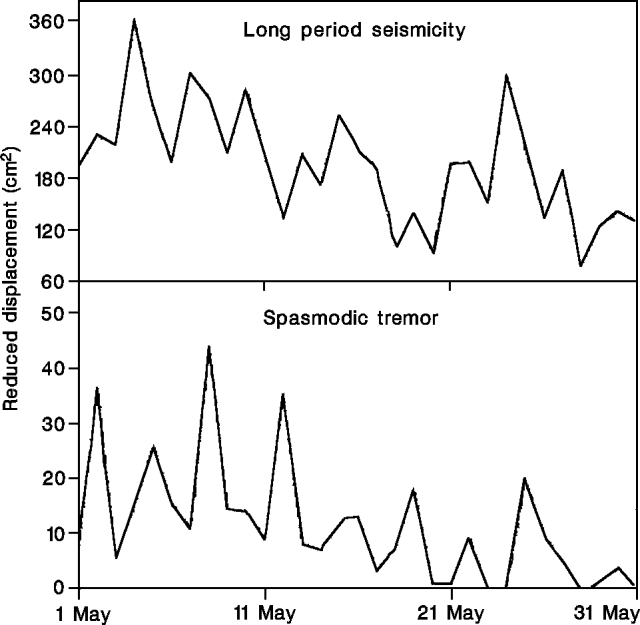 |
Figure 54. Daily reduced displacement of long-period seismicity (top) and spasmodic tremor episodes (bottom) at Galeras, May 1992. Courtesy of INGEOMINAS. |
Electronic tiltmeter measurements in May indicated deformation trends similar to April. The tiltmeter [at Crater Station] indicated continued deflation, while the tiltmeter [at Peladitos Station] suggested minor inflation (see figure 58).
Information Contacts: J. Romero, INGEOMINAS-Observatorio Vulcanológico del Sur.
Strong explosion destroys most of summit lava dome
An explosion on 16 July, the largest since activity began in 1989, ejected large tephra and may have generated a small pyroclastic flow. Partial collapse of the summit crater's lava dome occurred in June, and minor seismicity had been recorded a few days before the explosion.
June activity. The NW portion of the 1991 lava dome collapsed during June, and explosions and ash emissions occurred from the collapsed area. Las Portillas fumarole, formerly just NW of the dome, was larger after the collapse, and a line of new vents had opened nearby. The fracture on the NW crater wall remained active, and it and Las Portillas appeared to be the highest temperature vents in the crater. Gas columns were generally small, and were dispersed to the N and W. The number and energy release of long-period events (figure 55) and high-frequency earthquakes were low. Ten high-frequency earthquakes occurred in the NW part of the crater, with magnitudes of 0.3-1.7. The amplitude and period of background tremor showed small variations on 15 and 30 June. The maximum rate of SO2 emission measured by COSPEC was ~5,500 t/d.
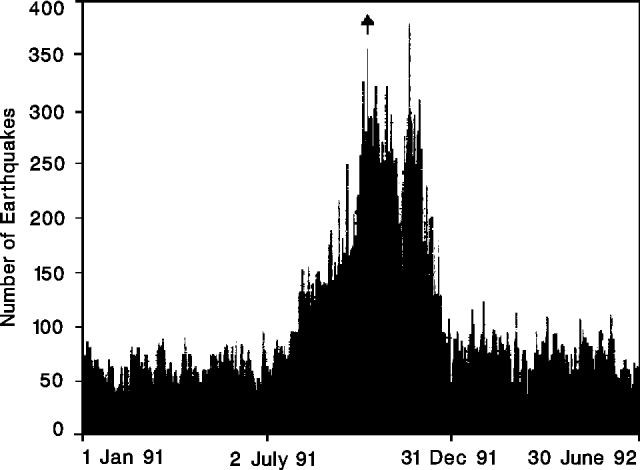 |
Figure 55. Daily number of long-period seismic events at Galeras, 1 January 1991-30 June 1992. The first observation of the summit lava dome is marked by an arrow. Courtesy of INGEOMINAS. |
Precursory seismicity and tilt. Banded tremor episodes of moderate to high energy occurred 11-12 July, accompanied by a small inflationary tilt event recorded on both instruments near the summit. Between 14 and 16 July, six monochromatic long-period events were recorded, with durations on the order of 80 seconds. On 15 July, there was a small swarm of high-frequency events with magnitudes of 0-0.5.
16 July explosion. The explosion began at 1740 with a strong shock felt in Pasto . . . . More than 90% of the summit lava dome was destroyed as at least 120,000 m3 of blocks were ejected, falling primarily on the E and NE flanks. Blocks 30 cm in diameter fell 2.3 km from the crater, and impact craters to 3.5 m across were found 400 m away. Incandescent blocks started fires 2 km from the crater on the NE flank. The tephra severely damaged a small military facility on the crater rim, and dropped 40-cm blocks on telephone and television facilities near the summit. Roughly 30,000 m3 of ash were dispersed in a narrow band to the W, with the 1-mm isopach extending ~10 km. The dark-gray cauliflower-shaped eruption column reached ~4 km altitude. Reports from observers 10 km WSW of the crater (in Consacá) suggested that small pyroclastic flows may have descended the W flank. A powerful sonic wave generated by the explosion broke windows in Pasto, and reportedly in Consacá.
A seismic signal lasting ~8 minutes accompanied the explosion, saturating instruments for the first 37 seconds. Two distinct signals were recognized, one with a frequency of 1 Hz and a duration magnitude of 3, the other a 1.3-Hz tremor episode that lasted 4 minutes. A high-frequency, M 3.2-3.5 event occurred 26 hours after the explosion, in the S part of the volcano at ~5 km depth.
Information Contacts: INGEOMINAS-Observatorio Vulcanológico del Sur.
More details of 16 July explosion; previous activity summarized
Most of the 1991 summit lava dome was ejected by an explosion on 16 July. The following summarizes activity since 1989 and provides additional detail about the July explosion.
Previous activity, 1989 to mid-1992. Increased fumarolic activity accompanied by minor ash emission and seismicity began in February 1989. Emission of ash that consisted of lithic fragments and some crystals occurred in early May. The ash was dispersed toward the SW, N, and E (onto Pasto. . .). The minimum volume of the ashfall was estimated at 4 x 10⁵ m3. Fumarolic activity continued for the rest of 1989. In 1990, small to moderate ash emissions were associated with long-period earthquakes and tremor pulses. Blocks to 15 cm in diameter were deposited around the crater by a small explosion on 2 August 1990. Another explosion on 25 November produced small quantities of juvenile glass. The finest ash was deposited on Pasto, producing a thin, discontinuous cover <1 mm thick. Ash emissions were frequent during the next 12 months, associated with long-period signals and tremor episodes that increased in number and size through November 1991 (figures 56 and 57).
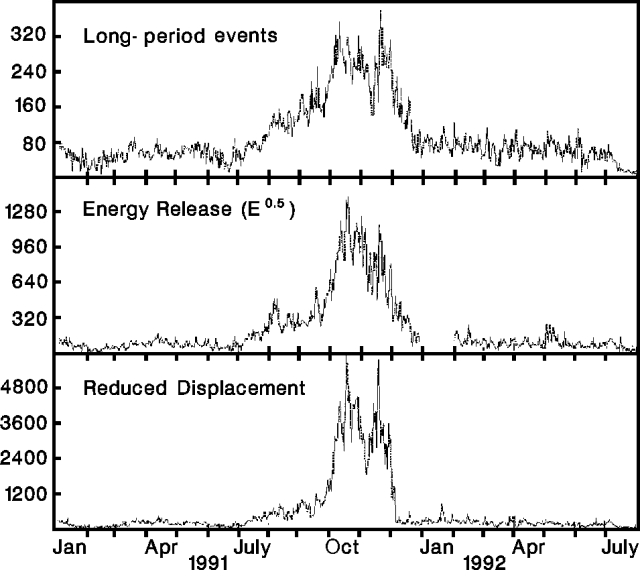 |
Figure 56. Daily number (top), energy release (middle), and reduced displacement (bottom) of long-period seismic events at Galeras, January 1991-July 1992. Courtesy of INGEOMINAS. |
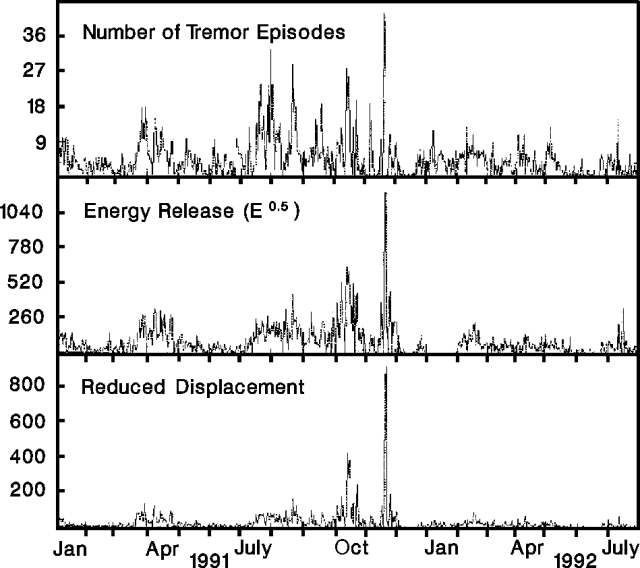 |
Figure 57. Daily number (top), energy release (middle), and reduced displacement (bottom) of tremor pulses at Galeras, January 1991-July 1992. Courtesy of INGEOMINAS. |
Fumarole temperatures reached 738°C in September 1990 and January 1991. Incandescence at vents was associated with an increase in gas emission and magmatic intrusion in June 1991. Long-period seismicity and tremor increased in July, coinciding with a strong increase in deformation rates measured by electronic tiltmeters near the crater (figure 58). Magma rose toward the surface, emerging as a dome in the bottom of the crater in October and November.
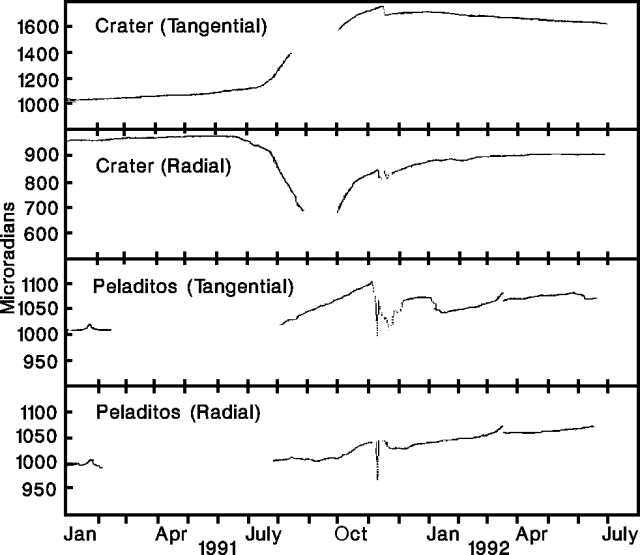 |
Figure 58. Deformation measured at electronic tiltmeters (Crater and Peladitos) 0.9 NE and 1.5 SE, respectively, of the crater at Galeras, January 1991-July 1992. Courtesy of INGEOMINAS. |
Seismicity was generally declining at the beginning of December 1991 with the exception of minor high-frequency activity. Electronic tiltmeters were stable, and gas emissions became less frequent with less ash content. Some tremor signals with durations of 18-33 minutes and dominant periods of 1 and 0.2 seconds were recorded in April and May 1992. These signals were analogous to those in the second half of 1991, associated with dome formation.
Seismicity and deformation, early July 1992. Long-period seismicity decreased gradually as the number of tremor pulses increased during the first 15 days of July. A moderate number of high-energy tremor pulses occurred 11-12 July. Six monochromatic long-period (1.54 Hz) events lasting about 80 seconds were recorded 14-16 July. On 15 July, a small swarm of ~18 high-frequency earthquakes had magnitudes of up to 0.5. Deformation rates were low (~1 µrad/day) compared to those of October and December 1991. Cumulative deformation was ~5 µrad, occurring as successive waves at the tiltmeter (Crater) 0.9 km E of the crater.
16 July explosion. The explosion at 1640 on 16 July destroyed >90% of the dome at the bottom of the crater. Fragments of various sizes were ejected ballistically. Blocks 30-40 cm in diameter fell as much as 2.3 km away; some to 1 m in diameter reached 1.3 km distance, falling on a road where they made impact craters 3 m across and 1 m deep; fragments 3.5 m across were found 400 m from the crater rim; and on the E edge of the caldera, 169 projectiles were counted in an area ~10 m wide and 1,000 m long. Incandescent blocks started forest fires on the NE flank, 2.3 km from the crater.
The dark-gray eruption column with turbulent, cauliflower-like edges rose ~4 km. Ash was dispersed mainly to the W and had a calculated minimum volume of 5.7 x 10⁴ m3. Blocks, with a minimum volume of 2.2 x 10⁴ m3, were concentrated toward the E and NE. The temperatures of block surfaces were ~290°C, and of the pyroclastic deposits around the crater, ~230°C.
Seismographs registered a 6-minute signal that began at 1640:32, saturating instruments for the initial 37 seconds. Two distinct elements were noted. The first had a frequency of 0.5 Hz and a duration magnitude of 3, and the second was a 1.3 Hz tremor event that lasted 4 minutes.
A strong accompanying explosive sound was heard at 5.5 km distance (in Genoy), and in parts of Pasto 9 km away. A relatively weak expansion wave broke some glass 9 km away, in the corregimiento (magistracy) of Nariño.
Information Contacts: J. Romero, INGEOMINAS-Observatorio Vulcanológico del Sur.
Ash ejection; seismicity and SO2 emission decline
Seismicity in August was at the lowest levels since monitoring began, but there was an increase in high-frequency events. On 1 August, a high-frequency earthquake centered 7 km W of the active cone was felt in the city of Pasto. During August, four swarms were detected, similar to those recorded a few hours before the 16 July eruption. The swarms were centered NW of the crater at depths of 2.5-5.0 km (figure 59); magnitudes were generally ~0.4, with the strongest shocks reaching M 2.3. The number and energy release of long-period earthquakes were the lowest since February 1989.
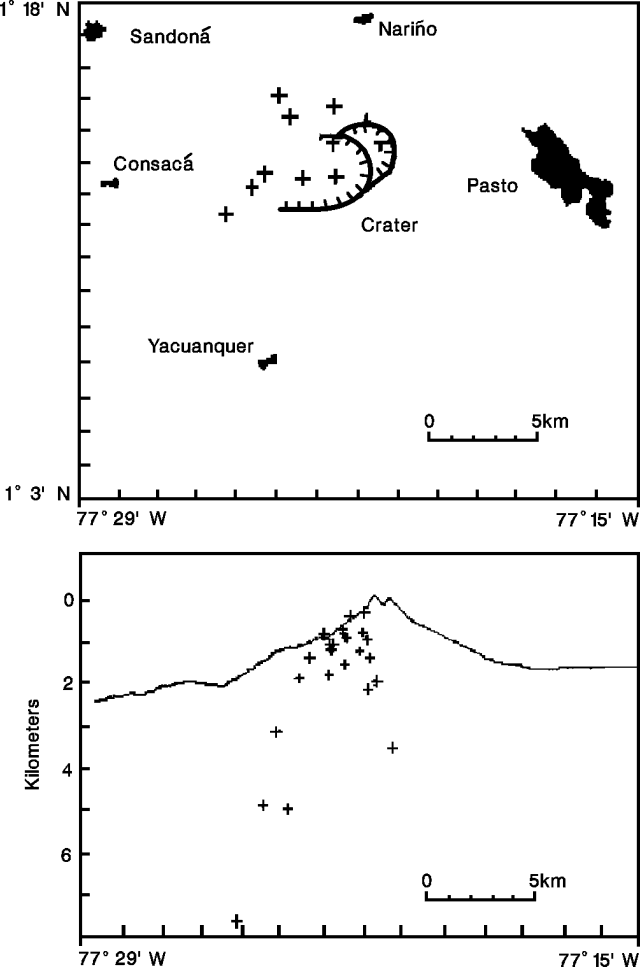 |
Figure 59. Epicenters (top) and depths (bottom) of seismic activity at Galeras, August 1992. Courtesy of INGEOMINAS. |
Deformation measured by two electronic tiltmeters near the summit (Crater and Peladitos), and the short leveling-line vector (Las Piedras), was low compared to that of September and October 1991, associated with dome emplacement. A strong offset at Peladitos on 9 August coincided with one of the swarms of high-frequency events. Deformation remained relatively stable at Crater until a sharp change occurred on 24 August (figure 60).
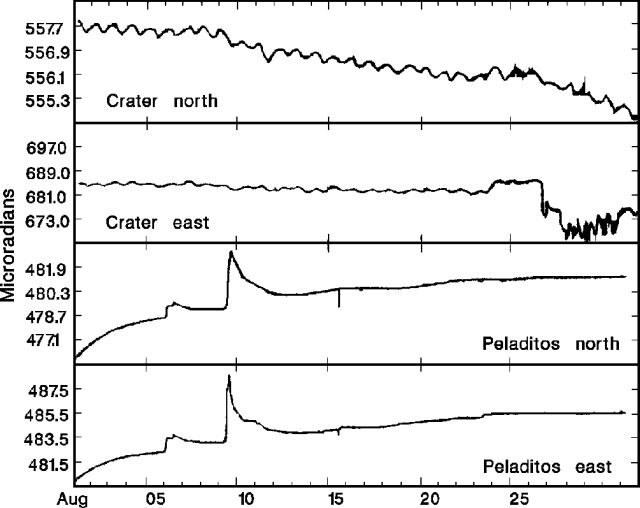 |
Figure 60. Deformation data from the Crater and Peladitos electronic tiltmeters, 0.9 km NE and 1.5 km SE, respectively, of the crater at Galeras, August 1992. Courtesy of INGEOMINAS. |
COSPEC data showed SO2 emissions of ~35 t/d, the lowest values since monitoring began in early 1989. Ash emission associated with a long-period seismic event was observed at 1535 on 11 August. Geologists noted that pulses of great activity, as from 1924-36, alternate with periods of minimum activity, and that the present decline in activity is consistent with the historical behavior of Galeras.
Information Contacts: J. Romero, INGEOMINAS - Observatorio Vulcanólogico del Sur.
Seismicity declines; little deformation
High-frequency seismicity decreased in September compared to August. Only ten events occurred W of the crater at depths <6 km, of which seven were <1 km. Magnitudes varied between 0.4 and 1.7. A swarm of small earthquakes registered on 15 September had characteristics similar to those observed before the 16 July eruption. There were no significant deep tremor episodes. Few long-period events were recorded, but they were more common during the first 2 weeks of the month. COSPEC measurements of SO2 flux in September varied between 50 and 450 t/d, similar to August values. The electronic tiltmeter [at Crater Station] was generally stable tangentially, with a slight deflation (-3.9 µrad), and had fluctuating radial values with a cumulative inflation (+5.9 µrad). The [Peladitos station] was also relatively stable, with changes of -3.8 and +9.0 µrad for the tangential and radial components, respectively.
Information Contacts: M. Calvache, INGEOMINAS - Observatorio Vulcanológico del Sur.
Gas emission; seismicity declines; little deformation
October surface activity . . . was characterized by gas emissions that produced white columns averaging 100 m high. These extended toward the N and W flanks. SO2 flux remained at low levels, ranging from 36 to 468 t/d.
Seismicity declined again in October, and was limited to small-magnitude events. High-frequency shocks were concentrated N and W of the active crater at depths of 1-6 km. Magnitudes were <2.3. Three low-energy swarms were recorded, on 1, 5, and 14 October. Long-period events were infrequent and of low energy (figure 61). The most vigorous long-period activity occurred on 15 October, when 12 earthquakes released roughly 1014 ergs of energy. The month's two episodes of harmonic tremor had dominant periods of 0.8 and 0.7 seconds and maximum amplitudes of 4 and 4.5 mm, respectively. Deep tremor was variable, with an average duration of 1.5 minutes and a maximum amplitude of 2 mm. Energy levels were generally low.
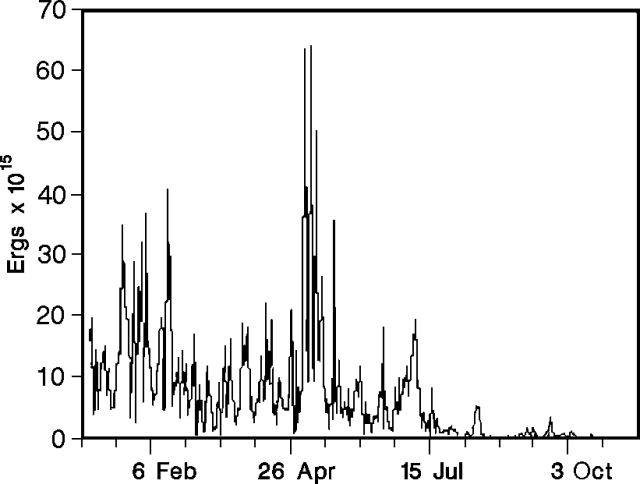 |
Figure 61. Long-period seismic energy release at Galeras, January-October 1992. Courtesy of INGEOMINAS. |
Total tangential deformation at [Crater Station] was 5.98 µrad during October. After 9 October, several-day episodes of roughly SW-trending deformation alternated with periods of similar length and magnitude trending approximately NE, yielding little cumulative change.
Information Contacts: F. Muñoz, INGEOMINAS—Observatorio Vulcanológico del Sur.
Low-level seismicity, gas emission, and deformation
Seismicity, gas emission, and deformation were generally at low levels during November, although a swarm of 22 long-period events was recorded on the 10th. Most of the month's seismicity was thought to be associated with movement of fluids. Rock-breakage events were less frequent than in October, and were centered E of the active crater. Tremor episodes remained at low energy levels, with maximum durations and amplitudes of 287 seconds and 3.2 mm, respectively. SO2 flux measured by COSPEC ranged from 46 to 547 t/d, similar to October values.
Tilt data from [Crater Station] showed 6 µrad of deflation in November. A second station, 1.6 km E of the crater, measured 6 µrad of inflation during the first half of the month. A 40-µrad change registered by its tangential component during the second half of November may have been caused by local movements at the site.
Information Contacts: F. Muñoz, INGEOMINAS—Observatorio Vulcanológico del Sur.
Explosion kills nine people on the active cone, including six volcanologists
A moderate explosive eruption on 14 January [1993] killed five people, left four others missing and presumed dead, and injured six. Most of the casualties were volcanologists attending the Galeras Volcano International Workshop. The eruption, which occurred during a workshop fieldtrip, had no immediate precursors, and was the first known explosion from the active crater since the lava dome was destroyed on 16 July.
Quoted material below is from a report by D. Gómez, R. Torres, F. Gil, and S. McNutt. Information from other sources is interspersed . . . but is not within quotes.
Seismic and eruptive activity, 1991-92. "Galeras is monitored by six short-period seismic stations 0.9-9 km from the active vent. Each station has a vertical seismometer only. During 1991-92, seismic activity was characterized by many long-period (LP) events accompanied by tremor episodes. Activity was highest in October and November 1991, with 200-360 LP events/day (figure 62). Lava-dome growth began sometime between 19 September and 9 October 1991 (16:9-10). Many ash emissions were associated with LP events and tremor. Between January and June 1992, 20-120 LP events per day were recorded. Following the 16 July 1992 eruption, which destroyed the dome (17:6-7), seismicity gradually declined to fewer than 10 events/day by December.
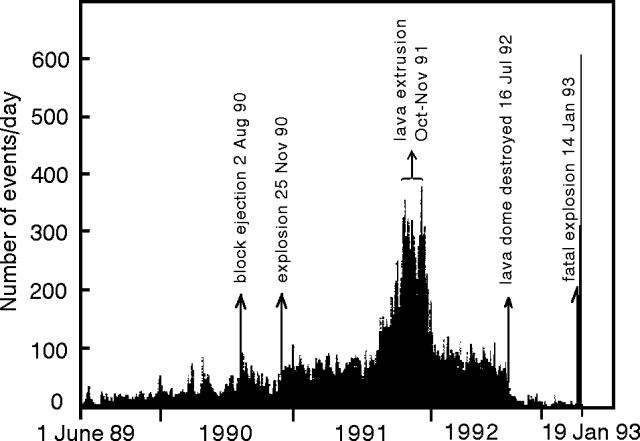 |
Figure 62. Number of long-period events per day at Galeras, 1 June 1989-19 January 1993. The period of peak activity in late 1991 was associated with growth of the lava dome that was then destroyed by the 16 July 1992 explosion. Courtesy of INGEOMINAS. |
"High-frequency or volcano-tectonic (VT) events represent <10% of the seismicity. During 1991 and 1992, the number of these events ranged from 0-20/day. The most important VT swarms occurred a few hours before the 16 July 1992 eruption and on 1-19 August 1992. VT events also declined during the last 5 months of 1992, and occurred on only 4 days in December." Deformation data showed minor inflation at one station and continued substantial tangential deflation at another, but geologists noted that the latter may have been related to climatic changes.
Seismicity, January 1993. "During the first 2 weeks of 1993, LP events occurred at rates of 2-8/day (figure 63). No trends were observed. VT events occurred at 0-6/day (figure 64), a little higher than December 1992 rates, but similar to many other small swarms over the last 4 years.
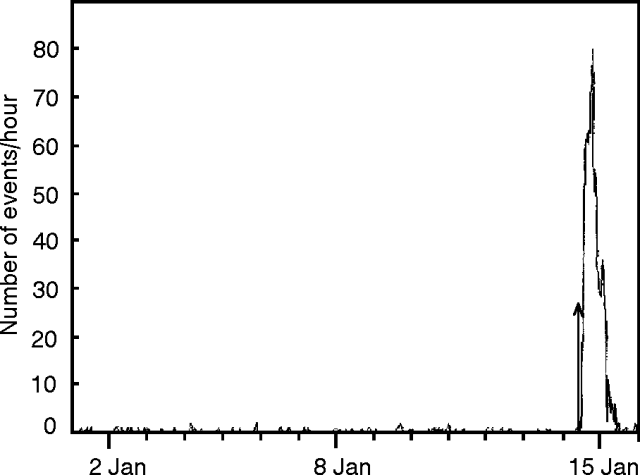 |
Figure 63. Number of long-period events per hour at Galeras, 1-16 January 1993. The large increase on 14 January coincides with the onset of the eruption. Courtesy of INGEOMINAS. |
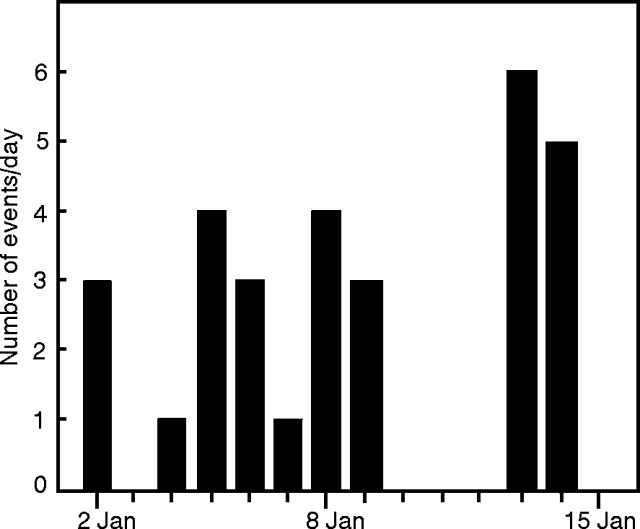 |
Figure 64. Number of high-frequency events per day at Galeras, 1-16 January 1993. Courtesy of INGEOMINAS. |
"Starting on 1 January 1993, a distinct event-type appeared, referred to as a tornillo (screw-like) event because of the nearly perfect symmetry and long coda. These are probably a special type of LP event, and are thought to represent fluid resonance in a cavity, although details are not yet known. Seventeen occurred from 1 to 14 January. Similar events have been recorded previously, but the frequency content was different. They were recorded in March 1989 (only a few), 11-16 July before the dome-destroying eruption (nine events in 5 days), and on 3 August 1992 (a single event not followed by an eruption). Frequencies of the screw-like events ranged from 1 to 3 Hz. Those in January were not all identical to each other or to events recorded earlier.
14 January 1993 eruption and aftermath. "The eruption occurred suddenly on 14 January 1993 at 1341. There were no immediate precursors in the hours before the eruption. The seismic signal associated with the eruption lasted for 15 minutes, and saturated one nearby station for 2 minutes (Crater 2). The 16 July eruption lasted 10 minutes and saturated the same station for 1 minute. The eruption plume height was estimated at 2.5-4 km above the vent, and ~30,000 m3 of material were excavated from the crater."
The active crater is at the summit of an intracaldera cone that is separated from the steep E rim of the caldera by a narrow moat (figure 65). Néstor García (Univ Nacional, Manizales, Colombia) and Igor Menyailov (Institute of Volcanology, Petropavlovsk, Russia) had been taking gas samples inside the active crater (number 2 in figure 4), and eyewitness accounts indicate that they had not left by the time of the eruption. Geoff Brown (Open Univ, Milton Keynes, UK), Fernando Cuenca (INGEOMINAS, Bogotá, Colombia), and Carlos Trujillo (CESMAG, Pasto, Colombia) had been making gravity measurements on the active cone, and were seen walking along the W side of the active crater rim ~3 minutes before the eruption (number 1 in figure 65). No survivors are known from these two groups.
José Arlés Zapata (INGEOMINAS, Pasto, Colombia), Michael Conway (Michigan Technological Univ, USA), Luis Lemarie (Escuela Politécnica, Quito, Ecuador), Andrew Macfarlane (Florida International Univ, USA), and three tourists were on the SE outer flank of the active cone (number 3 in figure 65), having descended a few tens of meters from the crater rim when the eruption occurred. Stan Williams (Arizona State Univ, USA) was above this group on the rim. Upon hearing an explosion, Conway looked back and saw a dark-gray plume that appeared to fill the crater. The activity seemed to be a typical vertical Vulcanian explosion, with projectiles leaving the main column on ballistic trajectories. A dense fall of hot ejecta began immediately on the cone's flank and soon intensified. Some of the tephra may have been as large as 1.5 m across, although most were lapilli- to fist-sized. Tongues of the convecting plume jetted 5-15 m onto the flanks of the cone, but there was no evidence of pyroclastic flows. Some incandescence was visible in the vertical column, but from his position on the flank, Conway felt no hot gases and did not need to use his gas mask. Arlés and the tourists were killed, and Williams was seriously injured. Others had less severe injuries, but all were battered and burned by the falling tephra. None of those closest to the eruption wore hardhats. The fall of large tephra ended after a few minutes, succeeded by light rain carrying clusters of ash and fine lapilli. Vigorous degassing, accompanied by a loud jetting sound, continued for several hours from the active crater, but there were no further explosions.
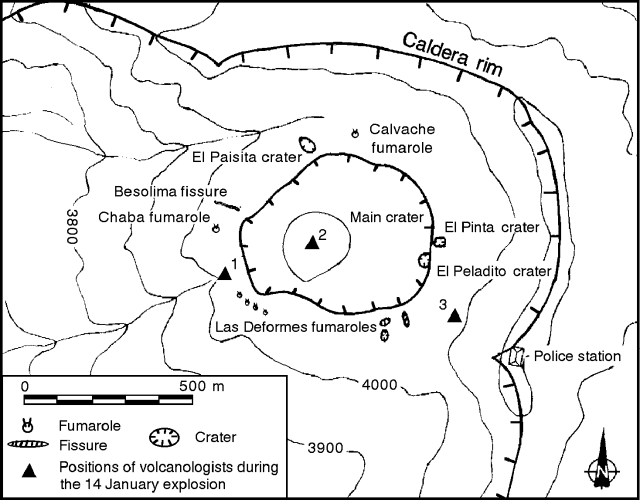 |
Figure 65. Sketch map showing the active crater and the NE part of the summit caldera. The approximate positions of persons killed and injured in the 14 January eruption are shown: (1) Geoff Brown, Fernando Cuenca, and Carlos Trujillo (gravimetry group); (2) Néstor García and Igor Menyailov (gas sampling group); (3) José Arlés Zapata, Michael Conway, Luis Lemarie, Andrew Macfarlane (gas sampling group), and three tourists; Stanley Williams was above this group on the crater rim. Contour interval, 100 m. Courtesy of C. Connor. |
After large tephra stopped falling, Conway, Lemarie, and Macfarlane, although injured, were able to move slowly downslope, cross the moat and begin to climb the caldera wall. From there, rescuers brought them to the crater rim. Williams was carried out of the crater some time later. Rescue teams from the Red Cross and the Pasto volunteer fire department had arrived soon after the eruption. Several witnesses reported that Marta Calvache and Patricia Mothes, on the outer flanks of the caldera at the time of the eruption, went quickly to the scene of the disaster, assisting victims and helping to coordinate rescue efforts.
Ash- to lapilli-sized tephra (to 3 cm) from the explosion was collected by P. Mothes from the roof of a car on the E caldera rim. Examination through a binocular microscope revealed pyroxene, plagioclase, and quartz crystals, two types of vesicular fresh-looking (but not necessarily juvenile) glass, non-juvenile glass thought to be from the 1991 dome, and altered material including yellow sulfur-rich clasts. Quartz has been found in ash from previous activity at Galeras, but none in this or previous samples was surrounded by matrix glass. Quartz has also not been seen in thin sections of Galeras rocks.
"Immediately after the eruption, seismicity reached the highest levels yet recorded at Galeras; 611 LP events were recorded in 12 hours on 14 January and 150 were recorded on 15 January. Some LP events were correlated with individual pulses of gas release. An additional small ash emission, with associated tremor, occurred on 15 January at 0643. The seismicity declined quickly, reaching background levels by 16 January and remaining there as of 18 January." Rates of SO2 emission remained low, averaging 50 t/d 16-18 January.
Information Contacts: M. Calvache, D. Gómez, and R. Torres, INGEOMINAS—Observatorio Vulcanológico del Sur; F. Gil, INGEOMINAS, Manizales; H. Cepeda and M. Monsalve, INGEOMINAS, Popayán; J-C. Komorowski, Instituto de Geofísica, UNAM, México; D. Lescinsky, Arizona State Univ; S. McNutt, Univ of Alaska; M. Conway, Michigan Technological Univ; C. Connor, CNWRA, San Antonio; C. Wood, Univ of North Dakota.
Further details on 14 January explosion; SO2 output increasing
The following, from Stanley Williams and Setsuya Nakada, supplements information on the 14 January eruption. We are pleased to report that Williams is recovering well from his injuries.
Galeras first became active in early 1988, not in 1989 as previously reported, when soldiers occupying a communications post on the rim observed increased gas emissions, rockfalls, and felt earthquakes. Magmatic gases were sampled in December 1988.
Nakada, 2.1 km NE of the crater, first felt and heard the 14 January explosion, which sounded similar to a dynamite explosion, at 1340. Thick clouds over the summit area limited visibility. The noise quickly changed to a clattering sound, with the sound of rolling stones within the crater continuing for ~20 minutes. About 10 minutes after the eruption there was a 15-minute shower of small (a few mm across) scattered lithics.
INGEOMINAS reports that seismicity was low, 2-8 long-period events/day, during the first two weeks of January. Seventeen "screw-type" events (1-3 Hz frequencies and long codas compared to their amplitudes) thought to be associated with movement of fluids in a cavity, were recorded 1-14 January. Similar seismicity was recorded prior to the 16 July 1992 eruption. The seismic signal associated with the 14 January eruption lasted ~15 minutes, with the eruption [occurring] during the first 6 minutes and 24 seconds. The remainder of the signal consisted of a tremor episode accompanied by long-period events. The event was identified as impulsive-compressive, a typical explosive seismic form characterized by initial low-frequency activity, with a mix of higher frequencies following the eruption. Data are from the "OBONUCO" station, 5.8 km SE of the crater, operated by the Andean Geophysical Institute. The total of 761 long-period events occurred during the 18 hours following the eruption, with 611 in the first 12 hours; the largest occurrence recorded since monitoring began in 1989. There were a maximum was 50 events/hour, some associated with gas release. Seismicity then returned to the low levels of previous months, with the exception of two relatively long, very low frequency tremor episodes (to 6.5 minutes). Similar tremor episodes were associated with the lava dome emplacement (July-December 1991). High-frequency seismicity was most significant during the first days of January, averaging 3 earthquakes/day, with magnitudes of 1.2-2.2. Most were located near the active crater.
SO2 flux measured by COSPEC ranged from 8 to 194 t/d on 14-18 January and 81-562 t/d later in the month. Fumarolic activity was low on the 16th and 19th, with little to no audible noise outside the caldera. New fumarolic activity was observed at the S edge of the main crater. Analysis of ash from the eruption showed a juvenile component (associated with liquid magma), altered material (from the conduit and the surrounding area), and some contribution from the dome that was destroyed in 1992. The only noticeable morphological change, a cone in the main crater, was a result of the explosion.
Fumaroles near the site of the explosion, inside the crater, were visited on 26 November 1992 by José Arlés Zapata and Néstor García (both of whom were killed in the eruption), Héctor Cepeda, Marino Martini, and Franco Prati. The temperature of the gas sample was 642°C (table 6). The composition of gases implies production directly from magmatic fluids, with minor contributions from shallow aquifers.
Table 6. Analysis of gases collected at Galeras (26 November 1992) and Puracé (28 November 1992). Percentages shown are for dry gas. Courtesy of M. Martini.
| Gas | Galeras | Puracé |
| CO2 | 70.23 | 73.84 |
| SO2 | 9.90 | 14.66 |
| H2S | 6.72 | 3.25 |
| HCl | 8.36 | 7.53 |
| HF | 0.73 | 0.041 |
| H2 | 3.35 | 0.0034 |
| CO | 0.16 | 0.0005 |
| N2 | 0.48 | 0.62 |
| H | 0.0037 | -- |
| B | -- | 0.042 |
| Vol % H20 | 91.48 | 98.09 |
| Temp | 642°C | 170°C |
The following interpretation of the eruption is from John Stix, who attended the workshop. "The most recent period of unrest at Galeras (1988-present) has been characterized by strong non-eruptive degassing. This is seen visually, with the COSPEC, and using glass inclusion studies that indicate degassing in the magma chamber and conduit. After explosive eruptions in May 1989, the SO2 flux in 1989-90 was huge (up to 5,000-10,000 t/d). By mid-1991, SO2 had declined and the lava dome was emplaced in October-November 1991, accompanied by deformation and long-period seismicity due to shallow degassing as the magma ascended. After November 1991, SO2 declined dramatically, as did the long-period seismicity. What may have happened was similar to Usu in 1977-1980; a small amount of magma was emplaced at shallow levels and erupted as a lava dome. Then, after November 1991, this magma became isolated from its source, just sitting in place stewing, cooling, and crystallizing, without much movement. The dome may have acted as a plug, so that the degassing of the partly solidified magma by crystallization created overpressurized gas-rich pockets. Visually, most of the surface degassing was occurring from fumaroles on the outer flank of the inner crater, suggesting that the magma could degas more easily along the conduit margins. Not only did the magma become more degassed over time, but due to the sealing of the system, gas-rich pockets could form because there was still some magma that crystallized and continued to degas.
"Since the 16 July eruption, gas pressure was building beneath the surface of the inner crater. This gas was trapped in the pore spaces of relatively impermeable rock, so overpressure likely developed. After a certain point, the rock ruptured and the eruption of 14 January ensued. It is also possible that the eruption was initiated phreatically. There was intense long period seismicity after the eruption, lasting until the next afternoon and decaying to levels comparable to those before the eruption. It seems that the partially solidified magma, emplaced as a lava dome in the inner crater (October-November 1991), degassed intensely for a day due to the removal of the overlying material. After 24 hours, most of this gas had been released, so the seismicity and SO2 flux returned to pre-eruption levels. By 16 January, when COSPEC flights began, the SO2 flux was very low (<100 t/d). Thus, with both the seismicity and COSPEC data, we were able to say that new, gas rich magma had probably not moved to shallow levels. Thus, the volcano was less dangerous after the eruption than initially thought. This kind of hazard has unfortunately not been appreciated, and is very difficult to predict at Galeras with the current monitoring configuration because there are so few changes prior to such an eruption."
Information Contacts: M. Calvache, INGEOMINAS, Pasto; H. Cepeda, INGEOMINAS, Popayán; M. Martini, Univ di Firenze; S. Nakada, Kyushu Univ; S. Williams, Arizona State Univ; J. Stix, Univ de Montreal.
Low seismicity and SO2 levels; episodes of long-period tremor
Seismic activity at Galeras continued in February at the low levels that followed the 14 January eruption. The majority of earthquakes were located slightly to the W of the caldera at depths <1.5 km. COSPEC measurements of SO2 remained low and the [Crater Station] electronic tiltmeter showed no significant changes. Continuous gas emissions came from the main crater and fumaroles located to the W and SW. No seismicity could be correlated with periodic reports of roaring noises or explosions from the active crater.
Beginning on 13 February, long-period, "screw-type" seismic events referred to as tornillos were detected, their occurrence increasing towards the end of the month. As of 12 March, twenty-six of these events had been recorded. During the last days of February the tornillos changed character. Though still remaining low-frequency and long-duration, the signature varied or the dominant frequency increased. Some of the tornillos were located near the surface towards the W flank of the volcano.
Information Contacts: M. Calvache, INGEOMINAS, Pasto.
Three small explosions; ashfall to 65 km
Small eruptions occurred on 23 March, 4 April, and 13 April. The seismic signal associated with the pyroclastic eruption at 2239 on 23 March (VEI 1) lasted 12 minutes, saturating the seismic network for 90 seconds. The eruption produced a column calculated to have been 8 km high, and ejected >8.35 x 10⁵ m3 of material. About 6.35 x 10⁵ m3 of ejecta went W and ashfall was noted 65 km from the volcano. Approximately 2 x 10⁵ m3 of projectiles, some as large as 90 cm in diameter, fell within a 2 km radius of the vent and destroyed the communications station on the caldera rim, approximately 700 m from the active crater. Two policemen in the station at the time of the event were not injured. Incandescent ballistics and lightning were seen from Pasto and a loud roar was heard, but no shock wave was felt. During the 10 hours following the eruption, 445 seismic events, both long-period and tremor, were recorded. The mechanical characteristics of the eruption appeared to be the same as those for the July 1992 eruption; obstruction of the conduit at depth and subsequent explosion because of overpressurization.
Overflights of the crater after the eruption revealed a reactivation of circular and radial fractures associated with collapses on the border of the active crater. New craters and associated fumarolic activity were also noted. In the weeks prior to the eruption, SO2 flux was low, 37-81 t/d. Following the eruption, the SO2 flux rose to 800 t/d on 24 March, but then declined to 581 t/d on 26 March and to 132 t/d by 29 March.
Forty-two screw-type seismic events were recorded in March. They were located slightly W of the active crater at depths between 0.2 and 1.0 km. The dominant frequency for individual events ranged from 2.35 to 4.00 Hz, and the durations were between 22 and 185 seconds. The event lasting 185 seconds occurred on 12 March and had a dominant frequency of a 2.9 Hz.
An eruption at 1603 on 4 April produced a 5-km high ash column. The eruption was smaller than others this year and no ballistics fell outside the active crater. The seismic network recorded the eruption as a long-period event lasting 123 seconds, saturating the network for only 17 seconds. There were no precursors. After the eruption, SO2 flux was ~200 t/d, but fell to 100 t/d by the next day. Through 7 April, SO2 flux remained low and the amplitude and duration of long-period events declined.
An ash eruption at 0321 on 13 April lasted 140 seconds and saturated the seismic network for 33 seconds. An increase in gas emissions was noted later that morning during an overflight. Recorded in the preceding week were two small episodes of tremor, occasional screw-type events and a swarm of small, strongly impulsive seismic events.
Information Contacts: M. Calvache, INGEOMINAS, Pasto; T. Fischer and D. Lescinsky, Arizona State Univ; J. Ewert and A. Lockhart, USGS.
Two small eruptions; small swarm of earthquakes M 2.8-4.5
Two small pyroclastic eruptions in the first half of April produced columns 6 km high. The first, at 1603 on 4 April, ejected 18 x 104 m3 of ash. Seismicity associated with the eruption reached M 3 and lasted for 123 seconds, saturating nearby stations (within 2 km) for the first 17 seconds. Analysis of records from stations >5 km away showed dominant frequencies of 4.9 and 12.6 Hz. Long-period seismicity increased slightly for 8 hours after the explosion. The second eruption occurred at 0321 on 13 April, with 21.7 x 10⁴ m3 of ash and blocks ejected. The long-period event associated with this eruption reached M 3.1 and lasted for 140 seconds, saturating nearby stations for the first 33 seconds. The dominant frequencies were 9.8 and 12.4 Hz. Small-magnitude long-period seismicity continued for 30 minutes.
Seven high-frequency events were registered on 1 April, with a maximum magnitude of 4.5. The earthquakes occurred at 0048 (M 4.2), 0159 (M 4.5), 0204 (M 4.0), 0303 (M 3.5), 0508 (M 3.1), 0839 (M 3.0), and 2145 (M 2.8). High-frequency seismicity increased again 26 April, peaked the morning of the 27th (figure 66), and was continuing in early May. Another earthquake, M 3.6, occurred at 1030 on 29 April. All of these earthquakes, as well as 67 other events, had epicenters 3 km N of the active crater at depths of 2-8 km below the summit (figure 67). There were ~300 earthquakes recorded in April 1993.
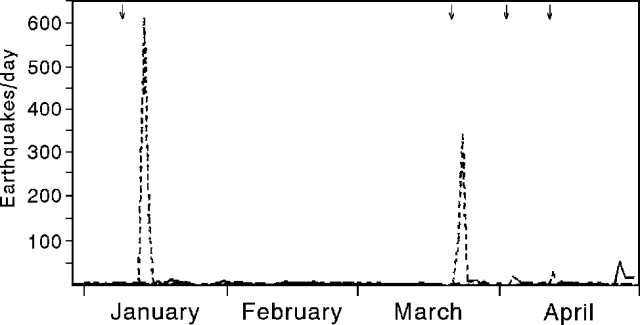 |
Figure 66. Daily number of earthquakes at Galeras, 1 January to 30 April 1993. Dashed line indicates long-period events; solid line indicates high-frequency events (very low until 27 April). Arrows at top indicate eruptions on 14 January, 23 March, 4 April, and 13 April. Courtesy of INGEOMINAS. |
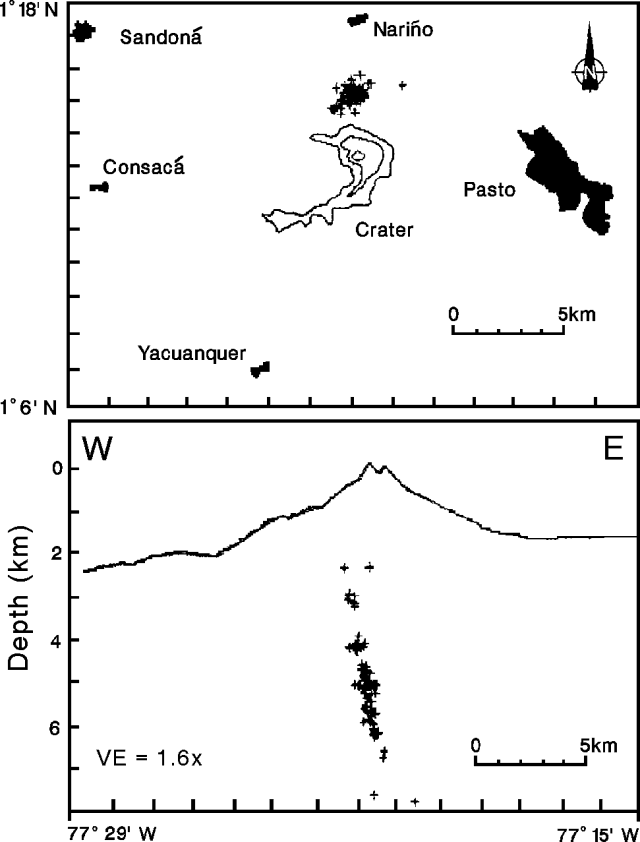 |
Figure 67. Locations of high-frequency earthquakes at Galeras, 26-30 April 1993. Courtesy of INGEOMINAS. |
"Screw-type" events, monochromatic long-period events characterized by a long, slowly decaying coda, reappeared on 8 April. A total of 18 of these events was recorded in April, the most significant at 0619 and 1030 on 10 April and at 0926 on 29 April, about an hour before an M 3.6 earthquake. This type of seismic signal has usually preceded eruptions, but was absent before the 4 April eruption. However, relatively small earthquakes, "hybrids between high-frequency and long-period," were registered at stations close to the crater. This activity, similar to that observed before other eruptions at Galeras, was more noticeable during the first half of the month, with swarms on 1, 2, 6, 8, and 9 April.
Information Contacts: M. Calvache, INGEOMINAS, Pasto.
Eruption produces 7-km-high column with ashfall 40 km away
Following no reported eruptive activity in May, an eruption on 7 June at 0343 produced a column that reached 7 km above the caldera rim and spread ash >40 km NE from the crater. Between 18 April and 7 June, 103 tornillos ("screw-type" seismic events) were registered, with frequencies of 1.3-6.7 Hz. The longest event, on 5 June, lasted 214 seconds.
Seismicity in May was characterized by the continued occurrence of tornillos, with a slow decline in their coda. High-frequency events, which decreased in number compared to April, were centered 3 km N of the active crater at depths of 3-7.5 km, the same location as April events. Other smaller earthquakes were located WSW of the crater at shallower depths. No deformation was detected at the "Crater" tilt station. . . during May. The "Peladitos-2" station (1.6 km E) showed a 2-µrad inflation towards the N. Land-based COSPEC measurements of SO2 flux were low, ranging from 30-466 tons/day (t/d). A low level of fumarolic activity from the main crater was observed during aerial inspections.
The eruptive activity on 7 June was similar to that of 23 March (18:3), with ash emission and ejection of minor amounts of incandescent lapilli and blocks. The eruption lasted for 15 minutes, saturating the seismic stations for 120 seconds. Approximately 300 long-period earthquakes followed the eruption. Ashfall caused the temporary closure of the airport NE of Pasto, and a Notice to Airmen about ash from Galeras was issued at 1215. Ashfall was also reported from El Borde, ~100 km N. Seismicity remained high throughout the day. Another smaller eruption, consisting mostly of ash with some small blocks, occurred at 2135. Volcanic activity then stopped and seismicity returned to normal levels. Long-period events preceded both eruptions. SO2 flux measured by COSPEC was extremely low (70 t/d) before the eruption on 4 June. COSPEC data from immediately after the eruption were not available. No evacuations took place and the summit area remains closed to all visitors.
Information Contacts: H. Cepeda and D. Gomez, INGEOMINAS, Pasto; T. Fischer, Arizona State Univ; ICAO.
Eruption on 7 June ejects >1.2 million cubic meters of material
A pyroclastic eruption that began at 0342 on 7 June was the fifth eruption of 1993 and ejected the largest amount of material (18:5). A dense eruptive column formed rapidly and rose 7 km above the crater rim, with a halo of incandescence at the base that extended 1 km up the column. Lightning was caused by ionization of the atmosphere, and military personnel within 4 km of the crater reported jet-like sounds at the start of activity. This eruption was registered by the seismic network for a total of 18 minutes, with 26 seconds of small-amplitude tremor followed by 2 minutes of long-period seismicity, and then 15 minutes of spasmodic tremor. There were 354 long-period earthquakes registered in the 17 hours after the initial eruption; these gradually decreased in size and number during the last 7 hours. Overflights after the initial eruption (0700 and 1715) revealed no substantive changes in crater morphology, although fresh deposits of ash and other pyroclastic materials were observed. Gas emission was concentrated on the W side of the crater and on the upper part of the active cone. A second eruptive phase began at 2137, with tremor lasting 93 minutes. Pulses of emissions produced a low-altitude eruptive column with incandescence and lightning. No deformation related to the eruptions was detected by electronic tiltmeters on the upper parts of the volcano. SO2 had returned to low levels the day after the eruptions.
The initial eruption was directed N38°E. Ballistic projectiles with diameters <=30 cm were found up to 1 km from the active cone and fragments <=50 cm in diameter were found up to 500 m away. Lapilli <15 mm in diameter were observed up to 6 km NE of the crater (figure 68). Ash was distributed by the wind to the N, reaching a maximum thickness no greater than 5 mm. Finer material was blown up to 110 km away, covering an area of ~5,000 km2 (figure 69). An estimated 0.65 x 10⁵ m3 of ballistic projectiles and 11.9 x 10⁵ m3 of ash was distributed by the wind. The total of 12.6 x 10⁵ m3 is the greatest volume of material ejected in the current active period (figure 70).
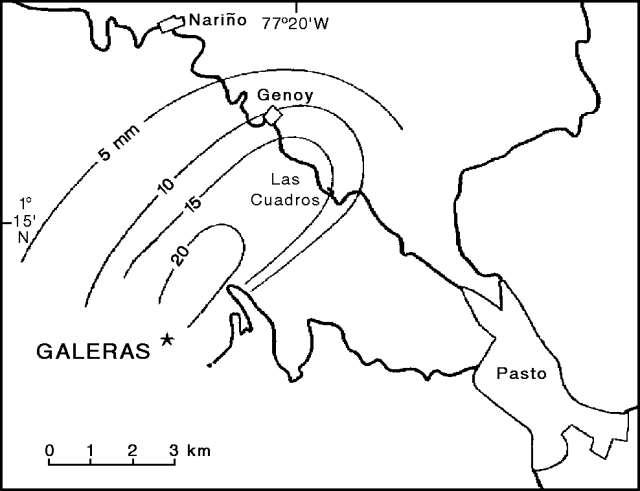 |
Figure 68. Isopleth map of lithic fragment distribution from the 7 June 1993 Galeras eruption. Isopleth values are in millimeters. Several roads leading to Pasto are indicated. Courtesy of INGEOMINAS. |
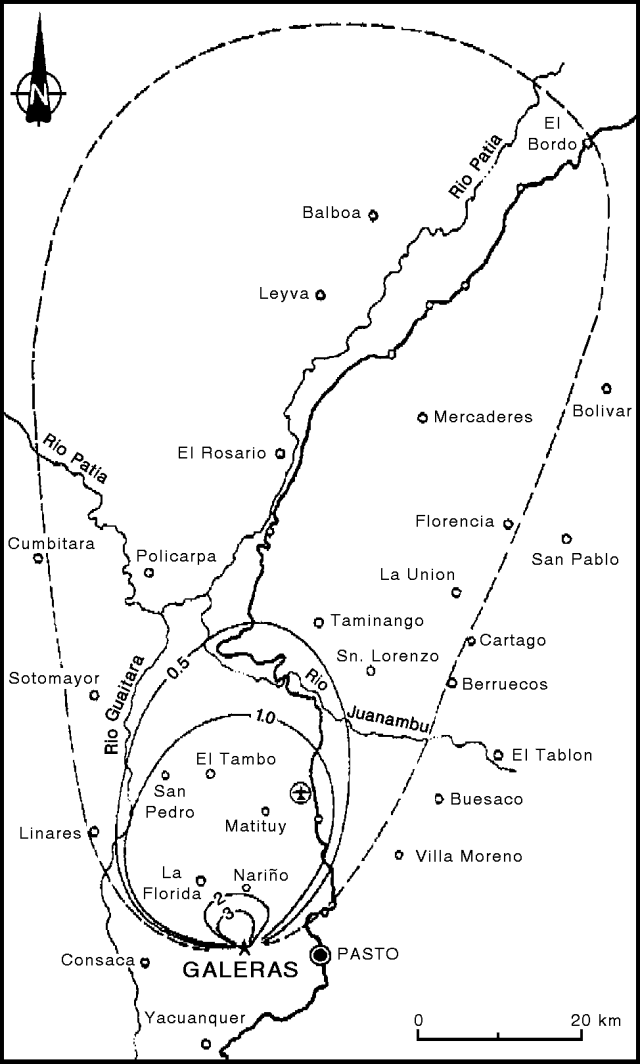 |
Figure 69. Isopach map of ash emitted during the 7 June 1993 Galeras eruption. Isopach values are in millimeters; dashed line indicates the approximate limit of fine ash distribution. Location of airport shown by airplane symbol in circle. Courtesy of INGEOMINAS. |
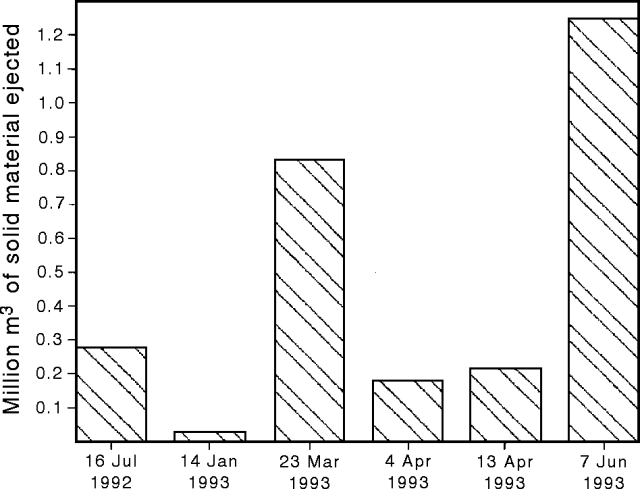 |
Figure 70. Comparison of volume of material ejected by recent eruptions at Galeras, July 1992 to June 1993. Courtesy of INGEOMINAS. |
Except for the interval immediately following the 7 June eruption, both long-period and high-frequency seismicity were generally low in June. Between 18 April and 7 June, 104 long-period tornillos ("screw-type" seismic events) were registered; the last was 3 hours before the eruption. Hybrid events (between high-frequency and long-period) named "butterfly-type" events, were detected 4-7 June. These were located around the W side of the active crater at depths <1 km and had magnitudes <1.8.
Information Contacts: M. Calvache, INGEOMINAS, Pasto.
Seismicity remains low
Seismicity has generally remained low following the 7 June eruption. In the first half of July, "screw-type" long-period events were detected at a rate of ~1/day. Shallow "butterfly-type" events (hybrid between high-frequency and long-period) at depths of 1.2-1.5 km and M 0.6-1.4 began increasing in mid-July, reaching a maximum of 66 events on 20 July. A M 2.6 long-period event also occurred on 17 July, centered within the E part of the volcano at depths greater than the "screw-type" or "butterfly-type" events. Most of the seismicity was registered at the seismic station 0.9 km NE of the summit. After this brief increase, seismic activity decreased to low levels by the end of the month and remained low through August. Most events registered in August were "butterfly-type" earthquakes, the greatest number of which were detected on 7-12 August, with a maximum of 255 events/day. After this swarm the number of daily events returned to previous values. Only 8 "screw-type" events occurred in August, with durations of 32-100 seconds. Seismicity in August was characterized by high-frequency events, generally located at shallow levels NW of the active crater, with magnitudes between 0.7 and 1.6 and depths of 0.3-8.0 km.
Observations during overflights in July and August revealed continued minor degassing at most of the fissures in the active crater, with the exception of the "Florencia" fumarole and the "Chava" fissure SW of the crater rim. Weak emissions were producing columns rising <10 m above the vents. COSPEC measurements of SO2 flux were low, ranging from 31-233 t/d. Rockslides from the inner walls of the main crater were seen during a 3 July overflight. Electronic tiltmeters continued to show great stability in July and August, similar to recent months.
Information Contacts: M. Calvache, INGEOMINAS, Pasto.
Fumarolic activity continues; seismicity remains low
Volcanic activity remained low in September and October. Electronic tiltmeters located 0.9 and 1.6 km from the summit on the E flank showed no changes, continuing the stability of recent months. Fumarolic activity was concentrated in the W sector of the summit, in the Chava crater and Florencia fumarole. During overflights of the active cone, gas emissions in the W sector were unchanged. The SO2 concentration in the gas column was low at the end of October.
The amplitude of minor background tremor varied at some seismic stations after 13 September with a dominant peak at 3.4 Hz. Additionally there were tremor episodes on 28 and 29 September, with durations of 20 minutes and 9 minutes, respectively, which coincided with periods of heavy rain. Similar to August, most of the seismicity in September consisted of "butterfly-type" events (hybrid between high-frequency and long-period). A total of 1,783 "butterfly-type" events occurred in September, occasionally as swarms with up to 30 events/hour. There were 20 sporadic long-period "screw-type" events with long, slowly decaying codas. One occurrence on 14 September lasted for 127 seconds with a dominant peak amplitude of 3.8 Hz.
Seismicity in October consisted of sporadic long-period, high-frequency, and tremor events, which were accompanied by background tremor. In total, there were 1,097 "butterfly-type" events registered, the most common type of event during the month. Only 9 long-period "screw-type" events occurred in October. Locations of high-frequency earthquakes were dispersed around the crater of the active cone. Three earthquakes of M 2.2-2.6, felt in Jenoy (6 km NNE) and Nariño (7.5 km N), were associated with the seismic source 3 km N of the active crater that produced ~300 earthquakes in April 1993.
Information Contacts: INGEOMINAS, Pasto.
Conditions remain stable, but seismicity increases
Seismicity . . . measured 5.8 km SE of the crater was moderate to low in November. Seismic energy due to high-frequency events remained low for most of November, but rose dramatically at the end of the month. The largest number of high-frequency events took place on the 24th (26 events) and 29th (10 events). Low-frequency events occurred more uniformly during the month, with the largest number of low frequency events on 5-10 November (averaging 2.3 events/day).
About half the high-frequency events were of sufficient amplitude and frequency to be locatable. They were placed ~3.5 km N of the crater margin at 4-8 km depths. No events exceeded M 3.9. Ten events were felt at settlements 5-8 km from the epicenters.
In November no significant change was indicated by either direct visual observations of the crater, or dry tilt measured at instruments located 0.9 and 1.6 km from the crater. On 5 November the peak value of SO2 flux, estimated using on a 1 m/s (3.6 km/hour) wind speed, was 418 t/d. This is tiny compared to the values seen in May 1989: up to 5,000-10,000 t/d.
Information Contacts: INGEOMINAS, Pasto.
High-frequency earthquake swarms centered NNE of the crater
Seismic activity in December 1993 was characterized by continuing swarms of high-frequency events from the same region 3.5 km NNE that was active in late November. In total 200 high-frequency events were registered during December. Eight earthquakes were felt in the city of Pasto and in towns closer to the volcano during December; 10 events were felt in November. On the afternoon of 1 December, the largest event (M 3.3) took place with a focal depth of 3-9 km. From 4 to 30 December there were no reports of felt seismicity. On the evening of 30 December a M 2.7 event was felt in Pasto, followed by a swarm of 10 high-frequency events (M 1-1.5), at a depth of 2.4-7.0 km. Very few of the high-frequency events registered in December were located around the active crater. Six of the earthquakes, though, were fracture events located very close to the main crater at a depth of 2.3-2.8 km.
On 3 December, 63 butterfly-type events were registered. The number of events/day then decreased to 4 by 9 December, and remained low until 22 December. The daily number of events then increased through 28 December, reaching 130 events/day before decreasing again through the end of the month. On 27 December the only long-period screw-type event of the month was registered; background tremor was variable, with small changes in amplitude and frequency.
Electronic tiltmeters remained stable; variations during November and December corresponded to voltage changes when the battery runs low. SO2 output, measured by COSPEC, remained at the low-levels shown during most of 1993.
Information Contacts: INGEOMINAS, Pasto.
Seismicity declines; fluid-movement events detected
Following the earthquake swarm in late November and early December 1993, seismic activity returned to the low levels of previous months. During January, activity consisted primarily of rock-fracture events located at superficial levels and others at depths of <3 km around the active crater. The largest event (M 2.0), on 3 January, was located at a depth of 2.9 km. The deepest were at 2.5-8 km, centered ~ 3.5 km NNE of the active crater where the November and December 1993 swarms were located. One event was felt on 17 January (M 2.6), centered on the NNE source at a depth of 5.2 km. High-frequency butterfly-type events showed a periodicity similar to tidal patterns.
Long-period events associated with fluid movements, though few in number (14), were a new type of event detected in January. These events had durations of 7-64 seconds, with maximum amplitudes between 5.2 and 27.8 mm, and frequencies of 1-10 Hz. Variations in background tremor continued to be registered at the Crater-2 station located 1.6 km from the active crater.
Deformation data did not indicate variations on the surface of the volcano. However, on 18 January there were increases in both the tangential and radial components at the Peladitos tiltmeter (1.6 km E of the active crater) of 14.2 µrad, which may have been caused by electronic problems.
Information Contacts: INGEOMINAS, Pasto.
Numerous rock-fracture events, but other seismicity remains low
Seismic activity stayed at low levels in February (0-4 events/day); however, small variations in background tremor amplitude were noted. A large number of relatively small seismic events (2,810) were associated with rock fractures and fluid movement near the cone. There were a few rock-fracture events centered NNE of the crater. These "butterfly-type events" appear to be influenced by the gravitational field associated with the tides and by other external agents such as rain. No deformation changes were detected by E-flank electronic tiltmeters 0.9 and 1.6 km from the summit. Degasification was concentrated in the W sector of the cone at the "La Chava" and "Florencia" craters. SO2 flux, measured by COSPEC 15 times in January-Feb, stayed below 240 t/d, except on 15 February when it was ~480 t/d.
Information Contacts: INGEOMINAS, Pasto.
Low levels of seismicity, SO2 emission, and deformation
The number of seismic events, SO2 emission rate, and deformation were all low in March. Instruments detected a total of 2,247 "butterfly-type" events. These were characterized by small magnitudes, associated with rock fracturing and fluid movement at depths of <2 km within the active cone, and influenced by earth tidal movements and external agents such as rain. Rock fracture events of M <2.5, were located predominantly in the W and NNE sectors of the active cone. Background tremor was variable. There were also new occurrences of the long-period "screw-type" events that are associated with pressurization of the system. These events are important because they were registered before most of the explosive eruptions at Galeras between July 1992 and June 1993, when volcanic activity was low. Measurements of SO2 emission obtained by the mobil COSPEC method remained low (<780 t/d). Aerial observations of the active volcanic cone revealed no changes; gas emission continues to be concentrated in the W sector of the main crater. Electronic tiltmeters showed no deformation changes.
Information Contacts: INGEOMINAS, Pasto.
Seismicity and SO2-flux remain low; no deformation
Activity remained at low levels through April and May, similar to January-March of this year. Seismicity was characterized by small-magnitude "butterfly-type" events near the active cone, principally shallow earthquakes associated with rock fractures and fluid movement. It is possible that this activity is influenced by the gravitational field associated with tides (lunar-solar attraction) and by external agents such as rain. Sporadic long-period events are associated with fluid movement, and high-frequency events are associated with rock fractures.
Shallow "butterfly-type" earthquakes were frequent until mid-April, then decreased during May to an average of <10 earthquakes/day toward the middle of the month. High-frequency earthquakes reached a maximum of 3/day and were located mainly 3-4 km W and N of the summit at depths of 2-7 km. On 12 May, one of these earthquakes (M 1.9), was felt in Jenoy, 8 km N of the volcano. Five small-magnitude "screw-type" events were registered from 1 to 12 May. A tremor pulse on 27 May that lasted for ~15 minutes was possibly caused by magma-water interaction; it occurred during a time of strong rains in the region.
Electronic tiltmeters installed on the volcanic structure did not register any deformation in April or May. The SO2 measurements taken from the gas column during April revealed continued low emission levels. COSPEC measurements of SO2 in May were also low, with a variation of 50-798 t/d. Most fumarolic activity was toward the W side of the main crater.
Information Contacts: INGEOMINAS, Pasto.
Seismicity remains low; crater described and fumarole temperatures reported
Seismicity during June and July showed no significant changes. . . . Low-frequency seismicity was at very low levels during June, although a "screw-type" event did occur; this type of event was numerous before eruptions in 1992-93. Shallow "butterfly-type" activity during the first half of June was similar to May, when the number of events decreased notably. These small-amplitude, short-duration, high-frequency events, interpreted as caused by fluid movement or rock fracture at shallow depths (<2 km) near the active cone, increased in number in the second half of June and through July. During June the fracture events were located N of the volcano, near the source that was active during November-December 1993, with other fracture events to the NE or closer to the crater. Additional sources were W and S of the crater. Fracture activity within the crater consisted of very small magnitude events (M <2.3) at depths between 2.1 and 9.7 km.
The active inner cone was visited on 21 July 1994 by volcanologists from INGEOMINAS and the Univ de Montréal. The morphology of the cone was modified considerably by the eruptions of 1992-93, which seem to have progressively deepened the crater to the present level of 200-300 m (figure 71). Prior to dome emplacement during October-November 1991 the crater was ~ 150 m deep; after dome growth in 1991-92, the crater was ~80 m deep. A N-S trending fracture, named Novedad, now breaches the S crater rim. Partial collapse of the crater rim and blocks 10-20 cm in size were noted on the N side of the cone.
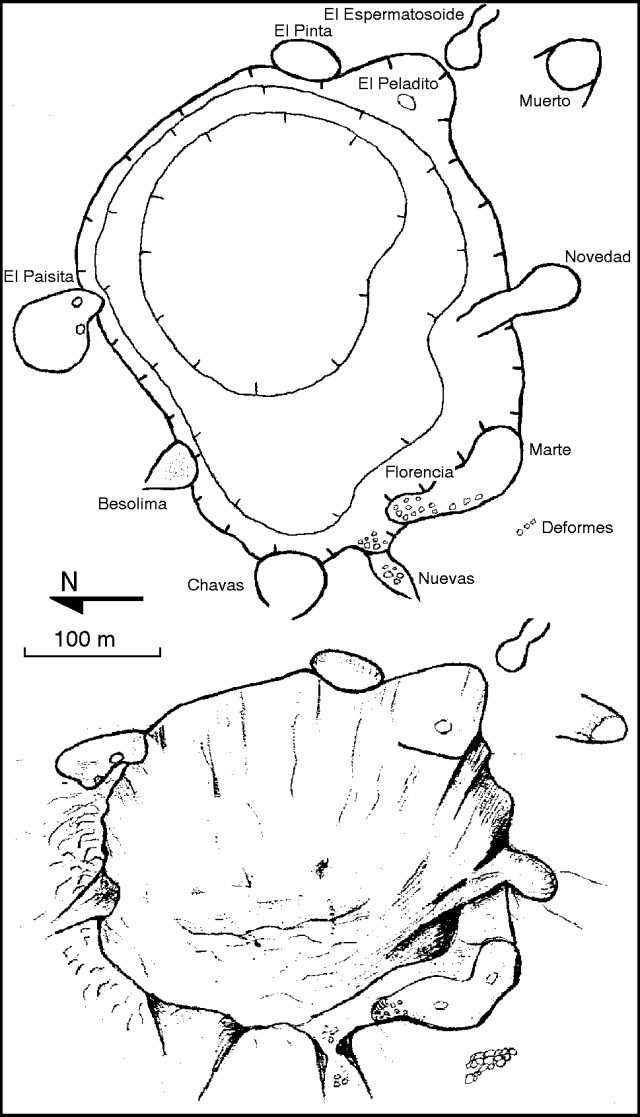 |
Figure 71. Sketch map (top) and perspective view (bottom) of the Galeras crater, July 1994. Small ovals represent fumaroles; crater depth is ~200-300 m. View is from the west. Drawn by Milton Ordonez, INGEOMINAS. |
Some low-pressure fumaroles were noted in the deepest part of the crater, but gas was being emitted mainly in the shallower W and SW sectors. At Deformes fumarole, on the SW flank of the cone, temperature was measured and gas samples were collected for analysis. Maximum temperature was 138°C, significantly cooler than the ~200°C recorded in December 1992 and January 1993 (Zapata G., 1992; Goff et al., 1993). Besolima, generally the hottest measured fumarole on the cone's outer flanks, had largely disappeared. Las Chavas fumarole showed very low activity with a maximum temperature of 105°C. A new fumarole near the W rim of the cone, named Nuevas, had temperatures of 208 and 392°C. This fumarole is in the area where Florencia fumarole and remnants of the lava dome (destroyed in July 1992) had temperatures of 640°C on 26 November 1992 (Zapata G., 1992).
Stationary COSPEC measurements of SO2 in June from five points around the volcano showed low levels of gases (18-176 t/d), similar to the measurements obtained using the mobile COSPEC (79-217 t/d). July degassing was concentrated on the W periphery of the active cone, with low concentrations of SO2 (<220 t/d) measured by COSPEC.
Electronic tiltmeter variations in June at the Peladitos station were 2.4 µrad in the tangential component and 7.8 µrad in the radial component. The Crater tiltmeter fluctuated in June due to electronic problems; no deformation was observed in July. On 7 July the Agua Tibia springs, located in the Rio Azufral valley 5 km W of the active cone, had a temperature of 21°C and pH of 5.
References. Zapata G., J.A., 1992, Visita al crater del volcan Galeras: INGEOMINAS Internal Report, 30 November 1992, 2 p.
Goff, F., McMurtry, G.M., Adams, A.I., and Roldán-M., A., 1993, Stable isotopes and tritium of magmatic water at Galeras volcano, Colombia: EOS, Trans. Am. Geophys. Union, 74(43), p. 690.
Information Contacts: R. Corredor and C. Gonzalez, INGEOMINAS, Pasto; J. Stix and M. Heiligmann, Univ de Montréal.
Long-period screw-type seismic events detected
Long-period "screw-type" events, associated with fluid movements, appeared again on 9 August 1994. There were 18 of these events during 9-26 August, with a maximum of 2/day. These events are called "screws" because of the similarity on a seismograph record to the profile of a screw with a fine thread. This type of signal is significant at Galeras because it preceded five of the six eruptions between July 1992 and June 1993. After the 7 June 1993 eruption (18:6), 94 of these signals were recorded in July, August, September, October, and November 1993, and sporadically in January, March, and May 1994, without being followed by an eruption. However, the lack of eruptions following these occurrences does not decrease their importance. These signals, similar to those that preceded the 7 June 1993 eruption, were also the most monochromatic that have been seen, with frequencies of 2.6-3.2 Hz and durations of 20-120 seconds. These events occurred around the volcano at depths of <3 km. Some small-magnitude earthquakes were located NNE of the crater at a depth of 3-8 km; this source has remained active since the last swarm of screw-type signals between November and December 1993.
SO2 flux measurements taken by the mobile COSPEC were low. Deformation equipment indicated no variations; apparent changes at one tiltmeter were due to electronic problems.
Information Contacts: INGEOMINAS, Pasto.
Long-period seismicity continues
Long-period screw-type events (monochromatic and with a slow coda decay) continued during September. The current episode of screw-type events began on 9 August. Compared to the episodes that preceded five eruptions at Galeras during 1992-93, this episode was more intermittent, with periods of several days between events. From 9 August to 23 September there were 29 screw-type events, with frequencies of 2.4-8.5 Hz and durations of 20-180 seconds. These events were associated with pressurization phases in the volcanic system, and gas emission.
Distinct screw-type events took place until 23 September, when 100 minutes of 7.8 Hz tremor were recorded at the station 900 m NE of the crater. The tremor episode corresponded to an increase in the gas emission rate, according to aerial observations and mobile COSPEC SO2 measurements. After the tremor, a small swarm of short-duration long-period events occurred, which in the past have been associated with gas emission. This behavior, although on a smaller scale, was similar to that during and after the July 1992 and January, March, April, and June 1993 eruptions. Seismic activity stayed at low levels through the end of September; superficial low-magnitude events were related to fracturing and fluid movement (butterfly events). Low rates of deformation and SO2 emission continued.
High-frequency seismicity was located in several sectors around the volcano; the most significant activity was from a source 3.3 km NNE of the active cone, where three earthquakes originated that were felt in Pasto (9 km E) and villages such as Jenoy, Nariño, and La Florida. An earthquake on 5 September had M 2.6 and a depth of ~8.6 km. Two earthquakes on the 28th had M 2.2 and 2.9 with depths of 7.1 and 8.8 km, respectively.
Information Contacts: INGEOMINAS, Pasto.
Sporadic screw-type seismic events; SO2 flux of 38-832 metric tons/day
During October activity at Galeras remained low. In terms of seismicity, on 20 October sporadic "screw-type" events reappeared. Screw-type events are comparatively monochromatic and with slowly decaying coda (late arriving) waves. They were so-named because their seismograph records look similar to the profile of a finely threaded screw. They are considered significant because they preceded five of the six eruptions between July 1992 and June 1993; on the other hand they have also occurred without being followed by an eruption. During October, seismic stations located 0.9-2.4 km from the active crater detected seven screw-type events. The codas of the screw-type events had durations of 31-63 seconds and a computed damping coefficient of 0.02. The seismic signals detected at all three stations had the same dominant frequency, ~ 2.5 Hz, and the spectra ranged from ~ 2.4 to 10.3 Hz.
Small earthquakes (M<2.4) took place at depths up to 5 km. These earthquakes had epicenters clustered beneath and around the active crater, most plotting within a radius of ~4 km. Butterfly-type events also took place. The SO2 flux obtained by the mobile COSPEC method showed fairly low values: 38-832 t/d. Degassing continued to be concentrated chiefly on the active cone's W fringe with smaller fumaroles at the interior of the main crater.
Information Contacts: INGEOMINAS, Pasto.
Seismicity, deformation, and SO2 flux at low levels
. . . Galeras displayed weak seismicity and deformation during November. Both tremor and long-period screw-type events (monochromatic and with a slow coda decay) continued. In addition to these signals, earthquakes took place. Some were located in the volcano's W sector at superficial depths. Others were located on the NW flank 3.5-4 km from the crater at 2-3 km depth. A third group struck on the NE flank in an area activated on previous occasions. Tiltmeters showed no significant change during November.
Tremor on 4 November lasted for 16 minutes (starting at 1638), on 5 November, for 43 minutes (starting at 1942). Coincident with the tremor, increased rain fell and a rise in mud flows was noted on the Azufral river in the W sector.
Airborne observers flying over the main crater noted a migration and an increase in the release of fumarolic gases. The escaping gases had migrated toward the external western wall of the cone and they concentrated along a tangentially oriented crevice and in some key fumaroles of this area. Nevertheless, the monthly SO2 measurements yielded low flux values for November.
Information Contacts: INGEOMINAS, Pasto.
Low seismicity characterized by "screw-type" events
Seismicity remained low in December, characterized principally by "screw-type" events (monochromatic signals with a slow declining coda) associated with pressurization phases within the volcanic system. At the beginning of the month activity was associated with rock fractures in the W sector of the active cone at depths of <3.5 km. The largest earthquake of the month, on 7 December in the W sector of the crater, was M 2.7. "Screw-type" events have been registered periodically since 20 October; 43 of these events were detected during December. The durations of these signals, taken from the analog register at the Crater-2 station, were within a range of 12-330 seconds. The latter value, from 7 December, is the longest duration recorded. Dominant frequencies were within the range of 2.19-3.48 Hz. Frequencies decreased in December to 2.24 Hz until a sharp change on 13 December to 3.13 Hz before stabilizing around this value.
Electronic tiltmeters increased their noise level because of climatic conditions; however clear stability and a minor change at the Peladitos tiltmeter started on 17 December. The ground stability was corroborated by measurements of the short leveling-line network. COSPEC measurements of SO2 showed low values of 22-50 t/d, consistent with the low degasification observed during overflights.
Information Contacts: INGEOMINAS, Pasto.
Continued fumarolic activity and low SO2 values; new type of seismicity
Activity during January and February consisted of slow gas release, decreasing the chances of an eruption in the near future. Overflights on 6 and 9 January revealed no changes in the fumarolic activity. On 23 January a visual inspection of the active cone from the police station revealed increased fumarolic activity in the W sector. In several visits to the summit, the principal points of gas emission were La Joya, Las Deformes, Las Chavas, and El Paisita fumarolic areas, and low-pressure zones on the interior of the main crater and the inside W crater wall (figure 72); fumarolic columns rose <30 m. Temperature measurements at Las Deformes and La Joya fumaroles (average 130°C) showed a small decrease compared to 21 July 1994.
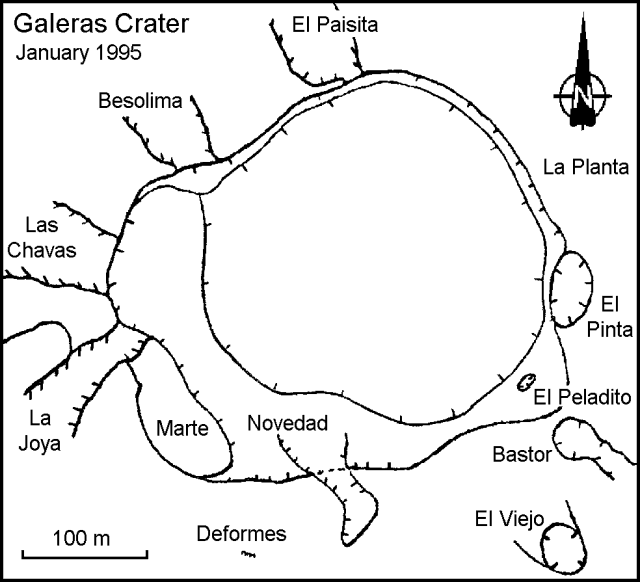 |
Figure 72. Sketch map of the Galeras summit crater, 24 January 1995. Courtesy of INGEOMINAS. |
SO2 measurements obtained by COSPEC increased compared to December (2 remained stable during February (~200 t/d), and deformation measurements showed no variations.
A total of 89 screw-type seismic events were recorded between 20 October 1994 and 9 January. These types of signals, associated with pressure in the system, preceded five of the six eruptions between June 1992 and July 1993. Long-period events were recorded after 9 January. A swarm of "butterfly" events (a hybrid long-period, high-frequency event) on 20 January was the first since July 1994; a peak of 210 events was recorded on the 21st. The number of high-frequency events was very low in early 1995, but increased slightly after 23 January. These signals, which have a similar wave form to long-period events, were located principally in the W sector of the active crater at depths of <4 km.
Shallow high-frequency seismicity in February was concentrated near the crater. There was also sporadic fracturing activity from the W part of the crater (small magnitudes with depths <6 km) and from a N source (M <1.9 and depths of 5-7 km). "Butterfly" events were observed through mid-Feb with an average of 50 events/day before decreasing to 15 events/day toward the end of the month. These events were concentrated near the active cone, at depths <1 km. Few long-period events occurred during the month, but after 26 February a new type of high-frequency signal (called "Pseudo-Screw") began with dominant peaks of 8-10 Hz.
Information Contacts: INGEOMINAS, Pasto.
Earthquake on 4 March kills six people and precedes more felt earthquakes
According to INGEOMINAS, at 1823 on 4 March a M 4.7-4.8 earthquake struck Galeras's NE flank (figure 73). The USGS National Earthquake Information Center (NEIC) reported the earthquake as M 4.5. The preliminary location for the event was provided by the Observatory's network (stations 0.9, 1.6, 2.1, 11.0, 5.0, 5.5 and 9.0 km from the active crater); the hypocenter (at 1.26°N, 77.33°W) was ~4 km NE of the active cone at 13 km depth. Signals from the earthquake saturated all of the stations in the local network; the earthquake itself was clearly felt in SW Colombia's in the E part of the Department of Nariño.
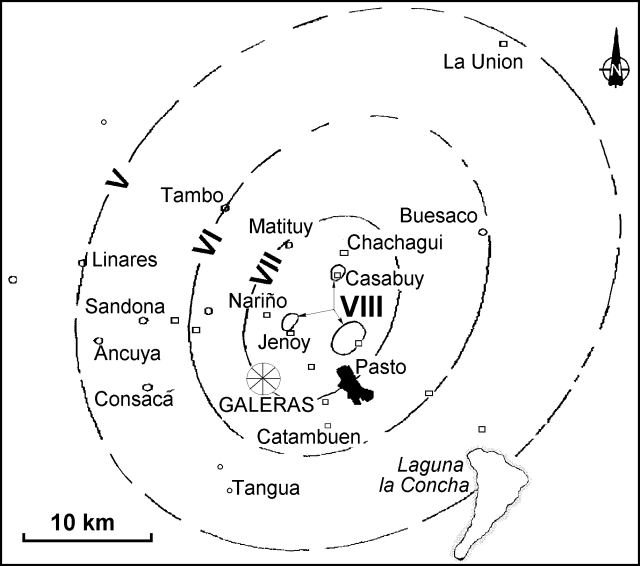 |
Figure 73. Isoseismal map of the 4 March earthquake near Galeras prepared using the European microseismic scale. Courtesy of INGEOMINAS. |
During the 3 hours following the event there were 130 aftershocks, at least 11 felt, the majority with magnitudes between 2.6 and 3.6 (figures 74 and 75). Subsequent events tended to decrease in magnitude, but some were still felt near the epicenter. Two relatively strong aftershocks took place 6 days after the initial earthquake (at 0017 and 0632 on 10 March), M 4.1 and 3.8, setting off a second swarm of declining aftershocks (figure 75). During 4-31 March approximately 1,440 aftershocks took place from the same area (figures 74, 75, and 76). At least 67 aftershocks were felt; the last, at 0804 on 29 March, was M 2.1.
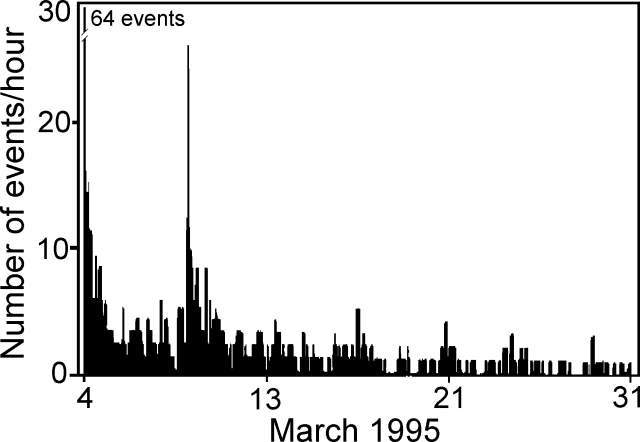 |
Figure 74. Histogram showing the number of seismic events/hour following the 4 March earthquake near Galeras. Courtesy of INGEOMINAS. |
 |
Figure 75. Plot of earthquake magnitude with respect to time following the 4 March earthquake near Galeras. Calculated magnitude values (M) were based on a function of the earthquakes duration. The graphic includes only earthquakes whose amplitude is >=2.5 m/sec. This value was the minimum classification parameter at "Crater-2," a station 1.6 km S of the active crater. Courtesy of INGEOMINAS. |
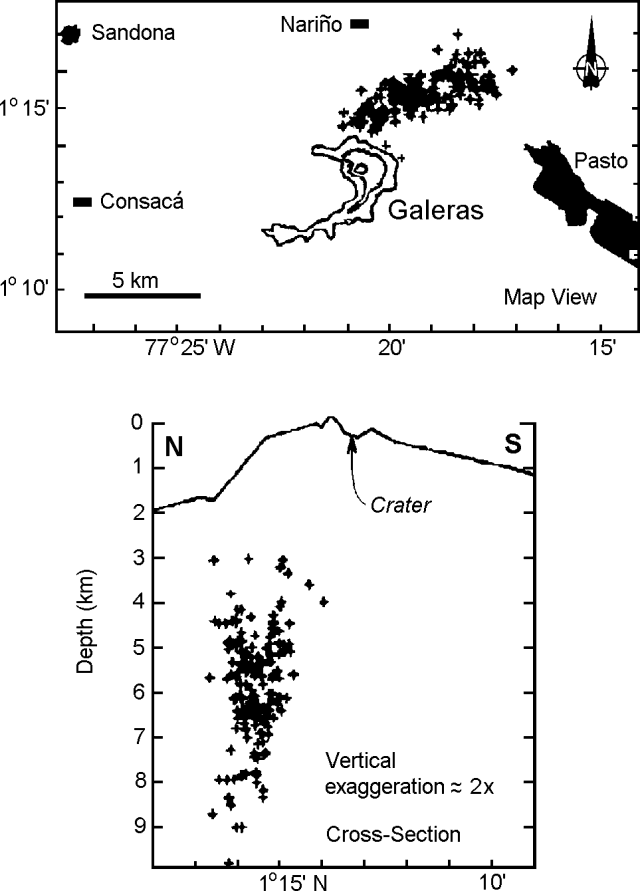 |
Figure 76. Map showing seismicity near Galeras (top), and vertical N-S cross-section (bottom) showing the pattern of located earthquakes, 4-31 March. Courtesy of INGEOMINAS. |
Large measured tilt coincided with the main shock. The maximum tilt changes were registered by electronic tiltmeters as 3 µrad, and by short leveling line vectors as 15 µrad. The tiltmeters returned to their previous levels almost immediately; the short leveling line vectors returned in a few days.
The epicentral area basically corresponded to the rural municipalities of Pasto . . . and other adjacent towns (figures 73 and 76), settlements with houses that were for the most part single-level and of rudimentary adobe construction. The houses were seriously affected and INGEOMINAS reported that some were ". . . damaged so badly as to be ready to collapse, also with caved-in roofs and loose tiles, that made living in them impossible and insecure. In the city of Pasto the constructions most affected were the antiquated structures . . . ." INGEOMINAS also related that: "In one neighborhood to the N of the city, the principal earthquake caused the loosening of blocks on a slope that fell on a nearby house, causing its destruction and killing 6 of its inhabitants. Other effects related to the main shock and its aftershocks were loud noises and small landslides on slopes near the wagon trails close to the epicentral region." NEIC reports stated that eight people were killed and four were injured. They mentioned that there were ~250 aftershocks, and that over 50 houses were damaged or destroyed, many by seismically triggered mudslides.
INGEOMINAS noted that previous seismic swarms had similar or adjacent epicenters. In both April and November 1993 swarms of M < 4.5 were felt in the same epicentral region, although the 4 March earthquake was itself larger and associated with more energetic, more numerous, and more frequent aftershocks. Soon after the earthquake, on 6, 11, and 19 March, the local seismic system around Galeras registered unusual, high-amplitude seismic events possibly associated with an explosive eruption. During these events signal amplitude grew for a few seconds, rapidly escalated, and then quickly decayed, the entire event lasting perhaps two minutes. The high-amplitude part of the event generally caused many of the stations in the local system to saturate. Associated with these high amplitude events, people located ~6-9 km from the volcano reported loud noises suggesting that an explosive eruption may have occurred. This hypothesis was unconfirmed due to poor visibility.
Other than these large earthquakes at Galeras, low- and high-frequency events and "butterfly" events remained low. The high- and low-frequency events were chiefly located at shallow depths (<3 km) near to, or just W of, the active cone. During the last days of March there were 12 "screw-type" events (<=3 events/day). The screw-type events had durations of up to 85 seconds and multiple constituent frequencies in the 1.5-7 Hz range. Screw-type events were registered before the majority of the 1992-1993 eruptive events and before some 1994-1995 degassing episodes.
As in previous months, the concentrations of SO2 obtained by mobile, ground-based correlation spectroscopy (COSPEC) remained <100 t/d. The volcano was clearly visible on various occasions, particularly at the beginning of the month, but the gas column was only visible a few times from the city of Pasto. At these times the column had heights under 300 m, and emission were coming from the W sector of the volcano. Sometimes, when the column was blown E, sulfurous odors were reported.
M. Calvache recently sent us color photographs showing Galeras's summit morphology in December 1991, March 1993, and March 1995. The December 1991 image was most suitable for black-and-white reproduction (figure 77).
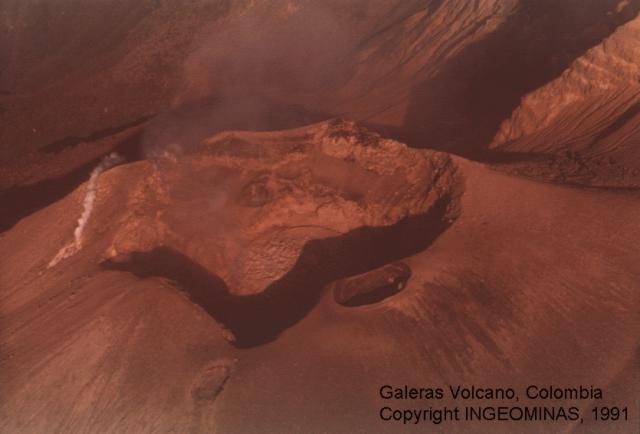 |
Figure 77. Galeras's summit area viewed from the SE in December 1991. Deformes fumarole (left center) and the small elliptical El Pinta crater (right center on crater rim) are still present in 1995 (see sketch map in 20:2). CCourtesy of INGEOMINAS. |
Information Contacts: INGEOMINAS, Pasto; NEIC.
Earthquake swarm continues; higher pressure gas emissions
Volcanic activity was relatively low in April. During approximately 1-20 April there was an increase in the pressure of gas emissions. Heavy rains on 12 and 18 April caused mudflows along the W-flank Azufral river that reached heights of 5 and 15 m, respectively, above the usual water level in narrow sections of the canyon. These two events were detected by the seismic network at Galeras.
A high-frequency earthquake swarm (magnitudes up to 2.3) on 14 April associated with rock fracturing (15 events within 100 minutes) was located at depths of 1.5-4 km below the summit. Ten other high-frequency events had dispersed epicenters at depths of <5 km. Four nearly monochromatic long-duration earthquakes with slowly decaying codas (screw-type events) occurred during 19-20 April. Screws were not detected after increased gas emissions on 22 April sent a plume ~2 km high that was seen from Pasto (~9 km E).
The earthquake swarm NNE of the active crater that began in March continued in April, but with fewer and lower-magnitude events. However, there were two events felt in Pasto and in the towns of Jenoy and Narino on 3 and 27 April. By the end of April there had been 1,967 events from this source since 4 March, of which 67 were felt in small towns near the epicenter.
Information Contacts: INGEOMINAS-Observatorio Vulcanologico y Sismologico de Pasto (OVP), Apartado Aereo 1795, San Juan de Pasto (Narino), Colombia (URL: https://www2.sgc.gov.co/volcanes/index.html).
Gas emission pressures remain high, but seismicity is low
Volcanic activity remained low during May. Seismicity was characterized by 3-4 fracture events/day associated with a source ~3-5 km NNE of the volcano at depths of 3-13 km. Most of these M <=2.2 events were detected only by seismometers of the Galeras network. The two most notable events during the month were on 18 May at 1011 (M 4.2) and 1124 (M 3.8). These were felt by the inhabitants of Pasto and nearby towns. This activity was similar to that in April and November 1993 (BGVN 18:04 and 18:11), when there were swarms of ~500 earthquakes from a source NNE of the volcano. The activity also resembled the >2,000 aftershocks of the 4 March (M 4.5) earthquake (BGVN 20:03).
Screw-type events, characterized by a semi-monochromatic record with a slowly decaying coda associated with fluid movement, disappeared after 2 May. Conventional long-period events continued. Butterfly-type events similar to previous months were observed with sporadic variations in background tremor and small pulses having a possible volcanic association.
Increased pressure of gas emissions, which started in April (see BGVN 20:04), persisted, especially at the craters and W-sector fumaroles of the active cone. Aerial reconnaissance indicated that strong rains in April and May contributed to the increase of gas and vapor emission in the main crater. COSPEC measurements revealed low SO2 emission levels. Deformation stations recorded no significant changes.
Information Contacts: INGEOMINAS-Observatorio Vulcanologico y Sismologico de Pasto, AA 1795, San Juan de Pasto, Narino, Colombia (URL: https://www2.sgc.gov.co/volcanes/index.html).
Minor gas emissions and seismicity
Observations during June-July revealed continued low levels of gas emission from fumaroles and craters in the W sector of the active crater. Long-period seismic events, associated with gas movement, decreased in June compared to previous months. SO2 flux measured by COSPEC was correspondingly low during June, averaging of 100 metric tons/day, and remained low in July. No significant deformation was detected during this period.
Seismicity in June consisted of fracture events from the source 2-6 km NE of the main crater, with a daily average of two events (M <=2.6) at 4-10 km depth. Two earthquakes within 4 minutes late on 17 June (M 3.6 and 3.1), caused by fracturing ~4 km SE of the volcano at ~6 km depth, were felt near the epicenter; small aftershocks were felt over the next few days. The epicenter of these events was near the Azufral river canyon, along which mudflows moved in April.
During 21 hours on 5 July an earthquake swarm of 35 events was centered NNE of the active crater; all events had M <2.3 and depths of 2-7 km. In the same zone on 28 July a M 2.8 volcano-tectonic event occurred that was felt in Pasto. Both the swarm and the 28 July event were associated with rock fracturing from the area active during April and November 1993, and March 1995. Seismicity related to magma movement decreased to six events during July. A significant shallow event on 26 July (figure 78) had similar characteristics to the sporadic events that have been registered since 6 March over the NW area of the caldera margin. These events are thought to be associated with the April 1995 landslide.
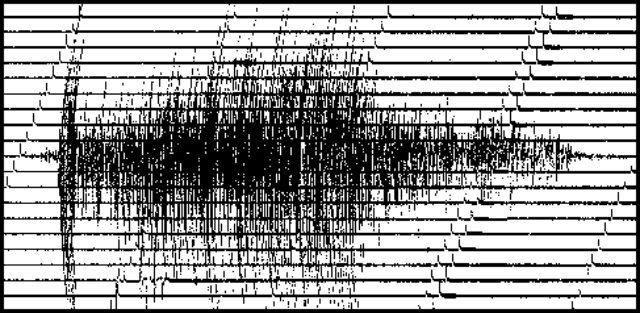 |
Figure 78. Seismogram of the event detected by the Cono Station at Galeras on 26 July 1995. Courtesy of INGEOMINAS. |
Information Contacts: Carlos Alberto Rey and Pablo Chamorro, INGEOMINAS - Observatorio Vulcanologico y Sismologico de Pasto, A.A. 1795, San Juan de Pasto, Narino, Colombia (URL: https://www2.sgc.gov.co/volcanes/index.html).
Minor seismicity and fumarolic emissions
Activity during August-October remained low. Fumarolic emissions continued from areas near the active cone, with a concentration of fumaroles on the W part of the summit. SO2 concentrations, obtained by the COSPEC method, remained generally low at 53-170 metric tons/day in August and < 100 t/d in September. No deformation was detected by electronic tiltmeters during August-October. Temperature measurements at La Joya and Chavas fumaroles, as well as radon measurements, have begun in order to improve the surveillance.
High-frequency seismicity during August was centered NNE of the active crater, and consisted of events of M < 2.2 Seismic activity in September was characterized by volcano-tectonic events, located mainly in three seismogenic regions: W, SW, and NNE of the active crater. Most active was the NNE source, which has shown signs of reactivation since last March. Most earthquakes had magnitudes < 1.5. Four events during September were felt by local residents, on 3, 12, 15, and 16 September, with magnitudes of 2.5, 2.0, 2.7, and 2.7, and depths of 12, 5, 8, and 8 km, respectively. The 16 September earthquake occurred in the SW region and the other three events in the NNE region.
The most significant October seismicity consisted of high-frequency events NNE of the active cone at depths of 3-7 km; magnitudes were < 3. The largest earthquake, on the morning of 15 October, was centered ~3 km NNE of the cone at 7 km depth. It had a magnitude of 3 and was felt in Pasto, Jenoy, Narino, and in other local towns.
Information Contacts: Pablo Chamorro and Diego Gomez, INGEOMINAS - Observatorio Vulcanologico y Sismologico de Pasto, A.A. 1795, San Juan de Pasto, Narino, Colombia (URL: https://www2.sgc.gov.co/volcanes/index.html).
Fumarolic and seismic activity continue at low levels
Volcanic activity remained low during November and December. No significant surface changes were detected during this period, in agreement with electronic tiltmeter measurements on the E flank. Gas emission was concentrated in the W part of the crater, and the El Paisita, Las Chavas, La Joya, and Las Deformes fumaroles remained active. During 2-22 November there were temperature increases at Las Deformes and Las Chavas of 28 and 14°C, respectively. Correlation spectrometer measurements of the SO2 flux remained low (<100 metric tons/day).
There were a few small seismic events associated with fluid movement in November, and sporadic seismicity associated with rock fracturing 2-4 km NNE of the active crater. During December, high-frequency seismicity consisted of small events (M <2.6) concentrated in the seismogenic region 6 km NE of the crater. Local residents felt events on 4 and 29 December that were M 2.5 and 2.6, respectively. The first of these events was centered in the NE region at 5 km depth, and the second at 7 km SW of the crater at 8 km depth. Only three small long-period events were recorded.
Information Contacts: Pablo Chamorro, INGEOMINAS - Observatorio Vulcanologico y Sismologico de Pasto, A.A. 1795, San Juan de Pasto, Narino, Colombia (URL: https://www2.sgc.gov.co/volcanes/index.html).
Slight increase in seismicity, but still at low levels
Seismicity during January and February remained low, similar to previous months. The activity was characterized by fracture events at the seismogenic source 2-8 km NE of the main crater. One M 2.9 volcano-tectonic event from this source on 26 January was felt by residents in Pasto and near the epicenter. Earthquakes were also felt on 4 and 19 February (M 2.4 and 2.7, respectively). Long-period events associated with gas movement increased slightly at the end of January and early February, but remained at low levels. This activity was mainly characterized by tornillo signals (screw-type events) lasting 30 seconds. The dominant frequency of these events also declined in late January (figure 79). A similar pattern was observed before eruptions in 1992-93.
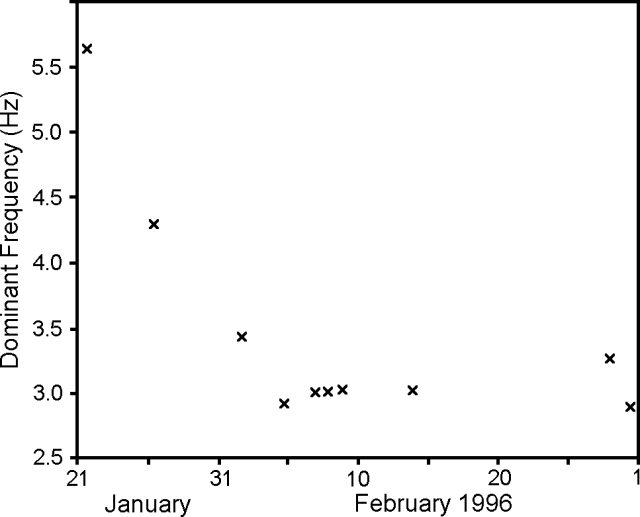 |
Figure 79. Dominant frequency of tornillo signals at Galeras, 21 January-1 March 1996. Courtesy of OVP. |
The two electronic tiltmeters showed no significant changes. SO2 measurements using COSPEC registered emission rates of
Information Contacts: Pablo Chamorro, INGEOMINAS Observatorio Vulcanologico y Sismologico de Pasto (OVP), A.A. 1795, San Juan de Pasto, Nariño, Colombia (URL: https://www2.sgc.gov.co/volcanes/index.html).
Small earthquake swarm and some tornillo events
Seismicity during March and April remained low, similar to previous months, and was characterized by fracture events at the seismogenic source 2-8 km NE of the main crater, generally at 6-10 km depths. Long-period events and tremor associated with gas movement also remained at low levels during this interval. Surface activity continued to be concentrated in craters and fumaroles on the W sector of the active cone, mainly at Las Chavas and La Joya fumaroles (figure 80). The two electronic tiltmeters and the shortline leveling network did not show significant changes. Measurements of SO2 done with the COSPEC method registered emission rates <100 tons/day in March, and <130 tons/day in April. Radon concentrations measured in March decreased with respect to recent months.
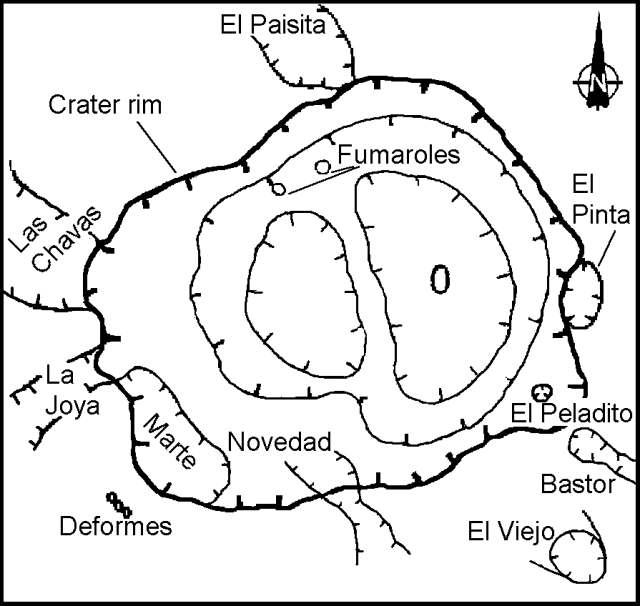 |
Figure 80. Fumaroles located around the main crater of Galeras, April 1996. Courtesy of INGEOMINAS. |
There were 11 Tornillo events (see BGVN 18:04) detected during 3-16 April with durations of 20-70 seconds, and dominant frequencies of 3.0-3.2 Hz. These characteristics are similar to those recorded before the 1992-93 eruptions (BGVN 18:01, 18:03, and 18:06). On 22 April a swarm of 11 small (M <1) events, recorded in about 45 minutes, were centered ~2 km NNE of the active crater at depths of 4.5-6.5 km.
Information Contacts: Pablo Chamorro, INGEOMINAS Observatorio Vulcanologico y Sismologico de Pasto (OVP), A.A. 1795, San Juan de Pasto, Nariño, Colombia (URL: https://www2.sgc.gov.co/volcanes/index.html).
Degassing and low seismic activity continue
Seismicity during May and June remained low, similar to previous months, and was characterized by fracture events centered 2-8 km NNE of the main crater, generally at 5-10 km depths. Surface degassing was still concentrated in craters, and fumaroles were located in the W sector of the active cone, mainly at the Chavas and La Joya sites. Correlation spectrophotometer (COSPEC) data indicated that SO2 was emitted around the volcano at rates of <100 tons/day. The deformation network did not show significant changes.
On 1 May, a M 1.6 event was felt. Moreover, on 20 May, an M 3.7 event occurred 10 km SE of the volcano that was felt by inhabitants of Pasto and in the epicentral zone.
In June, the coda magnitudes for seismic events had M < 1.7. High-frequency events with M < 2.3 were located near Rio Bobo, ~15 km SW of Galeras, at depths <14 km. In addition, during June the seismicity interpreted as related to dynamic fluids remained low, and the seismic network recorded 35 long-period events.
Information Contacts: Pablo Chamorro, INGEOMINAS Observatorio Vulcanologico y Sismologico de Pasto (OVP), A.A. 1795, San Juan de Pasto, Nariño, Colombia (URL: https://www2.sgc.gov.co/volcanes/index.html).
Shallow seismicity NNE of the active crater
Low seismicity during January and February was characterized by events NNE of the crater at depths of 2- 8 km. A source at 4-10 km depth generated 30 events with M <= 1.6 (figure 81). Long-period events remained comparatively infrequent: The average occurrence was one event/day, a trend similar to previous months.
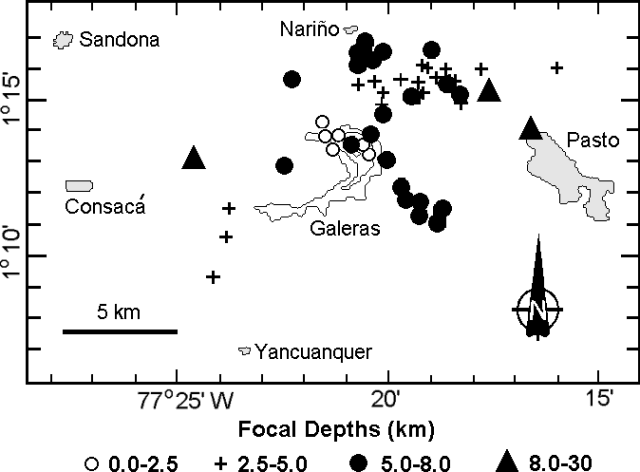 |
Figure 81. Seismicity around Galeras volcano during January and February 1997. Major towns are also shown. Courtesy of OVP-INGEOMINAS. |
Galeras deformation stations located 2, 4, and 7 km from the active crater typically inflated by 15 µrad.
Information Contacts: Observatorio Vulcanologico y Sismologico de Pasto, INGEOMINAS, Carrera 31, No. 18-07 Parque Infantil, PO Box 1795, Pasto, Colombia (URL: http://mafalda.univalle.edu.co/~ovp).
Low-level seismicity during May-August
Seismicity remained at low levels during May-August 1997. During this period 93 volcano-tectonic earthquakes were registered (figure 82) at a rate of <1 event/day, with coda magnitudes <2, except on 22 July. Although epicenters were scattered, most were located around the active crater area and N of the cone within a radius of 8 km. On 22 July an earthquake of M 3.1 was centered 8.5 km NE of the active cone at 8 km depth, over the Buesaco fault. This event was felt by the inhabitants of Pasto City and was accompanied by three aftershocks (M 2.3, 2.2, and 2.3). In addition, on 9, 20, 21, 29, and 31 July there were seismic hybrid events with high-frequency onsets and spectral contents between 1-10 Hz. The waveforms of these events were similar to spasmodic volcanic tremor; they first arrived at a station 2 km E of the main crater.
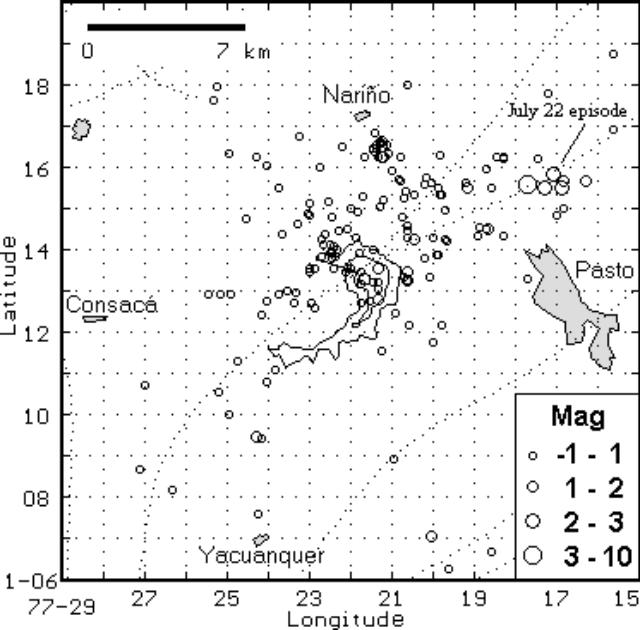 |
Figure 82. Volcano-tectonic seismicity at Galeras (center), May-August 1997. Four nearby cities are labeled. Courtesy of INGEOMINAS. |
Only 25 long-period events were registered from May to August. Some long-period events in May corresponded to monocromatic signals with a slowly decaying coda ("tornillos"), although durations were <35 seconds. Electronic tiltmeters 0.9 and 1.8 km from the active cone exhibited stability in their radial and tangential components. Peladitos-2 tiltmeter, at 1.8 km, recorded <1 µrad of change during the year. Gas emissions in the crater area seen from the observatory on 14 and 30 May and on 4 June were light in color and rose <200 m.
In July, as a complement to the cooperative program between BGR from Germany (Seminar Federal Institute for Geosciences and Natural Resources) and INGEOMINAS (Research Institute for Geosciences, Mining and Chemistry), a training course on "Geophysical Methods Applied to Volcano Monitoring" was developed. From this course two permanent telemetered seismic stations were installed 0.8 km E and 1.5 km NE from the crater. These stations are equipped with 3-component broad-band seismometers. Some aerial thermographic images obtained during the course showed hot points with surface temperatures up to 120°C.
Information Contacts: Observatorio Vulcanologico y Sismologico de Pasto, INGEOMINAS, Carrera 31, No. 18-07 Parque Infantil, PO Box 1795, Pasto, Colombia (URL: http://mafalda.univalle.edu.co/~ovp).
Continuing low seismic activity during September-October 1997
Visual and instrumental observations during September-October 1997 indicated continuing low-level seismicity. Some volcano-tectonic (VT) earthquakes registered above the background long-period (LP) seismicity.
Important VT events occurred in three different zones around the active cone as indicated in figure 83; "Source A" refers to the cone's immediate area, "Source B," to the SW of the caldera rim, and "Source C," to an area N and E of the crater that has been seismically active since 1993. During September-October, 62 VT events were recorded. On average, 1-2 events occurred per day; the maximum daily count was 11 earthquakes. Most events occurred <10 km below the summit; most shallow events were centered in the Source A area at depths <4.5 km (figure 84). On 12 October, a substantial concentration of activity in the Source A area included 10 VT events in ~ 30 minutes; the most energetic event was M 2.7, located 4 km below the crater. Source B was particularly active in the last week of October when there were several VT events of M 2.0-2.5 at depths generally from 3-10 km. Source C was the most active area. On 23 September, a M 2.2 event centered in Source C (5 km NNE of the crater) at a depth of 8 km was felt in Pasto.
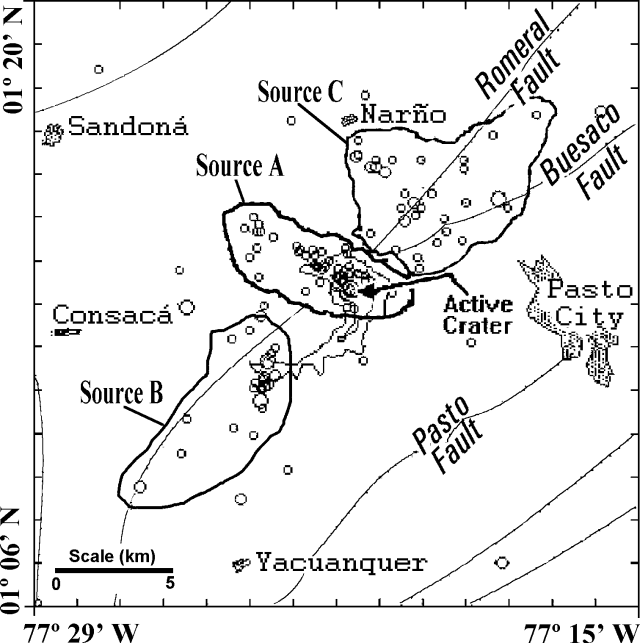 |
Figure 83. Epicenters of VT events recorded at Galeras during September-October 1997. Events are represented by circles of diameter proportional to magnitude. Some cities near the volcano are shown along with the source areas and some of the main fault systems in the Galeras region. Courtesy of OVP-INGEOMINAS. |
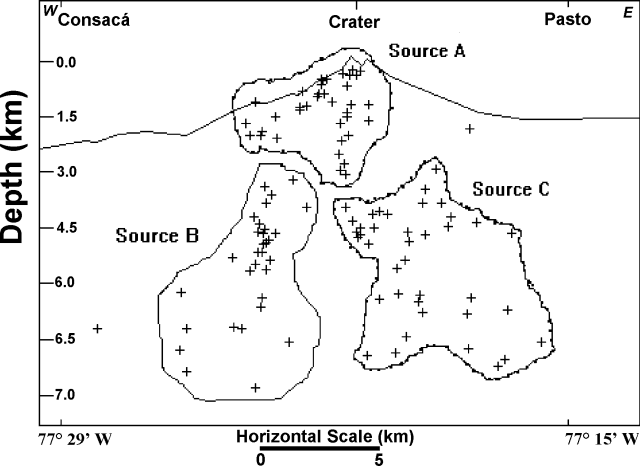 |
Figure 84. Hypocenters of VT events recorded during September-October 1997. The zones of activity are outlined. Courtesy of OVP-INGEOMINAS. |
Concurrent with these events, LP seismicity was observed sporadically at very low levels. Mariposa ("butterfly") events characterized as a hybrid between a VT and LP, generally showed low levels of energy and shallow depths below the active crater. Frequencies were similar to previous months. From the second week of October the daily number of Mariposa events increased (figure 85). This change was coincident with the increase in Source-B activity during the last week of October.
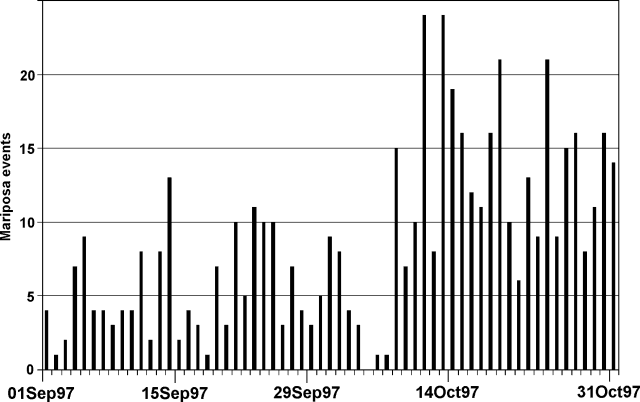 |
Figure 85. Daily occurrence of Mariposa events detected at Galeras volcano, September-October 1997. Courtesy of OVP-INGEOMINAS. |
Degassing and morphological change continued to be concentrated mainly toward the W side of the active cone; observations made in the last few months revealed no major changes. The electronic tiltmeter station at Peladitos (1.6 km E of the active cone) showed a general stability. However, after 9 October it recorded a slight change in radial and tangential components; this was also observed in the temperature channel. The changes could be related to the seismic activity (VT and Mariposa events) recorded during that period.
Information Contacts: Pablo Chamorro and Diego Gomez Martinez, Observatorio Vulcanológico y Sismologico de Pasto (OVP), INGEOMINAS, Carrera 31, No. 18-07 Parque Infantil, PO Box 1795, Pasto, Colombia (URL: https://www2.sgc.gov.co/volcanes/index.html).
Low-level seismicity includes "Screw-type" events
Low-level activity persisted in November and December 1997. Significant seismic events during this period included 13 long-period (LP) "Tornillo" or screw-type events. The screw-type events are characterized as quasi-monochromatic wave-forms with slowly decaying coda. They preceded eruptions in 1992 and 1993, although they have also occurred without clear surface manifestations.
Volcano-tectonic (VT) earthquakes recorded during November and December were concentrated in three zones (figure 86): around the active cone at shallow levels, 2-8 km to the NE, and 7 km to the SW. These events occurred at depths of 1-18 km below the summit. "Mariposa" or "Butterfly" earthquakes were also recorded. These are a hybrid of VT and LP events located at shallow levels. Three small episodes of spasmodic tremor were registered in December.
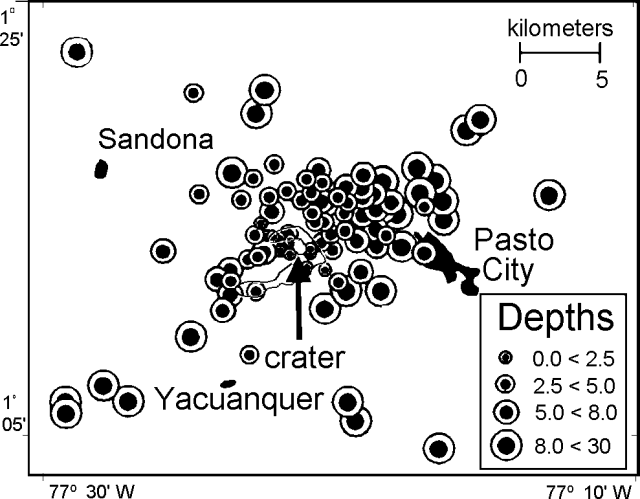 |
Figure 86. Epicenters of volcano-tectonic events recorded during September-October 1997. Circle diameters are proportional to depth below the summit. Courtesy of OVP-INGEOMINAS. |
Electronic tiltmeters installed in various locations around Galeras were stable through November and December. No changes were recorded. Venting of gases at the active cone continued from the fumaroles Anganoy, Urcunina, Alteradas, Deformes, and from the craters El Paisita, Las Chavas, and La Joya (figure 87).
|
Figure 87. Recent morphology of the active cone at Galeras volcano. Jagged lines represent fractures and black circles represent fumaroles. Courtesy of OVP-INGEOMINAS. |
Information Contacts: Pablo Chamorro and Diego Gomez Martinez, Observatorio Vulcanologico y Sismologico de Pasto (OVP), INGEOMINAS, Carrera 31, No. 18-07 Parque Infantil, PO Box 1795, Pasto, Colombia (URL: https://www2.sgc.gov.co/volcanes/index.html).
Continuing seismicity includes tornillo events
Seismicity continued at low levels around Galeras during March and April. Over this period 92 volcano-tectonic (VT) earthquakes were located; of these, 53 were in the area called the North Source (dashed box in figure 88). On 16 March at 2124 (GMT) a VT event with a coda magnitude of 2.2 was felt in Pasto City and other towns in the area. The event was centered in the North Source 2 km N of the crater at a depth of 5 km below the summit. The most energetic VT event outside of the North Source occurred on 29 April. That event struck SW of the crater with a coda magnitude of 2.1 and a depth of 6.5 km.
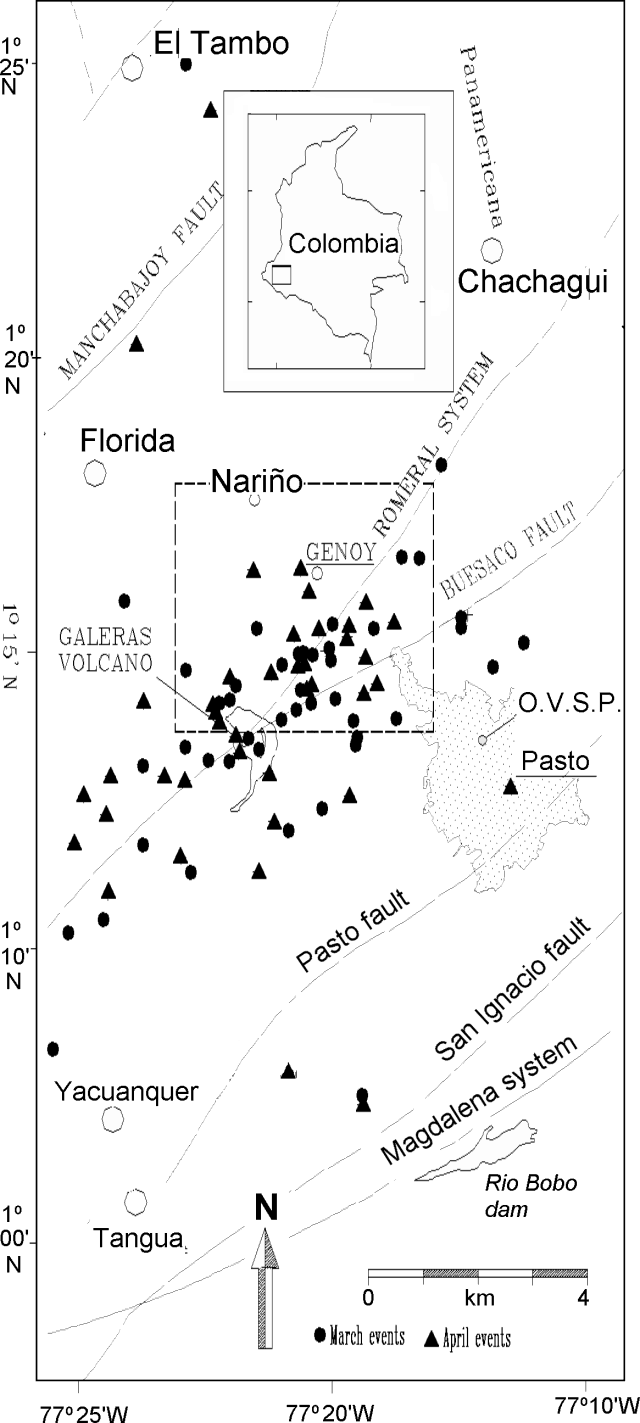 |
Figure 88. Epicenters of volcano-tectonic earthquakes surrounding Galeras that took place during March -April 1998. The North Source is outlined by the dashed box. Courtesy OVP-INGEOMINAS. |
Another aspect of seismicity during March and April was the continuation of Long Period (LP) events called Tornillos. Tornillo events characteristically have quasi-monochromatic wave-forms with slowly decaying coda values and hence leave a seismic record that looks like the threads of a screw. A record 38 such events have been recorded since November 1997 (BGVN 22:09 and 22:12). The last Tornillo was recorded 10 April.
On 19 April an event similar to spasmodic tremor was recorded. The cause was mud flow along the Azufral River, which runs west from the summit, resulting from heavy rain on volcanic deposits. The event lasted for about 1 hour.
Two electronic tiltmeters, located at the summit and on the E flank (figure 89), remained stable with minimum fluctuations during the period. Fumarole temperature, hot springs pH, radon, and gas-emission measurements showed no significant changes with respect to previous months. The Galeras Seismological Network monitors the volcano with five short-period and two broad-band telemeters, which are part of a cooperative project between OVP-INGEOMINAS (see below) and the German Federal Institute for Geosciences and Natural Resources.
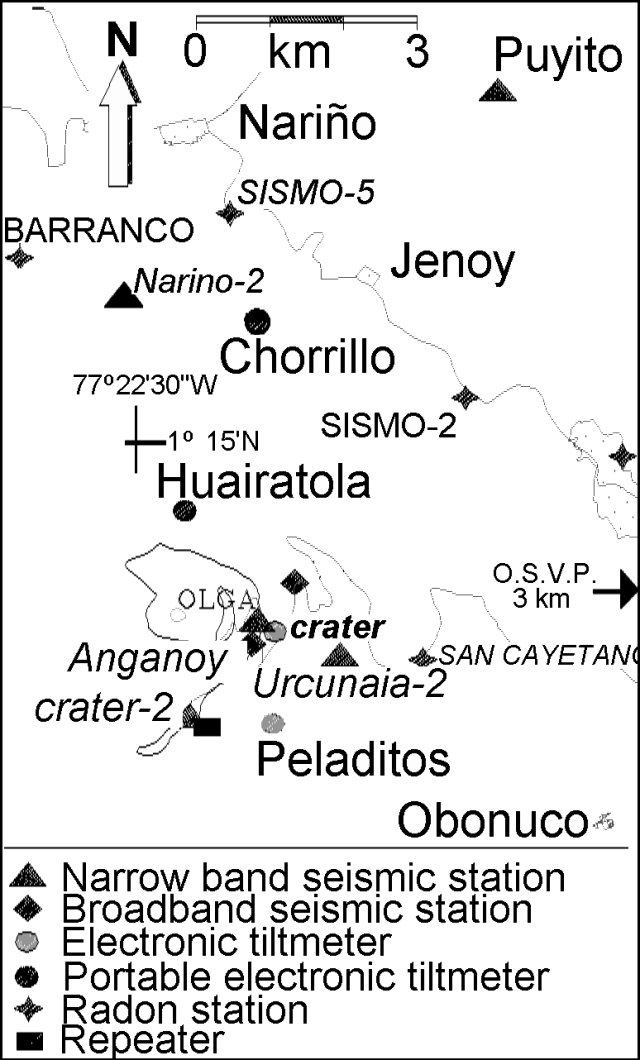 |
Figure 89. Galeras Volcano Vilgilance Network: monitoring equipment within 5 km of the summit. Courtesy OVP-INGEOMINAS. |
Information Contacts: Pablo Chamorro and Diego Gomez Martinez, Observatorio Vulcanologico y Sismologico de Pasto (OVP), INGEOMINAS, Carrera 31, No. 18-07 Parque Infantil, PO Box 1795, Pasto, Colombia (URL: https://www2.sgc.gov.co/volcanes/index.html).
Fracture-related seismicity continues
Since a volcanic crisis in February 1989 (SEAN 14:02-14:05), Observatorio Vulcanológico y Sismológico de Pasto (OVSP) has been constantly monitoring Galeras. The following is from their bi-monthly reports for late 1998.
During September and October 1998, low-level seismic activity continued at Galeras (figure 90). Most of the energy released (1.6 x 10¹⁶ ergs) was due to earthquakes associated with a fracture process. Volcano-tectonic earthquakes registered during these two months totaled 79, ranging from 0.5 to 16 km in depth. One remarkable earthquake occurred at 0209 on 21 September: it was located at 1°15.75'N, 77°19.16'W at a depth of 8 km, released 1.21 x 10¹⁶ ergs of energy, and had a coda magnitude of 3.4. This earthquake was felt in Pasto City and neighboring settlements. It was the most energetic event of 1998 to date.
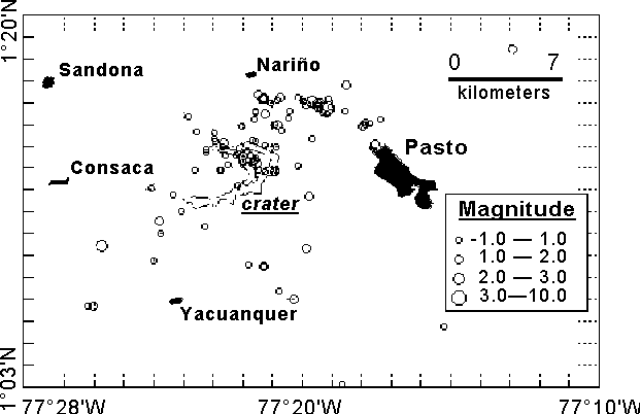 |
Figure 90. Location of seismic events at Galeras during September-October 1998. Courtesy OVSP. |
Seismic processes related to fluid dynamics (i.e. long-period events and tremor episodes) released a total of 5.18 x 10¹⁴ ergs. Of these events, nine had small amplitudes with long coda and quasi-monochromatic frequencies—so-called "screw type" or "Tornillo" characteristics. Coda values spanned 19-65 s and dominant frequencies ranged 1.82-4.0 Hz. An unusual event occurred 23 October, when harmonic tremor lasted approximately one hour. This episode released 7.09 x 10⁹ ergs.
Galeras, a 4,276 m high andesitic stratovolcano, has a cone that rises 150 m above the floor of the summit caldera. The caldera is open to the west. The active crater is located ~9 km W of Pasto, a city of 350,000 persons. More than 400,000 people live within the volcano's zone of influence. At least six major eruptions have been identified during the past 4,500 years, last in 1886. These eruptions were Vulcanian with inferred low-altitude eruption columns (<10 km) that produced small-volume pyroclastic flows. During the last 500 years eruptions have been characterized by gas-and-ash emissions, small lava flows, and pyroclastic flows that have traveled up to 15 km from the crater.
Information Contacts: Patricia Ponce V., and Pablo Chamorro C., Observatorio Vulcanológico y Sismológico de Pasto (OVSP), Carrera 31, 18-07 Parque Infantil, PO Box 1795, Pasto, Colombia (URL: https://www2.sgc.gov.co/volcanes/index.html).
Low seismicity; fumarole and tilt measurements
Seismicity remained low during January and February 1999. Volcano-tectonic (VT) earthquakes were common from two sources at depths of 0.2-18.8 km and had a coda magnitude range between -0.6 and 3. The first area was below the active cone, and the second was NNE of Galeras. The most significant VT event registered on 3 January at 0714 with a coda magnitude of 3, an epicenter ~14 km NNE of the volcano, and felt earthquakes in Pasto. Other types of VT events located toward the E flank have been called "trenes" (trains) because they are recorded consecutively, to make up packets of 2-5 events. They were small events, recorded at only four of the nine stations in the Galeras network. Those events had a depth range of 3.3-7.3 km and a coda magnitude range between -0.6 and 0.9.
Previous VT events at times have preceded seismic sequences, such as those during November-December 1993 and March 1995, as well as a small seismic sequence in July 1997. However, events have also been recorded in periods of no seismic sequences.
Quasi-monochromatic volcanic tremor episodes were recorded during 4-6 January. The maximum amplitudes were obtained on the E-W components of the broadband stations whereas the minimal amplitudes were recorded on the vertical components of those stations. The spectral frequencies show stable values with small variations of 0.5 Hz. Analysis of the tremor episodes suggested that the source directions of these events were toward the active cone of the volcano.
The electronic tiltmeter Peladitos, on the E flank of Galeras, showed stable behavior with small variations (<1 µrad) in both radial and tangential components. The Chorrillo and Huairatola portable tiltmeters showed stable behavior in the tangential components whereas the radial components continued a descending trend that began at the end of September 1998. Through 26 January, the cumulative decline in the Chorrillo radial component was ~35 µrad, and the Huairatola radial component decline was ~600 µrad.
Most of the radon stations showed stable behavior of the Rn-222 gas emission with changes <200 pCi/l. In contrast, the Meneses-1 station showed variations of ~ 3,300 pCi/l on an ascending trend; the Meneses-3 stations, ~2,700 pCi/l on a descending trend.
When the Alfa Deformes fumarole was measured in December 1998, it had a pH of 0.6. The next measurement, in May 1998, revealed a pH of 2.3, followed by a gradual decline to a value of 0.3 on 25 February. Measured fumarole temperatures generally remained stable, although the La Joya fumarole had increased to 181°C on 6 March from 148°C on 25 February. Scientists observed numerous fissures emitting gas during a summit visit, as well as cracks that could generate small landslides on the main cone.
Information Contacts: Observatorio Vulcanológico y Sismológico de Pasto (OVSP), Carrera 31, 18-07 Parque Infantil, PO Box 1795, Pasto, Colombia (URL: https://www2.sgc.gov.co/volcanes/index.html).
Low seismicity and variable Radon-222 fluxes during March and April
During March and April 1999, seismic activity continued at low levels, similar to those reported in previous months (BGVN 24:02). The biggest source of seismic energy release, 2.1 x 10¹⁵ ergs, was associated with volcano-tectonic (VT) events attributed to fracturing. In total, 75 VT earthquakes were registered, located at depths between 0.4 and 20 km below the summit. The largest event, on 3 April, had a magnitude of 2.7 and was located SW of the volcano. During this two-month period the sum of the seismic energy released by 46 long-period events and 27 tremor episodes amounted to 9.8 x 10¹³ ergs. Radon-222 emissions at four stations located around the volcano measured between 23 and 3,608 pCi/l, values similar to those seen in previous months.
Information Contacts: Observatorio Vulcanológico y Sismológico de Pasto (OVSP), Carrera 31, 18-07 Parque Infantil, PO Box 1795, Pasto, Colombia (URL: https://www2.sgc.gov.co/volcanes/index.html).
No eruptive activity through June 1999; seismicity and soil radon both low
The volcano remained in a non-eruptive state. During May and June 1999, low-intensity seismic activity has continued, similar to that reported in previous months. Instruments registered 90 volcano-tectonic earthquakes; their depths were between 0.30 and 19 km in relation to the top of Galeras; the energy released was 8.35 x 10¹⁴ ergs. They were spread broadly over the region.
Three small earthquake swarms were recorded. The first on 8 May consisted of five recorded events located to the NW of Galeras, and released 1.57 x 10¹³ ergs. The second on 14 May consisted of 15 events again located to the volcano's NW, and released 7.24 x 10¹⁴ ergs of energy. The third swarm on 29-30 June consisted of 15 events located NE of Galeras, and released 3.78 x 10¹³ ergs. The greatest magnitude event occurred during the second swarm on 14 May; it had a coda magnitude of 2.5 and a depth of 8 km.
In addition, 27 long-period earthquakes and six tremor episodes were registered, with a released energy value of 7.00 x 10¹² ergs. Tremor episodes had dominant frequencies of 2.4-2.6 Hertz. Periodic temperature measurements were taken in diverse fumaroles of the active crater; in May and June they registered highs of 122-390°C.
During May and June, Radon-222 emissions collected in the soil at about six stations arcing around the W, N, and E sides of the volcano in a 5-10 km radius from it showed no significant changes with respect to previous months. The highest Radon-222 emissions during the interval were recorded in late May at a station ~5 km NE of the summit (station "Sismo2"), where the maximum value was 3,369 pCi/l. For comparison, during May-June many stations yielded values in the range 750-1,200 pC/l.
Information Contacts: Observatorio Vulcanológico y Sismológico de Pasto (OVSP), Carrera 31, 18-07 Parque Infantil, PO Box 1795, Pasto, Colombia (URL: https://www2.sgc.gov.co/volcanes/index.html).
Seismicity remains low
During July and August 1999, low-intensity seismic activity continued, similar to that of previous months (BGVN 24:07). Fifty-six volcano-tectonic (VT) earthquakes were registered during this period compared to 90 during the previous two months. The depths of these VT events were between 0.35 and 19 km below the summit, and the total energy released was estimated as 4.82 x 10¹³ ergs. The largest magnitude event, on the morning of 16 July, had a coda magnitude 1.7 and depth of 8 km.
Additionally, 20 long-period events and 10 tremor episodes were recorded with an energy release of 5.38 x 10¹² ergs. Dominant frequencies during the tremor episodes were 2.0-4.0 Hz. The tremor event on 23 July had a small amplitude with respect to the long coda, a quasi-monocromatic frequency of ~2.01 Hz, and an energy release of 2.09 x 10¹² ergs. Periodic fumarole temperature measurements taken during the two-month period in the active crater registered a range of 130-394°C.
Radon-222 emissions measured in the soil at six stations were not significantly different from values in previous months. As in the May-June period, the greatest emissions occurred at the Sismo2 station (~5 km NE of the summit) attaining a maximum value of 2,297 pCi/l.
Information Contacts: Observatorio Vulcanológico y Sismológico de Pasto (OVSP), Carrera 31, 18-07 Parque Infantil, PO Box 1795, Pasto, Colombia (URL: https://www2.sgc.gov.co/volcanes/index.html).
Minor gas emissions and low seismicity, but some tornillo events
Low-intensity seismic activity continued during November and December 1999, similar to previous months. During this period, 66 volcano-tectonic (VT) earthquakes were registered, releasing a total energy of 5.03 x 10¹⁴ ergs. The VT events occurred at depths between 0.5 and 25 km below the summit within 20 km of the active crater. The largest magnitude event (coda magnitude 2.4) occurred NE of the summit on 28 December at a depth of 19 km. Fifty-six (56) long-period events (LP) occurred during this period (compared to 19 in the previous two months) releasing 6.53 x 10¹⁴ ergs. The most remarkable aspect of this seismicity was the occurrence of 15 tornillo events with dominant frequencies between 1.6 and 1.9 Hz although some had peaks between 9 and 18 Hz.
Radon-222 emissions at soil stations located around the volcano measured values between 40 and 5,468 pCi/l, levels similar to those of previous month, with the peak value occurring at Barranco station 6 km NW of the summit.
Low-pressure, gray and white, gas emissions came from active vents. Temperature measurements taken in the Deformes fumarole at the SSW edge of the main crater registered values from 128 to 132°C.
Information Contacts: Observatorio Vulcanológico y Sismológico de Pasto (OVSP), Carrera 31, 18-07 Parque Infantil, PO Box 1795, Pasto, Colombia (URL: https://www2.sgc.gov.co/volcanes/index.html).
Two small eruptions in March and April 2000 preceded by tornillo events
During 1 January-15 April 2000 there were two small eruptive episodes preceded by 24 tornillo ("screw-type") seismic events which showed dominant frequencies around 2.0 Hz and other peaks from 5 to 18 Hz. Volcano-tectonic events centered NE of the crater were also felt by local residents.
The first eruptive episode occurred on 21 March at 1628. The seismic signal associated with this activity was characterized by long-period events followed by 30 minutes of spasmodic tremor, and then 17 small long-period events registered in the following three hours. The dominant frequency of the main event was around 2.0 Hz, but at the nearest station to the crater other frequencies between 5 and 13 Hz were recorded. Field inspections before and after the 21 March eruption revealed fluctuations in the output pressure and in the quantity of gas emitted from the active vents; emissions were generally gray and white in color. Temperature measurements taken during March at Las Deformes fumarole (SSW border of the main crater) registered values of 124-127°C, which are similar to those observed in recent years. However, Las Chavas fumarole (WSW border of the main crater) showed a significant temperature increase one day before the 21 March eruption.
The second eruptive episode, on 5 April at 1738, was smaller than the 21 March event. Its associated seismicity was characterized by spasmodic tremor. The dominant frequency was around 2.4 Hz, but again at the nearest station to the active crater other frequencies between 6 to 17 Hz were observed.
Radon-222 soil emissions measured at stations around the volcano showed values between 98 and 8,619 pCi/l. Most of them were unchanged from previous measurements. The highest peak correspond to the Sismo5 station, located 7 km N of the summit.
Two volcano-tectonic events during this period were felt in some areas of Pasto city and Nariño town; a maximum Modified Mercalli Intensity of III was estimated in these regions. The first event occurred on 10 January centered 10 km NE of the summit at a depth of 8 km and with a magnitude of 3.2. The second event occurred 5 km NE of the summit on 6 April, with a depth of 9 km and a magnitude of 2.4.
Information Contacts: Observatorio Vulcanológico y Sismológico de Pasto (OVSP), Carrera 31, 18-07 Parque Infantil, PO Box 1795, Pasto, Colombia (URL: https://www2.sgc.gov.co/volcanes/index.html).
Low-level seismicity and eruptive activity during April 2000-March 2001
According to reports by the Observatorio Vulcanológico y Sismológico de Pasto (OVSP), volcanic unrest at Galeras continued during 16 April 2000-March 2001. However, OVSP reports for November-December 2000 were not available when this report went to press.
Two small eruptive episodes occurred on 22 April and 18 May 2000. The associated seismic records included long-period (LP) events and spasmodic tremor similar to those registered during eruptive episodes on 21 March and 5 April 2000 (BGVN 25:03). Elevated seismicity continued with two volcano-tectonic (VT) events on 30 July and 17 September 2001. These events were focused ENE of the active cone; previous activity initiating within this source region was sporadic. During January-March 2001 activity continued at low levels. VT events occurred during mid- to late-January, and were followed by similar events during late March.
New crater formation during April 2000. Spasmodic tremor starting on 22 April at 1558 lasted for 175 seconds, followed by three smaller tremor episodes with durations of 90, 320, and 170 seconds, respectively. Five small LP events also occurred; the final LP event was recorded at 1634. Peak frequency for the main event was ~5.0 Hz (figure 91), but at the nearest station to the active crater other frequencies ranging from 1 to 13 Hz were observed.
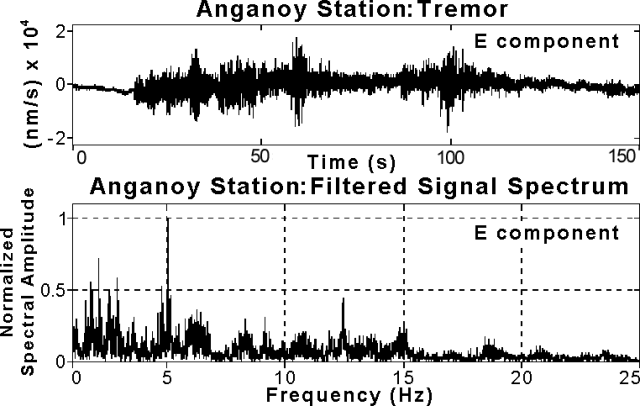 |
Figure 91. Main event seismic signal from 22 April 2000 at 1558 and its spectrum recorded at Anganoy station, 0.9 km E of Galeras's crater. Courtesy of OVSP. |
Field inspections on 27 April revealed that within the Chavas fumarole area, on the WSW edge of the main crater, a new crater approximately 8 x 4 m in area and 1.5 m deep had formed. Several gas-emitting fissures were observed along the crater wall. Temperatures recorded at the border of the new crater on 27 April and 1 May were 408°C and 393°C, respectively, which are not anomalously higher than those observed previously.
During 16 April-30 June 2000, radon-222 emissions from soil monitored at several stations around Galeras showed values of 78-2,966 picocuries/liter (pCi/l). These levels are similar to those found in previous months. The highest value corresponded to the Sismo 2 station, located 5 km NE of the summit.
Activity during May-October 2000. An eruptive event at 1411 on 18 May was seismically characterized by an initial LP event with a dominant frequency of ~2.1 Hz figure 92), followed by five spasmodic tremor episodes and nine more LP events. The last LP event was recorded at 1806 later that day.
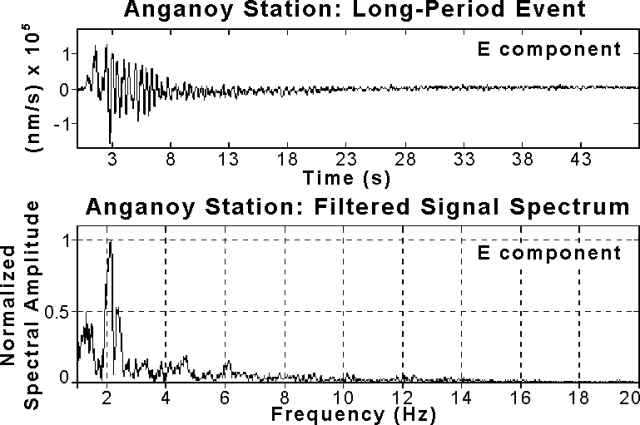 |
Figure 92. Main event seismic signal from 18 May 2000 at 1411 and its spectrum recorded at Anganoy station, 0.9 km E of Galeras's crater. Courtesy of OVSP. |
On 30 July at 0935 an earthquake swarm occurred 9 km ENE of the active cone, in the suburban area adjacent to the city of Pasto. The main event (M 4.5) was distinctly felt inside the city and in other neighboring communities. Aftershocks of lesser magnitude (M 2.3-3.4) continued through 4 August.
On 17 September 2000 at 2246 residents of Pasto and neighboring communities felt a M 3.9 event. Seismographs also detected aftershocks of M 2.6. Figure 93 shows a map view of volcano-tectonic earthquakes that occurred during July-October 2000. According to a report, movement of fluids within volcanic conduits remained at low levels.
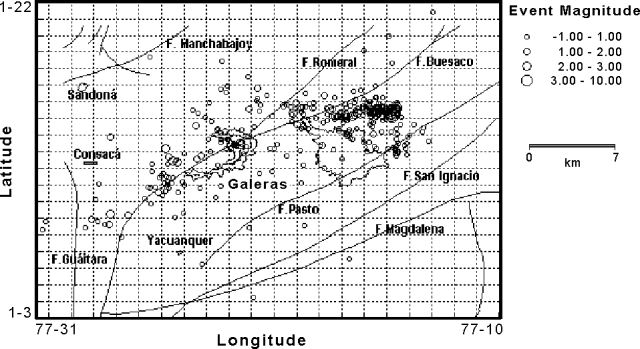 |
Figure 93. Map view showing volcano-tectonic earthquakes registered at Galeras during July-October 2000. Courtesy of OVSP. |
During 1 July-30 October 2000, radon-222 emission from soil monitored around Galeras showed average values lower than 3,000 pCi/l. Peak values at the Zanjón station, located 16 km NW of the summit, reached 9,620 pCi/l on 8 September. The highest values at the San Antonio 2 station, 14 km W of the summit, occurred on 13 July and 1 September with recorded values of 15,119 pCi/l and 11,587 pCi/l, respectively.
Activity during January-March 2001. A VT earthquake swarm located near the active crater occurred during 15-17 January. The swarm was composed of 17 quakes with depths less than 3.5 and M < 1.3. A single event on 24 January and two more on 26 January (M 2.3-2.7, depths of 6-8 km) followed. Seismometers recorded three further events (M 2.5-2.7, depths of 8-9 km) on 20, 21, and 23 March. The majority of the January-March 2001 earthquakes occurred NE of the summit and were felt in the neighboring communities of Pasto and Puyito. During the first quarter of 2001, instruments detected 52 events located within the active cone area (figures 94 and 95).
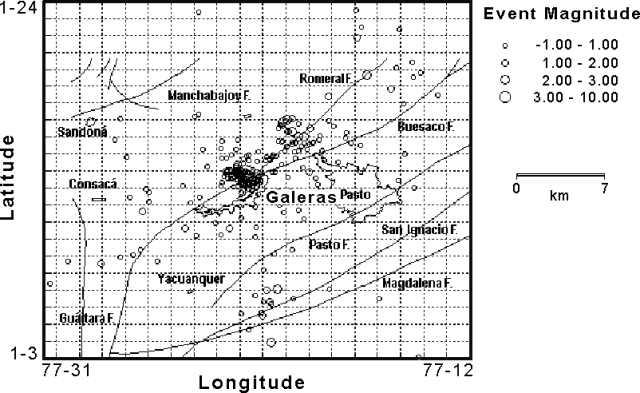 |
Figure 94. Map view showing volcano-tectonic earthquakes registered at Galeras during January-March 2001. Courtesy of OVSP. |
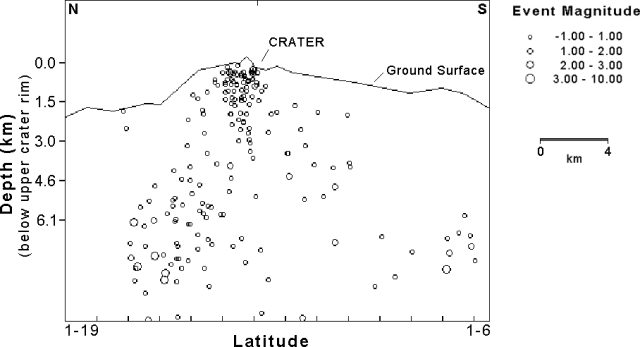 |
Figure 95. Cross-sectional view (N-S) showing earthquakes registered at Galeras during January-March 2001. Courtesy of OVSP. |
The occurrence of four tornillo ("screw-type") events with dominant frequencies of 3.2, 8.7, 12.8, and 18.7 Hz suggested that flow of volcanic material within interior conduits continued at low levels. Tremor episodes of short duration were also recorded. Spectral analysis of the registered tremor showed dominant frequencies of 2.3-3.5 Hz.
Field workers at Galeras near the Chavas fumarole (W of the active crater) reported hearing a sound similar to the rushing current of a river, which correlated with increased rates of gas emission.
During 2000 the temperature of the Deformes fumarole (S of the active crater) measured an average of 111°C and showed a slight cooling over time. The fumarole temperature averaged 100°C during the first three months of 2001.
During 1 January-31 March 2001, radon-222 emission from soil measured up to 4,000 pCi/l at most stations. The San Juan 1 station (10 km NE of the active cone) and Sismo 5 station (7 km N of the active cone) detected higher values of 6,754 pCi/l and 5,455 pCi/l, res
Information Contacts: Patricia Ponce, Observatorio Vulcanológico y Sismológico de Pasto (OVSP), INGEOMINAS, Carrera 31, 18-07 Parque Infantil, P.O. Box 1795, Pasto, Colombia (URL: https://www2.sgc.gov.co/volcanes/index.html).
Volcano-tectonic earthquakes during July through late September 2001
Our last report (BGVN 26:05) discussed the low-level seismicity and eruptive activity observed at Galeras during April 2000-March 2001. During July through late September 2001, the greatest seismic energy contribution (1.7 x 10¹⁵ erg) resulted from 70 volcano-tectonic earthquakes. Epicenters were concentrated S and NE of the volcano, and some were felt by local residents. The largest VT events, an M 3 on 22 August (6 km depth) and an M 2 on 13 September (8 km depth), were felt in Pasto and Jenoy.
On 30 September, an M 4 tectonic earthquake centered ~12-18 km S of the volcano was felt in Pasto and some towns toward Nariño, 70 km SE of Galeras. An M 2 aftershock registered seven hours later. It was also felt in Pasto and some towns near the epicentral zone (figure 96).
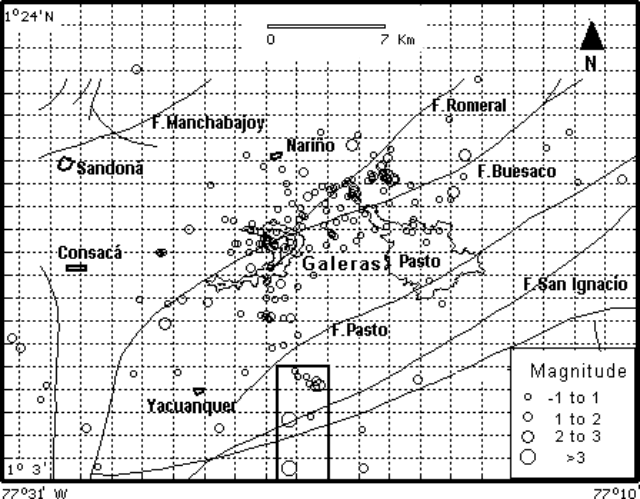 |
Figure 96. Map view showing volcano-tectonic earthquakes registered at Galeras during July-September 2001. The square shows the approximate location of the sequence of the tectonic earthquakes on 30 September. The breached caldera rim at Galeras is indicated; other names refer to local cities and villages. Courtesy of OVSP. |
On 24 August, a gas emission produced a spasmodic tremor episode that lasted ~5 minutes, followed by some long-period (LP) events (figure 97). The tremor's dominant frequencies were between 2and 5 Hz. The LP events had frequencies less than 3 Hz. Real-time temperature monitoring of Deformes fumarole (SW of the active crater) showed stability, in the range 92-94°C (figure 98).
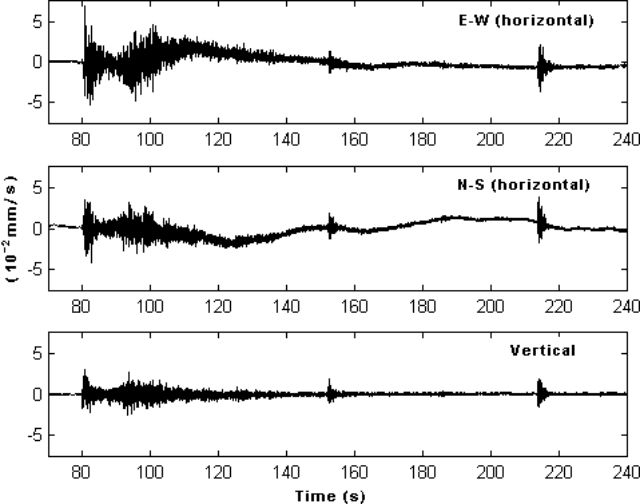 |
Figure 97. Digital record of the seismic signal registered at Galeras at 1155 UTC on 24 August 2001. The signal was received at Anganoy station (0.9 km SE of the active crater). The vertical scale on these records shows ground velocity. Courtesy of OVSP. |
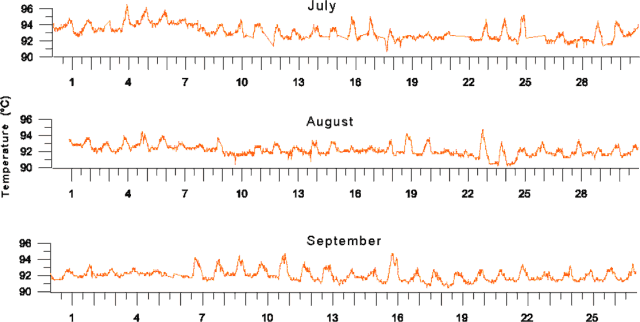 |
Figure 98. Digital temperature logs taken at Deformes fumarole at Galeras during July-September 2001. Courtesy of OVSP. |
Information Contacts: Patricia Ponce, Observatorio Vulcanológico y Sismológico de Pasto (OVSP), INGEOMINAS, Carrera 31, 18-07 Parque Infantil, P.O. Box 1795, Pasto, Colombia (URL: https://www2.sgc.gov.co/volcanes/index.html).
Tremor, earthquakes, and occasional rockfalls through early 2002
The Observatorio Vulcanológico y Sismológico de Pasto (OVSP) reported that during 1 January-31 March 2002, volcanic activity at Galeras was at a low level, similar to that reported in recent years. During the report period, a total of 43 volcano-tectonic events were recorded with a total seismic energy of 1.25 x 10¹⁵ erg, based on their durations. The majority of these events were located toward the NE of the volcanic edifice and W of the active crater (figure 99).
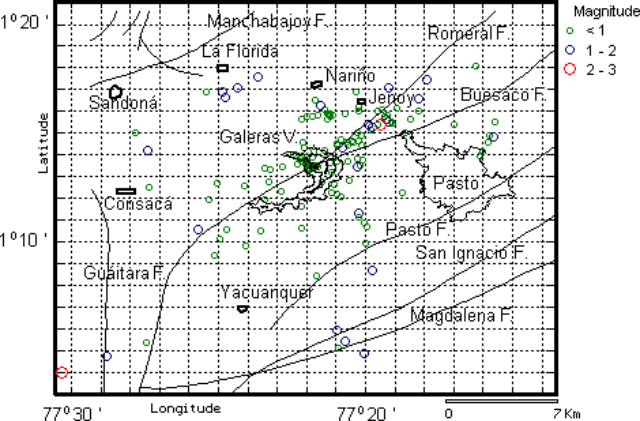 |
Figure 99. Epicenters of volcano-tectonic earthquakes that occurred in the Galeras region during January-March 2002. Courtesy OVSP. |
On 7 January a small earthquake swarm, including eight small-magnitude events, was located beneath the western part of the active crater. Two earthquakes were felt in Pasto and Jenoy. The first occurred on 12 March at 0128 with a local magnitude of 2.4; it was located 5 km NE of the active crater and 8 km below the summit. The second occurred on 14 March at 1753 with a local magnitude of 3.1; it was located 6 km NE of the active crater and at a depth of 8 km below the summit.
Three long-period events and 37 tremor episodes with a total energy of 3.08 x 10¹³ erg were registered. Some of the tremor episodes were of harmonic type, with dominant frequencies between 2.2 and 2.5 Hz (figure 100), with the source located in the crater region at shallow levels.
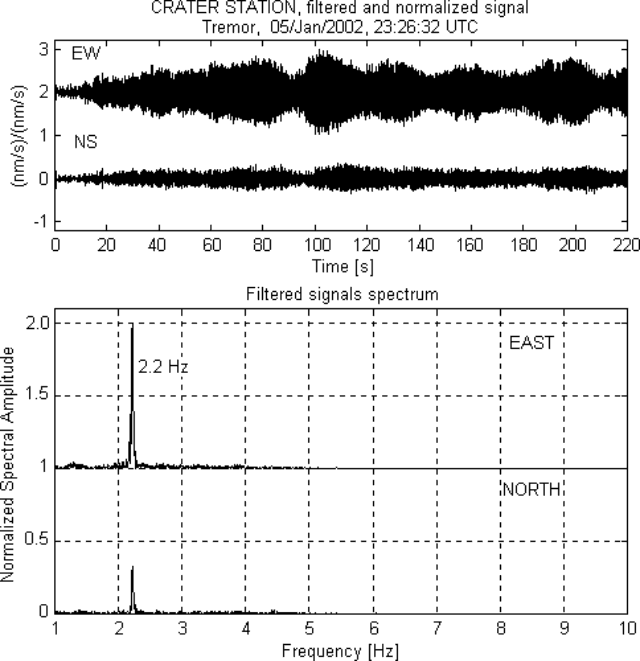 |
Figure 100. Digital record of a tremor episode at Galeras on 5 January 2002 at broad-band station Crater (1.6 km S of the active crater) and its normalized spectrum. Courtesy OVSP. |
On 12 January a tornillo event was registered (figure 101) with a spectrum that showed frequency picks at 2.4, 6.9, and 8.9 Hz. The energy of this event, based on its duration, was 3.04 x 10¹³ erg.
|
Figure 101. Digital record of tornillo event registered on 12 January 2002 at broad-band station Anganoy (0.9 km E of the active crater) and its normalized spectrum. Courtesy OVSP. |
On 5 January 2002 three seismic events occurred that were associated with rockfalls that resulted from the physical instability of the volcanic edifice in the W sector, rains, and earthquakes near to that unstable region. Similar activity had occurred on 6 December 2001.
Information Contacts: Patricia Ponce, Observatorio Vulcanológico y Sismológico de Pasto (OVSP), INGEOMINAS, Carrera 31, 18-07 Parque Infantil, P.O. Box 1795, Pasto, Colombia (URL: https://www2.sgc.gov.co/volcanes/index.html).
Phreatic explosion in June 2002; increased long-period seismicity in late 2002
A slight increase in the number of volcano-tectonic (VT) and long-period (LP) events occurred during April through September 2002, although the energy levels diminished. Between October and December 2002, scientists noted a small decrease in VT seismicity and a considerable increase in seismic activity related to fluid-movement. An increase in LP signals, difficult to classify due to their non-typical signatures, coincided with strong rainfall over Pasto and the volcano. The geothermal system at Galeras, with fumarolic zones having temperatures between 100 and 370°C, easily interacts with rainwater, producing exothermic reactions with seismic and near-surface manifestations.
During April-June, there were 191 VT events with a seismic energy release of 1.08 x 10¹⁶ erg. Both the number of events and the total energy increased during July-September, when 209 VT events with a seismic energy release of 5.64 x 10¹⁵ erg were recorded. In comparison, there were 197 VT events with an energy release of 2.86 x 10¹⁵ erg during October-December. The vast majority of the events occurred close to the active crater and in the volcanic edifice. Other earthquakes occurred at depths of 0.2-16 km beneath the summit throughout the second half of 2002.
Volcano-tectonic earthquakes were felt in Pasto on 8 April (2 km deep, ML 3.6), 17 April (2 km deep, ML 4.2), 28 April (12 km deep, ML 3.2), 24 May (8 km deep, ML 2.3), 21 June (9 km deep, ML 3.0), 22 July (5 km deep, ML 2.7), and 1 November (5 km depth, ML 3.2, 3.8 km from the crater). The 17 April event was followed by 12 aftershocks from the main crater area; the strongest was ML 2.6. In Consacá, two events were felt on 12 August within 4 minutes of each other (5 km deep, ML 2.9 and 3.4). The strongest 12 August earthquake was located ~6 km SW of the crater. A strong event on 20 December (4 km deep, ML 3.6) was felt in the town of Yacuanquer and was centered ~5 km SW of the active crater.
During April-June, 111 LP events and 82 spasmodic tremor episodes were registered with a total energy release of 2.89 x 10¹⁴ erg. Some spasmodic tremor episodes were harmonic, with dominant frequencies of 2.5-2.7 Hz. Seismic events related to fluid movements during July through September had low frequencies between 2 and 3 Hz and high frequencies of 10.5, 12.1, 13.7, and 14.1 Hz. These frequencies appeared all over the local reporting stations. In total, there were 161 registered LP events and 17 spasmodic tremor episodes with a total energy release of 1.1 x 10¹⁴ erg. In addition, some spasmodic tremor episodes were of the harmonic type with dominant frequencies of 2.5 and 3.0 Hz. During October-December the frequencies exhibited spikes between 10 and 16 Hz. Sometimes these events showed one or more precursor signals with very short amplitude and appeared in doubles or triplets. The frequencies kept on time over many stations indicating a processes more directly related to the source rather than the path or station site. Overall, there were 1,541 LP events and 209 spasmodic tremor episodes in October-December with a total energy release of 2.65 x 10¹⁵ erg.
Reactivation of El Pinta Crater. Slight gas emissions were observed at the end of May from the El Pinta crater (E of the main crater), inactive since 1991. On 5 June 2002 began the number of daily seismic events increased. A team visiting the summit on 7 June noted an increase in the quantity and pressure of gas emissions at different points of the main crater and in El Pinta. However, temperatures did not show significant variations compared to previous months. Elevated temperatures were observed toward the SW sector of the active cone with values of 340°C at the Las Chavas fumarole field. Also on 7 June spasmodic tremor was registered at the observatory that signified a hydrothermal event. A subsequent field inspection observed a fine layer of ash and precipitate sulfur, besides great gas emission from El Pinta. The material emitted by El Pinta consisted of lapilli, ash, and clay; a high percentage of the sample was pre-existing material. Some reports of gas emissions coincide with spasmodic tremor records at the Galeras observatory site. After 11 June this activity began to decrease. The VT earthquakes that accompanied this activity were located in the main crater zone with depths to 3 km.
Information Contacts: Marta Calvache, Observatorio Vulcanológico y Sismológico de Pasto (OVSP), INGEOMINAS, Carrera 31, 18-07 Parque Infantil, P.O. Box 1795, Pasto, Colombia (URL: https://www2.sgc.gov.co/volcanes/index.html).
7 June 2002 and 16 July 2004 ash emissions; the latter leads into an eruptive episode
This report covers activity on Galeras volcano after calendar year 2002 (BGVN 28:02) and through July 2004. Towards the end of this interval, on 16 July 2004, a new eruptive episode began. In contrast to the 2004 events, the interval from 1994 to June 2004 was characterized by relative quiet, except for a small ash emission from a secondary crater on 7 June 2002. Since 1997 INGEOMINAS has been part of a research project called 'The multiparameter station at Galeras volcano' that was developed with the German group, Bundesanstalt für Geowissenschaften und Rohstoffe (BGR). The station includes the monitoring of fumarolic gas, electromagnetic fields, broadband seismicity, thermal imagery, and other parameters (Seidl and others, 1998). Most instruments were functioning during the recent period of activity.
INGEOMINAS reported that during January-March 2004 Galeras volcanism was at very low levels, with persistent gas emissions from different foci on the active cone, particularly on its W side. There were 60 volcano-tectonic (VT) earthquakes, with many centered ~ 3 km NE of the active cone, several dispersed about the region, and a few epicenters within 2 km of the summit. Magnitudes based on the duration of the signal coda (Md) varied between 0.1 and 2.8.
Residents felt three earthquakes in Pasto. Two on 27 January occurred at 1511 and 2147 and another on 30 January at 0018. Their respective local magnitudes (ML) were 2.9, 3.1, and 2.3. All had epicenters 4-5 km NNE of Galeras.
Table 7 compares seismicity for the first quarter of 2004 with the last quarter in 2002 and the first in 2003. The number of VT events clearly dropped, but their energy release varied and was largest in the most recent quarter. The range of depths for the VT earthquakes is roughly comparable, although in the first quarter of 2004 these earthquakes had focal depths only down to 12 km, compared to as deep as 15 and 16 km in the other quarters shown. For the 2004 quarter, six episodes of tremor were recorded. Although fewer episodes occurred than for the other quarters shown in the table, they released an appreciable amount of energy. Spectral analysis generally suggested a fundamental frequency of 4.3 Hz.
Table 7. Cumulative seismicity in the given three-month intervals (quarter of a year) at Galeras. The second through fourth columns show the number of volcano-tectonic events, a sum of their energy release calculated from their codas, and their focal-depth ranges. The next two columns describe the number of tremor episodes and the associated energy release, and the last column contains the number of long-period events. Courtesy of INGEOMINAS.
| Quarter | VT Count | VT Energy | VT Depth below summit | Tremor Count | Tremor Energy | Long-Period |
| Oct-Dec 2002 | 197 | 2.9 x 10¹⁵ ergs | 0.2-16 km | 209 | 27 x 1014 ergs | 1,541 |
| Jan-Mar 2003 | 126 | 0.49 x 10¹⁵ ergs | 0.2-15 km | 19 | 0.03 x 10¹⁴ ergs | 104 |
| Jan-Mar 2004 | 60 | 6.7 x 10¹⁵ ergs | 0.3-12 km | 6 | 12 x 1014 ergs | 1 |
In early 2003, LP signals continued to be present in the record, although their classification was made difficult by their atypical signatures. Their frequency spectra showed peaks between 10 and 16 Hz. Sometimes these events were preceded by one or more small-amplitude precursor signals, which appeared to have very similar waveforms. The frequencies were stable over time and from one station to another, indicating processes related to the source rather than to the path or the station site.
The W sector of the active cone continued to show the highest fumarole temperatures. INGEOMINAS measured fumarole temperatures on the active cone in March 2003 and January 2004, and at both times they were cooler than those measured in 2002. Spot measurements in 2002, 2003, and 2004 were reported for two fumarolic areas: Deformes fumaroles (~50 m outside the main crater's SSW rim, 118°C, 85°C, and 86°C, respectively) and Chavas fumarole (344°C, 267°C, and 310°C).
Commencement of 2004 eruptions. The most recent phreatic eruption before 16 July 2004 took place on 7 June 2002 (BGVN 28:02). The eruption on 16 July 2004 was preceded by a decrease in the amount of CO2 released at La Joya fumarole (W side of the cone). The decrease began on 6 June and lasted until the gas sensor stopped working on 26 July 2004. On 27 June the seismic activity picked up. The earthquakes exhibited high frequencies, and they underwent rapid attenuation in both time and space. The VT and LP events were at shallow levels (less than 2 km).
On 8 July 2004 a swarm of VT earthquakes was centered slightly W of the cone at depths of 2-4.5 km. The largest event had ML 3 (figure 102). The swarm was preceded by intervals with LP events and spasmodic tremor at somewhat lower frequencies.. The seismic episode caused tiltmeters to vary on the E and NE flanks During fieldwork on the S and SW sides of the active cone on 9 July, numerous new points with gas emission were observed. However, the secondary crater "El Pinta" (at the E edge of the main crater) only produced sporadic, weak pulses of gas (figure 103).
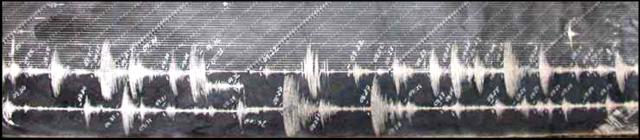 |
Figure 102. A seismic record of a portion of the Galeras earthquake swarm on 8 July 2004, from the station OLGA on the upper E slope. These were described as fracture earthquakes. During the recording process, the seismologist on duty adjusted the distance between adjacent traces, setting them farther apart than the upper, comparatively quiet portion of the record. The seismologist's notes of earthquake arrival times appear as faint, poorly legible marks on the image. Several earthquakes occurred at such short intervals that they overlapped. Courtesy of INGEOMINAS. |
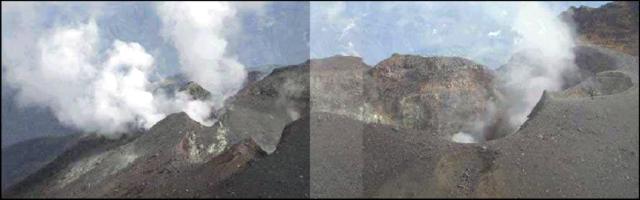 |
Figure 103. Composite of photos portraying the active cone at Galeras on 9 July 2004. The photos were taken looking NW. At the time these photos were taken the principal focus of emissions was from fumaroles located on the W side of the cone. El Pinta crater on the E edge of the main crater was not emitting any visible products; later, however, this crater became the primary vent. (A map of crater features appeared in BGVN 19:07.) Courtesy of INGEOMINAS. |
On 9 July, only minor, white-colored emissions were observed. They came from the main crater and from sporadic gas venting from the secondary El Pinta crater.
The first episode of ash emissions from El Pinta were noted at 0901 on 16 July and was associated with tremor. It took place under conditions of poor visibility, thwarting clear observations. At the time of ash emission, tremor with very large amplitudes at the upper-flank Olga station had persisted for slightly more than 10 hours (figure 104).
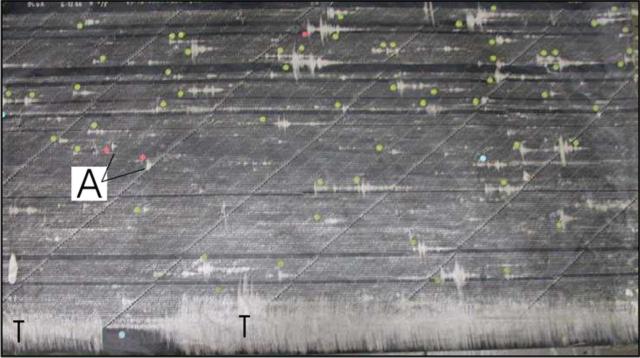 |
Figure 104. A seismic record from station Olga on 16 July 2004, showing examples of the seismic signals seen as the eruption began. Only a few of the local (or micro) earthquakes were inferred to be associated with classic rock fracture. The bulk of the record contains more complex waveforms, inferred to be related to fluid movement. The bottom of this record is dominated by the kind of high-amplitude tremor often associated with active venting during this eruptive episode. Heavy index lines appear on the seismic record every minute; lighter (faint) intermediate lines are 10 seconds apart. The seismic interpretations of the record were indicated by red dots to indicate fracture earthquakes, and yellow, green and blue dots to indicate earthquakes associated with pressure transients. Courtesy of INGEOMINAS. |
The seismicity and gas venting accompanied signals on the two tiltmeters, as well as variations in the horizontal components of the electric and magnetic fields at an electromagnetic station at the NE base of the active cone. Since the beginning of July, the CO2 sensor at La Joya fumarole showed a gradual decrease in values, and the temperatures at La Joya and Chavas fumaroles increased gradually just two days before the emission. After 16 July, temperatures at Chavas had risen by 20°C and at La Joya by around 5°C.
According to the personnel of the military outpost at the summit of Galeras, gas emissions had increased by the afternoon of 17 July when compared with those before 9 July. The emissions came from the El Pinta crater and from Deformes fumarolic field, which is located ~ 50 m from the crater on the upper S and SSW flank of the active cone. Gas emissions subsequently decreased until 20 July, when again, small magnitude earthquakes occurred.
Field observations on 19 July disclosed fresh ash on Galeras (figure 105). It had vented from El Pinta crater. The ash thickness ranged from 3 mm at the base of the cone to ~ 20 cm near the point of emission. The right-hand photo on figure 106 shows field workers ascending the steep upper slopes, walking through the thick ash, leaving deep footprints akin to trudging through fresh snow.
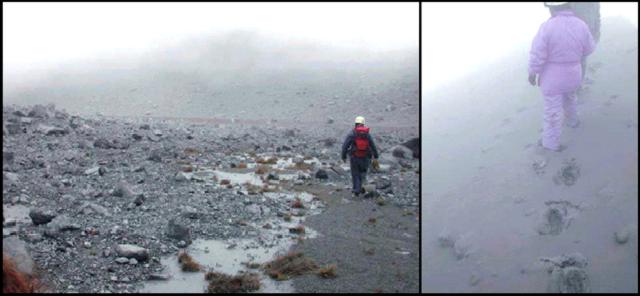 |
Figure 105. Galeras reconnaissance investigations undertaken on 19 July (3 days after the ash emission of 16 July). The left-hand photo shows a team in the volcano's E sector where they found thin ash-fall deposits. The right-hand photo shows climbers on the upper part of the cone at El Pinta, in vicinity of the vent, where substantial ash had fallen. Courtesy of INGEOMINAS. |
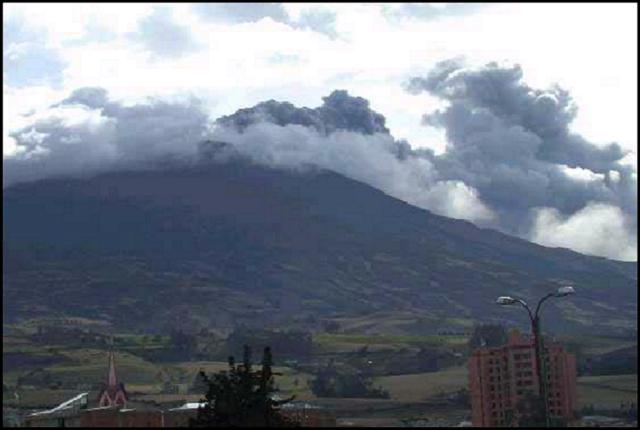 |
Figure 106. The ash-bearing eruption from Galeras on 21 July 2004, as seen looking W from the town of Pasto. The town sits on the volcano's flank, making it vulnerable to slope instability and other volcanic hazards. Pasto residents have previously undergone considerable tension due to unrest at Galeras in the 1989-2002 eruptive episode. Courtesy of INGEOMINAS. |
On 21 July, an ash emission was seen rising to ~ 500 m above the volcano's rim (figure 5). It was widely visible, including from the largest adjacent city, San Juan de Pasto, which lies just to the E. Seismic signals increased and included a variety of wave forms such as short impulsive events as well as more complex ones. Tremor on 21 July was particularly strong (often dominating the record) and of long duration—extending for ~13 hours. Once again the electric- and magnetic-field sensors appeared to respond to the onset of emissions.
Although ash-free, gaseous emissions occurred on 23 July, ash-bearing ones were noted on many days in the following weeks from El Pinta. Specifically, ash plumes were every day during 27-31 July accompanied by tremor; LP and VT earthquakes were also recorded. Some of these processes were heard from canyons around the volcano. Several changes at the active cone were noted, which included increases in both venting, exit pressures, and quantities of gases driving the eruptions.
An afternoon overflight on 28 July confirmed a vigorous ash plume coming from El Pinta crater reaching to ~ 1 km altitude and visible for a distance ~ 5 km. A morning overflight on 29 July showed a light, gray to off-white colored plume again emerging from El Pinta and in this case described as blowing NNW, the prevailing direction of strong wind in this season of the year.
On 29 July a low ash plume was visible from Pasto. On that day, scientists took a thermal image of ash clouds; the maximum temperatures were 260°C, seen on the cloud's E side, at a spot above the vent at El Pinta (figure 107). SO2 measured on 31 July gave a value of 1,366 tons/day.
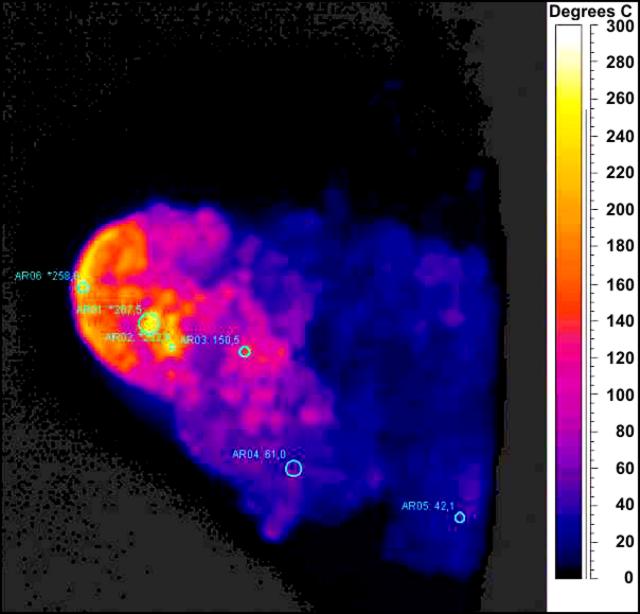 |
Figure 107. Thermal image of a Galeras eruption cloud on 29 July 2004 coming from El Pinta crater (N is towards the bottom of this image). The image was taken by INGEOMINAS with the support of the Air Force of Colombia, from ~ 500 m over El Pinta crater. The right hand side shows the temperature scale. Courtesy of INGEOMINAS. |
Two non-technical books discussed the 14 January 1993 Galeras eruptions that killed six scientists and three tourists (Bruce, 2001; Williams and Montaigne, 2001).
References. Bruce, V., 2001, No apparent danger: the true story of volcanic disaster at Galeras and Nevado del Ruiz: Harper Collins, 239 p.
McNutt, S., 2000, Seismic monitoring, in Encyclopedia of Volcanoes (H. Sigurdsson, Editor-in-chief): Academic Press, p. 1095-1119.
Seidl, D., Calvache, M., Bannert, D., Buttkus, B., Faber, E., Greinwald, S., Hellweg, M., and Rademacher, H., 1998, The Galeras multiparameter-station: Deutsche Geophys. Ges., Sonderband III / 1998 (Herausg.: J. Zschau, M. Westerhaus), p. 9-11.
Williams, S., and Montaigne, F., 2001, Surviving Galeras: Houghton Mifflin, 270 p.
Information Contacts: Diego Gomez Martinez, Observatorio Vulcanológico y Sismológico de Pasto (OVSP), INGEOMINAS, Carrera 31, 1807 Parque Infantil, PO Box 1795, Pasto, Colombia (URL: https://www2.sgc.gov.co/volcanes/index.html); Washington Volcanic Ash Advisory Center (VAAC), Satellite Analysis Branch (SAB), NOAA/NESDIS E/SP23, NOAA Science Center Room 401, 5200 Auth Road, Camp Springs, MD 20746, USA (URL: http://www.ospo.noaa.gov/Products/atmosphere/vaac/).
Hazard graphics; vigorous 2004 eruptions generally quieting thus far in 2005
In a meeting abstract Gomez and others (2004) wrote, "Following 11 years of relatively low activity, Galeras . . . produced a sequence of ash eruptions in July and August 2004. . .. Initial evidence of the activity transition appeared in the gas measurements [of] early June, followed by a strong increase in the shallow seismic activity below the active cone on 27 June. As in many cases at other volcanoes, the most clear evidence for the transition came in the form of seismic swarms and tremor. The current activity has culminated in two brief episodes of ash emission, on 16 July and 21 July, followed by two longer episodes, [during] 27 July-8 August and 11-19 August. This last episode began with a large explosion and released more ash than any individual episode from 1989 to 1993. Sudden deformation, as well as changes in the electric and magnetic [EM] fields at the crater EM station, and [in] gas parameters such as CO2 concentration and fumarole temperature accompanied the [16 and 21 July] ash emissions. Unfortunately, the EM and gas instruments were lost to ashfall shortly afterward."
The same abstract also noted that "Starting in March 1996, a multiparameter real-time monitoring system was installed at Galeras, as a part of a cooperative program between INGEOMINAS [Instituto Colombiano de Geología y Minería] (Colombia) and the BGR [Bundesanstalt f?r Geowissenschaften und Rohstoffe] (Germany). Broadband seismometers were installed first, with electromagnetic (EM) sensors, sensors for the chemistry and physics of the fumarole gases, and a weather station following later. The data from these instruments augment the short-period seismic network and tiltmeters of Observatorio Vulcanológico de Pasto (OVP). Additional spot measurements [relied upon] visual inspection from the ground or helicopter, a thermal camera[,] and regular geological forays onto Galeras' slopes."
Our previous report covered events through late July 2004 (BGVN 29:07); this report discusses events through mid-October 2005. Besides the eruptions of July through August 2004, another month with vigorous activity was November 2004. A sudden explosion on 21 November drove a plume to 9-10 km altitude. The latter portion of this report interval (June to mid-October 2005) typically involved ongoing though diminished intensity of volcanism and seismicity.
In response to the crisis, authorities produced engaging graphics, reminiscent of landscape paintings, but also containing risk assessments (figures 108 and 109), in the originals as color-coded lines. These graphics accompanied explanatory text. The authorities also produced a colorful poster. In addition, articles on Galeras hazards appeared in local papers, many along with clear graphics. The distance from the summit to central Pasto is only ~ 9 km.
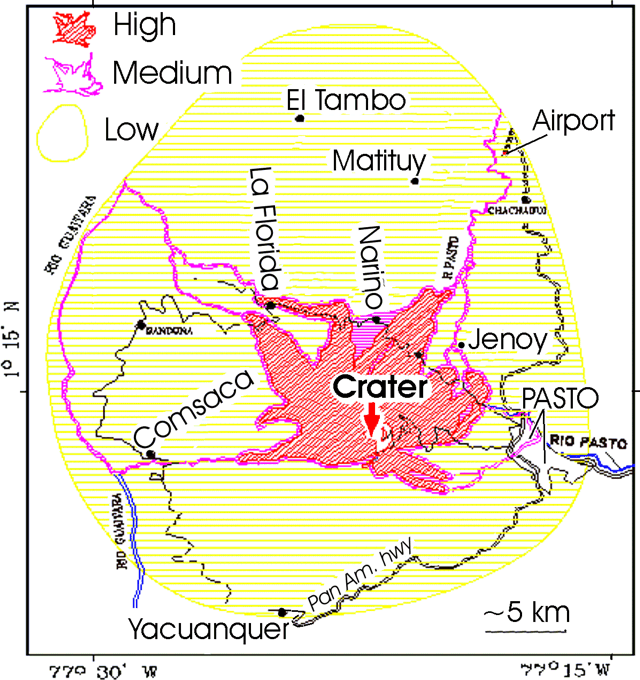 |
Figure 108. A hazards map prepared for Galeras. The key (upper left) shows symbols for risk zones (high, medium, and low). The settlement Genoy is also spelled Jenoy. This map is slightly modified from one by Observatorio Vulcanológico y Sismológico de Pasto, INGEOMINAS. |
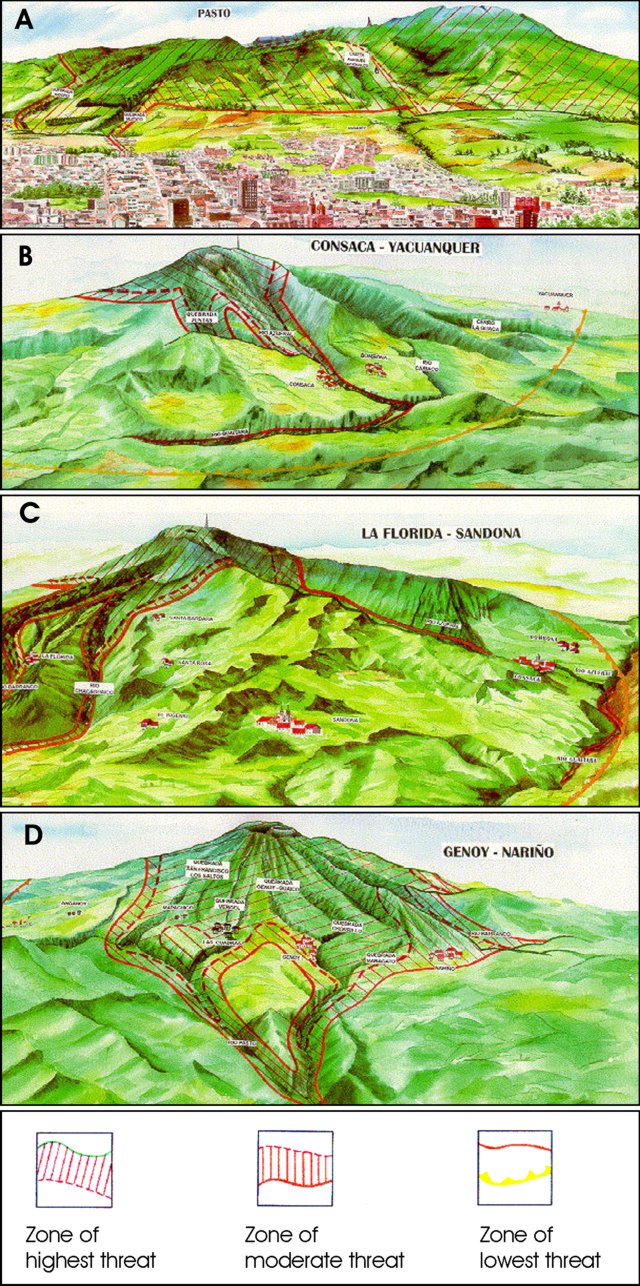 |
Figure 109. A sample of Galeras hazards graphics available during the 2004-2005 crisis. Galeras and surroundings appear in a series of perspectives that also illustrate likely paths of destructive processes. The artwork emphasizes important geography, labels many settlements, and portrays familiar buildings and skylines. Hazard zones are shown by symbols (see key at the bottom). Views are as follows: A: NW-looking view (S-SE flanks, "Pasto"), B: NE-looking view (SW flanks, "Consaca-Yacuanquer"), C: SE-looking view, (NW flanks, "La Florida-Sandona"), and D: SW-looking view, (NE flanks, "Genoy-Nariño"). Copyrighted images courtesy of Observatorio Vulcanológico y Sismológico de Pasto, INGEOMINAS. |
July-December 2004. INGEOMINAS noted that the July 2004 emissions came from El Pinta crater and from Deformes fumarolic field. Field observations on 19 July disclosed ash freshly vented from El Pinta crater, forming a deposit that ranged in thickness from 3 mm at the base of the cone to ~ 20 cm near the point of emission.
During the latter half of July 2004 INGEOMINAS noted that emissions rose ~ 600 m above the volcano's summit. Ash was not then visible on satellite imagery. On 21 July 2004 a seismic signal corresponded with a visible plume rising ~ 500 m above the volcano and seen from Pasto. According to a news report, a wide area around the volcano had been declared off limits to visitors. Several higher plumes followed.
According to the Washington VAAC, several ash plumes emitted were visible on satellite imagery during 7-10 August 2004. The highest rising plume reached ~ 6 km altitude.
INGEOMINAS reported that on 11 August at 2349 an eruption sent an ash-and-gas cloud to an unknown height and generated visible incandescence. According to the Washington VAAC, satellite imagery showed an ash plume that rose to ~ 10.7 km altitude. This plume spread in all directions, but mainly to the NE, E, and SW. Later, a thin plume reached a height of ~ 7.3 km altitude and drifted SW into northern Ecuador. A distinctly separate plume also occurred, drifting NW at an altitude of ~ 6.1 km.
Figure 110 shows a graphical depiction of the two plumes issued by the Washington VAAC, which incorporated GOES-12 satellite imagery as part of an advisory sent out at 0807 on 12 August 2004. The observations were from about an hour earlier. This following message was in the 'remarks' part of the advisory."Ash heading [NE] earlier in the night can no longer be seen in satellite imagery. A faint plume of ash is heading SW into northern Ecuador but is slowly becoming diffused in satellite imagery. The ash heading SW is estimated to FL240 [~ 7.3 km altitude]. An ash plume moving NW from the summit is estimated to FL200 [~ 6.1 km altitude]. We will continue to closely monitor and advise earlier than normal if needed."
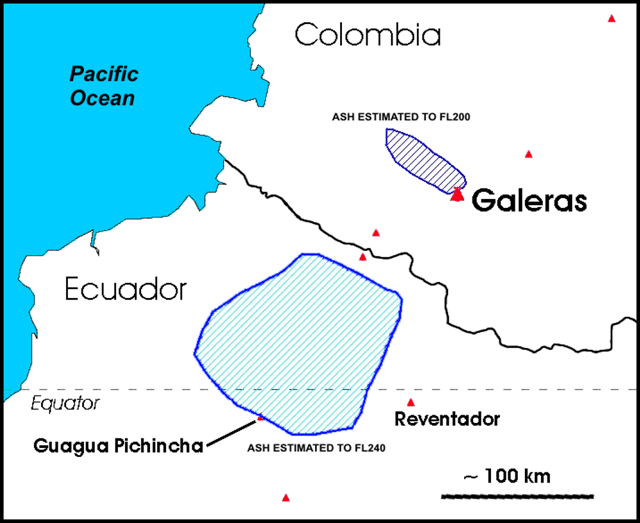 |
Figure 110. The Galeras ash plumes were distributed in a Volcanic Ash Advisory (VAA) issued at 1307 UTC on 12 August 2004. When this image was taken at 1215 UTC, the two visible plumes had separated widely; one lingering slightly N of the volcano, the other, larger, reached a higher altitude and drifted over Ecuador. Plume top altitude estimates were 'flight level' (FL) 200 and 240, equivalent to 20,000 and 24,000 feet, ~ 6.1 and ~ 7.3 km altitude. Information sources listed included the GUAYAQUIL Meteorological Watch Office (MWO) and the GOES-12 satellite. (This VAA was issued under the header FVXX20 KNES 121307). Courtesy of the Washington VAAC; analysis by Jamie Kibler. |
The next advisory noted that ash had ceased to be visible in the imagery after 0715 (1215 UTC) on 12 August 2004 (in other words, after the image associated with the graphic in figure 110).
Fine ash from the 11 August eruption was deposited in villages near the volcano, including La Florida (~ 10 km NW of the volcano), Nariño, Sandoná, and Consacá, and farther afield in Ancuya, Linares, and Sotomayor (~ 40 km NW of the volcano). News articles reported that during these episodes ~ 230 families were evacuated, mainly from the volcano's N flank. The village of La Florida on the volcano's NW flank was most strongly impacted by the eruption. Ash contaminated potable water in some villages, impacted farm animal's health, and left hundreds of dead fish floating in rivers. On 16 August, ash emissions continued, depositing ash in several villages.
INGEOMINAS reported that gas-and-ash emissions continued at Galeras as of 18 August. Ash fell in villages near the volcano, including La Florida, Sandoná, El Ingenio (within 15 km of the volcano), and farther afield in Samaniego and Sotomayor (between 20 and 40 km from the volcano). During 19 August to 1 September, there was a decrease in the level of seismicity and the number of ash emissions. But, gas-and-steam emissions continued.
During September 2004, tremor associated with ash-and-gas emissions was recorded at Galeras. On the 23rd, ash deposits were seen on the upper N flank. By the 27th, the amount of tremor had decreased significantly, a change that coincided with a decrease in ash emissions. During most of October 2004, emissions of gas and fine ash continued at Galeras. Plumes rose to a maximum height of ~ 1.5 km above the volcano. Instruments recorded small-amplitude tremor associated with gas-and-ash emissions.
INGEOMINAS reported that at 1544 on 21 November 2004 Galeras erupted explosively. A resulting shock wave was felt as far away as Cimarrones (18 km N of the volcano), Chachagui (17 km N of the volcano), and Laguna de La Cocha (20 km SW of the volcano). Effects of the shock wave varied from a loud roar, to the vibration of large windows, to the vibrating sensation of an earthquake. Hot ballistic blocks fell nearly 3 km from the volcano on its eastern flank, producing short-lived forest fires. The eruption produced an ash-and-gas column that rose to an estimated 9-10 km altitude and drifted to the S and W. The Washington VAAC reported that satellite imagery of 21 November at 1815 (i.e., 22 November at 0015 UTC) revealed two separate plumes, a situation somewhat analogous to 11-12 August (figure 110). One set of plumes from the 21 November eruption were estimated to reach 9 km altitude, and they blew to the W. Other plumes interpreted as low-level ash were estimated to be near 4-5 km altitude; these remained in the vicinity of the volcano and showed little motion.
January-September 2005. During January 2005, low-level relatively shallow seismicity continued, and a small amount of deformation towards the W portion of the volcanic cone occurred. On 30 January an emission of gas and ash rose ~ 800 m above the volcano. During the first week of February 2005, small gas-and-ash emissions continued. Ash was deposited in the sectors of Consacá (~ 15 km W of the volcano) and La Florida, and in the city of Pasto (~ 10 km E). Low-level seismicity and a small amount of deformation were recorded.
According to a news article, on 24 May 2005 the Colombian government ordered the evacuation of ~ 9,000 people living near Galeras due to an increase in volcanic activity. INGEOMINAS reported that during 16-23 May, small shallow earthquakes occurred beneath the volcano. Earthquakes believed associated with fracturing within the volcano increased during the night of 21 May to the morning of 22 May. Deformation continued to be recorded at the volcano's summit. There were no ash emissions. Galeras remained at alert level II ('probable eruption in terms of days or weeks') as it has since 19 April 2005.
During early June 2005, seismicity and deformation decreased in comparison to the previous week. On 6 June the alert level was decreased from II to III ('changes in the behavior of volcanic activity have been noted'). During July and August 2005, seismicity chiefly remained low. One exception, a M 2.5 volcano-tectonic earthquake on 4 July 2005, was felt in sections of some towns near the volcano. Generally, observers also noted small amounts of deformation and low rates of gas discharge, with continued emissions from the main and secondary craters. Thirty volcano-tectonic earthquakes were recorded at Galeras during 19-21 August 2005. The earthquakes occurred 3-4 km NW of the volcano's active cone, near the towns of Santa Bárbara, Nariño, and La Florida. About five earthquakes felt by nearby populations occurred at depths of 6-8 km, with the largest (M 4.7) occurring at a depth of 6 km on 21 August.
During September 2005, minor seismicity and minor deformation continued. Seismic signals included 365 minor events near the volcano at less than 6 km depth. The larger September record consisted of 179 volcano-tectonic events, 291 long-period events, 258 hybrid events, and 96 tremor episodes. Some of these earthquakes correlated with gas and fine ash discharges. Flyovers at the end of September confirmed that gas emissions were significantly reduced compared to August 2005.
October INGEOMINAS reports noted occasional steam plumes visible from Pasto, often correlated with and presumably related to increases in rainfall and infiltration of water into hot portions of the volcano. A 5 October 2005 overflight revealed a small increase in gas emissions compared to similar flights during September 2005. Seismicity fluctuated and some instrumentally measured deformation continued.
Reference. Gomez, D., Hellweg, M., Buttkus, B., Boker, F., Calvache, M. L., Cortes, Faber, E., Gil Cruz, F., Greinwald, S., Laverde, C , Narváez, L., Ortega, A., Rademacher, H., Sandmann, Seidl, D., Silva, B., and Torres, R., 2004, A Volcano Reawakens: Multiparameter Observations of Activity Transition at Galeras Volcano (Colombia), Transactions, American Geophysical Union, Fall meeting (session entitled "Sources of Oscillatory Phenomena in Volcanic Systems I; Posters"), December 2004, San Francisco, CA
Information Contacts: Diego Gomez Martinez, Observatorio Vulcanológico y Sismológico de Pasto (OVSP), INGEOMINAS, Carrera 31, 1807 Parque Infantil, PO Box 1795, Pasto, Colombia (URL: https://www2.sgc.gov.co/volcanes/index.html; Washington Volcanic Ash Advisory Center (VAAC), Satellite Analysis Branch (SAB), NOAA/NESDIS E/SP23, NOAA Science Center Room 401, 5200 Auth Road, Camp Springs, MD 20746, USA (URL: http://www.ospo.noaa.gov/Products/atmosphere/vaac/); El Spectador; El Pais (URL: http://elpais-cali.terra.com.co/paisonline/); Reuters.
Eruption begins on 24 November 2005 sending ash plumes into air
Galeras was last reported on in BGVN 30:09, covering the period from July 2004 to mid-October 2005. During July through October 2004, eruptions generated ash and gas plumes that caused ashfall in surrounding areas. On 21 November 2004 Galeras erupted explosively. During January - September 2005, low-level relatively shallow seismicity and small gas-and-ash emissions continued. Occasional steam plumes were visible from Pasto in October 2005. Seismicity fluctuated and some instrumentally measured deformation continued.
During the first week of November 2005, low-level seismicity included several tornillo earthquakes (long-period seismic events related to pressurized fluid flow at shallow depth). Small amounts of deformation were recorded at the volcano. During 9-14 November, a large number of tornillo earthquakes were reported by Instituto Colombiano de Geología y Minería (INGEOMINAS). The earthquakes were similar to those that occurred before eruptions in 1992-93. Activity during October suggested that the volume of magma beneath the volcano was greater than that inferred to have been present during the 1992-93 eruptions. Due to increased activity, the Alert Level was raised to 2 (probable eruption in days or weeks) on 14 November.
According to news reports, on 14 November local authorities recommended an evacuation of as many as 9,000 people living in towns near the volcano, including Pasto (to the E), La Florida (to the N), and Nariño (to the N). Heightened seismicity continued during 16-22 November. According to news articles, only ~ 1,000 residents had actually left as of 18 November.
On 24 November at 0246 seismic signals indicated the beginning of an eruption. Ash fell in the towns of Fontibon, San Cayetano, Postobon, and in north Pasto. Around this time, INGEOMINAS raised the Alert Level to 1 (eruption imminent or occurring). The Washington VAAC observed a small puff of ash NE of the volcano at ~ 4.6 km altitude. Activity decreased by the next day, so the Alert Level was reduced to 2. Thousands of people had been evacuated during the week prior to the eruption.
Due to a decrease in activity, on 28 November INGEOMINAS reduced the Alert Level to 3. Low levels of seismicity and deformation were continuing. Although poor weather conditions obscured the volcano most of the time, steam and gas emissions were photographed on 2 December coming from several locations on the active cone, including the main crater. The plume rose 1 km above the summit on 3 December.
Through 12 December, seismicity indicated fluids moving within the volcano, small changes in deformation occurred, and gas rose to a height of ~ 500 m. Based on information from the US Geological Survey, the Washington VAAC reported that a pilot observed an ash plume from Galeras on 23 December at an altitude of ~ 7.3 km and drifting W.
During 23 December to 2 January 2006 there were emissions of gas and small amounts of ash. On 23 December four ash plumes rose to ~ 3 km altitude and drifted to Consacá. A cluster of 33 volcano-tectonic earthquakes, reaching a maximum M 1.2, occurred beneath the volcano's crater during 29-30 December. The SO2 flux varied between 300 and 1,500 metric tons per day (t/d).
Gas emissions with small amounts of ash, and heightened seismicity, continued through 9 January. The SO2 flux at the volcano varied between 490 and 1,500 t/d. A lava dome was visible in the main crater during an overflight on 13 January. Around this time, there was an increase in the amount of seismicity and deformation. The Washington VAAC reported that a pilot observed an ash plume on 23 December at an altitude of ~ 7.3 km and drifting W.
During 23 January to 6 February, the lava dome in the main crater continued to grow; seismicity associated with the movement of fluids continued, with an average of 200 small earthquakes per day, and slight deformation was recorded. SO2 flux of about 300 t/d was measured. Strong degassing occurred in several sectors of the active cone and around the lava dome. Steam rose to 900 m above the volcano. During a field visit on 8 February, scientists found pyroclastic-flow deposits high on the SE flank.
The rate of seismicity the week of 13-20 February averaged 190 small earthquakes per day, while the SO2 flux was about 200 metric tons per day. Steam rose to ~ 1.1 km above the volcano on 19 February and incandescence was visible at parts of the lava dome. The volume of the dome in the main crater was approximately 1.5 times larger than when it was first observed on 13 January. Seismicity increased to an average of 280 small earthquakes per day during 20-27 February. SO2 flux also rose, to about 600 t/d. On 26 February a cluster of earthquakes included an M 4.8 volcano-tectonic earthquake followed by 35 smaller earthquakes. Slight deformation was recorded at the volcano. Steam and gas rose to ~ 700 m above the volcano. Galeras remained at Alert Level 3 through February 2006.
Information Contacts: Diego Gomez Martinez, Observatorio Vulcanológico y Sismológico de Pasto (OVSP), INGEOMINAS, Carrera 31, 1807 Parque Infantil, PO Box 1795, Pasto, Colombia (URL: https://www2.sgc.gov.co/volcanes/index.html; Washington Volcanic Ash Advisory Center (VAAC), Satellite Analysis Branch (SAB), NOAA/NESDIS E/SP23, NOAA Science Center Room 401, 5200 Auth Road, Camp Springs, MD 20746, USA (URL: http://www.ospo.noaa.gov/Products/atmosphere/vaac/); El Pais (URL: http://elpais-cali.terra.com.co/paisonline/).
Heightened seismicity through April 2006; increased lava dome volume noted
Galeras was last reported on in BGVN 31:01. During the first weeks of November 2005 seismometers recorded tornillo earthquakes (long-period events with seismic traces that look like screws in profile and are currently thought to be related to pressurized fluid flow at shallow depth). Minor deformation was also recorded at Galeras. The earthquakes were similar to those that occurred before eruptions in 1992-93. On 24 November at 0246 seismic signals indicated the beginning of an eruption. Ash fell in the towns of Fontibon, San Cayetano, Postobon, and in north Pasto. Activity decreased by the next day, so the Alert Level was reduced. Thousands of people were evacuated during the week prior to the eruption. Gas emissions continued through December 2005 and January and February 2006. During 23 January to 6 February, the lava dome in the main crater continued to grow; strong degassing occurred in several sectors of the active cone and around the lava dome. Galeras remained at Alert Level 3 ("changes in the behavior of volcanic activity have been noted") through February 2006.
During the last week of February, seismic stations detected an average of 280 small earthquakes per day. On 26 February a shallow M 4.8 volcano-tectonic earthquake below the volcano was recorded at 1009, followed by 35 smaller earthquakes. SO2 flux of about 600 metric tons per day was measured during February. Steam and gas rose to ~ 700 m above the volcano.
During 27 February to 6 March an increase in the volume of the lava dome located in the main crater was observed. During March, seismicity at Galeras decreased in comparison to the previous several weeks and deformation was measured at the volcano. Plumes of mainly steam, gas, and small amounts of ash were emitted from the volcano and rose to a maximum height of 1.2 km above the volcano.
Due to an increase in tremor at Galeras beginning on the morning of 28 March 2006, INGEOMINAS raised the Alert Level from 3 to 2 (likely eruption in days or weeks). On 28 March, energetic signals and tremor began and seismic instruments detected very shallow low-energy hybrid signals, similar to ones recorded during 1991-1993 when dome emplacement occurred on the main crater's floor.
The increase in seismic energy ended on 29 March. The number of earthquakes beneath the volcano decreased during 28 March to 3 April (an average of 66 earthquakes was recorded daily), in comparison to the previous week (an average of 89 earthquakes was recorded daily). Steam columns rose up to ~ 500 m above the volcano and the outer layer of the lava dome at the volcano's summit cooled in comparison to previous weeks.
During 5-24 April, decreases were observed in seismicity, deformation, gas emissions, and temperatures. According to INGEOMINAS, most of the explosive eruptions at Galeras in the past 17 years occurred when parameters were at similarly low levels. In addition, the current lava dome has a significantly greater volume than the dome that was destroyed during an eruption in 1992. The volume of magma in the interior of the volcanic system is greater than during 1989-1993. Galeras remained at Alert Level 2.
Information Contacts: Diego Gomez Martinez, Observatorio Vulcanológico y Sismológico de Pasto (OVSP), INGEOMINAS, Carrera 31, 1807 Parque Infantil, PO Box 1795, Pasto, Colombia (URL: https://www2.sgc.gov.co/volcanes/index.html; Washington Volcanic Ash Advisory Center (VAAC), Satellite Analysis Branch (SAB), NOAA/NESDIS E/SP23, NOAA Science Center Room 401, 5200 Auth Road, Camp Springs, MD 20746, USA (URL: http://www.ospo.noaa.gov/Products/atmosphere/vaac/); El Pais (URL: http://elpais-cali.terra.com.co/paisonline/).
Ongoing dome growth and elevated seismicity, thousands evacuated in July 2006
On 24 November 2005 an eruption began at Galeras that resulted in local ash fall (BGVN 31:01and 31:03). This report discusses behavior through mid-August 2006.
Through December 2005 to the end of March 2006, the lava dome in the main crater continued to grow and seismicity remained elevated. Because of an increase in tremor at Galeras on 28 March 2006, Instituto Colombiano de Geología y Minería (INGEOMINAS) raised the Alert Level from 3 (changes in the behavior of volcanic activity have been noted) to 2 (likely eruption in days or weeks). Although the seismic activity apparently decreased on 29 March, Galeras remained at Alert Level 2.
INGEOMINAS reported that Galeras remained at a critical state during April and May 2006, with a partially solidified lava dome in the main crater. Seismicity, deformation, gas emissions, and temperatures all decreased. During 10-17 April, there were small gas emissions from the volcano. During 9-15 May, there were small gas and sporadic ash emissions. During 12-19 June, ash columns reached heights of 0.6-1.4 km above the summit.
According to Reuters and BBC reports, an increase in volcanic activity 12 July prompted the Colombian government to order the evacuation of ~ 10,000 people living near Galeras. INGEOMINAS reported an increase in seismic activity and at least two explosive eruptions. Ash accumulated in the towns of La Florida and Nariño, about 10 km N, and in the town of Genoy, 5 km NE. The Alert Level was increased from 2 (likely eruption in days to weeks) to 1 (eruption imminent or occurring). On 13 July, because of decreased activity, the Alert Level was lowered from 1 to 3. Approximately 2,000 people had been taken to shelters.
On 17 July, INGEOMINAS reported that after the 12 July eruption of Galeras, seismic activity decreased considerably. Observations of the dome and secondary craters in the W sector after 12 July showed minor physical changes. Weak gas plumes were observed without associated seismic activity. Through the first two weeks of August 2006, seismic activity remained at low levels. Gas and steam emissions from the main crater continued. Galeras remained at Alert Level 3 (changes in the behavior of volcanic activity have been noted).
Information Contacts: Diego Gomez Martinez, Observatorio Vulcanológico y Sismológico de Pasto (OVSP), INGEOMINAS, Carrera 31, 1807 Parque Infantil, PO Box 1795, Pasto, Colombia (URL: https://www2.sgc.gov.co/volcanes/index.html; Washington Volcanic Ash Advisory Center (VAAC), Satellite Analysis Branch (SAB), NOAA/NESDIS E/SP23, NOAA Science Center Room 401, 5200 Auth Road, Camp Springs, MD 20746, USA (URL: http://www.ospo.noaa.gov/Products/atmosphere/vaac/); El Pais (URL: http://elpais-cali.terra.com.co/paisonline/); Reuters; British Broadcasting Company (BBC) (URL: http://www.bbc.co.uk/).
Eruption of January 2008
As reported in (BGVN 31:07) Galeras displayed dome growth and elevated seismicity from November 2005 through mid-August 2006; ~ 10,000 residents evacuated but the crisis later abated. The key source of this report was the Instituto Colombiano de Geologia y Mineria (INGEOMINAS). This report follows the August 2006 events and covers the period through April 2008.
In September 2006, INGEOMINAS recorded continuing low-level minor earthquakes, M 1.4, corresponding to the movement of fluids at depths between 4 and 8 km and low SO2 fluxes. A fly-over observed gas and steam emissions from the periphery of the active cone with diminished intensity through early November.
Beginning in late November and continuing through December 2006, an increase in the level of the volcanic activity occurred indicating the movement of solid material at focal depths to 9.6 km and at intensities to M 2.1. INGEOMINAS raised the Alert Level from 3 to 2 elevating the hazard status to "likely eruption in days or weeks" on 22 November 2006. The scale extends from 4 (lowest) to 1 ( highest hazard). The change was based on the increase in activity, behavior resembling characteristics that preceded earlier eruptions, i.e., increased earthquake activity associated with rock fractures within 2 km of the surface and weak gas emissions caused by the apparent capping of the lava dome.
On 2 March 2007, a tectonic earthquake was recorded ~ 2 km NNW of Galeras at M 3.5 and focal depth of 8.2 km. On 15 March, observations made with the support of the Colombian Air Force (FACE), showed continuing low rates of gas discharge continuing from secondary craters and fumaroles mainly located in the periphery of the main crater. On 20 March, because of decreased seismicity, low gas emissions, and no indication of changes below the surface of the dome, the Alert Level shifted towards less severe, from 2 to 3 (to "changes in the behavior of volcanic activity have been noted").
On 19 and 21 May 2007, two earthquakes registered, M 3.0 and M 2.1 respectively. These earthquakes were located SW of Galeras and felt by residents. The inclinometer to the SW of the active crater continued showing deformation indicating deeper volcanic activity.
Little volcanic activity occurred through September 2007. From October 2007 through January 2008, INGEOMINAS and the Washington Volcanic Ash Advisory Center reported an increase in gas-and steam plumes emitted from Galeras (table 8). During an overflight on 27 November, thermal images recorded by INGEOMINAS indicated an increase in temperatures at the point sources of emissions. The Alert Level remained at 3. Occasional gas and steam eruptions continued through January 2008.
Table 8. Summary of activity reported at Galeras from October 2007 through January 2008. Based on information from INGEOMINAS and the Washington Volcanic Ash Advisory Center.
| Date | Event | Maximum plume (km) | Plume direction |
| 04 Oct-05 Oct 2007 | Steam, ash | 5.8-6.3 | N, NW |
| 29 Oct-04 Nov 2007 | Steam, ash | 5.7 | -- |
| 05 Nov-11 Nov 2007 | Ash | 4.5-7.2 | NW, W |
| 13 Nov 2007 | Steam | 5.5 | S |
| 21-23 Nov 2007 | Steam and gas | 5.3 | -- |
| 27 Nov 2007 | Steam, gas, ash | 4.4 | NW |
| 03 Dec 2007 | Steam, gas, ash | 5.3 | NW |
| 31 Dec 2007 | Gas and ash | 4.9 | NW |
| 12 Jan 2008 | Steam, gas, ash | 6.3 | -- |
On 11 January 2008, INGEOMINAS noted variations in seismicity associated with greater volumes of gas discharge. On 16-17 January, 5 tremors were recorded near the active cone. Early on 17 January, INGEOMINAS noted the similarity of these events to those preceding the eruptions of 1992, 1993, and 2004-2006.
Later, on the 17th, an explosive eruption was registered by the seismic network and prompted INGEOMINAS to raise the Alert Level from 3 ("changes in the behavior of volcanic activity have been noted") to 1 ("imminent eruption or in course"). The Washington VAAC reported that an ash plume rose to an altitude of 11 km and drifted W. According to a news article, small settlements to the N were ordered to evacuate; about 100 people moved to shelters.
About 2 km away from the main crater, military personnel saw blocks 1.5 m in diameter on a highway. Several impact craters of 17 January were spotted; the largest, ~ 15 m across and ~ 5 m deep (figure 111).
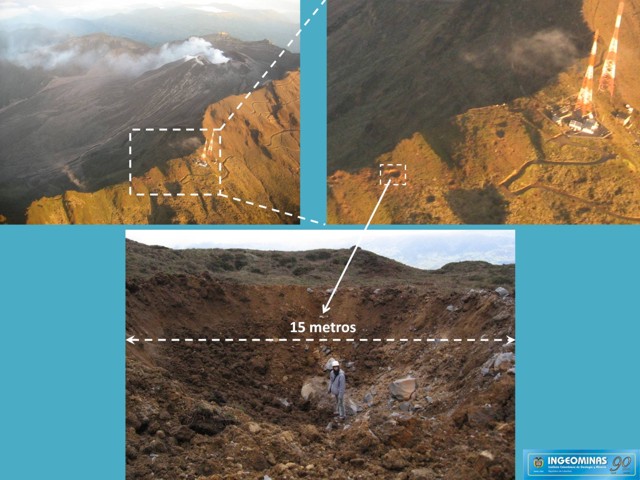 |
Figure 111. A composite of several photos showing a large impact crater formed by the Galeras eruption of 17 January 2008. The impact site was 1.5 km S of the main crater. Courtesy of INGEOMINAS. |
On 19 January 2008, INGEOMINAS lowered the Alert Level to 2 ("likely eruption in days of weeks") because seismic events decreased in occurrence and energy and on 21 January, INGEOMINAS further lowered the Alert Level to 3 and reported that the initial ash plume from the eruption drifted SW, then W. Through February and into March seismic activity remained low. However, in mid-March, a a cluster of earthquakes (several events in a relatively short time interval), associated mainly with movement of magmatic fluids to the interior of the volcanic system were recorded. Volcanic gas and steam columns were routinely observed between 200 and 450 m from the top of Galeras, with variable directions of dispersion depending on the wind direction. Seismicity decreased in early April and SO2 emissions remained low.
Information Contacts: Diego Gomez Martinez, Observatorio Vulcanológico y Sismológico de Pasto (OVSP), INGEOMINAS, Carrera 31, 1807 Parque Infantil, PO Box 1795, Pasto, Colombia (URL: https://www2.sgc.gov.co/volcanes/index.html; Washington Volcanic Ash Advisory Center (VAAC), Satellite Analysis Branch (SAB), NOAA/NESDIS E/SP23, NOAA Science Center Room 401, 5200 Auth Road, Camp Springs, MD 20746, USA (URL: http://www.ospo.noaa.gov/Products/atmosphere/vaac/); Associated Press (URL: http://www.ap.org/).
Ash plumes and thermal alerts continue into late 2008
The most recent report on Galeras (BGVN 33:03) discussed activity between September 2006 and April 2008 that included a number of minor earthquakes and plumes (mostly ash) that rose generally between 4.4 and 7.2 km in altitude. One eruption during that interval sent a plume up to 11 km altitude. In early April 2008, seismicity decreased. This report reviews September through 9 December 2008.
According to the Instituto Colombiano de Geologia y Mineria (INGEOMINAS) seismic activity at Galeras was low during April through August 2008, although a few small earthquakes occurred and emissions of steam, sometimes mixed with ash, were frequent. Some emission clouds reached greater than 1 km above the summit. Sulfur dioxide (SO2) levels were moderate, sometimes ranging above 8,000 tons per day. On 21 July, SO2 levels reached 10,800 tons per day.
The INGEOMINAS reported that an M 2 earthquake located S of Galeras occurred on 9 September at a depth of less than 1 km. Seismicity in September was dominated by long-period and tremor events (table 9). The SO2 emission rate fluctuated between 3,200 and 6,800 tons during 11-16 September, but jumped to 14,500 tons on the day after the earthquake. Gas plumes drifted W and NW.
Table 9. Seismic events at Galeras in September 2008. Courtesy of INGEOMINAS.
| Week | Long-period | Hybrid | Volcano-tectonic | Tremor | Other |
| 01 Sep-07 Sep 2008 | 116 | 0 | 6 | 138 | 2124 |
| 08 Sep-14 Sep 2008 | 75 | 2 | 7 | 51 | 1572 |
| 15 Sep-21 Sep 2008 | 78 | 11 | 12 | 108 | 1718 |
| 22 Sep-28 Sep 2008 | 146 | 9 | 8 | 234 | 1681 |
| 29 Sep-05 Oct 2008 | 144 | 5 | 7 | 366 | 1580 |
A 19 September overflight revealed incandescence coming from the main crater. Thermal images revealed that parts of the cone in the main crater measured 550°C; other anomalies on the cone's flanks measured 270°C. SO2 fluxes were near 8,200 tons per day. Further measurements during 19-23 September revealed temperatures between 500 and 600°C and SO2 fluxes between 3,000 and 5,200 tons per day. Gas emissions could be seen from the city of San Juan de Pasto on 2 and 4 October 2008 (figure 112).
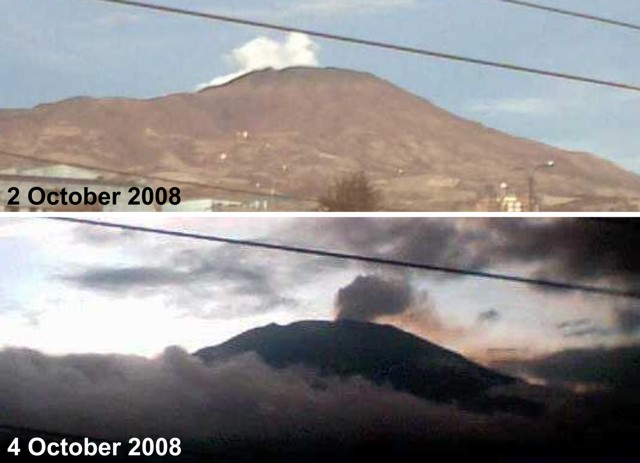 |
Figure 112. Photos of gas emissions from Galeras taken from the city of San Juan de Pasto on 2 and 4 October 2008. Courtesy of INGEOMINAS. |
According to INGEOMINAS, during the latter half of October and first week of November, white plumes (occasionally tinged gray or blue) rose from Galeras to altitudes of 4.5-7.4 km and drifted S, NW, and W. On 20 October, an M 2.3 earthquake located 600 m SSW of the main crater occurred at a depth of less than 1 km. During an overflight on 30 October, incandescence was observed on some parts of the lava dome.
On 11 November, INGEOMINAS reported that during the previous week, pulsating white plumes, occasionally tinged gray, rose to altitudes of 4.5-5.7 km and drifted W. On 30 November, ash emissions from Galeras were associated with seismic tremor that lasted about 30 minutes. The resultant ash plumes drifted 6-12.5 km S and SSW.
During an overflight on 11 December, thermal images of the lava dome in Galeras's crater were taken. The images revealed temperatures as hot as 530°C on the N side of the dome and near 80°C on the W side. Temperatures had declined compared to thermal images taken in October 2008. On 16 December, INGEOMINAS reported that during the previous few days, gas plumes rose to altitudes of 5.9-6.7 km and drifted NW.
During October, November, and December low seismicity and moderate gas emissions continued. Maximum SO2 emissions ranged from 780 to 5,300 tons per day.
MODVOLC. During 2008, MODVOLC registered several thermal alerts on Galeras's summit to NE sides (table 10). The MODVOLC thermal imaging system uses Modis instruments on the Aqua and Terra satellites. The MODVOLC thermal alert prior to those on table 10 took place on 30 December 2005.
Table 10. Thermal anomalies at Galeras based on MODVOLC imaging between 1 April and 4 December 2008 (continued from the list in BGVN 33:03). Courtesy of Hawai'i Institute of Geophysics and Planetology (HIGP) Thermal Alerts System.
| Date (UTC) | Time (UTC) | Pixels | Satellite |
| 05 Aug 2008 | 0350 | 1 | Terra |
| 05 Aug 2008 | 0645 | 2 | Aqua |
| 13 Sep 2008 | 0655 | 1 | Aqua |
| 24 Sep 2008 | 0340 | 1 | Terra |
| 24 Sep 2008 | 0635 | 1 | Aqua |
| 04 Dec 2008 | 0645 | 1 | Aqua |
As of 9 December, the level of activity of the volcano remained at 3 (Yellow), signifying that "changes in the behavior of volcanic activity have been noted." (Note: On the established local scale, Alert Level 1 is highest state of alert.)
Information Contacts: Instituto Colombiano de Geología y Minería (INGEOMINAS), Observatorio Vulcanológico y Sismológico de Popayán, Popayán, Colombia; Hawai'i Institute of Geophysics and Planetology (HIGP) Thermal Alerts System, School of Ocean and Earth Science and Technology (SOEST), Univ. of Hawai'i, 2525 Correa Road, Honolulu, HI 96822, USA (URL: http://modis.higp.hawaii.edu/).
Explosions during February-June 2009, ashfall up to 180 km away
Activity during 1 September to 16 December 2008 (BGVN 33:11) included modest seismicity, tremor, plumes, moderate sulfur-dioxide (SO2) emissions, and incandescence from the main crater and lava dome. This report describes activity chronicled by the Instituto Colombiano de Geologia y Mineria (INGEOMINAS) for 17 December 2008-31 July 2009.
This interval included explosive eruptions on 14 and 20 February, 13 March, 24 and 29 April, and 7 and 8 June. Some plumes rose to about 10-14 km altitude (the highest on 8 June) and carried significant ash. Seismicity on or near the volcano suggested fluid movements at depth.
On their website, INGEOMINAS provides comprehensive reports covering half-year intervals (starting in 2004). The latest available discusses the first half of 2008.
Mentioned in the latter report are more details on a large volcanic bomb from the 17 January 2008 eruption, which left a 15-m-diameter crater near the summit (BGVN 33:03). Field workers found only angular fragments of the original bomb in the impact crater (pieces often under 1 m in diameter)?but they estimated that the original bomb was on the order of 5 m in diameter. Photos of the downslope areas detected smaller impact craters thought to have been created by fragments that bounced out beyond the large crater. The same report also features isopach maps and discussion of grain size distributions for the 17 January 2008 eruption. That eruption emitted 870,000 m3 of material, which was dispersed up to 71 km W.
INGEOMINAS reported that the 14 February explosion was preceded by minor plumes (reaching 300-500 m above the crater rim) on 8 and 9 February. On 10 February, SO2 fluxes were 1,040-4,300 metric tons/day. The explosive eruption began at 1910 on 14 February. An accompanying shock wave was detected in multiple areas, including Pasto, a city about ~ 10 km E. Cloud cover prevented observations of the ash plume. From about 1930 until 2030, observers noted ashfall, rain, and an odor of sulfurous gas on the volcano's slopes as well as in Pasto. Ash fell mainly to the E and as far away as 25 km. The Alert Level was raised from III (Yellow; "changes in the behavior of volcanic activity") to I (Red; "imminent eruption or in progress"). The local hazards scale ranges from from IV (low) to I (high).
At 1950 seismicity dropped to levels similar to those recorded before the eruption. On 16 February, the Alert Level was lowered to II (Orange; "probable eruption within days or weeks"). During 16-17 February, small steam plumes rose to altitudes of 4.6-6.7 km and drifted SE, E, and NE. According to news accounts (Agence France-Presse, Caracol Radio), authorities ordered the evacuation of about 8,000 people on the slopes, but few went to shelters.
The explosion at 0705 on 20 February prompted authorities to raise the Alert Level back to I (Red). The 13-minute-long signals represented roughly double the seismic energy seen on the 14th. Shock waves were felt in several local communities. Associated sounds were heard in Popayán (~ 160 km NNE). Observers on the E flank reported two explosions, incandescent blocks ejected above the summit, ash emissions, and a sulfurous odor. Ashfall was reported to the W. Gas plumes with a low ash content continued, especially in the afternoon, reaching 700 m above the summit.
Although INGEOMINAS reported that the 20 February ash plume rose to 8 km altitude, analysis by the Washington Volcanic Ash Advisory Center (VAAC) yielded both a higher plume and variable displacements with altitude. The VAAC analysts, promptly notified by INGEOMINAS, compared plume motion seen on GOES-13 satellite imagery and winds from GFS (the Global Forecast System, a numerical weather prediction computer model run four times per day by NOAA). This enabled them to establish the plume's behavior with altitude. The resulting work indicated some of the ash rose as high as 12.5 km.
The VAAC's Ash Advisory of 20 February issued at 0835 local time was as follows: "INGEOMINAS reported an explosive eruption of Galeras at 1204 [UTC; 0704 local time]. Ash at FL410 [41,000 feet; 12.5 km altitude] was moving towards the E at 30 kts [knots, equivalent to 56 km/hour] while ash at FL220 [6.7 km altitude] was moving towards the W at 15-25 kts [28-46 km/hour]. Ash between these layers was moving N at 25 kts [46 km/hour]."
A Volcanic Ash Advisory issued on 20 February at 0854 local time noted "Ash to FL410 is quickly becoming diffuse as it races E while ash to FL280 remains identifiable moving towards the NW at 1315[UTC]." The next Advisory, at 1450 local time, noted ash had dissipated and no new eruptions were reported.
INGEOMINAS stated that the eruptions of 14 and 20 February released an estimated minimum volume of 2 x 10⁶ m3 of tephra. This was ~ 40% of the lava dome's volume. On 20 February, the SO2 was estimated at 100-800 tons/day. A few days later the values stood below 430 tons/day.
The Alert Level was lowered on 21 February and again on 3 March (to Level III). During 22 February to 10 March, occasional white gas plumes with variable ash content rose to a peak altitude of less than 6.3 km.
On 13 March, another explosive eruption occurred. Bad weather prevented direct observations, but the Washington VAAC noted a plume rising to an altitude of ~ 12.3 km drifting NW. The eruption produced sounds heard 10 km E and W. Ashfall was reported in multiple areas E and NW; a sulfur odor was also reported in some areas. Gas plumes with some ash rose on 14 March to an altitude of 6.3 km.
According to a news account in El Tiempo, authorities again ordered the evacuation of about 8,000 people living in high-risk areas, but as before this order was generally ignored. Soon after, the Alert Level was lowered to back to II. On 24 March, the Alert Level was lowered again to III. During the week ending around 24 March, daily SO2 levels were high. Earthquake levels were low in both intensity and occurrence. During 21-23 March, white-colored gas plumes rose to an altitude of 5.4 km and drifted in multiple directions.
On 3-7 April, pulsating gas plumes, sometimes containing ash, were seen when visibility was good. The plumes rose to altitudes less than ~ 6 km. Overflights on 5, 6, and 7 April revealed emissions from different areas in the main crater. On 7 April some of the higher temperature zones were 180°C, and an incandescent area measured 500°C.
Another explosive eruption occurred on 24 April. Incandescent blocks caused fires on the N flank. An accompanying shock wave was reported by residents up to 25 km away. A second eruption, longer but weaker than the first, was detected about 30 minutes later. Incandescence from both eruptions was seen from the city of Pasto. An ash plume rose to an altitude of ~ 10.3 km and ashfall was reported in areas up to 20 km W, WNW, and NW.
On 25 April, ash-and-gas plumes rose 1 km above the crater. Thermal anomalies in the crater near the W flank measured 100°C. Ejected rocks landed 2-3 km from the crater. According to a news article in Colombia Reports, residents living near the volcano were again ordered to evacuate; about 200 people responded. The Alert Level was lowered to II. Several days later, on 29 April, another eruption occurred. Observers reported that an ash plume drifted NW and ash fell in areas up to 35 km downwind.
During 4-5 May, ash plumes drifted NE and ashfall was reported in multiple areas of Pasto. On 6 May, gas-and-ash plumes rose to an altitude of 5.8 km and drifted NE. An overflight revealed incandescence from a vent 90-100 m in diameter in the main crater that had a temperature of 500°C. White plumes originated from multiple points inside and outside of the crater. The Alert Level was lowered to III.
On 9 May, an M 2.2 volcano-tectonic earthquake occurred 6 km to the NE of the main crater at a depth of ~ 10 km. On 11 May, seismicity increased, and hybrid earthquakes and tremor were detected. The seismicity, along with incandescence in the crater and low SO2 values, led INGEOMINAS to conclude that the volcano might have become overpressurized.
During 12-19 May Galeras emitted gas plumes, occasionally containing some ash. An overflight on 17 May revealed gas emissions from multiple points inside and outside the main crater. Some thermal anomalies surpassed 180°C. During 17-18 May, two M 2.9 earthquakes occurred 6 km SSE at depths of 2-3 km, and on 18 May an M 2.3 earthquake occurred at a depth of 3-5 km, 5 km SSW.
On 7 June, an eruption occurred that was preceded by a M 4 earthquake located about 3 km SSE of the crater at a depth of 2 km. Vibrations from an accompanying acoustic wave were detected by residents. The eruption produced an ash plume that rose to an altitude of 6.8 km and drifted NW; ashfall was reported downwind.
On 8 June, two explosions about 5 minutes apart were heard up to 45 km away. The event was preceded by an M 3.9 earthquake centered 1 km E at a depth near 2 km. Ashfall was reported the NW, up to 180 km away. Based on analysis of satellite imagery, the Washington VAAC reported that the ash plume rose to an altitude of 10 km and drifted NW. A second larger eruption produced an ash plume that rose to an altitude of 13.7 km and drifted SE.
Activity declined in the next few weeks. On 9 June, INGEOMINAS reported that seismicity and sulfur dioxide output were low, and that clear conditions revealed no emissions. On 10 June, INGEOMINAS lowered the Alert Level to II. Pulsating steam plumes rose from the crater and drifted NW.
On 19 June, INGEOMINAS lowered the Alert Level to III, based on increased SO2 degassing and seismicity (related to fluid movement) that seemingly resulted in the overall lowering of pressure in the volcanic system. Around this time, scientists on a monitoring flight saw gas emissions near the crater rim and recorded a thermal anomaly within the main crater. Gas plumes with some ash rose from Galeras on 22-23 June. An overflight on 23 June revealed that temperatures in the main crater measured 60° to 120°C, except for a small 220°C zone. Gas emissions originated from the periphery of the main crater. On 26 June, seismicity similar to that seen during previous eruptions, along with low rates of gas emissions, prompted INGEOMINAS to raise the Alert Level to II.
The last thermal anomalies at Galeras recorded from satellite by the MODVOLC system was on 4 December 2008. No alerts were recorded during 17 December 2008-31 July 2009.
Information Contacts: Instituto Colombiano de Geología y Minería (INGEOMINAS), Observatorio Vulcanológico y Sismológico de Popayán, Popayán, Colombia; Washington Volcanic Ash Advisory Center, Satellite Analysis Branch (SAB), NOAA/NESDIS E/SP23, NOAA Science Center Room 401, 5200 Auth Rd, Camp Springs, MD 20746, USA (URL: http://www.ospo.noaa.gov/Products/atmosphere/vaac/); Hawai'i Institute of Geophysics and Planetology (HIGP) Thermal Alerts System, School of Ocean and Earth Science and Technology (SOEST), Univ. of Hawai'i, 2525 Correa Road, Honolulu, HI 96822, USA (URL: ttp://hotspot.higp.hawaii.edu/); Agence France-Presse (URL: http://www.afp.com/afpcom/en); Caracol Radio (URL: http://www.caracol.com.co/); El Tiempo (URL: http://www.eltiempo.com/).
Explosive eruptions in September and November 2009, January 2010
Our last report on Galeras discussed ongoing explosions and ash plumes during February-June 2009 (BGVN 34:07). That report concluded with a rise in the alert level to II (orange; "probable eruption in terms of days or weeks") on 26 June 2009. That change followed elevated seismicity suggestive of precursory behavior similar to that of previous eruptions. This report continues coverage of activity from July 2009 to January 2010, including eruptions on 30 September and 30 November 2009, and 2 January 2010.
Overflight observations from 12 and 13 July 2009 found reduced crater temperatures, including a decrease from 220 to 100°C in one small area. In a 28 July report, INGEOMINAS reported earthquakes of up to M 1.6. Due to continuing low levels of activity, on 4 August the Alert Level was decreased to III (on a scale of I-IV, with I being high). It was also noted that there were active fumaroles on the W flank. An episode of tremor lasting ~3 hours was reported on 10 August, and an overflight on 23 August observed an increase in fumarolic activity since 12 July. On 8 September 2009 INGEOMINAS reported recent earthquakes of up to M 1.5.
Eruption of 30 September 2009. At 0914 on 30 September, INGEOMINAS reported an explosive eruption prompting the rise in Alert Level to I (red; "imminent eruption or in progress"). A second INGEOMINAS report stated that National Park personnel observed two explosions and ejection of incandescent material at the active cone, as well as an ash plume rising to ~12 km altitude that drifted E and later N. The SO2 measurements between 0930 and 1000 included values between 1,100 and 9,300 tons/day. Ashfall was reported in Sandoná (15 km NW), Ancuya, Linares, La Llanada, and Sotomayor (40 km NW). Seismicity decreased after the eruption and the Alert Level was lowered on 1 October to II and on 6 October to III.
On 30 October, INGEOMINAS reported that degassing had decreased and seismicity had increased, a previous indication of possible eruptions; the Alert Level was raised to II. A 3 November report described decreasing SO2 emissions and seismicity, and INGEOMINAS reported on 10 November that seismicity continued to decrease and SO2 was not detected. An overflight on 14 November detected low rates of gas discharge and thermal anomalies inside the main crater measuring 110°C.
Eruption of 20 November 2009. INGEOMINAS reported an explosive eruption on 20 November at 2037. Five explosions were reported by residents in San Cayetano, and incandescence was observed at the summit. The Washington Volcanic Ash Advisory Center (VAAC) reported an eruptive column to ~14 km altitude that drifted N, and ashfall occurred in Nariño, La Florida, and Bellavista. INGEOMINAS stated that seismicity levels associated with the eruption were lower than those during the 30 September eruption. Seismicity increased after the eruption but then gradually decreased. The Alert Level had been raised to I during the eruption but was dropped to II on 21 November and to III on 27 November.
Overflights on 26 November and 3 December revealed fumarolic activity in the main crater, with respective estimated temperatures up to 200°C and on the latter date, 155°C. The Alert Level was raised to II.
Earthquakes with magnitudes of up to 2.2 were measured during 12-15 December, at distances of up to 2 km from the crater and at depths of up to 3 km. INGEOMINAS noted that seismicity included both tornillo (BGVN 18:04) and pseudo-tornillo earthquakes. The seismicity was similar to the behavior prior to the eruptions on 30 September and 20 November. In a 29 December report, INGEOMINAS noted that these types of earthquakes have preceded the majority of the explosive eruptions of Galeras from 1992 to 2009.
Eruption of 2 January 2010. An explosive eruption at Galeras on 2 January at 1943 lasted ~30 minutes and prompted INGEOMINAS to raise the Alert Level to I. Ash emissions, summit incandescence, and ejected incandescent blocks that ignited surrounding areas of the volcano were observed. The Washington VAAC reported an eruptive column to 12 km altitude that drifted W and NW, with ashfall observed in Sandoná, Consacá, Ancuya, Linares, Samaniego, Santacruz-Guachavéz and La Llanada. Seismicity declined after the end of the eruptive event and INGEOMINAS lowered the Alert Level to II. An overflight on 3 January revealed diffuse white-colored gas plumes from the main crater. On 5 January ashfall was reported in areas as far as 110 km to the W, with falling blocks having reached distances of 3.2-3.5 km from the crater.
INGEOMINAS reported eight tornillo-type seismic events between 16-18 January, similar to those observed before previous eruptions, followed by low-to-moderate SO2 emissions beginning on 19 January and continuing low through at least 26 January.
Information Contacts: Instituto Colombiano de Geología y Minería (INGEOMINAS), Observatorio Vulcanológico y Sismológico de Popayán, Popayán, Colombia.
Eruption on 25 August 2010; gas emissions in early 2011
Our previous report (BGVN 34:12) covered explosive eruptions at Galeras on 30 September 2009, 20 November 2009, and 2 January 2010 (included in table 11). This report discusses the recent eruption in August 2010 and intense degassing and seismic events between January 2011 and May 2011.
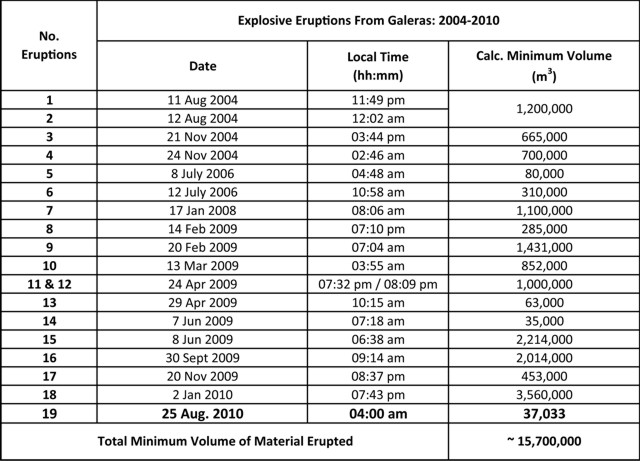 |
Table 11. Minimum volumes of erupted material from Galeras calculated for events from August 2004 to August 2010. Number of eruptions, Date, Local Time (hour and minute), and Calculated Minimum Volume in cubic meters. Adapted from INGEOMINAS (2010a). |
The Instituto Colombiano de Geología y Minería (INGEOMINAS) use an alert scale from I-IV, a Level I being the highest. They declared a Level I alert during an eruption in August 2010 and a Level II during unrest in late January 2011. To date, Level III status has been maintained since 8 February 2011.
Eruption of 25 August 2010. On 20 August 2010, after several days of increased gas emissions, an earthquake swarm began. According to INGEOMINAS, seismicity remained high during 21-22 August. Five volcano-tectonic earthquakes were felt by local residents and caused windows to vibrate. The events were located within a 300-900 m radius of the crater, at depths of less than 2 km. The largest event was M 4.3.
On 23 August a M 4.6 earthquake struck E of Galeras at a depth of 2 km. The Alert Level was raised to II (Orange; "probable eruption in terms of days or weeks"). SO2 emissions peaked at 304 tons/day on 23-24 August (table 12).
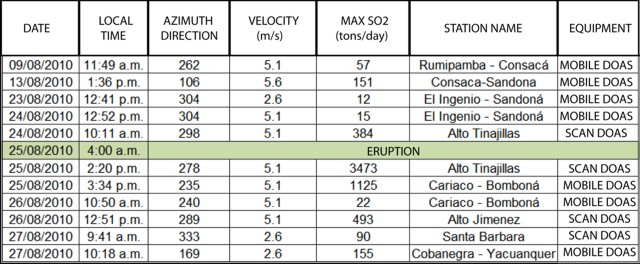 |
Table 12. Emissions of SO2 (metric tons/day) from Galeras during August 2010 measured by ScanDOAS and MovilDOAS (supported by Proyecto NOVAC). Low (under 500); Moderate (500-1,000); High (1,000-3,000); Very High (over 3,000). Courtesy of INGEOMINAS (2010a). |
An eruption began at 0400 on 25 August, prompting INGEOMINAS to raise the Alert Level to I (Red; "imminent eruption or in progress"). Meteorological cloud cover initially prevented visual observations of the summit, although an eruption plume was seen among the clouds and thermal anomalies were detected by an infrared camera. At ~0700, an overflight of the flanks was videorecorded which documented a low-altitude gray plume distinctive from the atmospheric clouds (INGEOMINAS, 2010c). With a thermal camera, the Colombian Air Force documented that hot material fell from the secondary crater, El Paisita (INGEOMINAS, 2010b). Ashfall was reported to the NW, as far away as 30 km and quantified as over 37,033 m3 of material (table 11). Ash was reported in Samaniego, Linares, Ancuya, Sandoná, and Consacá. Observers in Pasto (~ 10 km E) reported that gas-and-ash plumes rose 300 m above the crater.
Seismicity associated with the 25 August eruption continued for a period of about 12 hours and gradually declined in the afternoon. INGEOMINAS lowered the Alert Level to II. According to news articles, at least 7,000 residents were ordered by government officials to evacuate, although few left their homes. During 26-31 August, at least 12 earthquakes, M 2-4, struck within a 2 km radius from the crater, at depths not more than 3 km. Gas plumes drifted NW, then S.
Seismic and thermal activity in 2011 through May. Overflights conducted by INGEOMINAS on 7 January 2011 collected multiple infrared and visible photopairs, one set of which appears as figure 113. The maximum temperature of the central crater reached 287.2°C. Temperatures of the rim and flank fumaroles were also recorded. A calculation was made for an area of three fumaroles close to the rim yielding a maximum temperature of 31.2°C.
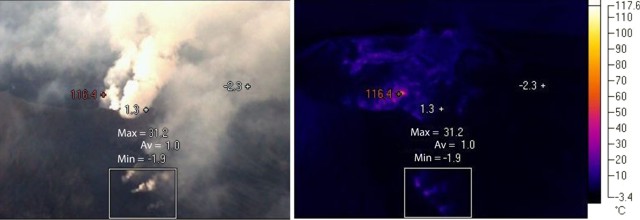 |
Figure 113. A set of visible (left) and infrared (right) photo of both the crater and some flank fumaroles at Galeras taken during an INGEOMINAS overflight on 7 January 2011. The flank location is not disclosed. Taken from INGEOMINAS (2011b). |
According to INGEOMINAS, on 25 January an emerging seismic pattern from Galeras, characterized by "tornillo-type" earthquakes, was similar to patterns detected before past eruptions. Tornillos are "monochromatic [narrow range of frequencies] long-period seismic events of a few minutes duration with long codas of constantly decreasing amplitude" (Morrissey and Mastin, 2000). The waveform of a tornillo is illustrated and described in more depth in BGVN27:05. The staff noted a strong sulfur gas odor and observed emissions that drifted N from various areas of the crater. Based on changes in seismicity and observed gas emissions, INGEOMINAS raised the Alert Level to II.
On 27 January 2011, scientists again observed emissions from various areas of the crater during an overflight (figure 114) and there was a slight increase in the number of vents. Gas plumes drifted NW and thermal imagery showed clearly-defined fumaroles. Imagery measured the maximum temperature of the central vent around 300°C (reported as 294.7°C).
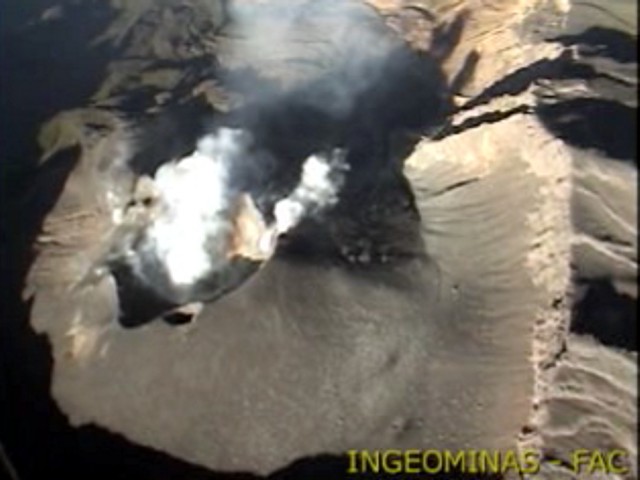 |
Figure 114. A stillshot from video footage of degassing at Galeras taken during an INGEOMINAS overflight on 27 January 2011. Gas from the crater and fumaroles was blown in a diffuse plume moving approximately W. Look direction is W. Taken from INGEOMINAS (2011b). |
On the morning of 30 January, tornillos ceased.
In early February 2011, seismic levels continued to fluctuate. On 6 February an overflight revealed that gas emissions had increased in comparison to the previous week, forming plumes that drifted NW; however INGEOMINAS lowered the Alert Level to III.
INGEOMINAS reported gas-and-steam emissions on 31 March and 1 April with low ash content. On 1 April, a M 2.3 earthquake occurred 3 km E of the crater at a depth of 6 km and was felt by nearby residents. During an overflight on 2 April, scientists noted a sulfur gas odor and observed that gas emissions rose from multiple areas of the active cone. During 30 March-5 April, SO2 gas values were between 50 and 2,000 tons per day, the latter value considered high for Galeras.
As of 7 April 2011 there was a decrease in transient seismic signals. Within the first week of the month there were three tornillo events with oscillations around 7.5 Hz. After 7 April tornillos were no longer recorded and seismicity was dominated by an increase of events interpreted as the result of fluid motion within the volcanic system and gas emissions. The April 2011 INGEOMINAS monthly report concluded that hypocenters of earthquakes clustered in three distinct zones (figure 115).
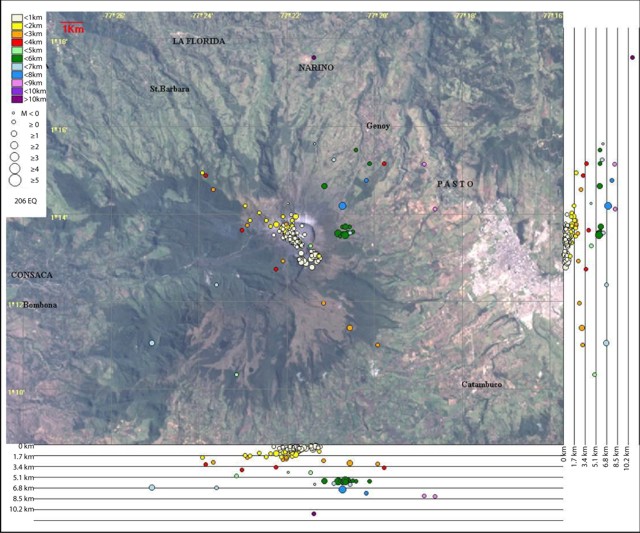 |
Figure 115. A map and cross sections plotting 206 epicenters and hypocenters of volcano-tectonic and hybrid earthquakes that occurred during 1-30 April 2011 at Galeras. In the N-S section (right) and the E-W section (bottom), each line represents 1.7 km of depth with respect to the summit (elevation, ~4,200 m). Magnitudes of seismic events are indicated by circle size. Colors indicate depths, which ranged from under 1 km to over 10 km. Courtesy of INGEOMINAS (2011c). |
One zone was a shallow (under1 km) area focused on the crater in the SE sector. A second source was located to the W of the crater with depths up to 2.5 km (with respect to the summit) and a deeper source was identified between 5 and 7.5 km to the E of the crater. The most distant events (up to 8 km) were dispersed with depths around 11 km. The largest of these, M 2.4, occurred at 0454 on 1 April.
Between 13 April-17 May 2011, steam rose up to 1.2 km in altitude and the values of SO2 ranged from low to high with emission values reaching up to 1,600 tons per day. Residents in the city of San Juan de Pasto, just to the E, reported the foul odor of sulfur gases, mainly H2S. On 18 April, an onsite INGEOMINAS team noted a strong odor of sulfur gases and emission from both the main crater and secondary craters and fumarolic fields. That same day a M 1.9 earthquake occurred 6 km SW of Galeras at a depth of ~7 km.
According to INGEOMINAS, favorable weather conditions during 11, 15-10, and 22 May allowed observers to note plumes with heights up to 700 m. On 15-16 May, heavy rains produced lahars that swept down Galeras'slopes carrying rocks, soil, and plant material into and down drainages.
With support from the Colombian Air Force, overflights of Galeras were conducted on 18, 20 and 22 May. Various rates of gas emissions were observed, mostly from vents, secondary craters, and cracks on the slopes of the active cone. Thermal anomalies were detected in various areas, with an average value of 170°C at the bottom of the main crater and 205°C in the secondary crater "The Paisita" N of the active cone.
References. INGEOMINAS, Instituto Colombiano de Geología y Minería, 2010a, Pasto Observatory Work Group: Monthly Report on Galeras and the Volcanoes of Doña Juana, Cumbal, and Azufral, August 2010 (URL: http://intranet.ingeominas.gov.co/pasto/images/1/1e/Boletin_mensual_de_actividad_de_los_volcanes_del_sur_agosto_2010.pdf).
INGEOMINAS, Instituto Colombiano de Geología y Minería, 2010b, Review of Activity from Galeras 24 Aug.-30 Aug., 2010, (URL: http://intranet.ingeominas.gov.co/pasto/Imagen:Resumen_actividad_galeras_ago_24_ago_30_2010.pdf).
INGEOMINAS, Instituto Colombiano de Geología y Minería, 2010c, Sobrevuelo volcán Galeras 8/25/2010, (URL: http://intranet.ingeominas.gov.co/pasto/Videos_2010).
INGEOMINAS, Instituto Colombiano de Geología y Minería, 2011a, Thermal Images 2011, 1/7/2011,
(URL: http://intranet.ingeominas.gov.co/pasto/Imágenes_térmicas_2011).
INGEOMINAS, Instituto Colombiano de Geología y Minería, 2011b, Sobrevuelo volcán Galeras 1/27/2011, (URL: http://intranet.ingeominas.gov.co/pasto/Videos_2011).
INGEOMINAS, Instituto Colombiano de Geología y Minería, 2011c, Pasto Observatory Work Group: Monthly Report on Galeras and the Volcanoes of Doña Juana, Cumbal, and Azufral, April 2011 (URL: http://intranet.ingeominas.gov.co/pasto/images/8/8b/Boletin_mensual_de_actividad_de_los_volcanes_del_sur_abril_2011.pdf).
Morrissey, M.M., and Mastin, L.G., 2000, Vulcanian Eruptions, in Sigurdsson, H., ed., Encyclopedia of Volcanoes: San Diego, California, Academic Press, p. 463-475.
Information Contacts: Instituto Colombiano de Geología y Minería (INGEOMINAS), Observatorio Vulcanológico y Sismológico de Popayán, Popayán, Colombia.
Frequent seismic swarms, elevated SO2; ash explosions begin in May 2012
Our last report focused on the VEI 2 eruption of August 2010 as well as results from regular monitoring through May 2011 by the Instituto Colombiano de Geología y Minería (INGEOMINAS) based in Pasto, the provincial capital located ~10 km E of Galeras. Here we discuss the continuing efforts to monitor Galeras from June 2011 through April 2012. We highlight regular measurements from telemetered tiltmeter data, SO2 flux values, and earthquake cataloging and analysis. Additional monitoring activities, including radon gas assessments and thermal measurements, were conducted by INGEOMINAS and reported in weekly and monthly reports online. We briefly mention ash explosions that began on 13 May 2012.
April 2011-April 2012 Seismicity. During this reporting period, INGEOMINAS characterized five types of earthquake events: volcano-tectonic (VT), long-period (LP), tremor (TRE), hybrid (HYB), and tornillo (TOR). This data is available in online reports on the INGEOMINAS website for various years.
Earthquakes during this time were rarely deeper than 20 km and clustered ~2 km below the summit, and at times, ranging 5-8 km (table 13). Seismicity was dominated by hybrid events, signals characterizing fracturing and fluid movement. Tremor frequently occurred from May-July 2011 and December 2011-January 2012. From January-March 2012, the duration of tremor was longer than 800 minutes/month (table 13). LP events occurred most frequently in April 2011 and February 2012; VT events primarily appeared in March and April 2012. Tornillo events had been rare in 2011 but were the cause for alarm in November 2011 when INGEOMINAS detected 18 events. The seismic pattern of "tornillo-type" earthquakes has been associated with pre-eruptive conditions - in particular, explosive activity in 1992 and 2010 was preceded by episodes of tornillos (BGVN 34:12). The Alert Level was raised in November (to Orange, on a four-color scale) but lowered again in December (to Yellow) when these signals disappeared from the records; only two events were recorded in December 2011, then again in February 2012.
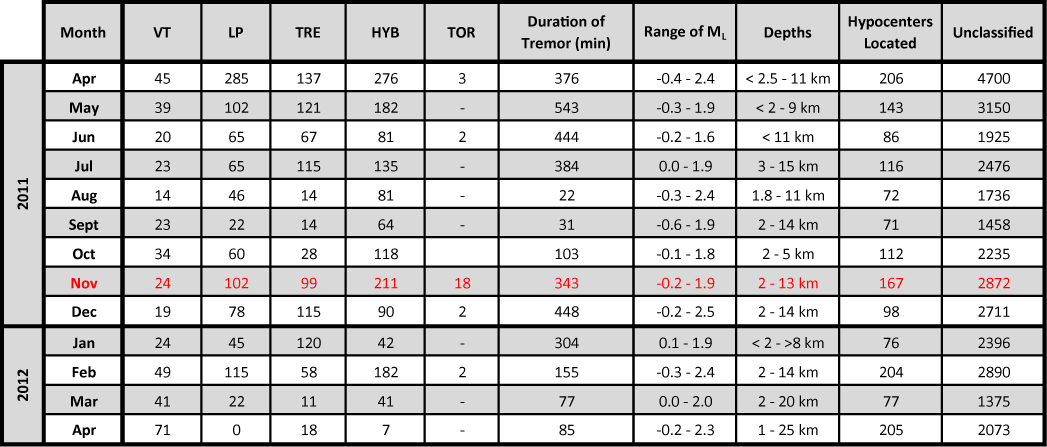 |
Table 13. Seismicity at Galeras from April 2011 through April 2012. Earthquake counts for five types of events: volcano-tectonic (VT), long-period (LP), tremor (TRE), hybrid (HYB), and tornillos (TOR). The Alert Level was raised to Orange in November (highlighted in red). Tornillos occurred rarely during this reporting period; "-" indicates events were not reported. Courtesy of INGEOMINAS. |
June 2011. INGEOMINAS reported that seismic energy was relatively low this month compared to May 2011. Inflation and deformation events were recorded by two tilt stations (Cráter and Calabazo); other stations, however, were stable (see figure 116 for monitoring station locations). The most proximal tilt station, Cráter, recorded the largest changes in deformation, and especially the radial component (often an order of magnitude larger than the tangential component). During this reporting period, INGEOMINAS frequently included data from the two component tiltmeters and calculated the vectors for Cráter (see INGEOMINAS online reports).
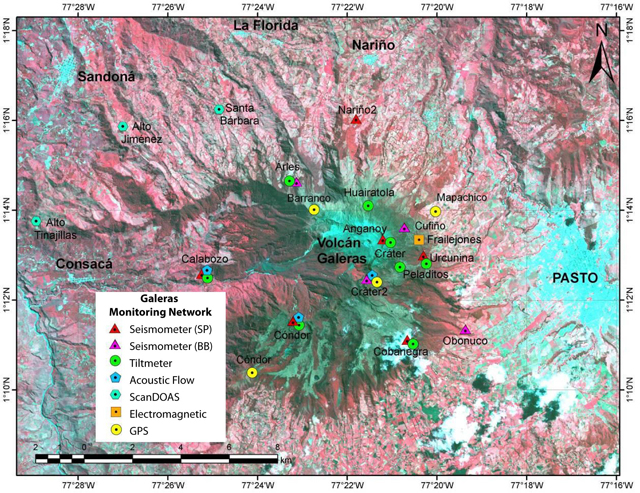 |
Figure 116. Map of station locations for the INGEOMINAS Pasto monitoring network (from the April 2012 online monthly report). Instrumentation includes: seismometers (SP = short period, BB = broadband), tiltmeters, acoustic flow, ScanDOAS, electromagnetic potential, and Global Positioning System (GPS) stations, as indicated in the legend. This map does not include all monitoring sites, for example fixed stations for Radon and EDM are also part of the network with results posted online. Courtesy of INGEOMINAS. |
Large amounts of steam and gas rose from Galeras' crater in June; a plume was frequently observed with a height up to 400 m above the crater. The plume was primarily water vapor, and measurements of SO2 flux showed high variability. INGEOMINAS reported values from ScanDOAS and MobileDOAS ranging from 41-1,455 tons/day; a total of 22 measurements with wind direction and velocity were taken between 1-30 June. The maximum measurement of SO2 flux was made by ScanDOAS from the Santa Bárbara station located 7.0 km NNW from the summit. The minimum value was measured along a traverse with MobileDOAS between the towns La Buitrera and Sandoná (see figure 116 for locations, La Buitera is beyond the map).
July 2011. Seismic energy was 75% higher in July compared with calculations in June. A low-energy seismic swarm of LP events was recorded during 18-19 July. Seismic swarms have occurred periodically at Galeras, the last episode was recorded in early April 2011; this was also the last time tornillo earthquakes were detected (table 13). Deformation continued with fluctuations, however, fieldwork was necessary to reinstall the Cráter tiltmeter (located 0.8 km E of the main crater and at 4,060 m above sea level) when it was disrupted by electric storms on 11 July 2011; the tiltmeter was back online on 20 July.
During clear conditions, a steam plume was visible from Galeras which reached a maximum of 1.5 km above the crater. The maximum SO2 flux for July was 1,080 tons/day which was obtained on 11 July at the Santa Bárbara station with ScanDOAS. A total of 15 measurements with wind direction and velocity were taken between 6 and 23 July. The minimum measurement of SO2 flux was made on 19 July by ScanDOAS, also from the Santa Bárbara station (stations Alto Jiménez and Alto Tinajillas were also recording values).
August 2011. An hour-long seismic swarm was recorded starting at 1800 on 24 August. INGEOMINAS classified these earthquakes as primarily long-period, suggesting that hydrothermal processes were active beneath Galeras. Three of the tiltmeters (Cráter, Huairatola, and Calabozo) indicated deformation and two stations (Peladitos and Cobanegra) showed no change.
Emissions continued to be visible from the crater; a white plume was frequently observed that rose 800 m above the crater rim. SO2 levels were significantly low in August; INGEOMINAS calculated the maximum SO2 flux as 185 tons/day from the Santa Bárbara station on 3 August. A total of 26 measurements were recorded from 1 to 31 August. The lowest value, 25 tons/day, was recorded during a traverse along the northeastern route (between the towns of Genoy and Nariño) on 9 August with MobileDOAS.
September 2011. Seismicity continued at low levels and few earthquakes were large enough to locate (table 13). On 6 September a swarm of hybrid earthquakes was recorded; this was a small episode that occurred between 0600 and 0800. Tilt stations Cráter and Huairatola recorded fluctuations while Calabozo, Peladitos, and Cobanegra showed no significant changes.
The summit was visible for much of September; the plume rose typically less than 500 m above the crater. According to INGEOMINAS, SO2 levels were low in September. A total of 16 measurements were recorded by ScanDOAS from one fixed station (Santa Bárbara station), flux ranged from 51-225 tons/day.
October 2011. INGEOMINAS reported that an earthquake swarm occurred during 25-30 October. Events were characterized as hybrids, suggesting fluid movement and hydrothermal processes; hypocenters were very shallow, less than 2 km beneath the crater. Tilt stations Cráter, Huairatola, and Calabozo recorded fluctuations while Peladitos and Urcunina showed no significant changes.
In October, conditions were favorable for observing the summit area of Galeras. A column of white vapor was visible during most of the month; the plume rose to a height of 800 m above the rim. SO2 flux was relatively low; 19 values were recorded between 1-31 October. The maximum value was 340 tons/day as recorded on 1 October by the Alto Jiménez station (located 10.8 km NW of the summit). The lowest value, 32 tons/day, was recorded at the Santa Bárbara station on 10 October.
November 2011.INGEOMINAS continued registering swarms of shallow VT earthquakes. These events were primarily located at depths less than 1 km from the crater with magnitudes
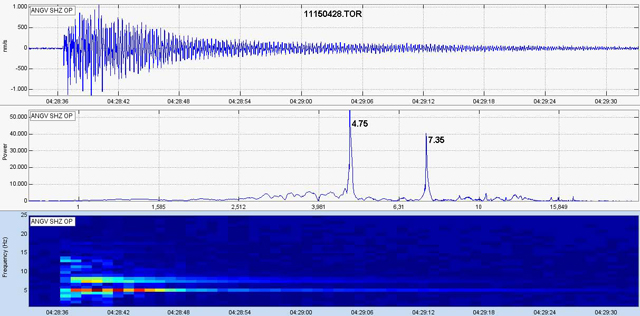 |
Figure 117. Seismogram, energy peaks, and spectrogram of the frequency of a tornillo event recorded on 14 November 2011 at 2328 from Galeras. Courtesy of INGEOMINAS. |
Several overflights of the crater were conducted in November by INGEOMINAS along with the Colombian Air Force (figure 118). During these flights, staff observed conditions within the crater and noted a strong sulfur odor. Thermal anomalies were detected with a forward-looking infrared (FLIR) camera; on 2 and 26 November, investigators recorded maximum temperatures around 200°C.
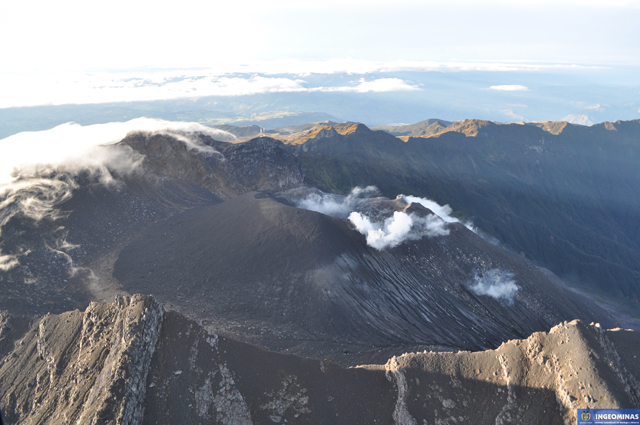 |
Figure 118. An aerial view of Galeras looking S toward a police station and towers on the crater rim. Photo taken during reconnaissance by INGEOMINAS on 2 November 2011. |
INGEOMINAS reported significant changes in tilt from the Cráter station (figure 119). Between 7 September and 30 November, there were variations between 3,720 and 920 µrad with increasing and decreasing trends for tangential and radial components, respectively. Trends were also recorded from stations: Peladitos, Huairatola, and Cobanegra. Stations Calabozo and Urcunina showed small fluctuations and were considered stable.
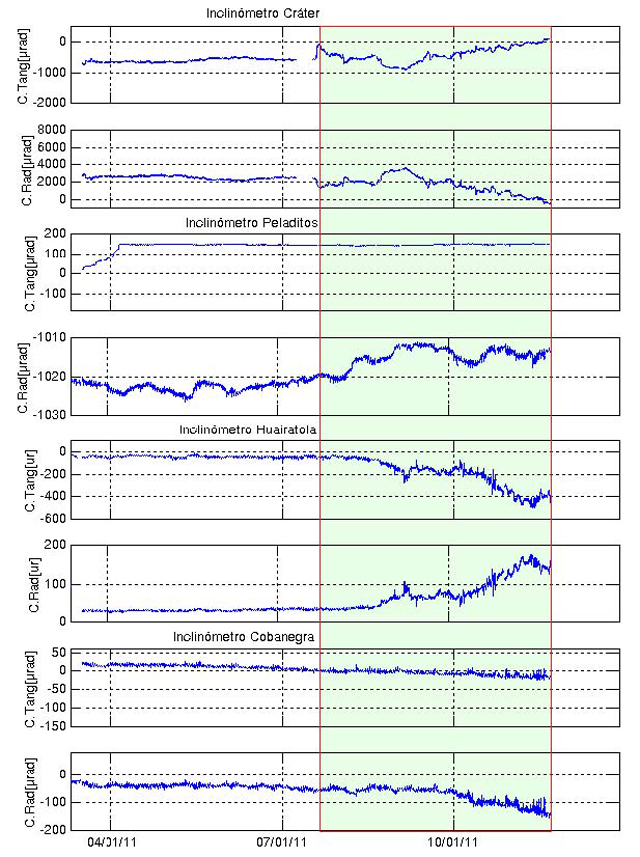 |
Figure 119. Galeras tiltmeter data (Radial and Tangential components are 'C.Rad' and 'C.Tang', respectively) from stations Cráter, Peladitos, Huairatola, and Cobanegra from April through November 2011. Courtesy of INGEOMINAS. |
INGEOMINAS reported that SO2 flux in November ranged from 5 to 178 tons/day. The highest values were recorded by stations implementing ScanDOAS; the Alto Jiménez station recorded the maximum on 5 November. The lowest value was from a MobileDOAS traverse along the Sandoná route on 30 November.
December 2011. The Alert Level was lowered from Orange to Yellow on 6 December due to reduced seismicity; tornillo events were no longer recorded. The tilt station Cráter continued to register changes. INGEOMINAS determined that the NE sector of the volcano exhibited deflation from 7 September to 24 November (figure 119) and beginning on 24 November a change occurred and inflation began. The records suggested that the Huairatola station was detecting deflation of the NE sector from 6 August to 31 December. Data from Cobanegra, from 28 February to 31 December, was also consistent with showing changes in the NE. The Peladitos, Urcunina, and Cóndor stations showed small variations and were considered stable.
In collaboration with the Colombian Air Force, INGEOMINAS conducted an overflight of the crater on 6 December. Several thermal images were taken with a FLIR camera (figure 120). The highest temperature recorded was 200°C.
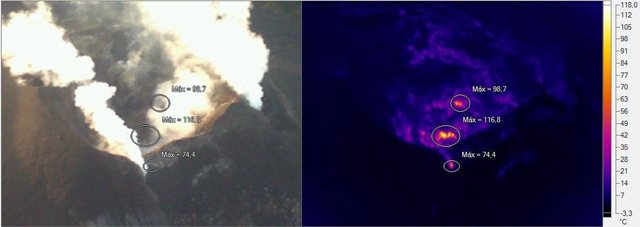 |
Figure 120. On 6 December 2012 INGEOMINAS retrieved thermal images of Galeras. In the FLIR image on the right, three maximum temperatures were captured: 116.8°C, 98.7°C, and 74.4°C. Courtesy of INGEOMINAS. |
Increased degassing was noted from two sites on the N edge of the crater, Paisita and Chavas (for a crater location map, see figure 87 in BGVN 23:01). SO2 flux was measured by three fixed ScanDOAS stations; a total of 12 measurements were recorded during 1-22 December. Emissions were low and ranging from 21 to 310 tons/day. INGEOMINAS recorded the maximum value from Alto Tinajillas (located 13.3 km W of the crater, figure 116) on 14 December; the minimum was from Santa Bárbara on 9 December.
January 2012. On 31 January, INGEOMINAS reported that a seismic swarm dominated by short-period VT events was recorded. Deformation detected by the Cráter station suggested three unique episodes where radial tilt was increasing, stabilized, and decreased. The tangential component exhibited an inversion of this trend: decreasing, stabilization, and increasing. INGEOMINAS calculated 657 µrad of inflation within the central crater, followed by stabilization and later, deflation measured as 264 µrad.
Steam continued to rise from Paisita and Chavas craters. A white plume was typically visible low over the crater however, on 5, 11, and 21 January, the plume height varied between 500 and 800 m. INGEOMINAS reported that SO2 flux continued at low levels, ranging from 32-259 tons/day. A total of 12 values were obtained from fixed ScanDOAS stations. The maximum value was recorded at the Santa Bárbara station on 27 January.
February 2012. Seismic swarms occurred in February consisting primarily of small, shallow events. At 2148 on 27 February the short-period seismic station Anganoy (located 0.8 km E of the crater, figure 116) recorded an event INGEOMINAS characterized as a 'pseudo-Tornillo'; this event had a dominant frequency of 4.1 Hz and a duration of 36 seconds.
Pseudo-tornillos appeared to be rare events and had occurred previously in November 2011. These have much shorter codas (tails) compared to those of the tornillo signals. The latter last up to several minutes, have small amplitudes compared to duration, and generally decay progressively so their seismic traces appear screw-like in appearance (tornillos is Spanish for screw). These features and various other subtypes and their diagnostic signal characteristics and names are discussed in Narváez and others (1997).
Deformation measured by the Cráter station recorded 774 µrad of deflation in the central crater. The Cobanegra station registered decreasing trends; the stations Peladitos, Urcunina, and Cóndor were considered stable.
A white plume from the crater was visible by webcameras and reached heights less than 800 m above the rim. SO2 flux in February remained low and ranged from 8 to 498 tons/day. A total of 27 values were recorded from fixed ScanDOAS and MobileDOAS measurements. The maximum flux was recorded on 22 February at the Alto Jiménez station.
March 2012. In March, seismic energy decreased by 89.1% compared to February, and few earthquakes were located. However, tremor continued (table 13). The Cráter tiltmeter recorded variability in early March, and from 22 to 31 March, 1,440 µrad of inflation was recorded within the central crater. The Cobanegra station recorded decreasing trends with both components while the stations Peladitos, Urcunina, Cóndor, Calabozo, and Arlés were considered stable.
A white plume was visible during most of the month except for four days. Plume height was maintained below 1.9 km. On 2 March, the National Park reported strong sulfur odors and also received alerts from the municipal committee of Sandoná that gas was noticeable.
Based on fixed and mobile detectors, INGEOMINAS reported that SO2 flux increased dramatically in March. A maximum of 3,390 tons/day was recorded by the Alto Jiménez station on 15 March. The lowest value recorded was 305 tons/day during a traverse along the Consaca-Sandoná route on 30 March. A total of 33 measurements were collected from 1 to 31 March.
April 2012. INGEOMINAS reported that seismic swarms occurred during 5-8 and 11-16 April consisting primarily of small, shallow VT events. The Cráter and Huairatola tilt stations registered variability suggesting inflation in the W sector of Galeras, an area known for high seismicity. The Cobanegra station recorded decreasing trends from both components between 85 and 430 µrad. The other stations were considered stable.
A white plume was frequently visible above the crater in April. Webcameras and observers recorded a maximum height of 2,000 m. On 16 April, the local committee for the prevention of disasters (CLOPAD) of the provincial capital, Pasto, received reports from inhabitants near the N flank of Galeras; gas emissions were visible and people could hear noises from the crater.
SO2 flux continued at elevated levels in April. INGEOMINAS recorded 33 measurements during April. A maximum of 1,477 tons/day was recorded at the Alto Jiménez station on 2 April. The highest levels of SO2 emissions were recorded within the first week of April, averaging 1,012 tons/day. The lowest value was recorded on 13 April, 10 tons/day, along the La Florida-Sandoná route with MobileDOAS.
Editor's Note: INGEOMINAS and the Washington Volcanic Ash Advisory Center (VAAC) reported that ash emissions were detected in early May 2012 (figure 121) and continued into early June.
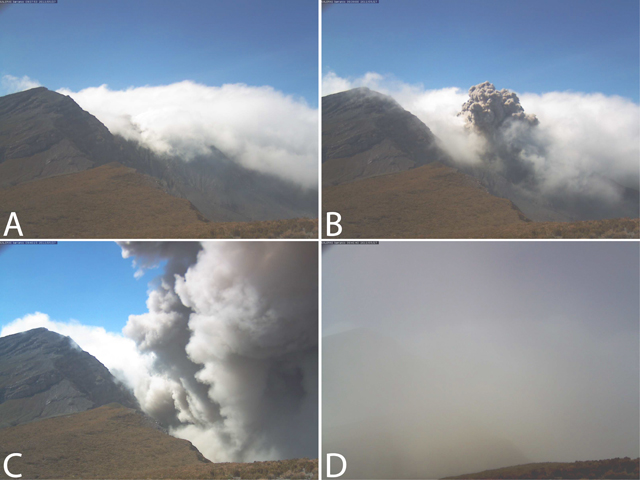 |
Figure 121. An ash explosion from Galeras was captured by the "Barranco" webcamera on 27 May 2012. This high-resolution camera was located on the NW rim of the crater. Timing of photo sequence: A. 09:37:53; B. 09:39:08; C. 09:40:15; D. 09:41:40. Courtesy of INGEOMINAS. |
Reference. Narváez, L.M., Torres, R.A., Gómez, D.M., Cortez, G.P., Cepeda, H.V., and Stix, J., 1997. 'Tornillo'-type seismic signals at Galeras volcano, Colombia, 1992-1993, Journal of Volcanology and Geothermal Research, 77: 159-171.
Information Contacts: Instituto Colombiano de Geologia y Mineria (INGEOMINAS), Observatorio Vulcanológico y Sismológico de Pasto, Pasto, Colombia (URL: https://www2.sgc.gov.co/volcanes/index.html); Washington Volcanic Ash Advisory Center (VAAC), Satellite Analysis Branch (SAB), NOAA/NESDIS E/SP23, NOAA Science Center Room 401, 5200 Auth Rd, Camp Springs, MD 20746, USA (URL: http://www.ospo.noaa.gov/Products/atmosphere/vaac/).
Ash emissions and elevated seismicity during May 2012-March 2013
The elevated activity previously covered in May 2012 (BGVN 37:04) continued through March 2013. This report describes the ash events and monitoring efforts during that time as well as trends in seismic, gas, and geodetic data. The Servicio Geológico Colombiano (SGC) maintained Alert Level III (Yellow; "changes in the behavior of volcanic activity") during this 11-month reporting period.
From the observatory based in Pasto (~10 km E of Galeras's summit), the SGC (formerly known as Instituto Colombiano de Geología y Minería "INGEOMINAS") maintained an extensive monitoring network (table 11). During May 2012-March 2013, they highlighted the following events in their monthly activity reports (available online): ash plumes, ashfall, elevated seismicity (including swarms), SO2 emissions, and sulfur odors detected by observers near the volcano.
Table 11. The SGC network for monitoring Galeras included more than 50 instruments during May 2012-March 2013; the newest station, added in March 2013, is an additional magnetic and self-potential monitoring station. Courtesy of SGC.
| Instrument Description | Quantity | Instrument Location(s) |
| Radon gas sensors (diffuse soil emissions) | 20 | Two transects covering the E (Galeras Line) and N (Barranco Line) sectors |
| Seismic stations (seven short period and five broadband; telemetered) | 12 | See Figure 116 in BGVN 37:04 |
| Electronic tilt stations (telemetered) | 8 | See Figure 116 in BGVN 37:04 and figure 9 |
| DOAS stations; three ScanDOAS (telemetered) and one portable MiniDOAS (NOVAC Program) | 4 | Santa Bá, Alto Jimenez, Alto Tinajillas (figure 116 in BGVN 37:04 and figure 6) |
| GPS stations (telemetered) | 4 | Cráter, Cóndor, Barranco, (Mapachio stopped in Aug. 2012), San Cavetano (figure 116 in BGVN 37:04 and figure 9) |
| Infrasound stations | 3 | Seismic stations Cráter-2, Cóndor, and Calabozo (figure 116 in BGVN 37:04) |
| Video cameras | 3 | Two in towns (Pasto and Consacá in figure 6) and one at seismic station Barranco Alto (figure 116 in BGVN 37:04) |
| Flood monitoring stations | 2 | Watershed of Mijitayo (figure 6) (including geophone and flood gauges; telemetered) |
| Magnetic and self-potential systems | 2 | Stations Frailejónes and Barranco (added in March 2013; figure 116 in BGVN 37:04) |
| Wind station (speed and direction; telemetered) | 1 | Seismic station Cráter-2 (figure 116 in BGVN 37:04) |
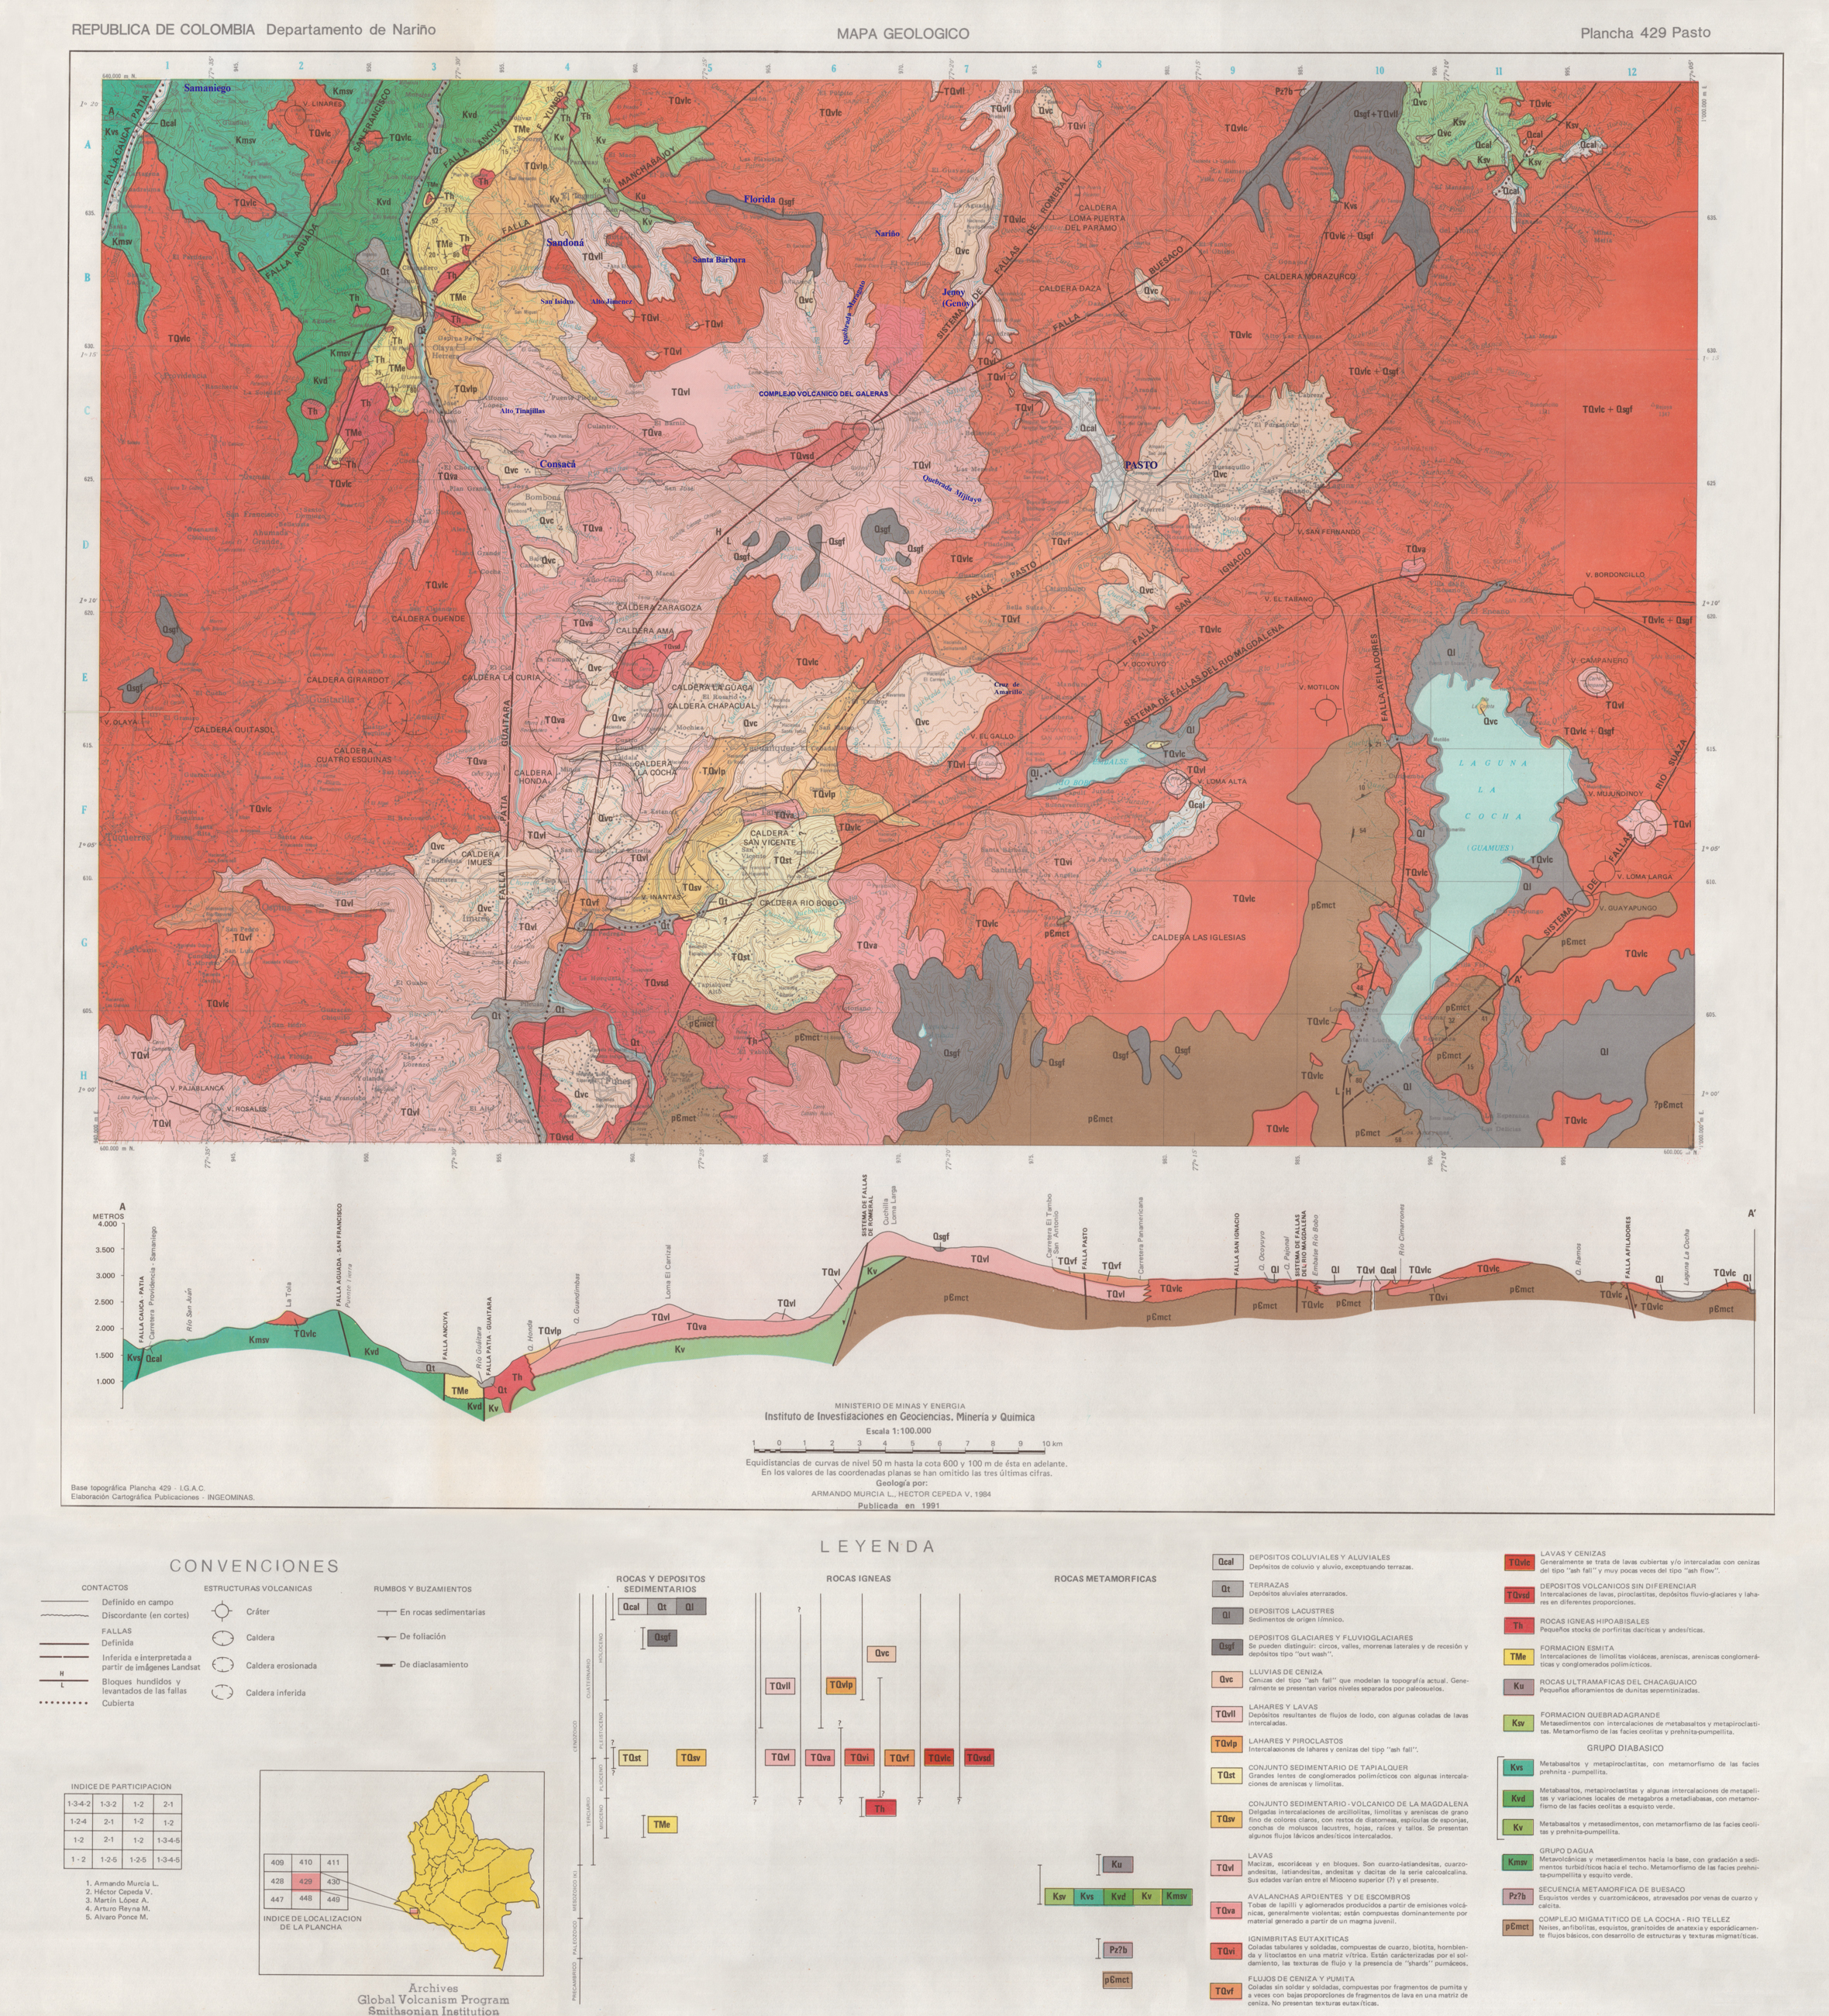 |
Figure 122. This geologic map of Galeras includes regional geology and a detailed stratigraphic column. Heavy blue lettering was added to emphasize those names in this report. The geology of Galeras was mapped by Armando Murcia L. and Hector Cepeda V. in 1984 and published by the Instituto Colombiano de Geología y Minería, now known as the Servicio Geológico Colombiano (SGC), in 1991. |
May 2012 seismicity and ash emissions. Compared with previous activity (see table 13 in BGVN 37:04), seismicity at Galeras increased in May in terms of energy released as well as the number of events and tremor duration (table 12). During 9-10 May, a swarm of 49 volcano-tectonic (VT) earthquakes was detected.
Table 12. Seismicity at Galeras during May 2012-March 2013. Earthquake counts for four types of events: volcano-tectonic (VT), long-period (LP), tremor (TRE), and hybrid (HYB); events labeled "Unclassified" were described by SGC as earthquakes that did not correspond to the current categories. Tornillos did not occur during this reporting period. Courtesy of SGC.
| Month | VT | LP | TRE | HYB | Tremor Duration (min) | Range ML (VT) | Depths (km) | Hypocenters Located | Unclassified |
| May 2012 | 29 | 67 | 347 | 5 | 1944 | -0.2-2 | 0-14.5 | 95 | 2343 |
| Jun 2012 | 21 | 285 | 353 | 3 | 1746 | -0.2-1.8 | 1.4-13 | 70 | 1621 |
| Jul 2012 | 17 | 276 | 233 | 1 | 986 | 0-2.5 | 0-15 | 43 | 1808 |
| Aug 2012 | 8 | 163 | 181 | 2 | 525 | -0.4-2.5 | 0.1-18 | 36 | 1413 |
| Sep 2012 | 10 | 225 | 188 | 8 | 575 | -0.1-2.2 | 1.8-10.8 | 30 | 1574 |
| Oct 2012 | 17 | 149 | 310 | 6 | 1113 | -0.2-2.3 | 0.2-13.7 | 58 | 2323 |
| Nov 2012 | 6 | 64 | 246 | 9 | 931 | -0.5-1.6 | 0-13.2 | 33 | 2335 |
| Dec 2012 | 22 | 54 | 202 | 3 | 2828 | -0.2-1.7 | 0.2-16 | 48 | 1771 |
| Jan 2013 | 18 | 101 | 292 | 12 | 4223 | -0.5-1.7 | 0-16 | 53 | 1827 |
| Feb 2013 | 13 | 91 | 282 | 4 | 6131 | -0.1-1.5 | 0.8-15 | 35 | 1775 |
| Mar 2013 | 16 | 84 | 231 | 15 | 705 | -0.1-3.1 | 0-11 | 44 | 2300 |
Figure 123 plots 95 VT and hybrid earthquakes and reveals two primary clusters of epicenters, close to the crater and a deeper one ~14 km SW of the active cone. The most distant earthquakes were dispersed in the region and had depths between 4-14.5 km (measured relative to the summit).
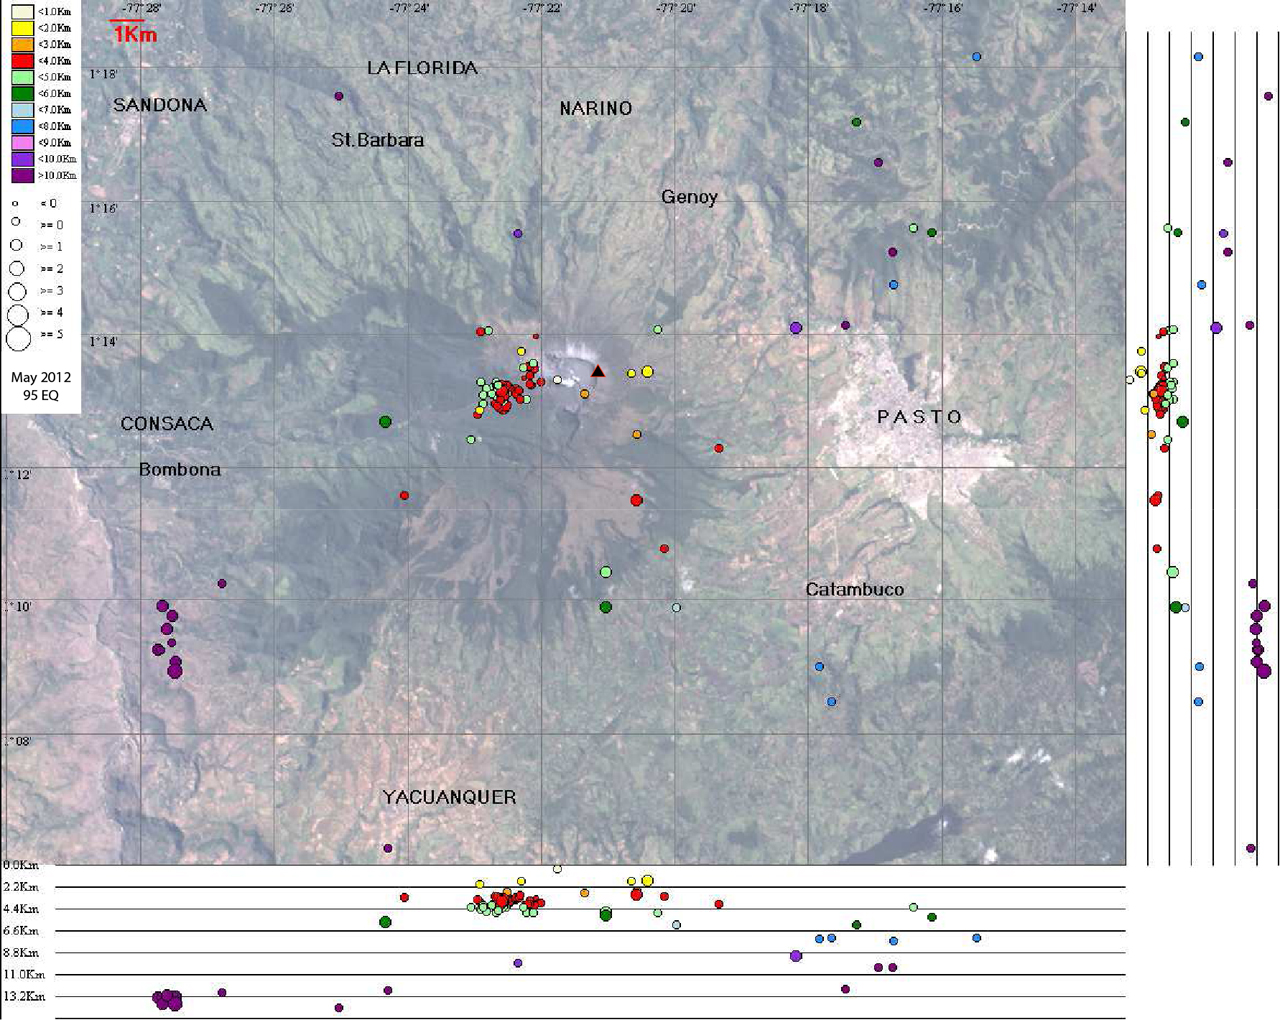 |
Figure 123. Map and cross sections plotting 95 epicenters and hypocenters of volcano-tectonic and hybrid earthquakes that occurred during 1-31 May 2012 at Galeras (scale bar, upper left). In the N-S section (right) and the E-W section (bottom), each line represents 1.2 km of depth with respect to the summit (elevation, ~4,200 m). Magnitudes of seismic events are indicated by circle size. Colors indicate depths, which ranged from |
On 13 May 2012, SGC noted a change in volcanic activity when tremor occurred associated with gas and ash emissions. Ash rose in small pulses and was deposited at high elevations on the edifice and toward the NW in prevailing winds. During clear conditions on 17 May, an ash plume was observed rising from the crater to ~200 m above the summit.
Clouds obscured visibility on 28 May, but on other days during 22-29 May SGC observers saw ash plumes rising 800 m above the crater. According to the Cruz Roja Departamento Nariño, ashfall was reported in Santa Bárbara (~8 km NNW) during the week of 22 May.
June-July 2012 seismicity and plume activity. Elevated seismicity continued through June, primarily comprised of tremor and long-period (LP) events. In July, seismicity decreased (both in the number of events, table 12, and the energy released) although a swarm of LP events occurred on 15 July.
Gas emissions were frequently observed during the first week of June in images captured by the network of video cameras. Ash emissions rose from the central crater on 2 June, and on 5 June plumes rose 1 km and drifted W. The Washington Volcanic Ash Advisory Center (VAAC) released advisories during 5-6 June, but no volcanic ash or hotspots were detected by satellite instruments.
During 5, 6, and 12-19 June, cameras recorded gas-and-ash emissions; an ash plume rose 1.4 and 2.4 km above the crater on 14 and 17 June, respectively. Ashfall was reported in the towns of Sandoná, Samaniego, Mapachico (this location does not appear on all maps, see figure 116 in BGVN 37:04), and Genoy. During 19-22 and 24 June cameras recorded gas-and-ash emissions that drifted NW.
The SGC noted gas-and-ash emissions via the network of video cameras during 4-5 July. On 18 July, ashfall was also reported to the N in the Quebrada Maragato area (figure 122).
August-September 2012 seismicity and plume activity.Seismicity continued to decrease in August. In September, there were two seismic swarms but the seismic energy released for the month had decreased compared with August. The swarms (on 25 and 28 September) were shallow VT events, M
Ash plumes were frequently observed in August and SGC correlated many episodes of tremor with pulses of ash (figure 124). On 3 August a steam plume rose 1.1 km above the crater. On 4 August ash emissions were observed in the morning, and at 1519 a seven-minute-long episode of tremor was accompanied by a gas-and-ash plume that rose 1.4 km above the crater and drifted N. Ashfall was reported in Genoy. During 7-9 and 11 August gas-and-ash plumes rose 0.9-1.3 km above the crater and drifted W and S. White plumes were observed during 16 (and ash that day) and 18-21 August. Cameras around the volcano recorded emissions during 21-26 August; the emissions contained ash on 26 August.
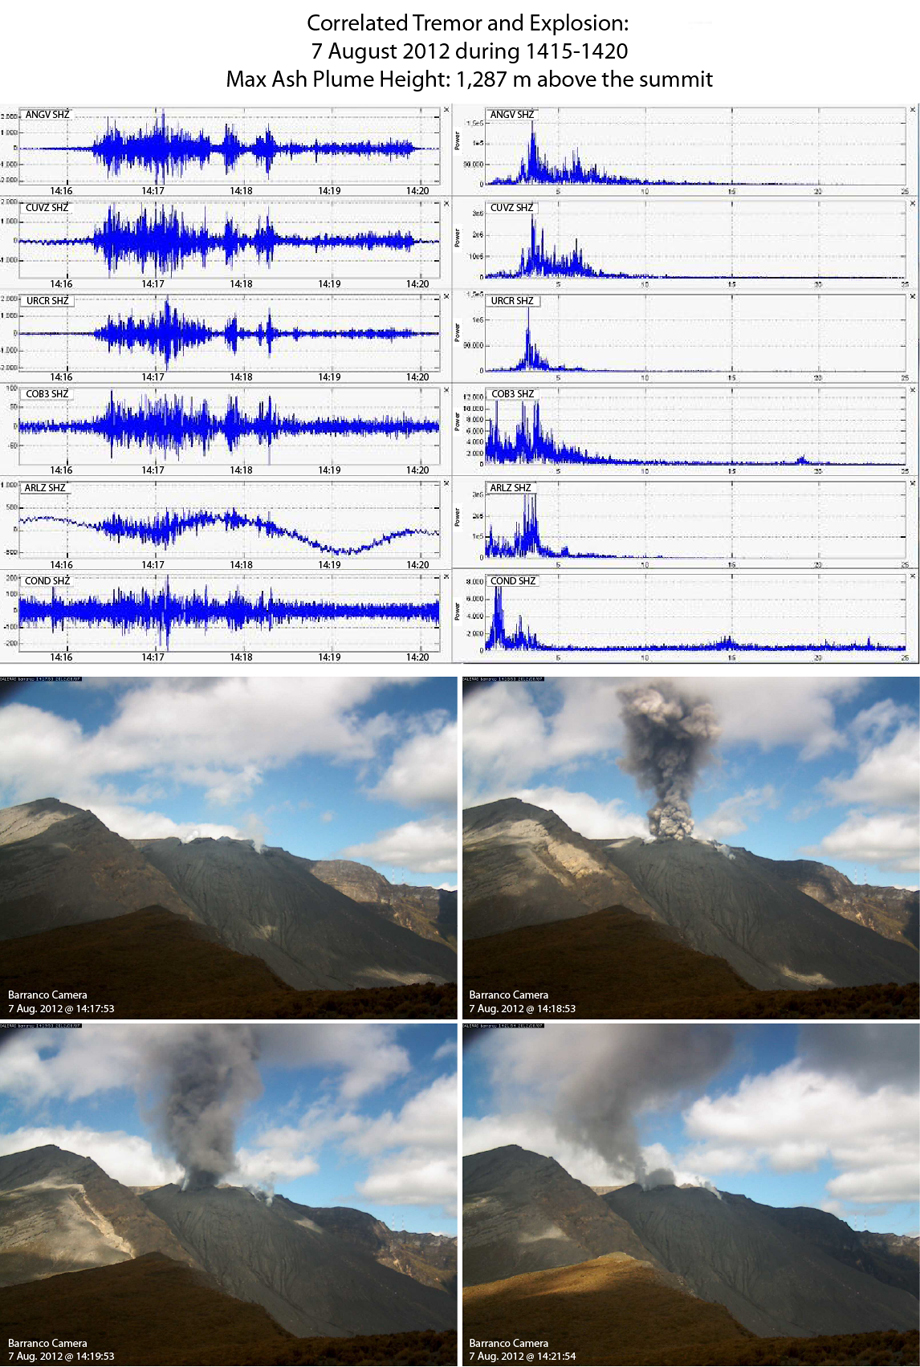 |
Figure 124. The SGC correlated tremor from Galeras with an explosion of ash on 7 August 2012. (Top) Tremor signals were detected between 1415 and 1420 at six stations (Anganoy, Cufiño, Urcunina, Cobanegra-3, Arlés, and Cóndor). (Bottom) The video camera located at Barranco station captured an impulsive ash plume emitted between 1417 and 1421 that day; see locations in figure 116 in BGVN 37:04. The look direction is SE. Courtesy of SGC. |
SGC reported that, during 18-22 and 24-25 September, cameras around Galeras recorded emissions that were mostly water vapor. On 18 and 24 September the emissions contained some ash. Plumes rose to 2 km above the summit and ashfall primarily affected the summit region. A seismic swarm occurred on 28 September.
October-November 2012 seismicity and plume activity. SGC reported that seismicity increased in October and gas-and-ash emissions (up to 1.8 km above the summit) were visible during clear viewing conditions throughout the month. The duration of tremor had doubled compared to the two previous months (table 11).
Episodes of tremor associated with gas-and-ash emissions were frequently detected in October. In particular, on 19 October tremor and a significant ash plume occurred (figure 125); ash covered the NE sector of the edifice where observatory staff conducted fieldwork.
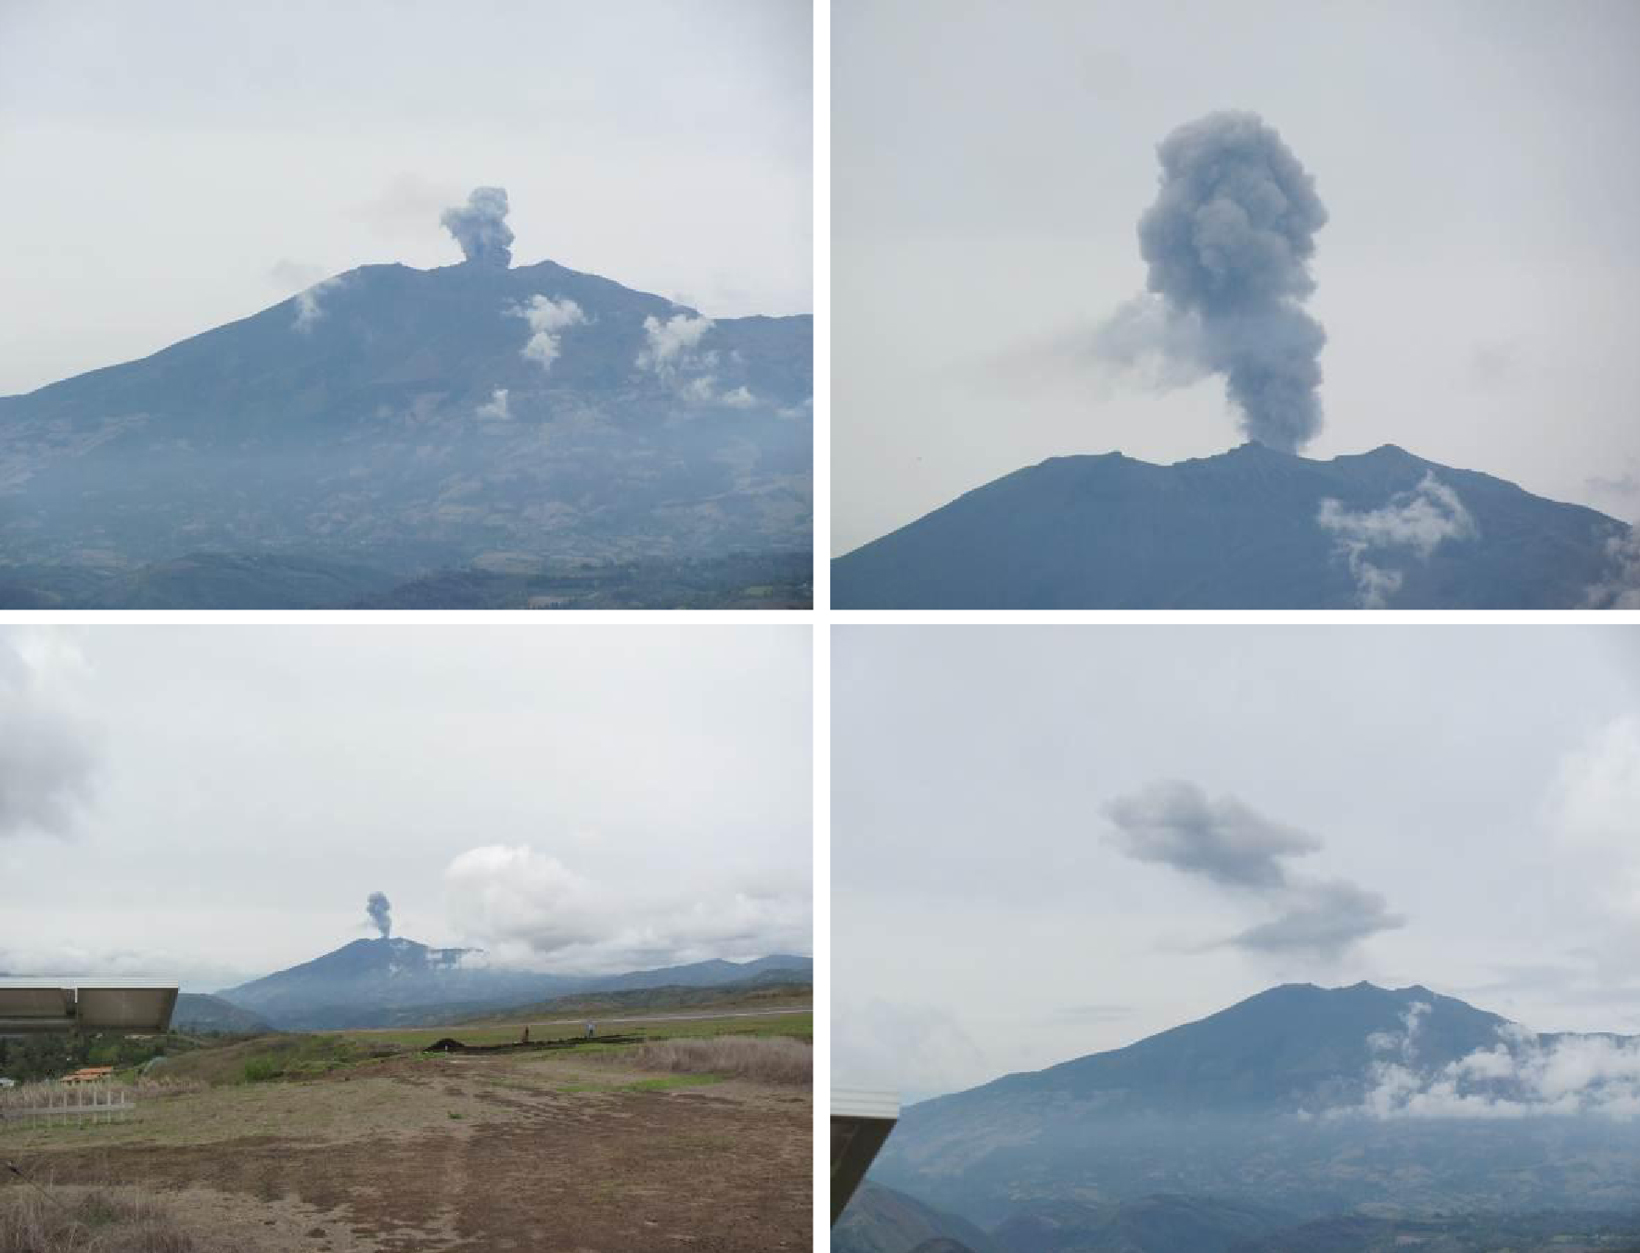 |
Figure 125. Images of Galeras captured from a camera located at the Antonio Nariño airport (~20 km NE of the summit) on 19 October 2012 beginning at 1036. These images show an ash plume rising from the summit and quickly dissipating. Tremor was concurrently detected by the local network. Courtesy of SGC. |
In October, epicenters of VT and HYB earthquakes were widely distributed throughout the area, up to 15 km from the edifice. Low energy and very shallow seismic swarms were detected on 25 and 26 October; there were 130 events in total. In November, seismic energy decreased but seismic swarms were detected during 8, 13-15, 19, and 28 November. These events were low-energy VT earthquakes (M less than 0.9), very shallow, and clustered beneath the central crater. Gas-and-ash emissions were recorded by the network of video cameras during 1, 7, 14, 22-23, and 29-30 November. Plumes rose to less than 1 km above the summit and ash was deposited at the highest elevations, primarily within the N and W sectors.
December 2012-March 2013 seismicity and plume activity. Tremor duration per month increased significantly during December 2012-February 2013 (2,828 to 6,131 minutes) (table 12). Seismic swarms frequently occurred in the months of December (more than 100 earthquakes), January, and March.
Six gas-and-ash emissions were observed between 17-29 December with plume heights less than 1.3 km. Ashfall occurred on the N and W sectors of the edifice.
In January 2013, nine gas-and-ash plumes were detected with the video monitoring system. Those plumes rose less than 1 km above the summit and deposited ash at the highest elevations within the N and W sectors of the edifice. On 22 January, Civil Defense reported ashfall in the area of Sandoná; the timing of that ashfall event suggested a correlation with an episode of tremor detected at 1309.
Gas-and-ash plumes occurred throughout February 2013. During more than 10 of these events, plumes rose to less than 1.5 km above the summit. A significant ash event occurred on the morning of 24 February; Civil Defense reported ashfall in the region of San Isidro (~14 km NW, figure 122).
The SGC reported gas-and-ash plumes throughout March; on five separate days (6, 7, 11, 22 and 25), the tallest plumes reached 1 km above the summit.
An M 3.1 earthquake was felt by residents on 14 March 2013 with a maximum intensity of II on the Modified Mercalli scale. The hypocenter was 5.6 km WNW from the crater at a depth of 7.78 km. Shaking was felt in the towns of Sandoná, Florida, and Consacá (figure 122).
SO2 flux during February 2012-March 2013. The SGC monitored sulfur dioxide gas emissions with a MobileDOAS and three ScanDOAS instruments. The MobileDOAS was acquired through the Network for Observation of Volcanic and Atmospheric Change (NOVAC), an international effort developed by the European Union to monitor SO2 emissions. SGC conducted 2-5 traverses each month with this instrument primarily along roads that circumnavigate the volcano.
The three ScanDOAS installations were telemetered systems located within 12 km WNW of the edifice (figure 116 in BGVN 37:04). These instruments each took measurements on a near-daily basis allowing for regular coverage when all three stations were operating.
The SGC monthly Technical Bulletins reduced these four sources of gas data in units of tons per day (figure 126) after incorporating wind speed and direction based on a local anemometer located at the Cráter station ~1 km E of the summit.
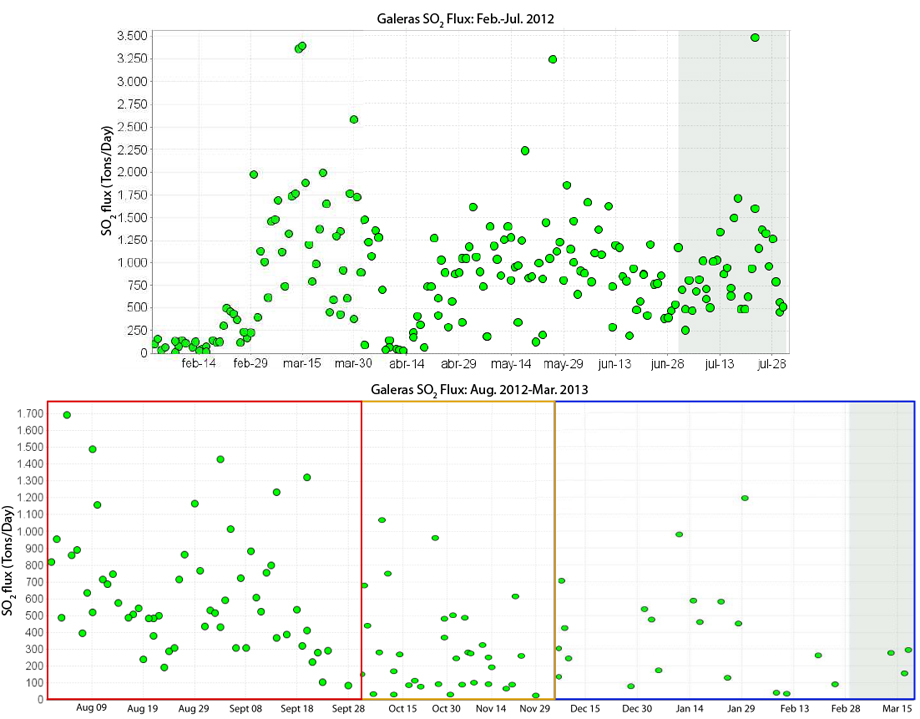 |
Figure 126. Galeras SO2 flux measured during February 2012-March 2013 from four instruments (three ScanDOAS and one MobileDOAS). For the time interval August 2012-March 2013, three plots were merged (boundaries are marked in red, orange, blue); the vertical scale is consistent for all three time intervals but the horizontal scale has been skewed. On both plots, the gray regions signify the reporting period in which the plots appeared in SGC Technical Bulletins. Courtesy of SGC. |
Very high SO2 was detected in March, May, and July of 2012 (up to 3,467 tons per day); relatively high levels were detected during August-October. The SGC established the following criteria for describing SO2 flux at Galeras: Low (under 500 t/d); Moderate (500-1,000 t/d); High (1,000-3,000 t/d); Very High (over 3,000 t/d). In these terms, SO2 detected during November 2012-March 2013 stood at moderate to low levels. The highest values during that time period were recorded in mid to late January (up to 1,194 t/d).
People noticed strong sulfur odors on 18 July; 1 and 6 August; 12 and 19 October; 30 November; 5 December; 25 and 28 February; and 1, 5, and 11 March. Reports were primarily from SGC staff working near the crater, but on 12 October, the staff at Galeras National Park Wildlife Sanctuary noted sulfur odors on the E side of the volcano. On 19 October the odor was present in the towns of Consacá (~13 km W) and Sandoná (~15 km NW).
May 2012-March 2013 deformation monitoring. In May, deformation recorded by most of the tilt stations was dominated by inflation in the W sector of the volcano; a zone that coincided with a cluster of earthquake epicenters during 9-10 May. Inflation continued to register in that region through March 2013. The four permanent GPS stations (Cráter, Cóndor, Barranco, and Mapachico) were operating during this time period (figure 116, BGVN 37:04). Unfortunately, the Mapachico site was vandalized on 27 August 2012 and thereafter its signal was lost.
On 31 October 2012, a new GPS station was brought online, San Cayetano, located ~4 km E (figure 127). The testing period for the new instrument continued through November. SGC did not highlight any deformation trends during December 2012-March 2013.
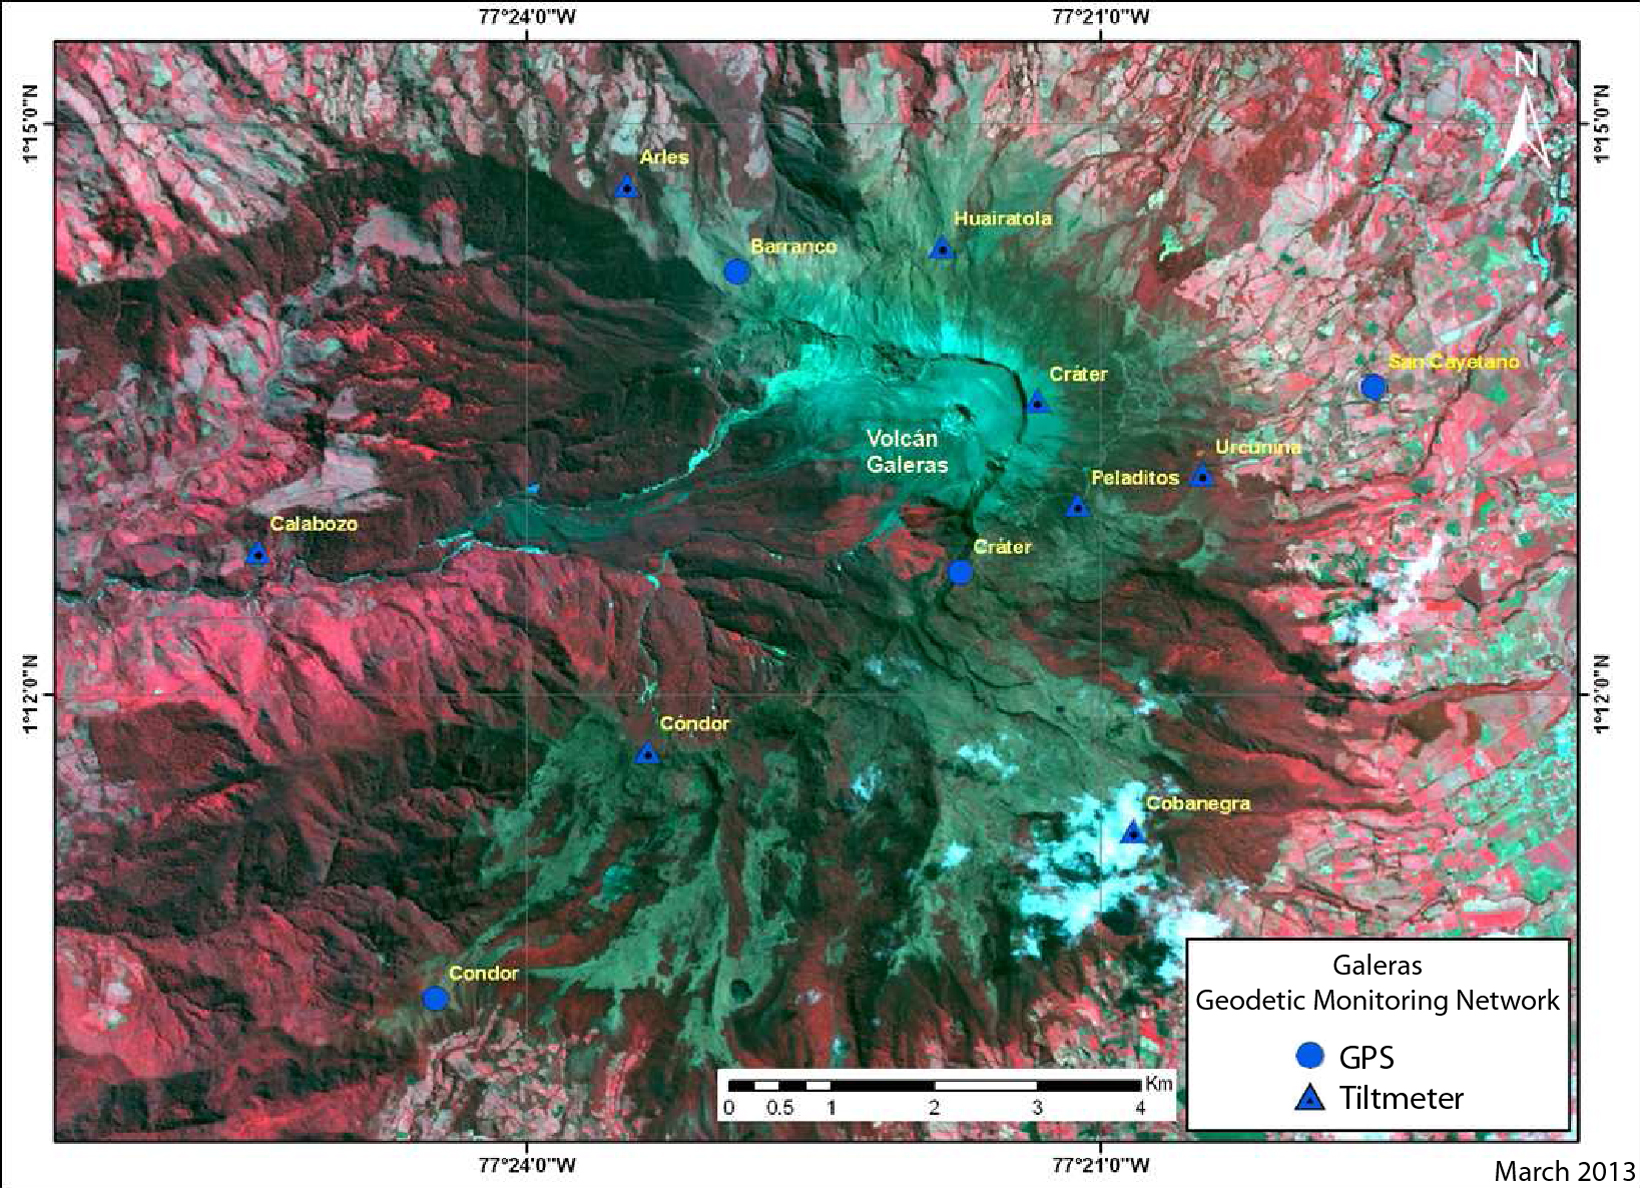 |
Figure 127. Map of the Galeras geodetic monitoring network from the March 2013 online Technical Bulletin. GPS and tiltmeter station locations are marked with symbols including the newest station, San Cayetano (within 4 km E of the active cone). Courtesy of SGC. |
Information Contacts: Servicio Geológico Colombiano (SGC), Observatorio Vulcanológico y Sismológico de Pasto, Pasto, Colombia (URL: http://www.SGC.gov.co/Pasto.aspx); Washington Volcanic Ash Advisory Center (VAAC), Satellite Analysis Branch (SAB), NOAA/NESDIS E/SP23, NOAA Science Center Room 401, 5200 Auth Rd, Camp Springs, MD 20746, USA (URL: http://www.ospo.noaa.gov/Products/atmosphere/vaac/).
Continued ash emissions and seismicity during April-December 2013
Ash plumes and elevated seismicity continued to occur at Galeras during April-December 2013 (figures 128 and 129). Monitoring efforts based in Pasto, Colombia, were led by the Servicio Geológico Colombiano (SGC). SGC maintained Alert Level III (Yellow; "changes in the behavior of volcanic activity") during this reporting period.
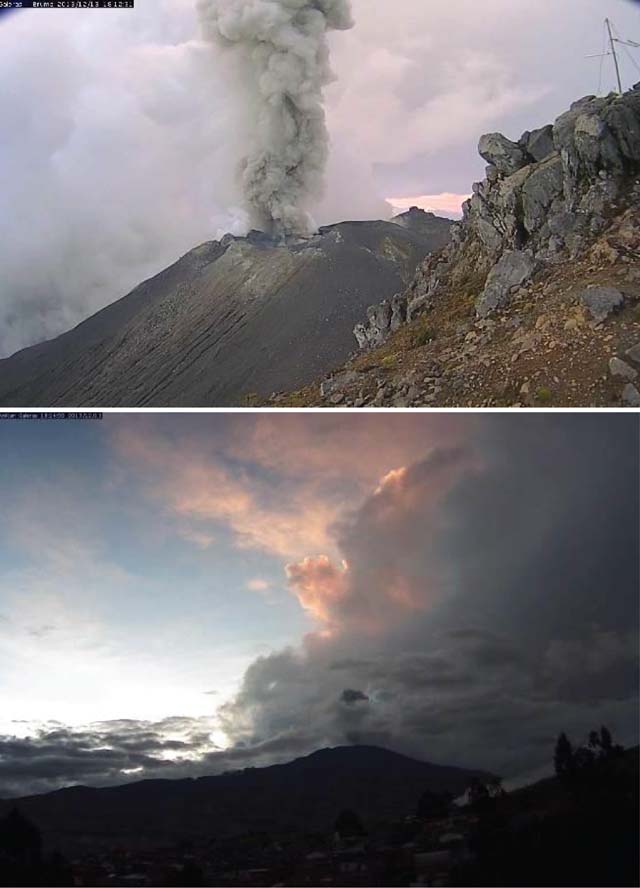 |
Figure 128. Two webcameras simultaneously captured an ash plume rising from Galeras on 13 December 2013. The top photo was acquired by the Bruma webcam, located on the SW rim of the crater; the bottom photo was taken from the observatory located in Pasto (~10 km E of the summit). Courtesy of SGC. |
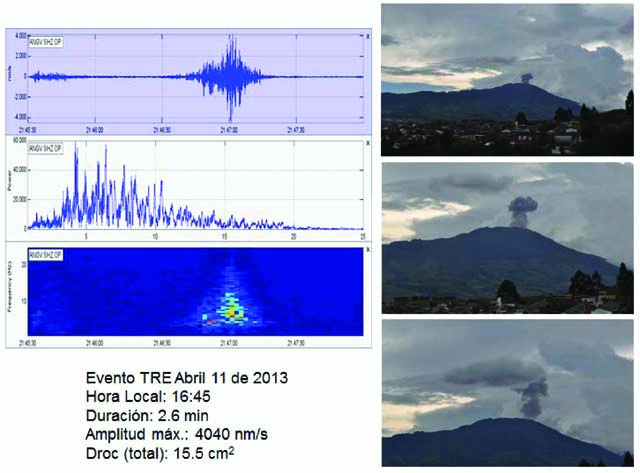 |
Figure 129. SGC correlated tremor from Galeras with an explosion of ash on 11 April 2013. (Left) A tremor signal was detected at 1645 with a duration of 2.6 minutes. (Right) The video camera located at the observatory in Pasto captured an impulsive ash plume. Each image has an increased optical zoom focused on the summit; the look direction is approximately W. Courtesy of SGC. |
SGC maintained a wide monitoring network for Galeras that included geophysical, geochemical, meteorological, and optical instrumentation. Seismic monitoring consisted of broadband, short-period, and acoustic instruments with 12-15 instruments total operating during April-December 2013. Additional geophysical instruments included electronic tiltmeters, telemetered GPS stations, electromagnetic stations, and a network of geophones for flood detection and early warning. Gas monitoring efforts included telemetered ScanDOAS stations and also stations dedicated to diffuse radon emissions. Other permanent stations around the volcanic edifice included anemometers and webcameras. Monthly technical reports frequently highlighted geochemical analysis of local hotsprings. In this report, we highlight seismicity, gas monitoring, and ash plumes that have been correlated with earthquakes, particularly tremor.
Seismicity. During this reporting period, seismicity from Galeras was typically dominated by tremor (table 13). Tremor events became less numerous toward the end of the year, although total duration remained high (an average of 6 hours per month). Seismic swarms were only detected on four different days in April, May, and October 2013 (table 14). A swarm that started on 22 May at 1916 consisted of 129 long-period (LP) earthquakes, and was followed by 11 minutes of tremor. SGC noted that ash emissions were likely associated with the activity. Two acoustic signals were also detected that day, at 2239 and 2315.
Table 13. Seismicity at Galeras during April-December 2013. Earthquake counts are for four types of events: volcano-tectonic (VT), long-period (LP), tremor (TRE) expressed both in terms of # of events and duration, and hybrid (HYB); events labeled "Unclassified" were described by SGC as earthquakes that did not correspond to the current categories. Tornillos did not occur during this reporting period. Courtesy of SGC.
| Month | VT | LP | TRE | HYB | Total Duration of Tremor | Range ML (VT) | Depths (km) | Hypocenters Located | Unclassified |
| Apr 2013 | 12 | 116 | 234 | 13 | 14 hours | -0.2-2.7 | 5-14 | 42 | 2016 |
| May 2013 | 19 | 60 | 111 | 16 | 8 hours | less than 2.6 | 1-15 | 56 | 1804 |
| Jun 2013 | 17 | 45 | 55 | 2 | 4 hours | -0.1-2.2 | 2-12 | 47 | 907 |
| Jul 2013 | 33 | 38 | 41 | 6 | 2 hours | less than 3.2 | 1-21 | 59 | 745 |
| Aug 2013 | 21 | 30 | 76 | 3 | 5 hours | 0.2-1.3 | 1.5-7.5 | 22 | 1082 |
| Sep 2013 | 6 | 13 | 72 | 0 | 4.5 hours | less than 1.3 | 1.5-7.5 | 20 | 748 |
| Oct 2013 | 56 | 21 | 103 | 4 | 8 hours | -0.4-3.8 | 0-13 | 109 | 1383 |
| Nov 2013 | 35 | 10 | 146 | 8 | 6 hours | less than 3.9 | 1-12 | 66 | 1286 |
| Dec 2013 | 18 | 12 | 86 | 9 | 5.5 hours | 0-1.7 | 1-11 | 36 | 962 |
Table 14. Seismic swarms from Galeras were rare events, occurring on four different days during this reporting period of April-December 2013. Courtesy of the SGC.
| Date | Time | Earthquakes |
| 25 Apr 2013 | 0943, 1120 | 101 |
| 22 May 2013 | 1916 | 129 |
| 4-5 Oct 2013 | -- | -- |
In April 2013, one earthquake was felt in the town of Pasto. At 0532 on 2 April, an M 2.7 VT earthquake was recorded, located 12.8 km NE of the crater. An M 2.2 earthquake that occurred at 1158 on 7 June was reported by local populations in Pasto. This earthquake was located 9 km NE of the crater at a depth of 10 km with respect to the summit. Three earthquakes were detected in July and felt by residents of Pasto; they occurred on 24 (M 3.2 and 2.5) and 29 (M 2.9) July with depths of 5 and 11 km. The earthquakes on 24 July were located ~5.5 km SE of the crater; the event on 29 July was located 21 km NE of Galeras. An M 3.8 earthquake occurred at 1713 on 15 October; this earthquake was felt by residents within different sectors of Pasto as well as the municipalities of Nariño and La Florida. The earthquake was located 7 km NE of Galeras with a depth of 5.5 km. In November, one earthquake was felt by local populations in the San Ignacio sector of Pasto as well as other sectors of Nariño. This M 3.9 earthquake occurred at 1236 on 10 November with a depth of 9 km and was located 4.5 km NE of Galeras.
Gas monitoring. During this reporting period, minor amounts of ash occasionally accompanied gas emissions typically rising from the N and W sectors of the volcano, and dispersed. As a part of an ongoing international monitoring project, the Network for Observation of Volcanic and Atmospheric Change (NOVAC), SGC maintained ScanDOAS instruments at three different locations NW of the edifice (see the instrumentation map in Bulletin 37:04, figure 116). During April-December SO2 flux rarely exceeded 1,000 tons/day. The maximum value, considered relatively high for Galeras, was 1,475 tons/day and recorded on 29 September 2013.
Information Contacts: Servicio Geológico Colombiano (SGC), Observatorio Vulcanológico y Sismológico de Pasto, Pasto, Colombia (URL: https://www2.sgc.gov.co/volcanes/index.html).
Eruption with ash plumes May 2012-January 2014; steam emissions through 2017
A central cone slightly lower than the summit caldera rim has been the site of numerous small-to-moderate historical eruptions recorded since the time of the Spanish conquistadors at Colombia's Galeras volcano. Persistent steam and gas, and occasional ash emissions from multiple vents around the summit have characterized activity for many years. Steam plumes are generally visible from two sites at the summit of the pyroclastic cone. Two small craters, known as Chavas and El Paisita, are located on the N and W rim of the larger central summit crater. Information for this report was gathered primarily from monthly technical reports provided by the Observatorio Vulcanológico y Sismológico de Pasto (OVSP) of the Sevicio Geologico Colombiano (SGC). Four webcams document the activity from the Observatorio Vulcanológico y Sismológico de Pasto (OVSP) located in Pasto (8 km ESE), from Consacá (11 km W), from the top of Galeras in the area called Barranco Alto (2.6 km NW), and from the SW flank at an area called Bruma.
The last time an Alert Level 1 (Red: imminent eruption or in progress) was issued was on 25 August 2010 when a plume of gas and ash rose 300 m above the summit and dispersed ash over numerous communities up to 30 km away. Seismicity decreased the following day, and steam and gas-only emissions returned. Fumarolic activity persisted throughout 2011, with only a single mention of possible low ash content in the plumes observed on 31 March and 1 April. Steam plumes rose a few hundred meters from the summit crater during January-May 2012. Seismic swarms were recorded in April and May.
An eruption with ash emissions began on 13 May 2012 and persisted until 30 January 2014 (BGVN 37:04, 38:03, 39:01). A summary of activity during that eruptive episode is provided below, along with additional information not previously reported. Activity after the end of that eruption, from February 2014 through December 2017, included only steam and gas emissions from the summit crater, and low levels of seismicity.
Activity during 2012. During January and February 2012, steam plumes rose 900-1,000 m above the summit, emerging from the El Paisita and Chavas vents at the N and W rims of the summit crater (figure 130). Plumes rose higher during March, reaching 1,900 m. VT seismic swarms were reported between 11 and 16 April 2012, and deformation sensors recorded inflation towards the W flank beginning in April. Most of the seismicity was located within the vicinity of the summit crater at depths less than 5 km. Steam plumes rose to 2,300 m above summit in April (figure 131).
|
Figure 130. Volcán Galeras, viewed at 1828 local time from Barranco Alto (2.6 km NW) on 16 February 2012, showed typical low-level steam plumes rising from vents on the N and W rims of the summit crater. Courtesy of SGC (Informe mensual de actividad de Los Volcanes Galeras, Cumbal, Doña Juana, Azufral, Las Ánimas, Chiles Y Cerro Negro, febrero de 2012). |
|
Figure 131. A substantial steam plume rose from Galeras in this image taken from OVSP (Observatorio Vulcanológico y Sismológico de Pasto) headquarters (8 km SE) on 20 April 2012 at 0738 local. Courtesy of SGC (Informe mensual de actividad de Los Volcanes Galeras, Cumbal, Doña Juana, Azufral, Las Ánimas, Chiles Y Cerro Negro, abril de 2012). |
Steam plumes rose less than 200 m above the summit at the beginning of May; a second swarm of VT seismic events on 9 and 10 May 2012 preceded a new sequence of ash emissions that began on 13 May. Pulsating plumes of ash rose less than 800 m and deposited material primarily on the upper NW flank. Inflation continued to be measured in the inclinometers on the W flank, coinciding with the area of the epicenters of the 9-10 May seismic swarm. Ash-bearing emissions were reported on 13, 14, 17, 26 (figure 132), 27, and 30 May.
|
Figure 132. An ash emission rose from Galeras at 0802 local time on 26 May 2012 and was recorded by the Barranco Alta webcam on the NW flank. Courtesy of SGC (Informe mensual de actividad de Los Volcanes Galeras, Cumbal, Doña Juana, Azufral, Las Ánimas, Chiles Y Cerro Negro, mayo de 2012). |
Ash emissions continued during June-August 2012. Plume heights during the period ranged from 1,300-2,500 m above the summit. Plumes recorded on 12 and 17 June (figure 133) resulted in ashfall in Sandoná (14 km NW) and Samaniego (32 km NW), Mapachico (9 km NE), and Genoy (7 km NNE). Additional days with reports of ash emissions included 5, 6, 8, 19, 22, 27 and 29 June. Ash-bearing emissions were reported on at least 16 days during July with reports of ashfall in Maragato, Chorillo (18 km W) and Genoy. Ash plumes rose to 2,500 m above the summit during at least nine different days of August, and ashfall was reported again in the Genoy area.
|
Figure 133. Seismogram and spectrogram of a tremor (TRE) event recorded at 1605 local time on 17 June 2012 that was associated with an ash emission from Galeras as viewed from the Barranca (upper left), OVSP (upper and lower right), and Consacá (lower left) webcams (11 km W). Courtesy of SGC (Informe mensual de actividad de Los Volcanes Galeras, Cumbal, Doña Juana, Azufral, Las Ánimas, Chiles Y Cerro Negro, junio de 2012). |
Tremor associated with gas and ash emissions persisted throughout September 2012; another VT seismic swarm was reported on 28 September. Ash-bearing emissions were reported during at least seven days of the month, and reached 2,000 m above the crater (figure 134). During at least 16 days of October, tremors were associated with ash emissions that rose as high as 1,800 m. On 19 October, fine-grained ashfall was reported by personnel of the Observatory who were working on the upper NE flank.
|
Figure 134. Gas and ash emissions at Galeras on 12 September 2012 were recorded photographically from the El Vergel Shelter in Pasto around 1805 local time, at most of the digital seismograph stations around the volcano, and also at the analog recorder at the Anganoy station (upper right) in Pasto (Provided by Architect Darío Gómez of the Municipal Council for Risk and Disaster Management (DMGRD) of the municipality of Pasto). Courtesy of SGC (Informe mensual de actividad de Los Volcanes Galeras, Cumbal, Doña Juana, Azufral, Las Ánimas, Chiles Y Cerro Negro, septiembre de 2012). |
Gas and ash plumes rose 1,000-1,300 m during November and December 2012 and were also associated with tremor signals. The most significant emissions were observed on 1, 7, 14, 22, 23, 29 and 30 November, and 17 (figure 135), 19, 21, 26, 27 and 29 December.
|
Figure 135. Ash emissions rose from Galeras on the morning of 17 December 2012 as seen in this series of images from the OVSP webcam while seismographs recorded tremor-type events. Courtesy of SGC (Informe mensual de actividad de Los Volcanes Galeras, Cumbal, Doña Juana, Azufral, Las Ánimas, Chiles Y Cerro Negro, diciembre de 2012). |
Activity during 2013. Continuous inflation towards the western flank was measured beginning in April 2012. Similar deformation processes continued at Galeras during much of 2013. The 'Crater' inclinometer located about 0.8 km E of the summit crater showed the most significant amount of westward inflation (figure 136).
|
Figure 136. Resultant vectors for the electronic inclinometers at Galeras for the period between 25 October 2012 and 31 January 2013 show 2,962.1 microradians (µrad) of movement to the W at the 'Crater' inclinometer as well as movement to the N and SW at several other instruments. Courtesy of SGC (Informe mensual de actividad de Los Volcanes Galeras, Cumbal, Doña Juana, Azufral, Las Ánimas, Chiles Y Cerro Negro, enero de 2013). |
Eruptive activity continued in a similar manner to 2012 throughout 2013. During January, ash-bearing emissions rose up to 1,000 m at least nine times and drifted in various directions. The emission event of 22 January caused ashfall in Sandoná (13 km NW). During February, the most notable seismic activity was several tremor events associated with ash emissions. Plume heights remained below 1,500 m and were observed on at least 11 days of the month. There were reports of ashfall in San Isidro, the upper part of the municipality of Sandoná, NW of the volcano, during the morning of 24 February. Most of the ash emissions during March 2013 were deposited on the upper NW flank. The Crater, Cobanegra, and Calabozo inclinometers continued to show movement associated with inflation towards the W flank during March and April. Gas and ash plumes reached 1,000 m above the summit on 6, 7, 11, 22 and 25 March. Activity was similar during April, with plumes rising to 1,200 m and seismic tremors associated with ash and gas emissions reported on at least 13 days (figures 137 and 138).
|
Figure 137. Seismograms registered a tremor-type event (TRE) on 5 April 2013 at Galeras that was associated with ash emissions captured in the Barranca webcam. Courtesy of SGC (Informe mensual de actividad de Los Volcanes Galeras, Cumbal, Doña Juana, Azufral, Las Ánimas, Chiles Y Cerro Negro, abril de 2013). |
|
Figure 138. Gas and steam emissions rose from the crater at the summit of the pyroclastic cone at Galeras on 24 April 2013. Image taken from the caldera rim at the summit. Courtesy of SGC (Informe mensual de actividad de Los Volcanes Galeras, Cumbal, Doña Juana, Azufral, Las Ánimas, Chiles Y Cerro Negro, abril de 2013). |
Seismic activity decreased somewhat during May 2013, although tremor signals associated with ash and gas emissions were noted on at least eight occasions. The pulsating ash plumes were small, and deposited material mostly on the NW flank. The deformation network recorded stability at the Crater inclinometer for the first time in many months. SGC noted a seismic swarm during the evening of 22 May that included a tremor event that lasted for 11 minutes and possibly included ash emissions.
Emissions during June 2013 were mostly steam that rose to 1,300 m, but ash plumes were reported on seven days. The frequency of seismic activity remained steady during July, but the amount of energy released increased significantly. The Crater inclinometer showed deflation. Ash and gas plumes were noted on 6, 12, 13, 17 and 22 July rising as high as 1,500 m. Seismic frequency and energy both decreased during August and September 2013, and inclinometers showed little change in deformation. Plume heights, mostly gas and steam, remained below 500 m. Tremors associated with ash emissions were reported on five days of August and on 3, 11 and 14 September.
Seismicity increased in both amplitude and frequency during October and November 2013. The majority of the VT seismicity was located on the NE flank at 5-10 km depth. Steam plume heights remained below 600 m; emissions reported on 8 and 11 October included ash (figure 139). In addition to steam plumes observed throughout November, ash plumes were reported rising to 1,000 m on 17, 23, and 30 November. Seismicity decreased during December 2013 while deformation remained stable. Ash plumes were reported on 4, 13, 26, 27, and 31 December associated with tremor events (figure 140).
|
Figure 139. Ash emissions rose from the summit crater at Galeras on 11 October 2013. They were photographed by Mr. Mario Alberto Caicedo, Radio and TV Analyst, from the RTVC Galeras station, at the caldera rim near the summit. Courtesy of SGC (Informe mensual de actividad de Los Volcanes Galeras, Cumbal, Doña Juana, Azufral, Las Ánimas, Chiles Y Cerro Negro, octubre de 2013). |
|
Figure 140. Seismograms recorded frequencies associated with tremor (TRE) events on 4 December 2013 while the Barranca webcam recorded ash emissions. Courtesy of SGC (Informe mensual de actividad de Los Volcanes Galeras, Cumbal, Doña Juana, Azufral, Las Ánimas, Chiles Y Cerro Negro, diciembre de 2013). |
Activity during 2014. Tremor events during 11-14, 21, 23, and 27-30 January 2014 were associated with ash and gas emissions (figure 141) that reached 850 m above the summit. During the early hours of 11, 13, and 23 January, incandescence was observed at the crater. The last confirmed ash emission of the year occurred on 30 January 2014.
|
Figure 141. Emissions of steam and ash on 29 January 2014 were captured by the Bruma webcam (SW of the cone) while seismograms registered tremor events. Courtesy of SGC (Informe mensual de actividad de Los Volcanes Galeras, Cumbal, Doña Juana, Azufral, Las Ánimas, Chiles Y Cerro Negro, enero de 2014). |
A decrease in both frequency and energy levels of seismicity were reported during March 2014. SGC noted several tremor-type seismic events associated with gas emissions; steam plumes rose up to 1,000 m above the summit. Although they reference "gas and ash" emissions in a few photographs, only steam is visible in the photographs from March. Reports of activity by SGC for April and May 2014 refer to only steam plumes rising 1,000 m from the summit from the vents on the N and W sides of the crater rim. No further reports are available for Galeras for 2014.
Activity during 2015-2017. Throughout 2015, SGC reported only steam plumes rising from the two vents at the summit of the Galeras pyroclastic cone, known as the Chaldean fumarole fields (Las Chavas) on the W rim, and the El Paisita on the N rim (figure 142). Plume heights were as high as 700 m in January, but dropped below 200 m by May, where they remained for the rest of the year. Inflation to the W began again in September 2014 and continued through May 2015.
|
Figure 142. Steam plumes rose a few hundred meters above the summit of the pyroclastic cone at Galeras on 9 April 2015. This type of activity was typical for all of 2015. Photo from the Barranco webcam NW of the summit. Courtesy of SGC (Informe mensual de actividad de Los Volcanes Galeras, Cumbal, Doña Juana, Azufral, Las Ánimas, Chiles Y Cerro Negro, abril de 2015). |
Minor variations in seismic frequency and energy levels fluctuated throughout 2016 and 2017, but there were no reported particulate emissions. Steam emissions from the two primary vents at the summit crater (Las Chavas and El Paisita) rarely rose more than 200 m above the summit, often drifting NW.
An inspection of the summit crater by SGC on 25 August 2016 revealed a deep vent with several points of gas emissions (figure 143), including areas on the N wall (El Paisita) and the E wall (Las Alterada). The W wall (Las Chavas) had a cave-like entrance of 50 m diameter with fumarolic activity on the back wall and the ceiling that condensed into a sulfur-rich water on the floor of the opening. The El Pinta vent had no observed emissions. A rare 200-m-high steam plume rose from the crater in October 2016, but otherwise activity remained very low at Galeras throughout 2017 (figure 144).
|
Figure 143. An inspection of the summit crater at Galeras by SGC on 25 August 2016 revealed a deep vent with several points of gas emissions including areas on the N wall (El Paisita) and the E wall (Las Alterada). The W wall (Las Chavas) had a cave-like entrance of 50 m diameter with fumarolic activity on the back wall and the ceiling that condensed into a sulfur-rich fluid on the floor of the opening. The El Pinta vent had no emissions. Courtesy of SGC (Informe mensual de actividad de Los Volcanes Galeras, Cumbal, Doña Juana, Azufral, Las Ánimas, Chiles Y Cerro Negro, agosto de 2016). |
|
Figure 144. Low-level steam emissions seen from the Bruma webcam SW of the summit of Galeras on 3 August 2017 were typical activity for the entire year. Courtesy of SGC (Informe mensual de actividad de Los Volcanes Galeras, Cumbal, Doña Juana, Azufral, Las Ánimas, Chiles Y Cerro Negro, agosto de 2017). |
Information Contacts: Servicio Geologico Colombiano (SGC), Diagonal 53 No. 34-53 - Bogotá D.C., Colombia (URL: https://www2.sgc.gov.co/volcanes/index.html).
This compilation of synonyms and subsidiary features may not be comprehensive. Features are organized into four major categories: Cones, Craters, Domes, and Thermal Features. Synonyms of features appear indented below the primary name. In some cases additional feature type, elevation, or location details are provided.
Synonyms |
||||
| Galera, La | Pasto, Volcán de | ||||
Cones |
||||
| Feature Name | Feature Type | Elevation | Latitude | Longitude |
| Guaca, La | Cone | |||
Craters |
||||
| Feature Name | Feature Type | Elevation | Latitude | Longitude |
| Baston | Crater | |||
| Chavas | Crater | |||
| Coba Negra | Pleistocene caldera | |||
| Florencia | Crater | |||
| Jenoy | Pleistocene caldera | |||
| Joya, La | Crater | |||
| Marte | Crater | |||
| Novedad | Fissure vent | |||
| Paisita, El | Crater | |||
| Peladito, El | Crater | |||
| Pinta, El | Crater | |||
| Portrilla | Crater | |||
| Viejo, El | Crater | |||
Thermal |
||||
| Feature Name | Feature Type | Elevation | Latitude | Longitude |
| Deformes | Thermal | |||
|
|
||||||||||||||||||||||||||
There is data available for 36 confirmed Holocene eruptive periods.
2012 May 13 - 2014 Jan 30 ± 1 days Confirmed Eruption Max VEI: 2
| Episode 1 | Eruption Episode | Summit crater | |||||||||||||||||||||||||||||||||||||||||||||||||||||||||||||||||||||||||||||||||||||||||||||||||||||||||||||||||||||||||||||||||||||||||||||||||||||||||||||||||||||||||||||||||||||||||||||||||||||||||||||||||||||||||||||||||||||||||||||||||||||||||||||||||||||||||||||
|---|---|---|---|---|---|---|---|---|---|---|---|---|---|---|---|---|---|---|---|---|---|---|---|---|---|---|---|---|---|---|---|---|---|---|---|---|---|---|---|---|---|---|---|---|---|---|---|---|---|---|---|---|---|---|---|---|---|---|---|---|---|---|---|---|---|---|---|---|---|---|---|---|---|---|---|---|---|---|---|---|---|---|---|---|---|---|---|---|---|---|---|---|---|---|---|---|---|---|---|---|---|---|---|---|---|---|---|---|---|---|---|---|---|---|---|---|---|---|---|---|---|---|---|---|---|---|---|---|---|---|---|---|---|---|---|---|---|---|---|---|---|---|---|---|---|---|---|---|---|---|---|---|---|---|---|---|---|---|---|---|---|---|---|---|---|---|---|---|---|---|---|---|---|---|---|---|---|---|---|---|---|---|---|---|---|---|---|---|---|---|---|---|---|---|---|---|---|---|---|---|---|---|---|---|---|---|---|---|---|---|---|---|---|---|---|---|---|---|---|---|---|---|---|---|---|---|---|---|---|---|---|---|---|---|---|---|---|---|---|---|---|---|---|---|---|---|---|---|---|---|---|---|---|---|---|---|---|---|---|---|---|---|---|---|---|---|---|---|---|---|
| 2012 May 13 - 2014 Jan 30 ± 1 days | Evidence from Observations: Reported | |||||||||||||||||||||||||||||||||||||||||||||||||||||||||||||||||||||||||||||||||||||||||||||||||||||||||||||||||||||||||||||||||||||||||||||||||||||||||||||||||||||||||||||||||||||||||||||||||||||||||||||||||||||||||||||||||||||||||||||||||||||||||||||||||||||||||||||
|
List of 52 Events for Episode 1 at Summit crater
| ||||||||||||||||||||||||||||||||||||||||||||||||||||||||||||||||||||||||||||||||||||||||||||||||||||||||||||||||||||||||||||||||||||||||||||||||||||||||||||||||||||||||||||||||||||||||||||||||||||||||||||||||||||||||||||||||||||||||||||||||||||||||||||||||||||||||||||||
[ 2011 Mar 31 - 2011 Apr 1 ] Uncertain Eruption
| Episode 1 | Eruption Episode | Summit crater | ||||||||||||||
|---|---|---|---|---|---|---|---|---|---|---|---|---|---|---|---|
| 2011 Mar 31 - 2011 Apr 1 | Evidence from Observations: Reported | ||||||||||||||
|
List of 1 Events for Episode 1 at Summit crater
| |||||||||||||||
2010 Aug 25 - 2010 Aug 25 Confirmed Eruption Max VEI: 2
| Episode 1 | Precursory Episode | ||||||||||||||||||||
|---|---|---|---|---|---|---|---|---|---|---|---|---|---|---|---|---|---|---|---|---|
| 2010 Aug 20 - 2010 Aug 25 | Evidence from Observations: Seismicity | |||||||||||||||||||
|
List of 2 Events for Episode 1
| ||||||||||||||||||||
| Episode 2 | Eruption Episode | Central cone | ||||||||||||||||||||||||||||||||||||||||||||
|---|---|---|---|---|---|---|---|---|---|---|---|---|---|---|---|---|---|---|---|---|---|---|---|---|---|---|---|---|---|---|---|---|---|---|---|---|---|---|---|---|---|---|---|---|---|
| 2010 Aug 25 - 2010 Aug 25 | Evidence from Observations: Reported | ||||||||||||||||||||||||||||||||||||||||||||
|
List of 7 Events for Episode 2 at Central cone
| |||||||||||||||||||||||||||||||||||||||||||||
2008 Oct 21 (?) - 2010 Jan 2 (?) Confirmed Eruption Max VEI: 3
| Episode 1 | Eruption Episode | ||||||||||||||||||||||||||||||||||||||||||||||||||||||||||||
|---|---|---|---|---|---|---|---|---|---|---|---|---|---|---|---|---|---|---|---|---|---|---|---|---|---|---|---|---|---|---|---|---|---|---|---|---|---|---|---|---|---|---|---|---|---|---|---|---|---|---|---|---|---|---|---|---|---|---|---|---|
| 2008 Oct 21 (?) - 2010 Jan 2 (?) | Evidence from Observations: Reported | |||||||||||||||||||||||||||||||||||||||||||||||||||||||||||
|
List of 10 Events for Episode 1
| ||||||||||||||||||||||||||||||||||||||||||||||||||||||||||||
2007 Oct 4 - 2008 Jan 17 Confirmed Eruption Max VEI: 3 (?)
| Episode 1 | Eruption Episode | ||||||||||||||||||||||||||||||||||||||||
|---|---|---|---|---|---|---|---|---|---|---|---|---|---|---|---|---|---|---|---|---|---|---|---|---|---|---|---|---|---|---|---|---|---|---|---|---|---|---|---|---|
| 2007 Oct 4 - 2008 Jan 17 | Evidence from Observations: Reported | |||||||||||||||||||||||||||||||||||||||
|
List of 6 Events for Episode 1
| ||||||||||||||||||||||||||||||||||||||||
2005 Nov 24 - 2006 Jul 12 Confirmed Eruption Max VEI: 2
| Episode 1 | Eruption Episode | |||||||||||||||||||||||||||||||||||||||||||||||||||||||
|---|---|---|---|---|---|---|---|---|---|---|---|---|---|---|---|---|---|---|---|---|---|---|---|---|---|---|---|---|---|---|---|---|---|---|---|---|---|---|---|---|---|---|---|---|---|---|---|---|---|---|---|---|---|---|---|
| 2005 Nov 24 - 2006 Jul 12 | Evidence from Observations: Reported | ||||||||||||||||||||||||||||||||||||||||||||||||||||||
|
List of 9 Events for Episode 1
| |||||||||||||||||||||||||||||||||||||||||||||||||||||||
2004 Jul 16 - 2005 Feb 7 (?) Confirmed Eruption Max VEI: 3
| Episode 1 | Eruption Episode | El Pinta vent | ||||||||||||||||||||||||||||||||||||||||||||||||||||||||||||||||
|---|---|---|---|---|---|---|---|---|---|---|---|---|---|---|---|---|---|---|---|---|---|---|---|---|---|---|---|---|---|---|---|---|---|---|---|---|---|---|---|---|---|---|---|---|---|---|---|---|---|---|---|---|---|---|---|---|---|---|---|---|---|---|---|---|---|
| 2004 Jul 16 - 2005 Feb 7 (?) | Evidence from Observations: Reported | ||||||||||||||||||||||||||||||||||||||||||||||||||||||||||||||||
|
List of 11 Events for Episode 1 at El Pinta vent
| |||||||||||||||||||||||||||||||||||||||||||||||||||||||||||||||||
2002 Jun 7 - 2002 Jun 7 (?) Confirmed Eruption Max VEI: 1 (?)
| Episode 1 | Eruption Episode | El Pinta vent | ||||||||||||||||||||||||||||||||||
|---|---|---|---|---|---|---|---|---|---|---|---|---|---|---|---|---|---|---|---|---|---|---|---|---|---|---|---|---|---|---|---|---|---|---|---|
| 2002 Jun 7 - 2002 Jun 7 (?) | Evidence from Observations: Reported | ||||||||||||||||||||||||||||||||||
|
List of 5 Events for Episode 1 at El Pinta vent
| |||||||||||||||||||||||||||||||||||
2000 Mar 21 - 2000 May 18 Confirmed Eruption Max VEI: 1
| Episode 1 | Eruption Episode | |||||||||||||||||||||||||||||||||||
|---|---|---|---|---|---|---|---|---|---|---|---|---|---|---|---|---|---|---|---|---|---|---|---|---|---|---|---|---|---|---|---|---|---|---|---|
| 2000 Mar 21 - 2000 May 18 | Evidence from Observations: Reported | ||||||||||||||||||||||||||||||||||
|
List of 5 Events for Episode 1
| |||||||||||||||||||||||||||||||||||
1993 Jan 14 - 1993 Jun 7 Confirmed Eruption Max VEI: 2
| Episode 1 | Eruption Episode | Summit crater, west, SW, & south rims | ||||||||||||||||||||||||||||||||||||||||||||||||||||||||||||||||
|---|---|---|---|---|---|---|---|---|---|---|---|---|---|---|---|---|---|---|---|---|---|---|---|---|---|---|---|---|---|---|---|---|---|---|---|---|---|---|---|---|---|---|---|---|---|---|---|---|---|---|---|---|---|---|---|---|---|---|---|---|---|---|---|---|---|
| 1993 Jan 14 - 1993 Jun 7 | Evidence from Observations: Reported | ||||||||||||||||||||||||||||||||||||||||||||||||||||||||||||||||
|
List of 11 Events for Episode 1 at Summit crater, west, SW, & south rims
| |||||||||||||||||||||||||||||||||||||||||||||||||||||||||||||||||
1990 Jan 7 - 1992 Jul 16 Confirmed Eruption Max VEI: 2
| Episode 1 | Eruption Episode | |||||||||||||||||||||||||||||||||||||||||||||||||||||||||||||||||||||||||||
|---|---|---|---|---|---|---|---|---|---|---|---|---|---|---|---|---|---|---|---|---|---|---|---|---|---|---|---|---|---|---|---|---|---|---|---|---|---|---|---|---|---|---|---|---|---|---|---|---|---|---|---|---|---|---|---|---|---|---|---|---|---|---|---|---|---|---|---|---|---|---|---|---|---|---|---|
| 1990 Jan 7 - 1992 Jul 16 | Evidence from Observations: Reported | ||||||||||||||||||||||||||||||||||||||||||||||||||||||||||||||||||||||||||
|
List of 13 Events for Episode 1
| |||||||||||||||||||||||||||||||||||||||||||||||||||||||||||||||||||||||||||
1989 Feb 19 - 1989 May 9 Confirmed Eruption Max VEI: 2
| Episode 1 | Eruption Episode | El Pinta vent | ||||||||||||||||||||||||||||||||||||||||||||
|---|---|---|---|---|---|---|---|---|---|---|---|---|---|---|---|---|---|---|---|---|---|---|---|---|---|---|---|---|---|---|---|---|---|---|---|---|---|---|---|---|---|---|---|---|---|
| 1989 Feb 19 - 1989 May 9 | Evidence from Observations: Reported | ||||||||||||||||||||||||||||||||||||||||||||
|
List of 7 Events for Episode 1 at El Pinta vent
| |||||||||||||||||||||||||||||||||||||||||||||
1974 Jul 2 ± 182 days - 1983 Jul 2 (?) ± 182 days Confirmed Eruption Max VEI: 1 (?)
| Episode 1 | Eruption Episode | ||||||||||||||||||||
|---|---|---|---|---|---|---|---|---|---|---|---|---|---|---|---|---|---|---|---|---|
| 1974 Jul 2 ± 182 days - 1983 Jul 2 (?) ± 182 days | Evidence from Observations: Reported | |||||||||||||||||||
|
List of 2 Events for Episode 1
| ||||||||||||||||||||
[ 1973 May 16 ± 15 days ] Uncertain Eruption
| Episode 1 | Eruption Episode | ||||||||||||||||||||||||||||||
|---|---|---|---|---|---|---|---|---|---|---|---|---|---|---|---|---|---|---|---|---|---|---|---|---|---|---|---|---|---|---|
| 1973 May 16 ± 15 days - Unknown | Evidence from Unknown | |||||||||||||||||||||||||||||
|
List of 4 Events for Episode 1
| ||||||||||||||||||||||||||||||
1950 Jan 12 - 1950 Sep 5 Confirmed Eruption Max VEI: 2
| Episode 1 | Eruption Episode | ||||||||||||||||||||
|---|---|---|---|---|---|---|---|---|---|---|---|---|---|---|---|---|---|---|---|---|
| 1950 Jan 12 - 1950 Sep 5 | Evidence from Observations: Reported | |||||||||||||||||||
|
List of 2 Events for Episode 1
| ||||||||||||||||||||
[ 1947 Jul 15 ] Uncertain Eruption
| Episode 1 | Eruption Episode | |||||||||||||||||||||||||
|---|---|---|---|---|---|---|---|---|---|---|---|---|---|---|---|---|---|---|---|---|---|---|---|---|---|
| 1947 Jul 15 - Unknown | Evidence from Unknown | ||||||||||||||||||||||||
|
List of 3 Events for Episode 1
| |||||||||||||||||||||||||
1936 Feb 9 - 1936 Aug 27 (?) Confirmed Eruption Max VEI: 2
| Episode 1 | Eruption Episode | ||||||||||||||||||||||||||||||||||||||||||||||||||
|---|---|---|---|---|---|---|---|---|---|---|---|---|---|---|---|---|---|---|---|---|---|---|---|---|---|---|---|---|---|---|---|---|---|---|---|---|---|---|---|---|---|---|---|---|---|---|---|---|---|---|
| 1936 Feb 9 - 1936 Aug 27 (?) | Evidence from Observations: Reported | |||||||||||||||||||||||||||||||||||||||||||||||||
|
List of 8 Events for Episode 1
| ||||||||||||||||||||||||||||||||||||||||||||||||||
[ 1933 ] Uncertain Eruption
| Episode 1 | Eruption Episode | |||||||||||||||
|---|---|---|---|---|---|---|---|---|---|---|---|---|---|---|---|
| 1933 - Unknown | Evidence from Unknown | ||||||||||||||
|
List of 1 Events for Episode 1
| |||||||||||||||
1932 Oct 10 Confirmed Eruption Max VEI: 2
| Episode 1 | Eruption Episode | ||||||||||||||||||||
|---|---|---|---|---|---|---|---|---|---|---|---|---|---|---|---|---|---|---|---|---|
| 1932 Oct 10 - Unknown | Evidence from Observations: Reported | |||||||||||||||||||
|
List of 2 Events for Episode 1
| ||||||||||||||||||||
[ 1930 Apr 17 ] Uncertain Eruption
| Episode 1 | Eruption Episode | |||||||||||||||
|---|---|---|---|---|---|---|---|---|---|---|---|---|---|---|---|
| 1930 Apr 17 - Unknown | Evidence from Unknown | ||||||||||||||
|
List of 1 Events for Episode 1
| |||||||||||||||
1924 Oct - 1927 Confirmed Eruption Max VEI: 3
| Episode 1 | Eruption Episode | |||||||||||||||||||||||||||||||||||||||||||||||||||||||
|---|---|---|---|---|---|---|---|---|---|---|---|---|---|---|---|---|---|---|---|---|---|---|---|---|---|---|---|---|---|---|---|---|---|---|---|---|---|---|---|---|---|---|---|---|---|---|---|---|---|---|---|---|---|---|---|
| 1924 Oct - 1927 | Evidence from Observations: Reported | ||||||||||||||||||||||||||||||||||||||||||||||||||||||
|
List of 9 Events for Episode 1
| |||||||||||||||||||||||||||||||||||||||||||||||||||||||
1923 Dec 8 Confirmed Eruption Max VEI: 2
| Episode 1 | Eruption Episode | ||||||||||||||||||||
|---|---|---|---|---|---|---|---|---|---|---|---|---|---|---|---|---|---|---|---|---|
| 1923 Dec 8 - Unknown | Evidence from Observations: Reported | |||||||||||||||||||
|
List of 2 Events for Episode 1
| ||||||||||||||||||||
1891 Confirmed Eruption Max VEI: 2
| Episode 1 | Eruption Episode | |||||||||||||||||||||||||
|---|---|---|---|---|---|---|---|---|---|---|---|---|---|---|---|---|---|---|---|---|---|---|---|---|---|
| 1891 - Unknown | Evidence from Observations: Reported | ||||||||||||||||||||||||
|
List of 3 Events for Episode 1
| |||||||||||||||||||||||||
1889 Jul 3 Confirmed Eruption Max VEI: 2
| Episode 1 | Eruption Episode | |||||||||||||||||||||||||
|---|---|---|---|---|---|---|---|---|---|---|---|---|---|---|---|---|---|---|---|---|---|---|---|---|---|
| 1889 Jul 3 - Unknown | Evidence from Observations: Reported | ||||||||||||||||||||||||
|
List of 3 Events for Episode 1
| |||||||||||||||||||||||||
1865 Oct 2 - 1870 Confirmed Eruption Max VEI: 3
| Episode 1 | Eruption Episode | |||||||||||||||||||||||||||||||||||||||||||||||||||||||
|---|---|---|---|---|---|---|---|---|---|---|---|---|---|---|---|---|---|---|---|---|---|---|---|---|---|---|---|---|---|---|---|---|---|---|---|---|---|---|---|---|---|---|---|---|---|---|---|---|---|---|---|---|---|---|---|
| 1865 Oct 2 - 1870 | Evidence from Observations: Reported | ||||||||||||||||||||||||||||||||||||||||||||||||||||||
|
List of 9 Events for Episode 1
| |||||||||||||||||||||||||||||||||||||||||||||||||||||||
[ 1836 ] Uncertain Eruption
| Episode 1 | Eruption Episode | ||||||||||||||||||||
|---|---|---|---|---|---|---|---|---|---|---|---|---|---|---|---|---|---|---|---|---|
| 1836 - Unknown | Evidence from Unknown | |||||||||||||||||||
|
List of 2 Events for Episode 1
| ||||||||||||||||||||
1834 Confirmed Eruption Max VEI: 2
| Episode 1 | Eruption Episode | |||||||||||||||||||||||||
|---|---|---|---|---|---|---|---|---|---|---|---|---|---|---|---|---|---|---|---|---|---|---|---|---|---|
| 1834 - Unknown | Evidence from Observations: Reported | ||||||||||||||||||||||||
|
List of 3 Events for Episode 1
| |||||||||||||||||||||||||
1828 Oct 24 - 1834 Mar Confirmed Eruption Max VEI: 3
| Episode 1 | Eruption Episode | |||||||||||||||||||||||||||||||||||||||||||||
|---|---|---|---|---|---|---|---|---|---|---|---|---|---|---|---|---|---|---|---|---|---|---|---|---|---|---|---|---|---|---|---|---|---|---|---|---|---|---|---|---|---|---|---|---|---|
| 1828 Oct 24 - 1834 Mar | Evidence from Observations: Reported | ||||||||||||||||||||||||||||||||||||||||||||
|
List of 7 Events for Episode 1
| |||||||||||||||||||||||||||||||||||||||||||||
1823 Jun 17 - 1823 Jun 24 Confirmed Eruption Max VEI: 2
| Episode 1 | Eruption Episode | |||||||||||||||||||||||||
|---|---|---|---|---|---|---|---|---|---|---|---|---|---|---|---|---|---|---|---|---|---|---|---|---|---|
| 1823 Jun 17 - 1823 Jun 24 | Evidence from Observations: Reported | ||||||||||||||||||||||||
|
List of 3 Events for Episode 1
| |||||||||||||||||||||||||
1796 Nov - 1801 Confirmed Eruption Max VEI: 2
| Episode 1 | Eruption Episode | |||||||||||||||||||||||||
|---|---|---|---|---|---|---|---|---|---|---|---|---|---|---|---|---|---|---|---|---|---|---|---|---|---|
| 1796 Nov - 1801 | Evidence from Observations: Reported | ||||||||||||||||||||||||
|
List of 3 Events for Episode 1
| |||||||||||||||||||||||||
1754 - 1756 Confirmed Eruption Max VEI: 2
| Episode 1 | Eruption Episode | ||||||||||||||||||||
|---|---|---|---|---|---|---|---|---|---|---|---|---|---|---|---|---|---|---|---|---|
| 1754 - 1756 | Evidence from Observations: Reported | |||||||||||||||||||
|
List of 2 Events for Episode 1
| ||||||||||||||||||||
1670 - 1736 Confirmed Eruption Max VEI: 3
| Episode 1 | Eruption Episode | ||||||||||||||||||||||||||||||||||||||||||||||||||||||||||||
|---|---|---|---|---|---|---|---|---|---|---|---|---|---|---|---|---|---|---|---|---|---|---|---|---|---|---|---|---|---|---|---|---|---|---|---|---|---|---|---|---|---|---|---|---|---|---|---|---|---|---|---|---|---|---|---|---|---|---|---|---|
| 1670 - 1736 | Evidence from Observations: Reported | |||||||||||||||||||||||||||||||||||||||||||||||||||||||||||
|
List of 10 Events for Episode 1
| ||||||||||||||||||||||||||||||||||||||||||||||||||||||||||||
1641 - 1643 Confirmed Eruption Max VEI: 3
| Episode 1 | Eruption Episode | ||||||||||||||||||||||||||||||
|---|---|---|---|---|---|---|---|---|---|---|---|---|---|---|---|---|---|---|---|---|---|---|---|---|---|---|---|---|---|---|
| 1641 - 1643 | Evidence from Observations: Reported | |||||||||||||||||||||||||||||
|
List of 4 Events for Episode 1
| ||||||||||||||||||||||||||||||
1616 Jul 4 - 1616 Jul 4 Confirmed Eruption Max VEI: 3
| Episode 1 | Eruption Episode | ||||||||||||||||||||||||||||||
|---|---|---|---|---|---|---|---|---|---|---|---|---|---|---|---|---|---|---|---|---|---|---|---|---|---|---|---|---|---|---|
| 1616 Jul 4 - 1616 Jul 4 | Evidence from Observations: Reported | |||||||||||||||||||||||||||||
|
List of 4 Events for Episode 1
| ||||||||||||||||||||||||||||||
1580 Dec 7 - 1580 Dec 7 Confirmed Eruption Max VEI: 3
| Episode 1 | Eruption Episode | ||||||||||||||||||||||||||||||||||||||||
|---|---|---|---|---|---|---|---|---|---|---|---|---|---|---|---|---|---|---|---|---|---|---|---|---|---|---|---|---|---|---|---|---|---|---|---|---|---|---|---|---|
| 1580 Dec 7 - 1580 Dec 7 | Evidence from Observations: Reported | |||||||||||||||||||||||||||||||||||||||
|
List of 6 Events for Episode 1
| ||||||||||||||||||||||||||||||||||||||||
1535 Confirmed Eruption Max VEI: 3
| Episode 1 | Eruption Episode | ||||||||||||||||||||
|---|---|---|---|---|---|---|---|---|---|---|---|---|---|---|---|---|---|---|---|---|
| 1535 - Unknown | Evidence from Observations: Reported | |||||||||||||||||||
|
List of 2 Events for Episode 1
| ||||||||||||||||||||
0890 ± 200 years Confirmed Eruption Max VEI: 2
| Episode 1 | Eruption Episode | ||||||||||||||||||||||||||||||||||||||||
|---|---|---|---|---|---|---|---|---|---|---|---|---|---|---|---|---|---|---|---|---|---|---|---|---|---|---|---|---|---|---|---|---|---|---|---|---|---|---|---|---|
| 0890 ± 200 years - Unknown | Evidence from Isotopic: 14C (calibrated) | |||||||||||||||||||||||||||||||||||||||
|
List of 6 Events for Episode 1
| ||||||||||||||||||||||||||||||||||||||||
0490 BCE ± 100 years Confirmed Eruption Max VEI: 2
| Episode 1 | Eruption Episode | |||||||||||||||||||||||||||||||||||
|---|---|---|---|---|---|---|---|---|---|---|---|---|---|---|---|---|---|---|---|---|---|---|---|---|---|---|---|---|---|---|---|---|---|---|---|
| 0490 BCE ± 100 years - Unknown | Evidence from Isotopic: 14C (calibrated) | ||||||||||||||||||||||||||||||||||
|
List of 5 Events for Episode 1
| |||||||||||||||||||||||||||||||||||
1160 BCE ± 300 years Confirmed Eruption Max VEI: 2
| Episode 1 | Eruption Episode | ||||||||||||||||||||||||||||||
|---|---|---|---|---|---|---|---|---|---|---|---|---|---|---|---|---|---|---|---|---|---|---|---|---|---|---|---|---|---|---|
| 1160 BCE ± 300 years - Unknown | Evidence from Isotopic: 14C (calibrated) | |||||||||||||||||||||||||||||
|
List of 4 Events for Episode 1
| ||||||||||||||||||||||||||||||
2580 BCE ± 500 years Confirmed Eruption Max VEI: 2
| Episode 1 | Eruption Episode | |||||||||||||||||||||||||||||||||||
|---|---|---|---|---|---|---|---|---|---|---|---|---|---|---|---|---|---|---|---|---|---|---|---|---|---|---|---|---|---|---|---|---|---|---|---|
| 2580 BCE ± 500 years - Unknown | Evidence from Isotopic: 14C (calibrated) | ||||||||||||||||||||||||||||||||||
|
List of 5 Events for Episode 1
| |||||||||||||||||||||||||||||||||||
3150 BCE ± 200 years Confirmed Eruption Max VEI: 3
| Episode 1 | Eruption Episode | ||||||||||||||||||||||||||||||||||||||||
|---|---|---|---|---|---|---|---|---|---|---|---|---|---|---|---|---|---|---|---|---|---|---|---|---|---|---|---|---|---|---|---|---|---|---|---|---|---|---|---|---|
| 3150 BCE ± 200 years - Unknown | Evidence from Isotopic: 14C (calibrated) | |||||||||||||||||||||||||||||||||||||||
|
List of 6 Events for Episode 1
| ||||||||||||||||||||||||||||||||||||||||
7050 BCE ± 1000 years Confirmed Eruption
| Episode 1 | Eruption Episode | ||||||||||||||||||||
|---|---|---|---|---|---|---|---|---|---|---|---|---|---|---|---|---|---|---|---|---|
| 7050 BCE ± 1000 years - Unknown | Evidence from Correlation: Tephrochronology | |||||||||||||||||||
|
List of 2 Events for Episode 1
| ||||||||||||||||||||
There is data available for 1 deformation periods. Expand each entry for additional details.
| Start Date: 2007 Dec 04 | Stop Date: 2008 Jan 19 | Direction: Subsidence | Method: InSAR |
| Magnitude: 3.000 cm | Spatial Extent: 5.00 km | Latitude: 1.000 | Longitude: -77.000 |
Remarks: Subsidence of the NE flank is concurrent with the 17 January 2008 eruption and can be modeled with a near-horizontal sill. | |||
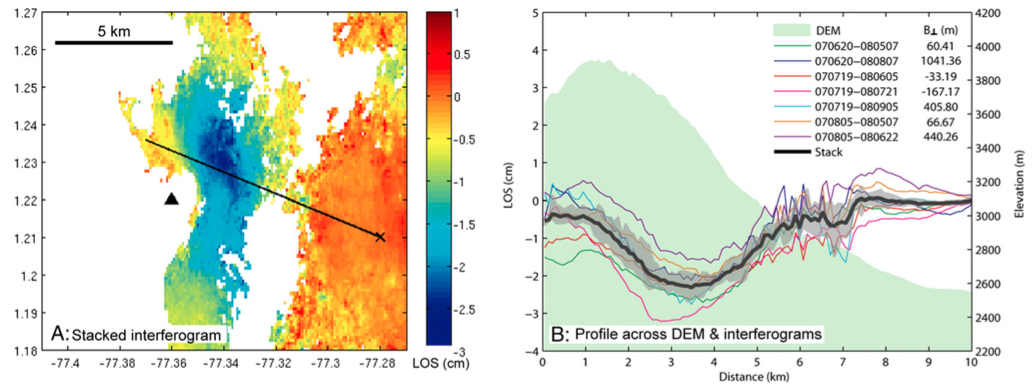 |
A) Galeras stacked interferogram, derived by averaging 7 L-band interferograms from tracks 152 and 153 over the period 20 June 2007?5 September 2008. The reference point used to scale amplitudes is displayed as a cross and the traverse used for extracting phase and elevation data is shown as the NW-SE trending line. The triangle marks the location of the summit at Galeras volcano. B) Profiles extracted from interferograms and DEM across Galeras. Profiles across individual interferograms are displayed as thin coloured lines. The profile across the DEM is displayed as the green shaded area. The profile across the stacked interferogram is displayed as the black line and the difference between minimum and maximum values as the grey filled area. Interferogram master and slave dates are in the format yymmdd. From: Parks et al. 2011. |
||
Reference List: Parks et al. 2011.
Full References:
Parks, M., Biggs, CJ, Mather, T.A., Pyle, D.P., Amelung, F., Monsalve, M.L. & Narvaez Medina, L.., 2011. Co-eruptive subsidence at Galeras identified during an InSAR survey of Colombian volcanoes (2006-2009). JVGR, 202, (pp. 228-240).
There is data available for 1 emission periods. Expand each entry for additional details.
| Start Date: 2004 Aug 12 | Stop Date: 2004 Aug 12 | Method: Satellite (Earth Probe TOMS) |
| SO2 Altitude Min: 11 km | SO2 Altitude Max: 11 km | Total SO2 Mass: 3 kt |
Data Details
| Date Start | Date End | Assumed SO2 Altitude | SO2 Algorithm | SO2 Mass |
| 20040812 | 11.0 | 3.000 |
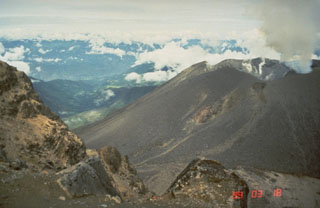 A large cone fills much of the large collapse scar at Galeras. It is seen degassing here on 18 March 1989 from the SE. The El Viejo flank crater can be seen near the center of the photo, with the Bastón fissure to the right, just below the rim of the main crater. The central cone has been the site of frequent eruptions since the time of the Spanish conquistadors.
 Galeras, a stratovolcano with a large breached caldera located immediately west of the city of Pasto, is one of Colombia's most frequently active volcanoes. It is seen here from the south on March 17, 1989, with steam clouds pouring from vents on the large central cone near the back headwall of the caldera, whose south rim forms the ridge in the foreground. Major explosive eruptions since the mid Holocene have produced widespread tephra deposits and pyroclastic flows that swept all but the southern flanks.
 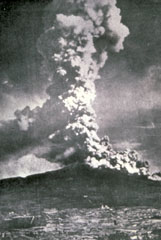 On August 27, 1936, a vigorous explosive eruption took place from Galeras volcano. Photographs taken from Pasto show pyroclastic flows descending the NE flank to distances of 3-4 km from the summit. The timing of eruptive activity in 1936 is ambiguous, but evidence does exist for an eruption on February 9 that produced explosions, the ejection of incandescent bombs, and an ash plume.
 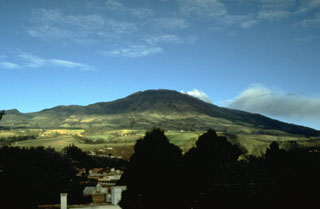 Galeras, one of the most active volcanoes of Colombia, rises west of the city of Pasto. The high point is the eastern rim of a large caldera that is breached to the west and serves to funnel most of the eruptive products of the volcano away from the city. Larger explosive eruptions during historical time have produced pyroclastic flows that overtopped the caldera rim.
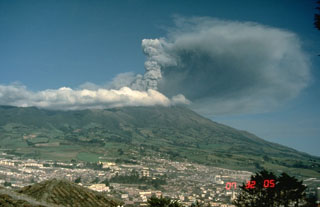 An ash plume from the summit crater of Galeras volcano rises above the city of Pasto on May 5, 1989. Intermittent phreatic explosions ejected ash and blocks from the El Pinta vent beginning on February 19. Periods of stronger activity took place on March 26-27 and May 4-9. The May activity produced pyroclastic surges near the crater.
The maps shown below have been scanned from the GVP map archives and include the volcano on this page. Clicking on the small images will load the full 300 dpi map. Very small-scale maps (such as world maps) are not included. The maps database originated over 30 years ago, but was only recently updated and connected to our main database. We welcome users to tell us if they see incorrect information or other problems with the maps; please use the Contact GVP link at the bottom of the page to send us email.
There are no samples for Galeras in the Smithsonian's NMNH Department of Mineral Sciences Rock and Ore collection.
| Copernicus Browser | The Copernicus Browser replaced the Sentinel Hub Playground browser in 2023, to provide access to Earth observation archives from the Copernicus Data Space Ecosystem, the main distribution platform for data from the EU Copernicus missions. |
| MIROVA | Middle InfraRed Observation of Volcanic Activity (MIROVA) is a near real time volcanic hot-spot detection system based on the analysis of MODIS (Moderate Resolution Imaging Spectroradiometer) data. In particular, MIROVA uses the Middle InfraRed Radiation (MIR), measured over target volcanoes, in order to detect, locate and measure the heat radiation sourced from volcanic activity. |
| MODVOLC Thermal Alerts | Using infrared satellite Moderate Resolution Imaging Spectroradiometer (MODIS) data, scientists at the Hawai'i Institute of Geophysics and Planetology, University of Hawai'i, developed an automated system called MODVOLC to map thermal hot-spots in near real time. For each MODIS image, the algorithm automatically scans each 1 km pixel within it to check for high-temperature hot-spots. When one is found the date, time, location, and intensity are recorded. MODIS looks at every square km of the Earth every 48 hours, once during the day and once during the night, and the presence of two MODIS sensors in space allows at least four hot-spot observations every two days. Each day updated global maps are compiled to display the locations of all hot spots detected in the previous 24 hours. There is a drop-down list with volcano names which allow users to 'zoom-in' and examine the distribution of hot-spots at a variety of spatial scales. |
|
WOVOdat
Single Volcano View Temporal Evolution of Unrest Side by Side Volcanoes |
WOVOdat is a database of volcanic unrest; instrumentally and visually recorded changes in seismicity, ground deformation, gas emission, and other parameters from their normal baselines. It is sponsored by the World Organization of Volcano Observatories (WOVO) and presently hosted at the Earth Observatory of Singapore.
GVMID Data on Volcano Monitoring Infrastructure The Global Volcano Monitoring Infrastructure Database GVMID, is aimed at documenting and improving capabilities of volcano monitoring from the ground and space. GVMID should provide a snapshot and baseline view of the techniques and instrumentation that are in place at various volcanoes, which can be use by volcano observatories as reference to setup new monitoring system or improving networks at a specific volcano. These data will allow identification of what monitoring gaps exist, which can be then targeted by remote sensing infrastructure and future instrument deployments. |
| Volcanic Hazard Maps | The IAVCEI Commission on Volcanic Hazards and Risk has a Volcanic Hazard Maps database designed to serve as a resource for hazard mappers (or other interested parties) to explore how common issues in hazard map development have been addressed at different volcanoes, in different countries, for different hazards, and for different intended audiences. In addition to the comprehensive, searchable Volcanic Hazard Maps Database, this website contains information about diversity of volcanic hazard maps, illustrated using examples from the database. This site is for educational purposes related to volcanic hazard maps. Hazard maps found on this website should not be used for emergency purposes. For the most recent, official hazard map for a particular volcano, please seek out the proper institutional authorities on the matter. |
| IRIS seismic stations/networks | Incorporated Research Institutions for Seismology (IRIS) Data Services map showing the location of seismic stations from all available networks (permanent or temporary) within a radius of 0.18° (about 20 km at mid-latitudes) from the given location of Galeras. Users can customize a variety of filters and options in the left panel. Note that if there are no stations are known the map will default to show the entire world with a "No data matched request" error notice. |
| UNAVCO GPS/GNSS stations | Geodetic Data Services map from UNAVCO showing the location of GPS/GNSS stations from all available networks (permanent or temporary) within a radius of 20 km from the given location of Galeras. Users can customize the data search based on station or network names, location, and time window. Requires Adobe Flash Player. |
| DECADE Data | The DECADE portal, still in the developmental stage, serves as an example of the proposed interoperability between The Smithsonian Institution's Global Volcanism Program, the Mapping Gas Emissions (MaGa) Database, and the EarthChem Geochemical Portal. The Deep Earth Carbon Degassing (DECADE) initiative seeks to use new and established technologies to determine accurate global fluxes of volcanic CO2 to the atmosphere, but installing CO2 monitoring networks on 20 of the world's 150 most actively degassing volcanoes. The group uses related laboratory-based studies (direct gas sampling and analysis, melt inclusions) to provide new data for direct degassing of deep earth carbon to the atmosphere. |
| Large Eruptions of Galeras | Information about large Quaternary eruptions (VEI >= 4) is cataloged in the Large Magnitude Explosive Volcanic Eruptions (LaMEVE) database of the Volcano Global Risk Identification and Analysis Project (VOGRIPA). |
| EarthChem | EarthChem develops and maintains databases, software, and services that support the preservation, discovery, access and analysis of geochemical data, and facilitate their integration with the broad array of other available earth science parameters. EarthChem is operated by a joint team of disciplinary scientists, data scientists, data managers and information technology developers who are part of the NSF-funded data facility Integrated Earth Data Applications (IEDA). IEDA is a collaborative effort of EarthChem and the Marine Geoscience Data System (MGDS). |

