Report on Long Valley (United States) — July 2001
Bulletin of the Global Volcanism Network, vol. 26, no. 7 (July 2001)
Managing Editor: Richard Wunderman.
Long Valley (United States) Decreased seismicity during 1999-2000
Please cite this report as:
Global Volcanism Program, 2001. Report on Long Valley (United States) (Wunderman, R., ed.). Bulletin of the Global Volcanism Network, 26:7. Smithsonian Institution. https://doi.org/10.5479/si.GVP.BGVN200107-323822
Long Valley
United States
37.7°N, 118.87°W; summit elev. 3390 m
All times are local (unless otherwise noted)
The following summarizes activity at Long Valley during 1999 (Hill, 1999) and 2000 (Hill, 2000). Summaries of activity during 1996, 1997 and 1998 can be found in BGVN 22:11, 22:12, and 24:06.
Summary of activity during 1999. The lowest level of activity within Long Valley since the onset of unrest in 1979-80 occurred in 1999. Earthquake activity and ground deformation were subdued throughout the year. The two largest earthquakes within the caldera were M 2.9 and 3.1 events that occurred on 1 January beneath the S margin of the caldera (5 km ESE of Mammoth Lakes), and on 27 March beneath the S margin of the resurgent dome (9 km E of Mammoth Lakes), respectively. On 24-25 February, a swarm of ~42 small earthquakes was centered just outside the caldera 1-2 km E of Lake Mary (5 km WSW of Mammoth Lakes); the largest in this sequence were M 3.2 and 2.9 events.
Two aspects of caldera seismicity during 1999 were noteworthy. One was the abrupt decrease in seismicity rate within the caldera on 15 May coincident with a M 5.6 earthquake S of the caldera in the Sierra Nevada. The second was a brief swarm of small earthquakes beneath the N flank of Mammoth Mountain within the hour following the M 7.1 Hector Mine earthquake of 16 October, the epicenter of which was in the Mojave Desert ~430 km SE of the caldera. This latter set of events appear to be a subtle example of remote triggering similar to events in the Long Valley caldera and elsewhere following the M 7.3 Landers earthquake in June 1992. Aside from a transient response to the 16 October earthquake, deformation within the caldera remained stationary through 1999.
The rate of deep long-period (LP) "volcanic" earthquake activity beneath the W flank of Mammoth Mountain tapered off following the elevated rate that persisted through the end of 1998. Deep LP earthquakes in 1999 included ~30 events, compared to an average of ~200 events/year during 1997-98. Initial results from the analysis of data collected during a 1997 seismic experiment indicates that these LP events occurred within a N-striking planar distribution that dips steeply (roughly 80°) W at depths of 10-20 km.
Carbon dioxide (CO2) soil-gas concentrations measured at fixed depths in the Horseshoe Lake (HSL) tree-kill area continued to show annual variation with snow depth and occasional fluctuations during the snow-free months. The only notable fluctuation in CO2 concentrations during 1999 involved a three-week increase at the SKI monitoring site (near Chair 19 in the Mammoth Mountain Ski Area) that began four days after the 15 May earthquake; whether these two events are related is unclear. With respect to the cold CO2 emissions from the soils, radioactive carbon measurements on cores from trees at the margin of the HSL tree-kill area indicated that the CO2 discharge in that area has been relatively constant since about 1995. Analyses of helium isotopic composition on the N side of Mammoth Mountain showed that the trend of decreasing 3He/4He at the MMF steam vent since 1997 was interrupted by a rise in May 1999 following a period of increased LP activity in the fall of 1998.
Summary of activity during 2000. Continuing the trend set in 1999, activity levels in the Long Valley caldera and vicinity remained low throughout 2000 (figure 23). Low-level earthquake activity within the caldera was scattered beneath the S moat, the S and E margins of the resurgent dome, and Mammoth Mountain. The largest of these intra-caldera earthquakes was a M 2.3 event that occurred as part of a cluster of half a dozen small earthquakes beneath Mammoth Mountain on 27 April. Activity in the Sierra Nevada immediately S of the caldera was largely concentrated in the aftershock zone of the 8 June 1998, 14 July 1998, and 15 May 1999 earthquakes. The largest earthquake of the year in the region was a M 3.8 earthquake on 20 January located in the Sierra Nevada midway between Convict Lake and Mt. Morrison.
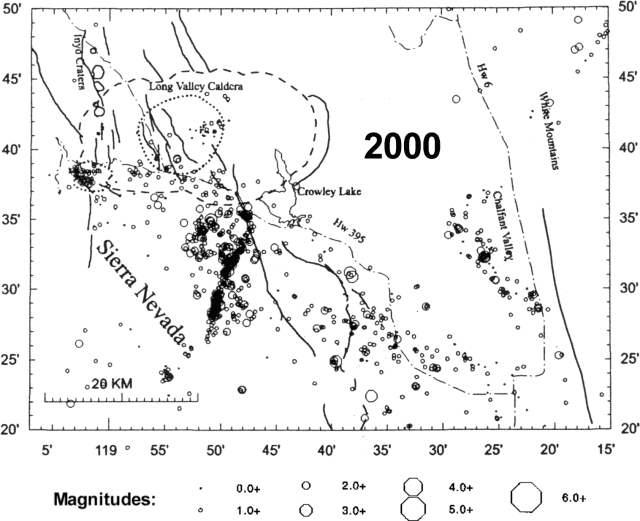 |
Figure 23. Earthquake epicenters in the Long Valley region during 2000. Courtesy of the USGS. |
The rate of deep LP earthquakes beneath the W flank of Mammoth Mountain, which began in 1989-90, accelerated significantly in 1997 through early 1998, tapered off in early 1999, and increased again in mid-2000 (figure 24). The increased rate began with a burst of some 15 events in July and included several additional bursts of 5-10 events each in December. Altogether, about 50 deep LP earthquakes were recorded at depths of 10-25 km beneath Mammoth Mountain during 2000.
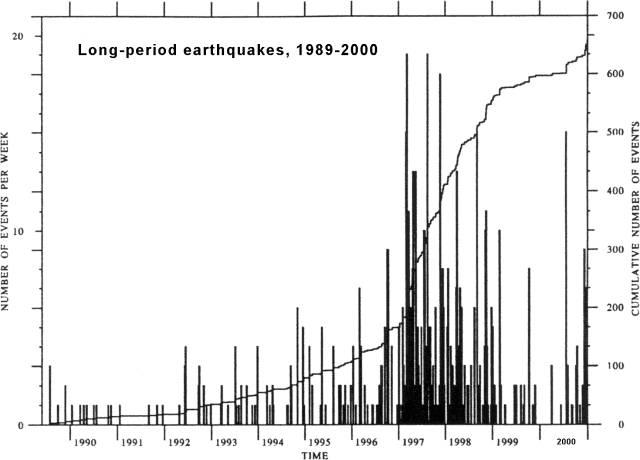 |
Figure 24. Time history of deep LP earthquakes in the Long Valley caldera beneath Mammoth Mountain from 1989 through 2000. The continuous line shows cumulative number (right ordinate), and vertical lines indicate number of LP events per week (left ordinate). Courtesy of the USGS. |
Two very-long-period (VLP) earthquakes were detected with hypocenters roughly 4 km beneath the summit of Mammoth Mountain; one on 6 July (0356 UTC) and the other on 13 August (0007 UTC). These two events, together with a similar event on 12 October 1996, are the only VLP earthquakes that have been detected beneath Mammoth Mountain since instrumental capability for detecting seismic events in this frequency band was acquired sometime in the 1990's. The fact that both the 6 July and 13 August VLP events were accompanied by spasmodic bursts of brittle failure earthquakes, opens the possibility that the 1989 Mammoth Mountain earthquake swarm, which included multiple episodes of spasmodic bursts, may have also included significant VLP activity. These Mammoth Mountain VLP events are similar to those beneath Kīlauea, which Bernard Chouet and colleagues interpret as the result of small slugs of magma, magmatic brine, or magmatic gas moving through a crack-like restriction. At this low rate, these VLP events do not indicate impending volcanic activity.
No significant deformation episodes were recorded during 2000. The two-color EDM data show small fluctuations about a slight contraction (subsidence) of the resurgent dome of 0.5-1.0 cm for the year. The center of the resurgent dome remains roughly 80 cm higher than in the late 1970's prior to the last two decades of caldera unrest. In contrast to Yellowstone and Campi Flegrei calderas, which showed pronounced uplift through the early 1980's followed by partial subsidence, Long Valley caldera has yet to show any significant subsidence. Rabaul, the other large caldera with well-documented deformation over the last couple of decades, showed sustained uplift at varying rates through the 1980's and early 1990's with no evidence of subsidence until the onset of eruptive activity in September 1994.
Hydrological monitoring in the caldera revealed no significant changes in water wells or stream flow that might be attributable to caldera unrest. Short-term CO2-flux variations during the snow-free months in the HSL tree-kill area appeared to be primarily related to local meteorological conditions. These measurements also show that the total CO2 flux has remained relatively steady over the past several years with no indication of a systematic decline with time. Soil-gas CO2 measured at fixed depths in the HSL tree-kill area continue to show an annual variation with snow depth and occasional temporary fluctuations during the snow-free months. The only notable fluctuation in CO2 concentrations during 2000 occurred at the Laurel Springs station (LSP), which showed a spike in late April and a number of spikes from mid-June through September. The process leading to these spikes remains to be determined. At this point, however, these spikes do not represent a hazard of the sort associated with the sustained high CO2 flux in the Mammoth Mountain tree-kill areas.
References: Hill, David P., 1999, Review of Long Valley Caldera activity for 1999: Long Valley Observatory, U.S. Geological Survey.
Hill, David P., 2000, Long Valley Observatory quarterly report October-December 2000 and annual summary for 2000: Long Valley Observatory, Volcano Hazards Program, U.S. Geological Survey.
Geological Summary. The large 17 x 32 km Long Valley caldera east of the central Sierra Nevada Range formed as a result of the voluminous Bishop Tuff eruption about 760,000 years ago. Resurgent doming in the central part of the caldera occurred shortly afterwards, followed by rhyolitic eruptions from the caldera moat and the eruption of rhyodacite from outer ring fracture vents, ending about 50,000 years ago. During early resurgent doming the caldera was filled with a large lake that left strandlines on the caldera walls and the resurgent dome island; the lake eventually drained through the Owens River Gorge. The caldera remains thermally active, with many hot springs and fumaroles, and has had significant deformation, seismicity, and other unrest in recent years. The late-Pleistocene to Holocene Inyo Craters cut the NW topographic rim of the caldera, and along with Mammoth Mountain on the SW topographic rim, are west of the structural caldera and are chemically and tectonically distinct from the Long Valley magmatic system.
Information Contacts: David Hill, Long Valley Observatory, U.S. Geological Survey, Volcano Hazards Program, MS 910, 345 Middlefield Rd., Menlo Park, CA 94025 USA (URL: https://volcanoes.usgs.gov/observatories/calvo/).