Report on Stromboli (Italy) — February 2018
Bulletin of the Global Volcanism Network, vol. 43, no. 2 (February 2018)
Managing Editor: Edward Venzke.
Edited by A. Elizabeth Crafford.
Stromboli (Italy) Moderate increase in thermal energy and explosion rate, April-August 2017
Please cite this report as:
Global Volcanism Program, 2018. Report on Stromboli (Italy) (Crafford, A.E., and Venzke, E., eds.). Bulletin of the Global Volcanism Network, 43:2. Smithsonian Institution. https://doi.org/10.5479/si.GVP.BGVN201802-211040
Stromboli
Italy
38.789°N, 15.213°E; summit elev. 924 m
All times are local (unless otherwise noted)
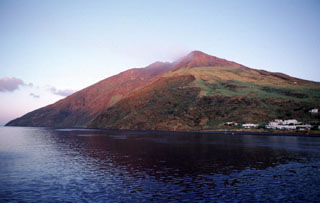
Confirmed historical eruptions at Italy's Stromboli volcano go back 2,000 years as this island volcano in the Tyrrhenian Sea has been a natural beacon for eons with its near-constant fountains of lava. Eruptive activity at the summit consistently occurs from multiple vents at both a north crater area (N Area) and a southern crater group (S or CS Area) on the Terrazza Craterica at the head of the Sciara del Fuoco, a large scarp that runs from the summit down the NW side of the island (figures 102 and 103). Thermal and visual cameras placed on the nearby Pizzo Sopra La Fossa monitor activity at the Terrazza Craterica. Eruptive activity continued at low to moderate levels during 2015 and 2016, with intermittent periods of frequent explosions from both crater areas that sent ash, lapilli, and bombs across the Terrazza Craterica and onto the head of the Sciara del Fuoco (BGVN 42:07).
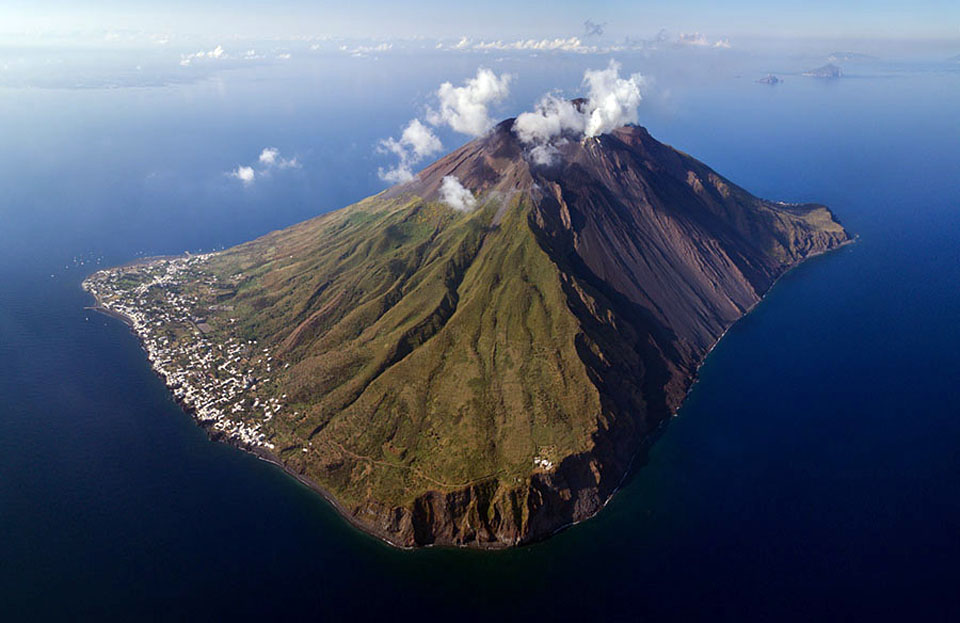 |
Figure 102. A view of Stromboli looking SW with the Sciara del Fuoco on the NW flank on the right. Image taken during 10-12 June 2017. Copyrighted photo by Martin Rietze, used with permission. |
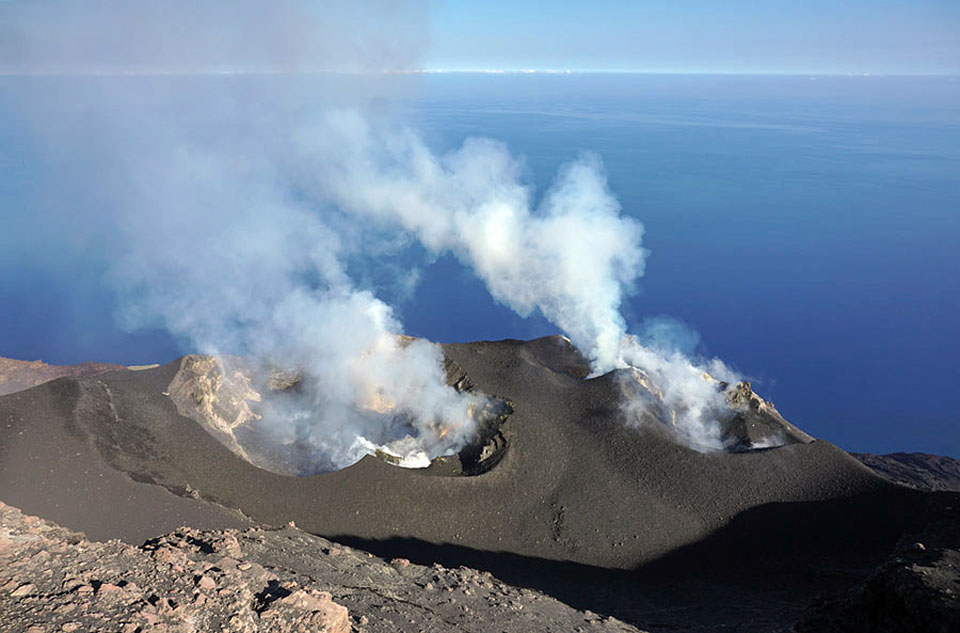 |
Figure 103. A view to the NW of the Terrazza Craterica from the summit of Stromboli shows the CS Area (left) and N Area (right) vents during 10-12 June 2017. Copyrighted photo by Martin Rietze, used with permission. |
This report covers activity from January-October 2017. Activity similar to 2016 continued through March 2017 when an increase began in explosion rates. The increase peaked during June and then declined through August, returning to background levels in September (figures 104). Thermal energy increased beginning in early May and lasted through mid-August (figure 105). Multiple MODVOLC thermal alerts were issued for Stromboli between 4 May and 25 August 2017. Weekly reports of activity were provided by the Instituto Nazionale de Geofisica e Vulcanologia (INGV), Sezione de Catania, which monitors the gas geochemistry, deformation, and seismology, as well as the surficial activity.
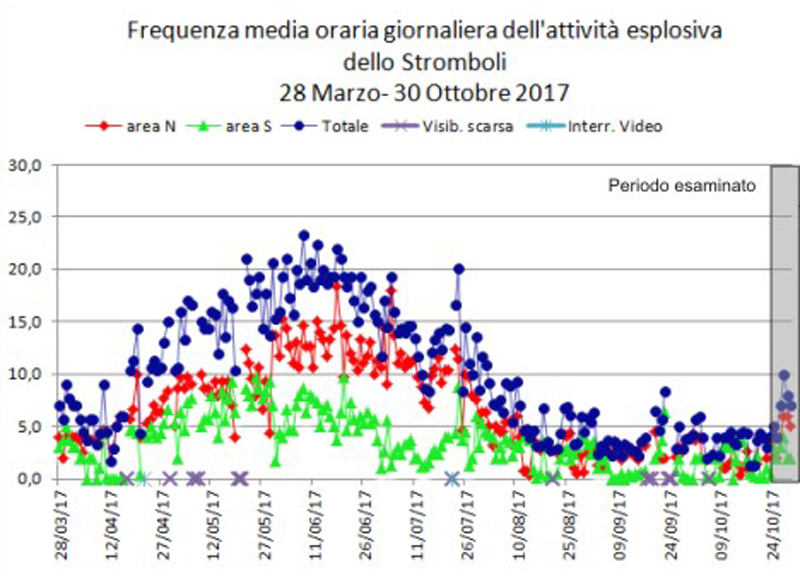 |
Figure 104. Increased rates of explosive activity at Stromboli were recorded between early April and late August 2017, peaking during mid-June. Rates declined to background levels by early September. The green line represents the number of daily explosions from the S Area, the red line is the number of daily explosions from the N Area, and the blue line is the cumulative of the two areas. Graph includes activity from 28 March-30 October 2017. Courtesy of INGV (Rep. 44/2017, Bollettino settimanale sul monitoraggio vulcanico, geochimico, delle deformazioni del suolo e sismico del vulcano Stromboli del 31/10/2017). |
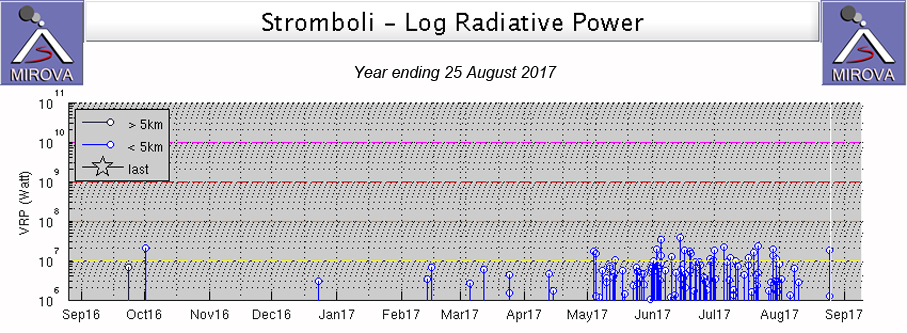 |
Figure 105. After a lengthy period of low to intermittent thermal activity during 2015 and 2016, a distinct increase in thermal energy was recorded in satellite thermal imagery and is shown in the MIROVA system data for the year ending on 25 August 2017. Courtesy of MIROVA. |
Activity during January 2017 consisted of low to moderate intensity explosions from the southern crater area (S Area), and low intensity explosions at the northern crater area (N Area). Two vents in the S Area generated explosive activity. Modest explosions with ash and lapilli occurred regularly from the southernmost vent, and rare explosions were observed from the northernmost vent (figure 106). At the northern crater area (N Area) the southern vent was active, generating ash and lapilli that was ejected a few tens of meters from the vent. There were no explosions from the northern vent in the N Area.
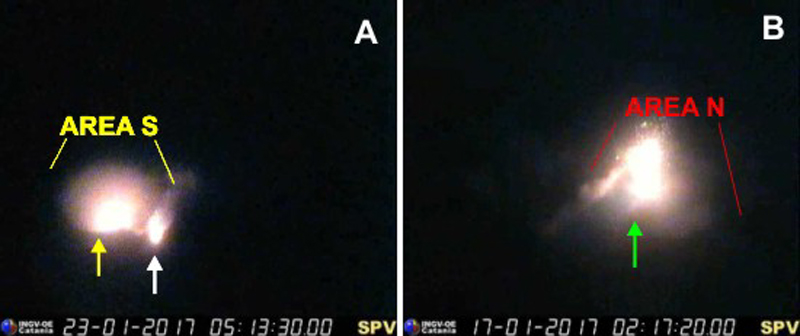 |
Figure 106. Typical activity at Stromboli's Terrazza Craterica during January 2017 photographed from visible cameras on the Pizzo sopra la Fossa. Left: Explosions at the S Area on 23 January 2017 included moderate activity at the southern vent (yellow arrow) and low activity at the northern vent (white arrow). Right: The southern vent (green arrow) of the N Area showed moderate explosive activity on 17 January 2017. Courtesy of INGV (Rep. 04/2017, Bollettino settimanale sul monitoraggio vulcanico, geochimico, delle deformazioni del suolo e sismico del vulcano Stromboli del 24/01/2017). |
There were no notable changes in activity until the second week of February 2017 when explosive activity returned to the northern vent of the N Area. During the third week of February, a gradual increase in the rate and intensity of the explosions at both areas was observed which lasted throughout the rest of the month (figure 107). Coarse pyroclastic material was ejected onto the Terrazza Craterica and occasionally onto the Sciara del Fuoco. The stronger explosions generated modest plumes of dilute ash that quickly dissipated.
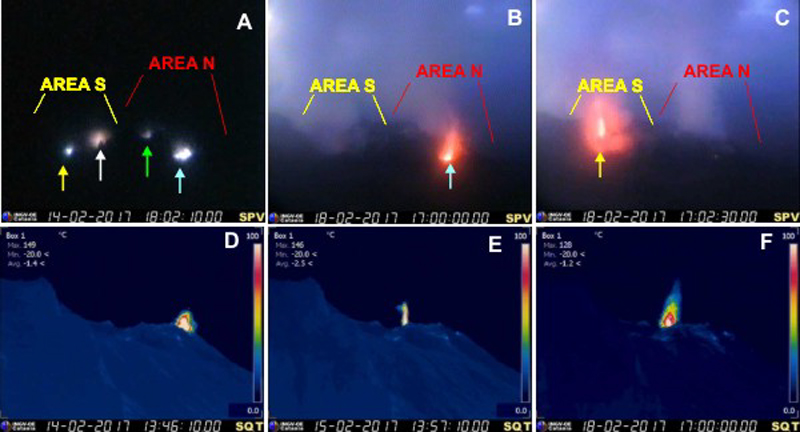 |
Figure 107. Explosive activity at Stromboli during the third week of February 2017: A) The colored arrows indicate the active vents in the S and N Areas as seen by the visible camera of the Pizzo. B) Explosion at the northern vent (blue arrow) of the N area (visible camera). C) Explosion at the southern vent (yellow arrow) of the S area (visible camera). D-F) explosions from the N and S Areas taken by the 400 level Thermal camera. Courtesy of INGV (Rep. 08/2017, Bollettino settimanale sul monitoraggio vulcanico, geochimico, delle deformazioni del suolo e sismico del vulcano Stromboli del 21/02/2017). |
During the first week of March 2017, the most active vents were the southernmost vent of the S Area and the northernmost vent of the N Area. The strongest explosions from the northern vent of the N Area produced dilute ash emissions and pyroclastic ejecta that landed on the upper part of the Sciara del Fuoco. By the third week of March, and through the end of the month, most of the activity had shifted to the vents in the N Area and diminished in the S Area. On 28 March, Etna Observatory personnel restored operations at both the infrared and visible cameras on the Pizzo sopra la Fossa which allowed for more detailed observations of the activity at the summit (figure 108).
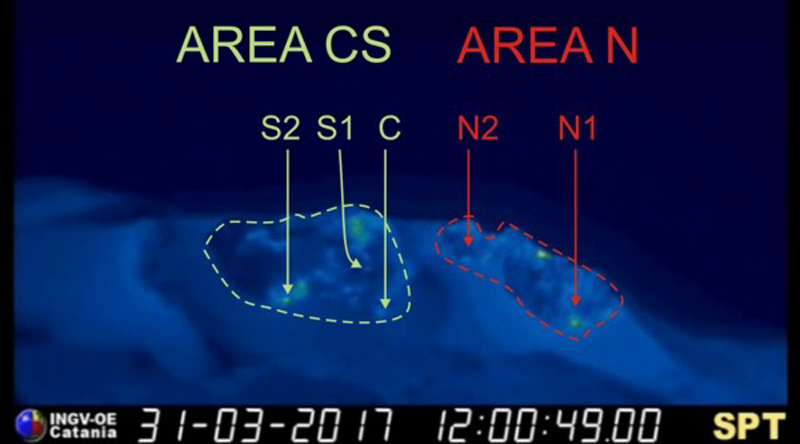 |
Figure 108. The Terrazza Craterica at Stromboli seen from the thermal camera on the Pizzo sopra la Fossa on 31 March 2017, showing active vents in the two crater areas (AREA N, AREA CS). The abbreviations and arrows indicate the names and locations of the active vents. Courtesy of INGV (Rep. 14/2017, Bollettino settimanale sul monitoraggio vulcanico, geochimico, delle deformazioni del suolo e sismico del, vulcano Stromboli del 04/04/2017). |
Throughout April 2017, the N1 vent produced low (less than 80 m high) to medium (80-150 m) intensity explosions containing ash, lapilli, and bombs. The N2 vent showed sporadic low intensity explosive activity with occasional ash emissions until 20 April when more coarse (lapilli and bombs) material was ejected. Vent C showed continuous degassing throughout the month, and low intensity explosions began there during the third week of April, causing intense spattering on 29 April. The S1 vent showed sporadic and weak explosive activity of low intensity with the ejection of coarse material until the third week when activity ceased. Vent S2 showed explosive activity of medium-low intensity (less than 120 m high) of coarse material sometimes mixed with ash. Explosion rates were around 2-10 events per hour during the first half of the month, rising to 10-15 per hour for the second half of April.
In the N Area, the N1 and N2 vents continued with a similar level of activity throughout May 2017 (figure 109). Explosions of low to medium intensity sent coarse ejecta of lapilli and bombs up to 150 m high at N1 and 120 m high at N2. The rate of explosions in the N Area ranged from 4-12 per hour.
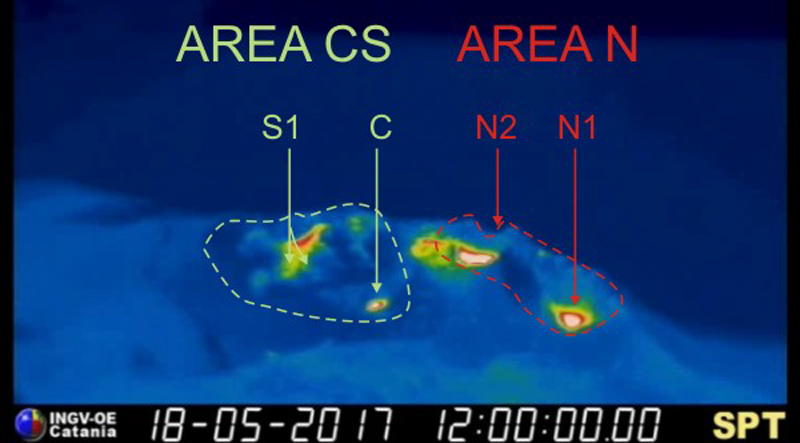 |
Figure 109. The Terrazza Craterica at Stromboli seen from the thermal camera located on the Pizzo sopra la Fossa on 18 May 2017, showing active vents in the two crater areas (AREA N, AREA CS). The abbreviations and arrows indicate the names and locations of the active vents. The vents in the N Area exhibited similar levels of activity throughout the month. Courtesy of INGV (Rep. 21/2017, Bollettino settimanale sul monitoraggio vulcanico, geochimico, delle deformazioni del suolo e sismico del vulcano Stromboli del 23/05/2017). |
In the S Area, activity was more variable during May, and the rate of explosions ranged from 2-10 per hour. Vent C also continued with intense degassing and low-intensity explosions and spattering. On 13 May, two emission points were observed at vent C, one a few meters S of the other. Vent S1 showed no activity until late in the second week of May when low to moderate intensity explosions rose up to 150 m with coarse ejecta. During 14-15 May, a second vent opened a few meters north of S1, and simultaneous explosions from both S1 vents sent jets of gas and incandescent material into the air. Activity decreased to low intensity explosions (less than 80 m high) with ejecta during the third week, but then increased significantly during the last week of the month. Ejecta reached 200 m high from the S1 vents (figure 110). The southern S1 vent built a surrounding hornito and produced high and narrow jets of incandescent material, while the northern emission point produced more modest jets of gas and material. Vent S2 was quiet for most of May, producing only low-intensity explosions of coarse material sometimes mixed with ash for a few days near the beginning of the month.
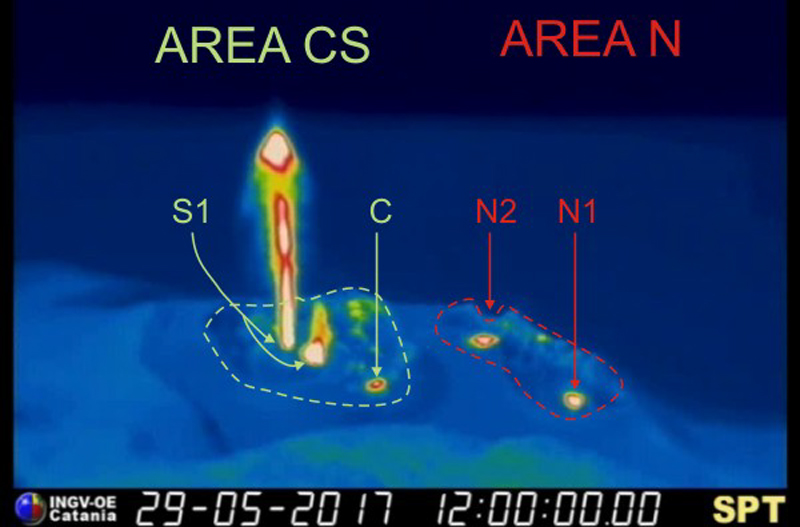 |
Figure 110. The Terrazza Craterica at Stromboli seen from the thermal camera on the Pizzo sopra la Fossa on 29 May 2017, showing active vents in the two crater areas (AREA N, AREA CS). The abbreviations and arrows indicate the names and locations of the active vents. The S1 vent in the CS Area produced high intensity jets of incandescent material that rose 200 m during the last week of the month. Courtesy of INGV (Rep. 22/2017, Bollettino settimanale sul monitoraggio vulcanico, geochimico, delle deformazioni del suolo e sismico del vulcano Stromboli del 30/05/2017). |
An increase in activity during June 2017 was apparent at both the N and S Areas (figure 111). Video taken by drone and from the summit during 10-12 June shows periodic explosions with ash, lapilli, and bombs ejected around the Terrazza Craterica (See Information Contacts for link). Vent N1 was characterized by low to medium-high intensity explosive activity that ejected lapilli and bombs to 200 m and was sometimes accompanied by ash that drifted S over the island. N2 also showed variable activity which ranged from low to high intensity (ejecta rising over 200 m high) during the first week, and low to medium-high (ejecta rose to 150 m) for the rest of the month (figure 112). Numerous bombs and lapilli were deposited both inside and outside the crater rim. Intense spattering was reported at N2 on 11, 12, 18, 19, and 26 June. The explosion rate in the N Area was 9-18 per hour.
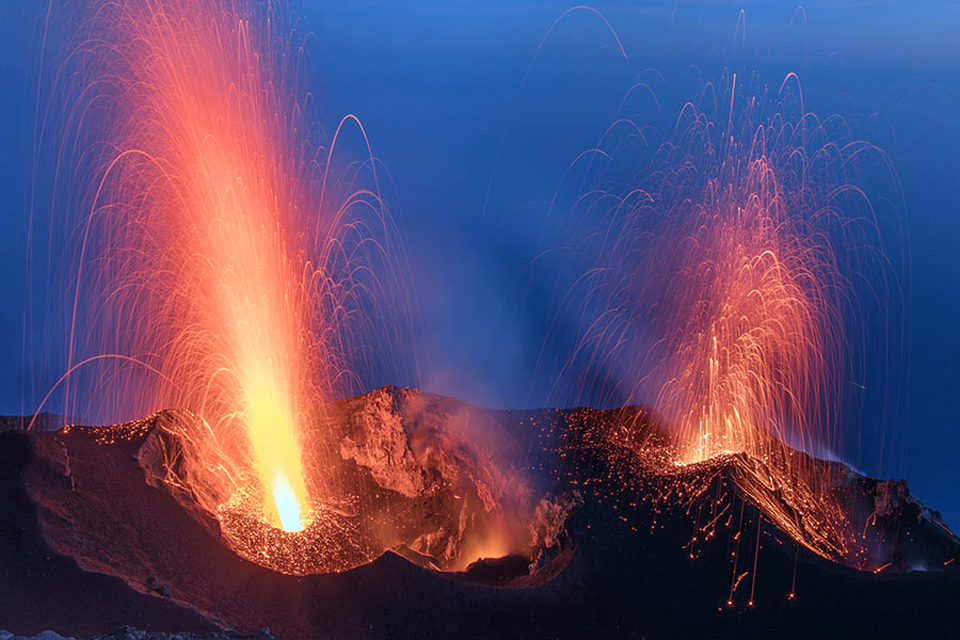 |
Figure 111. Thermal activity increased during June 2017 at Stromboli. Simultaneous explosions from both the S (left) and N (right) Areas during 10-12 June 2017 were photographed from the summit. Copyrighted photo by Martin Rietze, used with permission. |
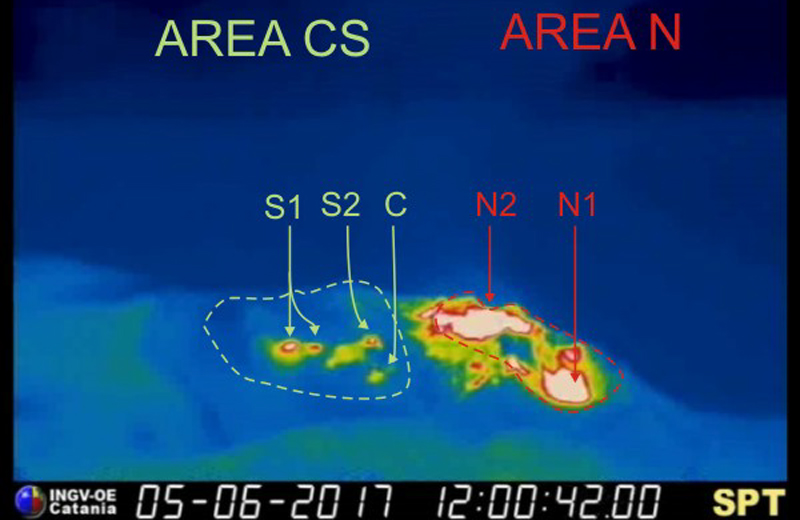 |
Figure 112. Increased thermal activity was apparent in the N Area of the Terrazza Craterica at Stromboli as seen from the thermal camera located on the Pizzo sopra la Fossa on 5 June 2017. Courtesy of INGV (Rep. 23/2017, Bollettino settimanale sul monitoraggio vulcanico, geochimico, delle deformazioni del suolo e sismico del vulcano Stromboli del 06/06/2017). |
In the CS Area, sporadic low-intensity explosions (less than 80 m high) characterized vent C, with modest spattering reported on 11, 12, 13, 26, 30 June 2017. Activity at S1 continued from two vents simultaneously with low to medium intensity explosive activity (figure 113 and 114). The vent at S2 reactivated briefly on 3 June after about a month of quiet with weak spattering activity but was not active again during the month. The CS Area was characterized by an explosion frequency of 1-10 per hour.
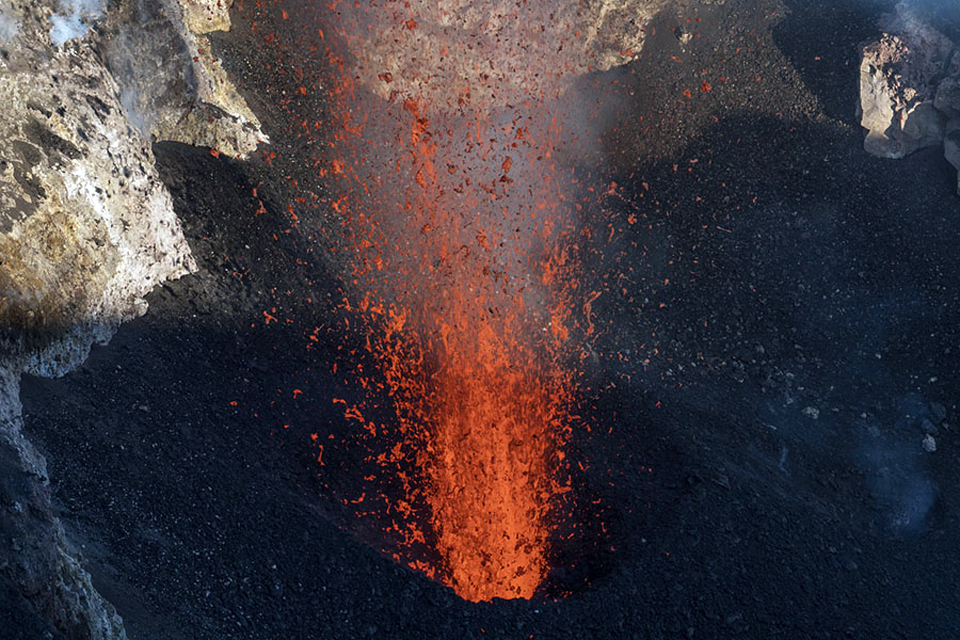 |
Figure 113. Explosions of incandescent ejecta from the CS Area at Stromboli during 10-12 June 2017. Copyrighted photo by Martin Rietze, used with permission. |
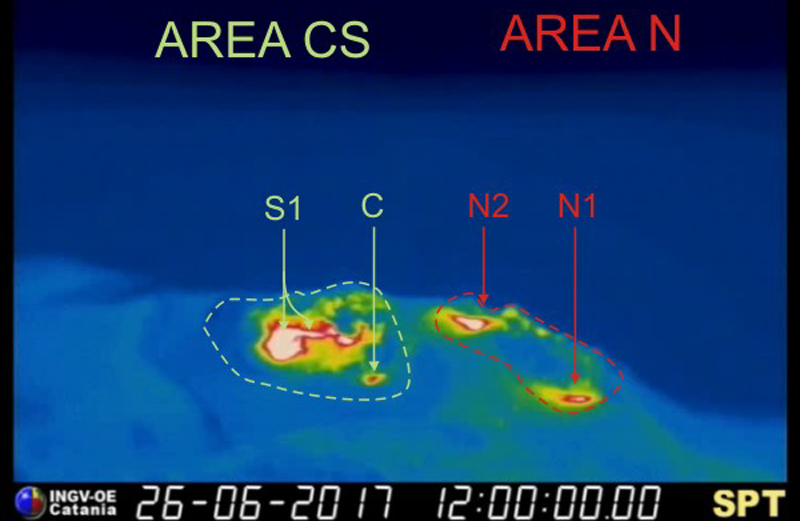 |
Figure 114. Increased activity at the CS Area of Stromboli on 26 June 2017 was recorded by the thermal camera located on the Pizzo sopra la Fossa. Activity at S1 continued from two vents simultaneously with low to medium intensity explosive activity for most of the month. Courtesy of INGV (Rep. 26/2017, Bollettino settimanale sul monitoraggio vulcanico, geochimico, delle deformazioni del suolo e sismico del vulcano Stromboli del 27/06/2017). |
During July 2017, thermal activity at the vents remained moderate to high; explosions at the N1 vent sent lapilli and bombs, sometimes mixed with ash, to 200 m above the vent. At vent N2, lapilli and bombs were ejected outside the crater rim, sometimes rolling down the Sciara del Fuoco to the ocean. The hourly frequency of explosions ranged from 5-18. At S1, both vents exploded simultaneously with lapilli, bombs and occasional ash rising to 150 m numerous times.
Beginning in the afternoon of 26 July, an explosive sequence at the CS Area lasting about 90 seconds was recorded with the thermal and visible image cameras on the Pizzo sopra la Fossa (figure 115). It began with explosions from vents C and S1, followed by a second explosion at S2. More explosions from C and S1 sent debris to the SE and were followed by fountaining to about 50 m from the vents for about a minute. INGV personnel witnessed 10-cm-diameter bombs on the SW side of the Pizzo at about 850 m elevation during a 30 July site visit.
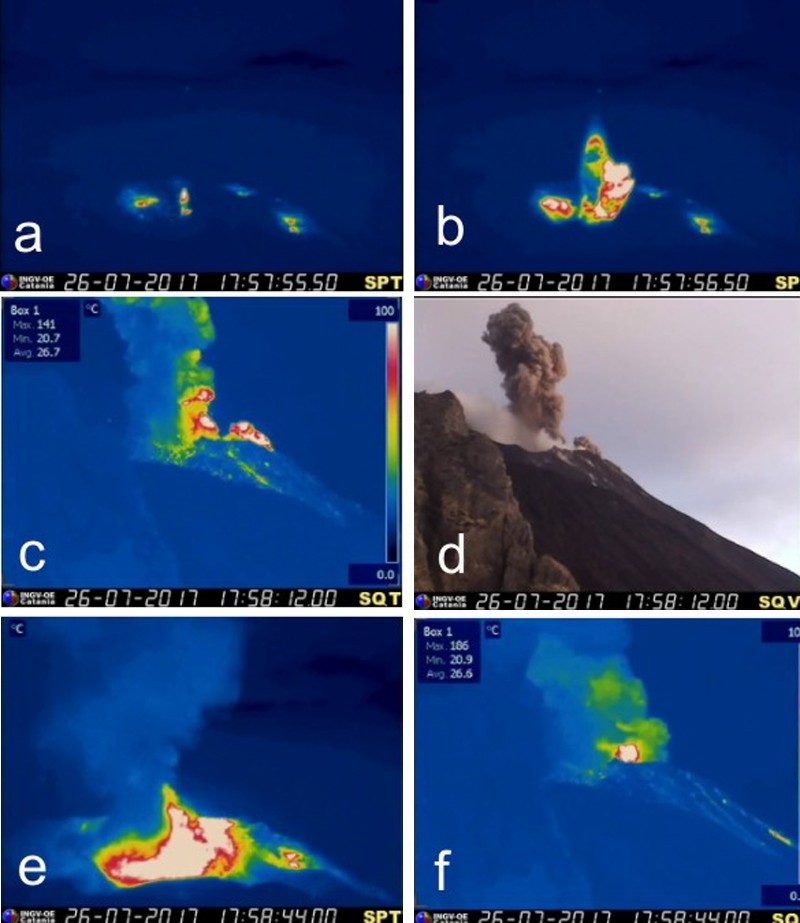 |
Figure 115. The explosive sequence of 26 July 2017 at Stromboli was recorded by the thermal and visible cameras located on the Pizzo sopra la Fossa. Details of the 90-second-long event are described in the text. Courtesy of INGV (Rep. 31/2017, Bollettino settimanale sul monitoraggio vulcanico, geochimico, delle deformazioni del suolo e sismico del vulcano Stromboli del 01/08/2017). |
A return to background activity during August consisted of explosions of varying intensity from low (less than 80 m) to medium-low (ejecta sometimes reached 120 m in height) at both the N and CS Area vents. Explosion frequency ranged from 2-11 per hour, decreasing significantly by the end of the month. Activity continued to diminish during September. Periodic spattering from vent C occurred. Only one vent was active in the CS Area during the month. A brief increase in intensity at vent N1 during 8-9 September sent ejecta over 150 m high. By the end of September, few explosions reached over 80 m in height. A brief episode of intense spattering at vent C on 24 September sent bombs and lapilli to 40 m above the vent. Explosion frequency averaged only 2-6 per hour by the end of September.
Continuous spattering, occasionally intense, from vent C continued during October. The vents in the N Area produced low to moderate intensity explosions, and one vent in the CS Area produced low intensity explosions. A strong explosive sequence in the CS Area lasted for about five minutes on 23 October 2017 (figure 116). The first explosion of the sequence came from vent C and lasted 30 seconds. It destroyed the hornito formed around the vent. About a minute later, two explosions occurred at the S1 vent, reaching about 120 m in height and dispersing to the SE. Another explosion at vent C about 3 minutes later sent ejecta 100 m high. The event ended with a series of small ash emissions that rose a few tens of meters. Low intensity activity continued from both areas through the end of October, with low explosion rates of around 2-6 per hour.
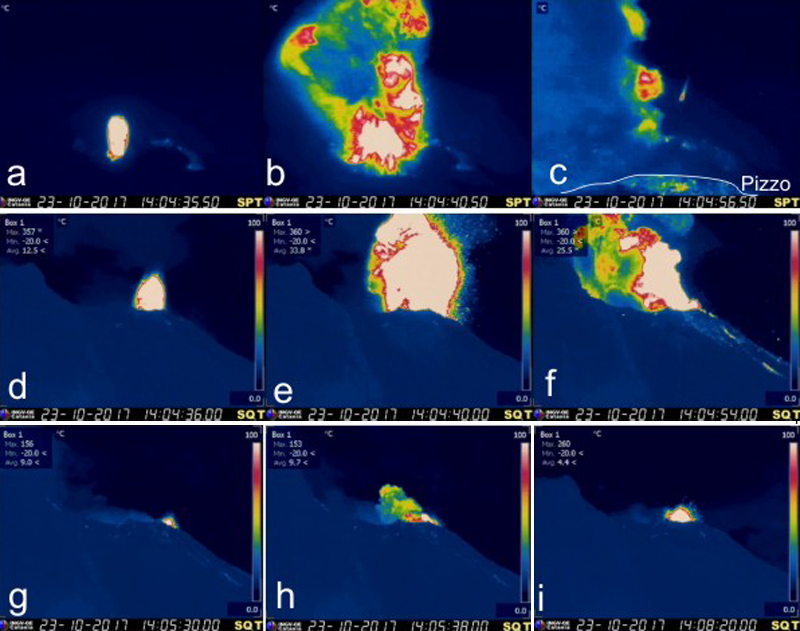 |
Figure 116. An explosive sequence from the CS Area at Stromboli on 23 October 2017 lasted about five minutes. Ejecta from vents C and S1 rose 100-150 m above the vents and dispersed SE. Courtesy of INGV (Rep. 43/2017, Bollettino settimanale sul monitoraggio vulcanico, geochimico, delle deformazioni del suolo e sismico del vulcano Stromboli del 24/10/2017). |
Geological Summary. Spectacular incandescent nighttime explosions at Stromboli have long attracted visitors to the "Lighthouse of the Mediterranean" in the NE Aeolian Islands. This volcano has lent its name to the frequent mild explosive activity that has characterized its eruptions throughout much of historical time. The small island is the emergent summit of a volcano that grew in two main eruptive cycles, the last of which formed the western portion of the island. The Neostromboli eruptive period took place between about 13,000 and 5,000 years ago. The active summit vents are located at the head of the Sciara del Fuoco, a prominent scarp that formed about 5,000 years ago due to a series of slope failures which extends to below sea level. The modern volcano has been constructed within this scarp, which funnels pyroclastic ejecta and lava flows to the NW. Essentially continuous mild Strombolian explosions, sometimes accompanied by lava flows, have been recorded for more than a millennium.
Information Contacts: Istituto Nazionale di Geofisica e Vulcanologia (INGV), Sezione di Catania, Piazza Roma 2, 95123 Catania, Italy, (URL: http://www.ct.ingv.it/en/); MIROVA (Middle InfraRed Observation of Volcanic Activity), a collaborative project between the Universities of Turin and Florence (Italy) supported by the Centre for Volcanic Risk of the Italian Civil Protection Department (URL: http://www.mirovaweb.it/); Hawai'i Institute of Geophysics and Planetology (HIGP), MODVOLC Thermal Alerts System, School of Ocean and Earth Science and Technology (SOEST), Univ. of Hawai'i, 2525 Correa Road, Honolulu, HI 96822, USA (URL: http://modis.higp.hawaii.edu/); Martin Rietze, Taubenstr. 1, D-82223 Eichenau, Germany (URL: https://mrietze.com/, https://www.youtube.com/channel/UC5LzAA_nyNWEUfpcUFOCpJw/videos, http://mrietze.com/web16/Stromb_Vesuv17.htm).