Report on Taal (Philippines) — October 2021
Bulletin of the Global Volcanism Network, vol. 46, no. 10 (October 2021)
Managing Editor: Edward Venzke.
Edited by Kadie L. Bennis.
Taal (Philippines) Phreatomagmatic eruptions during early July 2021
Please cite this report as:
Global Volcanism Program, 2021. Report on Taal (Philippines) (Bennis, K.L., and Venzke, E., eds.). Bulletin of the Global Volcanism Network, 46:10. Smithsonian Institution. https://doi.org/10.5479/si.GVP.BGVN202110-273070
Taal
Philippines
14.0106°N, 120.9975°E; summit elev. 311 m
All times are local (unless otherwise noted)
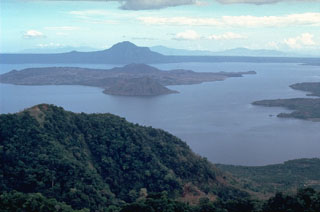
Taal is part of a caldera system located in southern Luzon Island and has had historical eruptions dating back to 3,580 BCE. The caldera is 15 x 20 km contains Lake Taal, with a depth of 160 m, and an island that also contains a lake within the Main Crater. The previous eruption occurred during January 2020 and was characterized by phreatic and magmatic explosions, ash plumes and ashfall, and significant sulfur dioxide plumes (BGVN 45:06). This report covers activity consisting of gas-and-steam emissions and sulfur dioxide plumes during May 2020 through September 2021, including a new phreatomagmatic eruption during 1-9 July 2021 using reports from the Philippine Institute of Volcanology and Seismology (PHIVOLCS) and various satellite data.
Summary of activity during May 2020-May 2021. During May 2020 through June 2021, activity was relatively low and consisted of dominantly volcanic earthquakes, rock-fracturing processes, and weak gas-and-steam emissions originating from vents on the Main Crater and fissure vents along the Daang Kastila Trail. On 29 March 2020 continuous GPS monitoring detected slow inflation on the NW section of the caldera. This inflation was also recorded by electronic tiltmeters in the NW of Volcano Island during the second week of July 2020.
PHIVOLCS reported that unrest increased around 13 February 2021, with continued ground deformation and a higher number of volcanic tremor events (866 were reported during 13 February and 9 March 2021) compared to previous months. Additionally, observations made during mid-February 2021 showed an increase in the Main Crater Lake (MCL) acidity to a pH 1.59, from a pH of 2.79 in January 2020. As a result, PHIVOLCS raised the Volcano Alert Level from 1 to 2 (on a scale of 0-5) on 9 March, which suggests that probable magmatic activity may occur. On 10 March significant sulfur dioxide emissions were measured, averaging 1,327 metric tons/day (t/d). The next day, 11 March, the sulfur dioxide emissions averaged 795 t/d. On 12 March a short (2.5 minutes) burst of gas-and-steam plumes rose 400-500 m above the Main Crater at 1411, accompanied by SO2 emissions that averaged 582 t/d. Diffuse steam plumes rose 50 m above fumarolic vents on the inner N and E walls during the rest of the day. An episode of high-temperature gas upwelling to the crater lake’s surface occurred during 1830-2045 on 14 March.
Daily volcanic tremor and earthquakes continued to be reported with variable durations, accompanied by gas-and-steam emissions. Though the near daily SO2 measurements were variable, there was a notable increase in emissions beginning in early April; the highest average was 7,576 t/d on 30 May. Upwelling of hot volcanic fluids in the crater lake was accompanied by steam plumes that were 300-600 m tall on 27 April, 30 April, and 4 May. On 3 May a gas-and-steam plume rose 500 m above the Main Crater Lake. A strong gas-and-steam plume rose 2 km above the Main Crater at 2300 and drifted SW, accompanied by SO2 emissions that averages 3,051 t/d. Low-level background tremor was consistently detected beginning on 8 April and continuing through the reporting period. Electronic tilt, continuous GPS and InSAR monitoring data showed that deflation was occurring on the island during April through September 2021 while the rest of the region has been undergoing slow extension since 2020.
Activity during June-July 2021. Low-level background tremor continued with frequent volcanic earthquakes, low-frequency earthquakes, and volcanic tremor. Gas-and-steam emissions during June rose as high as 2.5 km above the Main Crater and gradually increasing SO2 emissions reached a maximum of 14,326 t/d on 28 June. Peak measurements coincided with periods of vigorous upwelling at the Main Crater Lake; the upwelling was continuous from 1800 on 9 June to 1000 on 10 June, producing gas-and-steam plumes that rose 1.5 km and drifted mainly NW. Stronger gas-and-steam plumes were also reported, beginning on 28 June, rising as high as 3 km and drifting SW, SE, and NNW. Voggy conditions were also reported impacting the NE and E lakeshore communities; some of the residents reported adverse effects as a result.
On 1 July at 1516 a dark gray phreatomagmatic plume rose 1 km above the lake, continuing for about 5 minutes, prompting PHIVOLCS to raise the Volcano Alert Level from 2 to 3 at 1537 (figure 22). The explosion followed strong SO2 emissions on 28 June and 1 July (14,241 and 13,287 t/d, respectively). According to the Philippine Coast Guard, authorities evacuated residents in Banyaga, Bilibinwang, Gulod, Boso-boso, and Lakeshore Bugaan East due to the rise in the VAL. Successive phreatomagmatic events lasting no longer than two minutes each were detected at 1826, 1921, 1941, and 2020, producing jetted plumes 200 m above the Main Crater Lake. During 1-2 July the seismic network detected twenty-nine volcanic earthquakes, which included one explosion, twenty-two low-frequency earthquakes, and two volcanic tremors. Vog was also observed over the volcano and in the surrounding area. On 2 July a series of three short phreatomagmatic bursts occurred at 1025, 1047, and 1101, producing jetted plumes that rose 100 m above the Main Crater Lake. SO2 emissions remained high on 3 July with an average of 14,699 t/d. A PHIVOLCS volcano advisory issued on 4 July at 1615 reported markedly high sulfur dioxide emissions with an average of 22,628 t/d, following 26 strong and very shallow low-frequency volcanic earthquakes below the E part of the island. Lake upwelling persisted during 5-6 July with steam-and-gas plumes rising 2.5-3 km. Sulfur dioxide emissions averaged 5,299 t/d on 5 July. A DROMIC (Disaster Response Operations Monitoring and Information Center) report stated that 3,027 people were in 20 evacuation centers, and 2,759 people were in private residences by 6 July.
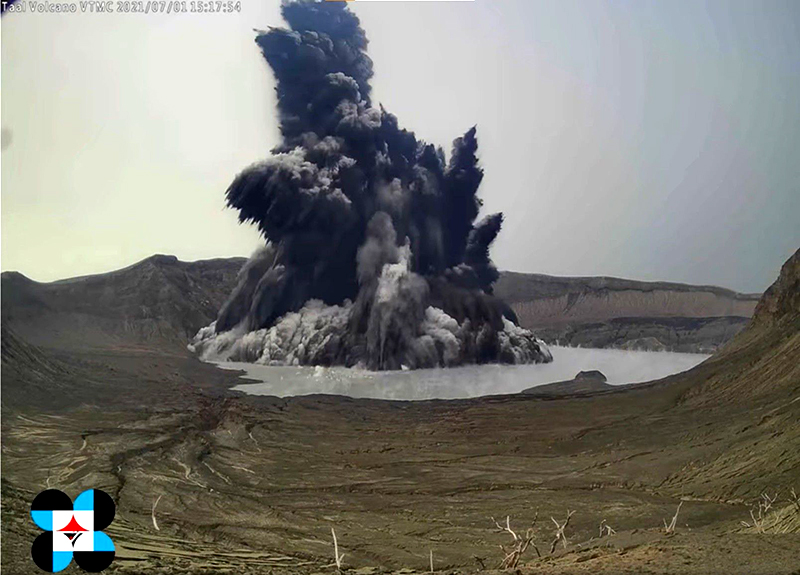 |
Figure 22. Webcam image of the phreatomagmatic plume rising above Taal on 1 July at 1516. Courtesy of PHIVOLCS. |
A series of five phreatomagmatic bursts were detected at 0847, 0915, 0926, 1156, and 2141 on 7 July, producing jetted plumes that rose 700 m above the Main Crater Lake; in addition, a brief event at 1718 on the same day produced a gray plume that rose 300 m high and drifted SE. On 8 July another series of five short phreatomagmatic bursts were detected at 0647, 0606, 0921, 0950, and 0259 on 9 July that produced jetted plumes that rose 200 m above the Main Crater Lake. High levels of SO2 emissions continued to be recorded, rising 1.2 km above the Main Crater and drifting NW, and averaging 6,095 t/d on 8 July. According to a DROMIC report, 10,408 people were in evacuation centers or private residences by 12 July. On 14 July an SO2 plume rose 1.8 km above the crater and drifted SW.
Daily gas-and-steam plumes and frequent sulfur dioxide emissions continued; tremor events at 1018 and 1038 on 20 July were felt by residents of Pira-piraso in the NE sector of Volcano Island. The DROMIC report stated that 3,839 people were in evacuation centers or private residences on 20 July. On 23 July at 1930 PHIVOLCS lowered the Volcano Alert Level from 3 (Magmatic Unrest) to 2 (Decreased Unrest). The activity during 1-9 July was accompanied by a total of 1,201 tremor events that ranged from an M 1.8 to an M 4.6; of these, 789 were volcanic tremor, 365 were low-frequency, 27 were hybrid, and 8 were volcano-tectonic earthquakes. Campaign Flyspec data showed that sulfur dioxide emissions averaged 12,161 t/d during the first week of July, which then decreased to 4,763 t/d during 8-22 July. Unrest has been characterized by seismicity, generally declining volcanic gas emissions, and slight ground deformation after 9 July.
During August and September, activity remained low and included volcanic tremor and weak gas-and-steam emissions that rose 5-3,000 m above the crater. Electronic tiltmeters, GPS, and InSAR data continued to show deflation in the region. Sulfur dioxide emissions was a maximum value of 15,508 t/d on 14 September. Vog was also reported over the area during 12-25 August and 29-30 September. During 17-18 August residents reported smelling sulfuric odor in Barangay Buso-Buso and Gulod, Laurel, Batangas and during 19-20 August some residents in Talisay and Barangay Agoncillo reported adverse effects.
Satellite data. Frequent and distinct sulfur dioxide plumes drifting various directions were observed using satellite sensors during the reporting period. Strong SO2 plumes were notable during 27-30 June 2021 leading up to the phreatomagmatic events on 1 July, based on data from the TROPOMI instrument on the Sentinel-5P satellite (figure 23). Similar strong plumes that exceeded 2 Dobson Units (DUs) continued to be visible in satellite data through September (figure 24).
 |
Figure 23. Consecutive distinct sulfur dioxide plumes were detected at Taal on 27 June (top left), 28 June (top right), 29 June (bottom left), and 30 June (bottom right) 2021 that drifted in different directions, using the TROPOMI instrument on the Sentinel-5P satellite. These strong SO2 plumes led to the phreatomagmatic plume that occurred on 1 July. The plumes shown here exceeded 2 Dobson Units (DUs). Courtesy of NASA Global Sulfur Dioxide Monitoring Page. |
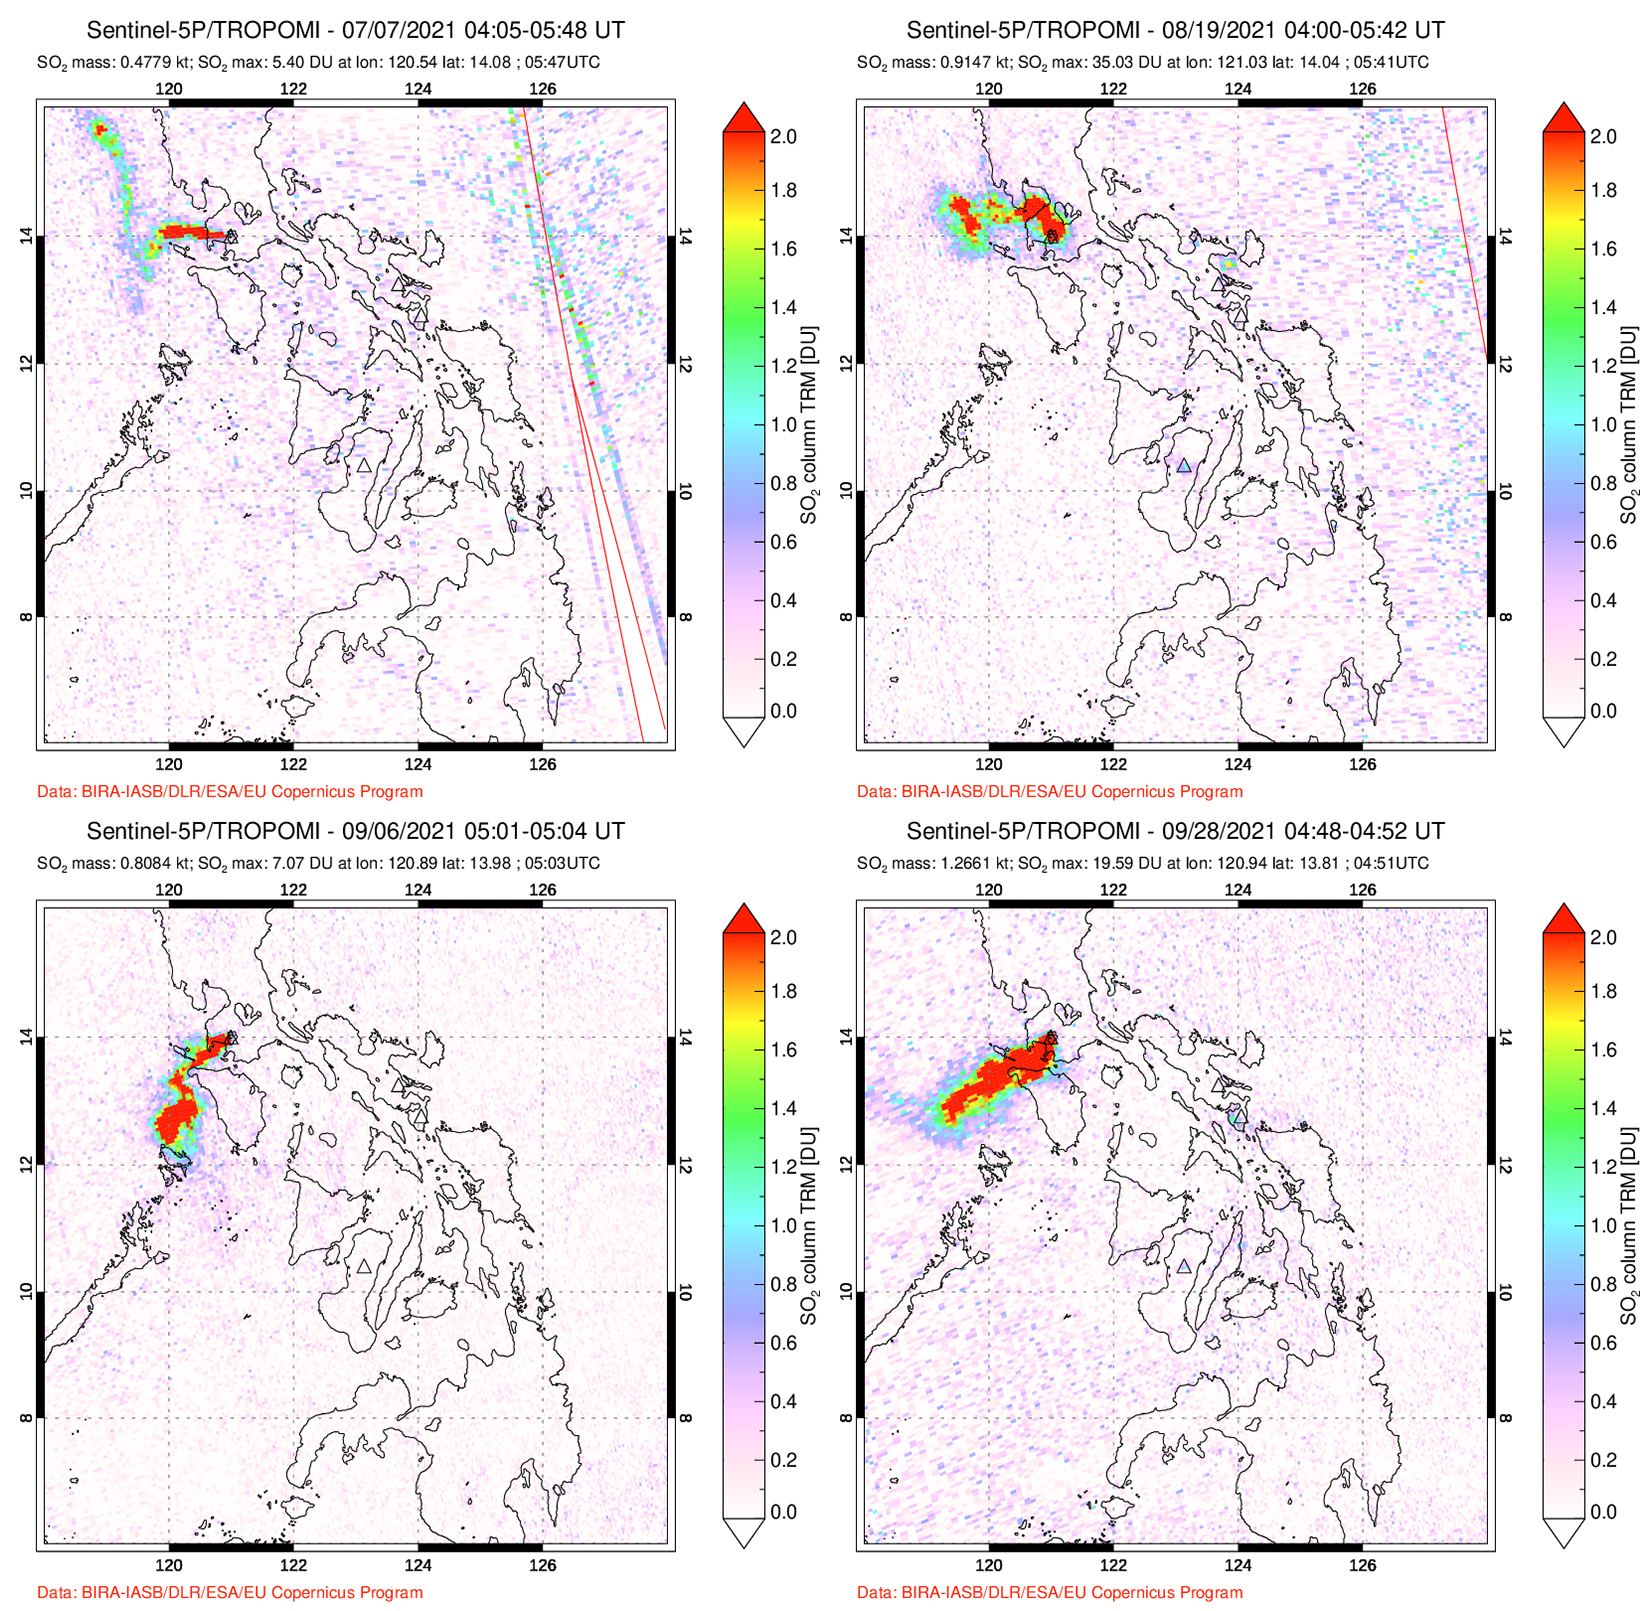 |
Figure 24. Strong sulfur dioxide plumes continued to rise from Taal on 7 June (top left), 19 August (top right), 6 September (bottom left), and 28 September (bottom right) 2021 that drifted in different directions, detected using the TROPOMI instrument on the Sentinel-5P satellite. The plumes shown here exceeded 2 Dobson Units (DUs). Courtesy of NASA Global Sulfur Dioxide Monitoring Page. |
MIROVA (Middle InfraRed Observation of Volcanic Activity) analysis of MODIS satellite data detected occasional low-power thermal anomalies during January 2020 through August 2021, though during September 2020 through July 2021 no anomalies were identified in the summit crater (figure 25).
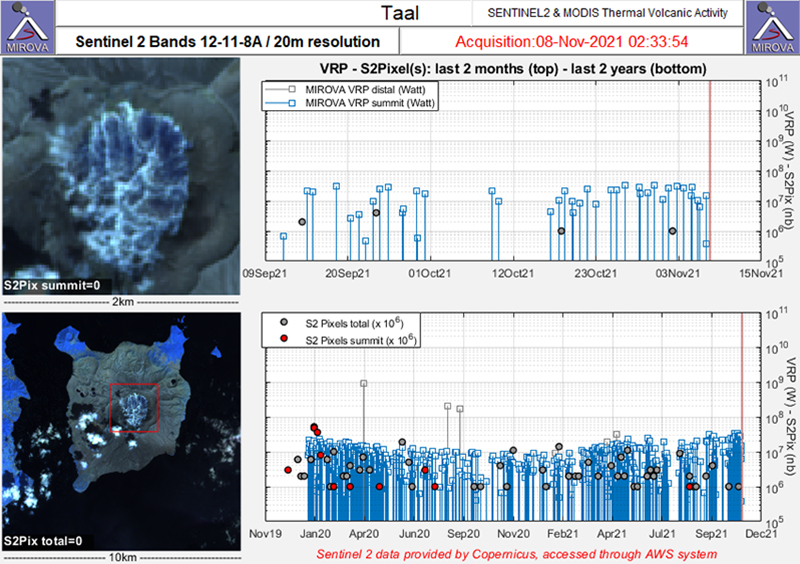 |
Figure 25. Occasional thermal anomalies (red dots) were detected at the summit of Taal during January 2020 through August 2021, as recorded by the Sentinel-2 MODIS Thermal Volcanic Activity data (bands 12, 11, 8A). During September 2020 through July 2021 no thermal anomalies were detected at the summit. Courtesy of MIROVA. |
Geological Summary. Taal is one of the most active volcanoes in the Philippines and has produced some powerful eruptions. The 15 x 20 km Talisay (Taal) caldera is largely filled by Lake Taal, whose 267 km2 surface lies only 3 m above sea level. The maximum depth of the lake is 160 m, with several submerged eruptive centers. The 5-km-wide Volcano Island in north-central Lake Taal is the location of all observed eruptions. The island is composed of coalescing small stratovolcanoes, tuff rings, and scoria cones. Powerful pyroclastic flows and surges have caused many fatalities.
Information Contacts: Philippine Institute of Volcanology and Seismology (PHIVOLCS), Department of Science and Technology, University of the Philippines Campus, Diliman, Quezon City, Philippines (URL: http://www.phivolcs.dost.gov.ph/); Philippine Coast Guard (PCG), National Headquarters Philippine Coast Guard 139 25th Street, Port Area, Manila 108, Philippines (URL: https://coastguard.gov.ph/); Disaster Response Operations Monitoring and Information Center (DROMIC), (URL: https://dromic.dswd.gov.ph/); MIROVA (Middle InfraRed Observation of Volcanic Activity), a collaborative project between the Universities of Turin and Florence (Italy) supported by the Centre for Volcanic Risk of the Italian Civil Protection Department (URL: http://www.mirovaweb.it/); NASA Global Sulfur Dioxide Monitoring Page, Atmospheric Chemistry and Dynamics Laboratory, NASA Goddard Space Flight Center (NASA/GSFC), 8800 Greenbelt Road, Goddard, Maryland, USA (URL: https://so2.gsfc.nasa.gov/).