Recently Published Bulletin Reports
Kadovar (Papua New Guinea) An ash plume and weak thermal anomaly during May 2023
San Miguel (El Salvador) Small gas-and-ash explosions during March and May 2023
Ebeko (Russia) Continued explosions, ash plumes, and ashfall during October 2022-May 2023
Home Reef (Tonga) Discolored plumes continued during November 2022-April 2023
Semisopochnoi (United States) Occasional explosions, ash deposits, and gas-and-steam plumes during December 2022-May 2023
Ambae (Vanuatu) New lava flow, ash plumes, and sulfur dioxide plumes during February-May 2023
Ibu (Indonesia) Daily ash explosions continue, along with thermal anomalies in the crater, October 2022-May 2023
Dukono (Indonesia) Continuing ash emissions, SO2 plumes, and thermal signals during October 2022-May 2023
Sabancaya (Peru) Explosions, gas-and-ash plumes, and thermal activity persist during November 2022-April 2023
Sheveluch (Russia) Significant explosions destroyed part of the lava-dome complex during April 2023
Bezymianny (Russia) Explosions, ash plumes, lava flows, and avalanches during November 2022-April 2023
Chikurachki (Russia) New explosive eruption during late January-early February 2023
Kadovar (Papua New Guinea) — June 2023  Cite this Report
Kadovar
Papua New Guinea
3.608°S, 144.588°E; summit elev. 365 m
All times are local (unless otherwise noted)
An ash plume and weak thermal anomaly during May 2023
Kadovar is a 2-km-wide island that is the emergent summit of a Bismarck Sea stratovolcano. It lies off the coast of New Guinea, about 25 km N of the mouth of the Sepik River. Prior to an eruption that began in 2018, a lava dome formed the high point of the volcano, filling an arcuate landslide scarp open to the S. Submarine debris-avalanche deposits occur to the S of the island. The current eruption began in January 2018 and has comprised lava effusion from vents at the summit and at the E coast; more recent activity has consisted of ash plumes, weak thermal activity, and gas-and-steam plumes (BGVN 48:02). This report covers activity during February through May 2023 using information from the Darwin Volcanic Ash Advisory Center (VAAC) and satellite data.
Activity during the reporting period was relatively low and mainly consisted of white gas-and-steam plumes that were visible in natural color satellite images on clear weather days (figure 67). According to a Darwin VAAC report, at 2040 on 6 May an ash plume rose to 4.6 km altitude and drifted W; by 2300 the plume had dissipated. MODIS satellite instruments using the MODVOLC thermal algorithm detected a single thermal hotspot on the SE side of the island on 7 May. Weak thermal activity was also detected in a satellite image on the E side of the island on 14 May, accompanied by a white gas-and-steam plume that drifted SE (figure 68).
Geologic Background. The 2-km-wide island of Kadovar is the emergent summit of a Bismarck Sea stratovolcano of Holocene age. It is part of the Schouten Islands, and lies off the coast of New Guinea, about 25 km N of the mouth of the Sepik River. Prior to an eruption that began in 2018, a lava dome formed the high point of the andesitic volcano, filling an arcuate landslide scarp open to the south; submarine debris-avalanche deposits occur in that direction. Thick lava flows with columnar jointing forms low cliffs along the coast. The youthful island lacks fringing or offshore reefs. A period of heightened thermal phenomena took place in 1976. An eruption began in January 2018 that included lava effusion from vents at the summit and at the E coast.
Information Contacts: Darwin Volcanic Ash Advisory Centre (VAAC), Bureau of Meteorology, Northern Territory Regional Office, PO Box 40050, Casuarina, NT 0811, Australia (URL: http://www.bom.gov.au/info/vaac/); Hawai'i Institute of Geophysics and Planetology (HIGP) - MODVOLC Thermal Alerts System, School of Ocean and Earth Science and Technology (SOEST), Univ. of Hawai'i, 2525 Correa Road, Honolulu, HI 96822, USA (URL: http://modis.higp.hawaii.edu/); Copernicus Browser, Copernicus Data Space Ecosystem, European Space Agency (URL: https://dataspace.copernicus.eu/browser/).
San Miguel (El Salvador) — June 2023 Cite this Report
San Miguel
El Salvador
13.434°N, 88.269°W; summit elev. 2130 m
All times are local (unless otherwise noted)
Small gas-and-ash explosions during March and May 2023
San Miguel in El Salvador is a broad, deep crater complex that has been frequently modified by eruptions recorded since the early 16th century and consists of the summit known locally as Chaparrastique. Flank eruptions have produced lava flows that extended to the N, NE, and SE during the 17-19th centuries. The most recent activity has consisted of minor ash eruptions from the summit crater. The current eruption period began in November 2022 and has been characterized by frequent phreatic explosions, gas-and-ash emissions, and sulfur dioxide plumes (BGVN 47:12). This report describes small gas-and-ash explosions during December 2022 through May 2023 based on special reports from the Ministero de Medio Ambiente y Recursos Naturales (MARN).
Activity has been relatively low since the last recorded explosions on 29 November 2022. Seismicity recorded by the San Miguel Volcano Station (VSM) located on the N flank at 1.7 km elevation had decreased by 7 December. Sulfur dioxide gas measurements taken with DOAS (Differential Optical Absorption Spectroscopy) mobile equipment were below typical previously recorded values: 300 tons per day (t/d). During December, small explosions were recorded by the seismic network and manifested as gas-and-steam emissions.
Gas-and-ash explosions in the crater occurred during January 2023, which were recorded by the seismic network. Sulfur dioxide values remained low, between 300-400 t/d through 10 March. At 0817 on 14 January a gas-and-ash emission was visible in webcam images, rising just above the crater rim. Some mornings during February, small gas-and-steam plumes were visible in the crater. On 7 March at 2252 MARN noted an increase in degassing from the central crater; gas emissions were constantly observed through the early morning hours on 8 March. During the early morning of 8 March through the afternoon on 9 March, 12 emissions were registered, some accompanied by ash. The last gas-and-ash emission was recorded at 1210 on 9 March; very fine ashfall was reported in El Tránsito (10 km S), La Morita (6 km W), and La Piedrita (3 km W). The smell of sulfur was reported in Piedra Azul (5 km SW). On 16 March MARN reported that gas-and-steam emissions decreased.
Low degassing and very low seismicity were reported during April; no explosions have been detected between 9 March and 27 May. The sulfur dioxide emissions remained between 350-400 t/d; during 13-20 April sulfur dioxide values fluctuated between 30-300 t/d. Activity remained low through most of May; on 23 May seismicity increased. An explosion was detected at 1647 on 27 May generated a gas-and-ash plume that rose 700 m high (figure 32); a decrease in seismicity and gas emissions followed. The DOAS station installed on the W flank recorded sulfur dioxide values that reached 400 t/d on 27 May; subsequent measurements showed a decrease to 268 t/d on 28 May and 100 t/d on 29 May.
Geologic Background. The symmetrical cone of San Miguel, one of the most active volcanoes in El Salvador, rises from near sea level to form one of the country's most prominent landmarks. A broad, deep, crater complex that has been frequently modified by eruptions recorded since the early 16th century caps the truncated unvegetated summit, also known locally as Chaparrastique. Flanks eruptions of the basaltic-andesitic volcano have produced many lava flows, including several during the 17th-19th centuries that extended to the N, NE, and SE. The SE-flank flows are the largest and form broad, sparsely vegetated lava fields crossed by highways and a railroad skirting the base of the volcano. Flank vent locations have migrated higher on the edifice during historical time, and the most recent activity has consisted of minor ash eruptions from the summit crater.
Information Contacts: Ministero de Medio Ambiente y Recursos Naturales (MARN), Km. 5½ Carretera a Nueva San Salvador, Avenida las Mercedes, San Salvador, El Salvador (URL: http://www.snet.gob.sv/ver/vulcanologia).
Ebeko
Russia
50.686°N, 156.014°E; summit elev. 1103 m
All times are local (unless otherwise noted)
Continued explosions, ash plumes, and ashfall during October 2022-May 2023
Ebeko, located on the N end of Paramushir Island in the Kuril Islands, consists of three summit craters along a SSW-NNE line at the northern end of a complex of five volcanic cones. Eruptions date back to the late 18th century and have been characterized as small-to-moderate explosions from the summit crater, accompanied by intense fumarolic activity. The current eruption period began in June 2022 and has recently consisted of frequent explosions, ash plumes, and thermal activity (BGVN 47:10). This report covers similar activity during October 2022 through May 2023, based on information from the Kamchatka Volcanic Eruptions Response Team (KVERT) and satellite data.
Activity during October consisted of explosive activity, ash plumes, and occasional thermal anomalies. Visual data by volcanologists from Severo-Kurilsk showed explosions producing ash clouds up to 2.1-3 km altitude which drifted E, N, NE, and SE during 1-8, 10, 16, and 18 October. KVERT issued several Volcano Observatory Notices for Aviation (VONA) on 7, 13-15, and 27 October 2022, stating that explosions generated ash plumes that rose to 2.3-4 km altitude and drifted 5 km E, NE, and SE. Ashfall was reported in Severo-Kurilsk (Paramushir Island, about 7 km E) on 7 and 13 October. Satellite data showed a thermal anomaly over the volcano on 15-16 October. Visual data showed ash plumes rising to 2.5-3.6 km altitude on 22, 25-29, and 31 October and moving NE due to constant explosions.
Similar activity continued during November, with explosions, ash plumes, and ashfall occurring. KVERT issued VONAs on 1-2, 4, 6-7, 9, 13, and 16 November that reported explosions and resulting ash plumes that rose to 1.7-3.6 km altitude and drifted 3-5 km SE, ESE, E, and NE. On 1 November ash plumes extended as far as 110 km SE. On 5, 8, 12, and 24-25 November explosions and ash plumes rose to 2-3.1 km altitude and drifted N and E. Ashfall was observed in Severo-Kurilsk on 7 and 16 November. A thermal anomaly was visible during 1-4, 16, and 20 November. Explosions during 26 November rose as high as 2.7 km altitude and drifted NE (figure 45).
Explosions and ash plumes continued to occur in December. During 1-2 and 4 December volcanologists from Severo-Kurilsk observed explosions that sent ash to 1.9-2.5 km altitude and drifted NE and SE (figure 46). VONAs were issued on 5, 9, and 16 December reporting that explosions generated ash plumes rising to 1.9 km, 2.6 km, and 2.4 km altitude and drifted 5 km SE, E, and NE, respectively. A thermal anomaly was visible in satellite imagery on 16 December. On 18 and 27-28 December explosions produced ash plumes that rose to 2.5 km altitude and drifted NE and SE. On 31 December an ash plume rose to 2 km altitude and drifted NE.
Explosions continued during January 2023, based on visual observations by volcanologists from Severo-Kurilsk. During 1-7 January explosions generated ash plumes that rose to 4 km altitude and drifted NE, E, W, and SE. According to VONAs issued by KVERT on 2, 4, 10, and 23 January, explosions produced ash plumes that rose to 2-4 km altitude and drifted 5 km N, NE, E, and ENE; the ash plume that rose to 4 km altitude occurred on 10 January (figure 47). Satellite data showed a thermal anomaly during 3-4, 10, 13, 16, 21, 22, and 31 January. KVERT reported that an ash cloud on 4 January moved 12 km NE. On 6 and 9-11 January explosions sent ash plumes to 4.5 km altitude and drifted W and ESE. On 13 January an ash plume rose to 3 km altitude and drifted SE. During 20-24 January ash plumes from explosions rose to 3.7 km altitude and drifted SE, N, and NE. On 21 January the ash plume drifted as far as 40 km NE. During 28-29 and 31 January and 1 February ash plumes rose to 4 km altitude and drifted NE.
During February, explosions, ash plumes, and ashfall were reported. During 1, 4-5 and 7-8 February explosions generated ash plumes that rose to 4.5 km altitude and drifted E and NE; ashfall was observed on 5 and 8 February. On 6 February an explosion produced an ash plume that rose to 3 km altitude and drifted 7 km E, causing ashfall in Severo-Kurilsk. A thermal anomaly was visible in satellite data on 8, 9, 13, and 21 February. Explosions on 9 and 12-13 February produced ash plumes that rose to 4 km altitude and drifted E and NE; the ash cloud on 12 February extended as far as 45 km E. On 22 February explosions sent ash to 3 km altitude that drifted E. During 24 and 26-27 February ash plumes rose to 4 km altitude and drifted E. On 28 February an explosion sent ash to 2.5-3 km altitude and drifted 5 km E; ashfall was observed in Severo-Kurilsk.
Activity continued during March; visual observations showed that explosions generated ash plumes that rose to 3.6 km altitude on 3, 5-7, and 9-12 March and drifted E, NE, and NW. Thermal anomalies were visible on 10, 13, and 29-30 March in satellite imagery. On 18, 21-23, 26, and 29-30 March explosions produced ash plumes that rose to 2.8 km altitude and drifted NE and E; the ash plumes during 22-23 March extended up to 76 km E. A VONA issued on 21 March reported an explosion that produced an ash plume that rose to 2.8 km altitude and drifted 5 km E. Another VONA issued on 23 March reported that satellite data showed an ash plume rising to 3 km altitude and drifted 14 km E.
Explosions during April continued to generate ash plumes. On 1 and 4 April an ash plume rose to 2.8-3.5 km altitude and drifted SE and NE. A thermal anomaly was visible in satellite imagery during 1-6 April. Satellite data showed ash plumes and clouds rising to 2-3 km altitude and drifting up to 12 km SW and E on 3 and 6 April (figure 48). KVERT issued VONAs on 3, 5, 14, 16 April describing explosions that produced ash plumes rising to 3 km, 3.5 km, 3.5 km, and 3 km altitude and drifting 5 km S, 5 km NE and SE, 72 km NNE, and 5 km NE, respectively. According to satellite data, the resulting ash cloud from the explosion on 14 April was 25 x 7 km in size and drifted 72-104 km NNE during 14-15 April. According to visual data by volcanologists from Severo-Kurilsk explosions sent ash up to 3.5 km altitude that drifted NE and E during 15-16, 22, 25-26, and 29 April.
The explosive eruption continued during May. Explosions during 3-4, 6-7, and 9-10 May generated ash plumes that rose to 4 km altitude and drifted SW and E. Satellite data showed a thermal anomaly on 3, 9, 13-14, and 24 May. During 12-16, 23-25, and 27-28 May ash plumes rose to 3.5 km altitude and drifted in different directions due to explosions. Two VONA notices were issued on 16 and 25 May, describing explosions that generated ash plumes rising to 3 km and 3.5 km altitude, respectively and extending 5 km E. The ash cloud on 25 May drifted 75 km SE.
Thermal activity in the summit crater, occasionally accompanied by ash plumes and ash deposits on the SE and E flanks due to frequent explosions, were visible in infrared and true color satellite images (figure 49).
Geologic Background. The flat-topped summit of the central cone of Ebeko volcano, one of the most active in the Kuril Islands, occupies the northern end of Paramushir Island. Three summit craters located along a SSW-NNE line form Ebeko volcano proper, at the northern end of a complex of five volcanic cones. Blocky lava flows extend west from Ebeko and SE from the neighboring Nezametnyi cone. The eastern part of the southern crater contains strong solfataras and a large boiling spring. The central crater is filled by a lake about 20 m deep whose shores are lined with steaming solfataras; the northern crater lies across a narrow, low barrier from the central crater and contains a small, cold crescentic lake. Historical activity, recorded since the late-18th century, has been restricted to small-to-moderate explosive eruptions from the summit craters. Intense fumarolic activity occurs in the summit craters, on the outer flanks of the cone, and in lateral explosion craters.
Information Contacts: Kamchatka Volcanic Eruptions Response Team (KVERT), Far Eastern Branch, Russian Academy of Sciences, 9 Piip Blvd., Petropavlovsk-Kamchatsky, 683006, Russia (URL: http://www.kscnet.ru/ivs/kvert/); MIROVA (Middle InfraRed Observation of Volcanic Activity), a collaborative project between the Universities of Turin and Florence (Italy) supported by the Centre for Volcanic Risk of the Italian Civil Protection Department (URL: http://www.mirovaweb.it/); Copernicus Browser, Copernicus Data Space Ecosystem, European Space Agency (URL: https://dataspace.copernicus.eu/browser/).
Home Reef
Tonga
18.992°S, 174.775°W; summit elev. -10 m
All times are local (unless otherwise noted)
Discolored plumes continued during November 2022-April 2023
Home Reef is a submarine volcano located in the central Tonga islands between Lateiki (Metis Shoal) and Late Island. The first recorded eruption occurred in the mid-19th century, when an ephemeral island formed. An eruption in 1984 produced a 12-km-high eruption plume, a large volume of floating pumice, and an ephemeral island 500 x 1,500 m wide, with cliffs 30-50 m high that enclosed a water-filled crater. Another island-forming eruption in 2006 produced widespread pumice rafts that drifted as far as Australia; by 2008 the island had eroded below sea level. The previous eruption occurred during October 2022 and was characterized by a new island-forming eruption, lava effusion, ash plumes, discolored water, and gas-and-steam plumes (BGVN 47:11). This report covers discolored water plumes during November 2022 through April 2023 using satellite data.
Discolored plumes continued during the reporting period and were observed in true color satellite images on clear weather days. Satellite images show light green-yellow discolored water extending W on 8 and 28 November 2022 (figure 31), and SW on 18 November. Light green-yellow plumes extended W on 3 December, S on 13 December, SW on 18 December, and W and S on 23 December (figure 31). On 12 January 2023 discolored green-yellow plumes extended to the NE, E, SE, and N. The plume moved SE on 17 January and NW on 22 January. Faint discolored water in February was visible moving NE on 1 February. A discolored plume extended NW on 8 and 28 March and NW on 13 March (figure 31). During April, clear weather showed green-blue discolored plumes moving S on 2 April, W on 7 April, and NE and S on 12 April. A strong green-yellow discolored plume extended E and NE on 22 April for several kilometers (figure 31).
Geologic Background. Home Reef, a submarine volcano midway between Metis Shoal and Late Island in the central Tonga islands, was first reported active in the mid-19th century, when an ephemeral island formed. An eruption in 1984 produced a 12-km-high eruption plume, large amounts of floating pumice, and an ephemeral 500 x 1,500 m island, with cliffs 30-50 m high that enclosed a water-filled crater. In 2006 an island-forming eruption produced widespread dacitic pumice rafts that drifted as far as Australia. Another island was built during a September-October 2022 eruption.
Information Contacts: Copernicus Browser, Copernicus Data Space Ecosystem, European Space Agency (URL: https://dataspace.copernicus.eu/browser/).
Semisopochnoi (United States) — June 2023 Cite this Report
Semisopochnoi
United States
51.93°N, 179.58°E; summit elev. 1221 m
All times are local (unless otherwise noted)
Occasional explosions, ash deposits, and gas-and-steam plumes during December 2022-May 2023
Semisopochnoi is located in the western Aleutians, is 20-km-wide at sea level, and contains an 8-km-wide caldera. The three-peaked Mount Young (formerly Cerberus) was constructed within the caldera during the Holocene. Each of these peaks contains a summit crater; the lava flows on the N flank appear younger than those on the S side. The current eruption period began in early February 2021 and has more recently consisted of intermittent explosions and ash emissions (BGVN 47:12). This report updates activity during December 2022 through May 2023 using daily, weekly, and special reports from the Alaska Volcano Observatory (AVO). AVO monitors the volcano using local seismic and infrasound sensors, satellite data, web cameras, and remote infrasound and lightning networks.
Activity during most of December 2022 was relatively quiet; according to AVO no eruptive or explosive activity was observed since 7 November 2022. Intermittent tremor and occasional small earthquakes were observed in geophysical data. Continuous gas-and-steam emissions were observed from the N crater of Mount Young in webcam images on clear weather days (figure 25). On 24 December, there was a slight increase in earthquake activity and several small possible explosion signals were detected in infrasound data. Eruptive activity resumed on 27 December at the N crater of Mount Young; AVO issued a Volcano Activity Notice (VAN) that reported minor ash deposits on the flanks of Mount Young that extended as far as 1 km from the vent, according to webcam images taken during 27-28 December (figure 26). No ash plumes were observed in webcam or satellite imagery, but a persistent gas-and-steam plume that might have contained some ash rose to 1.5 km altitude. As a result, AVO raised the Aviation Color Code (ACC) to Orange (the second highest level on a four-color scale) and the Volcano Alert Level (VAL) to Watch (the second highest level on a four-level scale). Possible explosions were detected during 21 December 2022 through 1 January 2023 and seismic tremor was recorded during 30-31 December.
During January 2023 eruptive activity continued at the active N crater of Mount Young. Minor ash deposits were observed on the flanks, extending about 2 km SSW, based on webcam images from 1 and 3 January. A possible explosion occurred during 1-2 January based on elevated seismicity recorded on local seismometers and an infrasound signal recorded minutes later by an array at Adak. Though no ash plumes were observed in webcam or satellite imagery, a persistent gas-and-steam plume rose to 1.5 km altitude that might have carried minor traces of ash. Ash deposits were accompanied by periods of elevated seismicity and infrasound signals from the local geophysical network, which AVO reported were likely due to weak explosive activity. Low-level explosive activity was also detected during 2-3 January, with minor gas-and-steam emissions and a new ash deposit that was visible in webcam images. Low-level explosive activity was detected in geophysical data during 4-5 January, with elevated seismicity and infrasound signals observed on local stations. Volcanic tremor was detected during 7-9 January and very weak explosive activity was detected in seismic and infrasound data on 9 January. Weak seismic and infrasound signals were recorded on 17 January, which indicated minor explosive activity, but no ash emissions were observed in clear webcam images; a gas-and-steam plume continued to rise to 1.5 km altitude. During 29-30 January, ash deposits near the summit were observed on fresh snow, according to webcam images.
The active N cone at Mount Young continued to produce a gas-and-steam plume during February, but no ash emissions or explosive events were detected. Seismicity remained elevated with faint tremor during early February. Gas-and-steam emissions from the N crater were observed in clear webcam images on 11-13 and 16 February; no explosive activity was detected in seismic, infrasound, or satellite data. Seismicity has also decreased, with no significant seismic tremor observed since 25 January. Therefore, the ACC was lowered to Yellow (the second lowest level on a four-color scale) and the VAL was lowered to Advisory (the second lowest level on a four-color scale) on 22 February.
Gas-and-steam emissions persisted during March from the N cone of Mount Young, based on clear webcam images. A few brief episodes of weak tremor were detected in seismic data, although seismicity decreased over the month. A gas-and-steam plume detected in satellite data extended 150 km on 18 March. Low-level ash emissions from the N cone at Mount Young were observed in several webcam images during 18-19 March, in addition to small explosions and volcanic tremor. The ACC was raised to Orange and the VAL increased to Watch on 19 March. A small explosion was detected in seismic and infrasound data on 21 March.
Low-level unrest continued during April, although cloudy weather often obscured views of the summit; periods of seismic tremor and local earthquakes were recorded. During 3-4 April a gas-and-steam plume was visible traveling more than 200 km overnight; no ash was evident in the plume, according to AVO. A gas-and-steam plume was observed during 4-6 April that extended 400 km but did not seem to contain ash. Small explosions were detected in seismic and infrasound data on 5 April. Occasional clear webcam images showed continuing gas-and-steam emissions rose from Mount Young, but no ash deposits were observed on the snow. On 19 April small explosions and tremor were detected in seismic and infrasound data. A period of seismic tremor was detected during 22-25 April, with possible weak explosions on 25 April. Ash deposits were visible near the crater rim, but it was unclear if these deposits were recent or due to older deposits.
Occasional small earthquakes were recorded during May, but there were no signs of explosive activity seen in geophysical data. Gas-and-steam emissions continued from the N crater of Mount Young, based on webcam images, and seismicity remained slightly elevated. A new, light ash deposit was visible during the morning of 5 May on fresh snow on the NW flank of Mount Young. During 10 May periods of volcanic tremor were observed. The ACC was lowered to Yellow and the VAL to Advisory on 17 May due to no additional evidence of activity.
Geologic Background. Semisopochnoi, the largest subaerial volcano of the western Aleutians, is 20 km wide at sea level and contains an 8-km-wide caldera. It formed as a result of collapse of a low-angle, dominantly basaltic volcano following the eruption of a large volume of dacitic pumice. The high point of the island is Anvil Peak, a double-peaked late-Pleistocene cone that forms much of the island's northern part. The three-peaked Mount Cerberus (renamed Mount Young in 2023) was constructed within the caldera during the Holocene. Each of the peaks contains a summit crater; lava flows on the N flank appear younger than those on the south side. Other post-caldera volcanoes include the symmetrical Sugarloaf Peak SSE of the caldera and Lakeshore Cone, a small cinder cone at the edge of Fenner Lake in the NE part of the caldera. Most documented eruptions have originated from Young, although Coats (1950) considered that both Sugarloaf and Lakeshore Cone could have been recently active.
Information Contacts: Alaska Volcano Observatory (AVO), a cooperative program of a) U.S. Geological Survey, 4200 University Drive, Anchorage, AK 99508-4667 USA (URL: https://avo.alaska.edu/), b) Geophysical Institute, University of Alaska, PO Box 757320, Fairbanks, AK 99775-7320, USA, and c) Alaska Division of Geological & Geophysical Surveys, 794 University Ave., Suite 200, Fairbanks, AK 99709, USA (URL: http://dggs.alaska.gov/).
Ambae
Vanuatu
15.389°S, 167.835°E; summit elev. 1496 m
All times are local (unless otherwise noted)
New lava flow, ash plumes, and sulfur dioxide plumes during February-May 2023
Ambae, also known as Aoba, is a large basaltic shield volcano in Vanuatu. A broad pyroclastic cone containing three crater lakes (Manaro Ngoru, Voui, and Manaro Lakua) is located at the summit within the youngest of at least two nested calderas. Periodic phreatic and pyroclastic explosions have been reported since the 16th century. A large eruption more than 400 years ago resulted in a volcanic cone within the summit crater that is now filled by Lake Voui; the similarly sized Lake Manaro fills the western third of the caldera. The previous eruption ended in August 2022 that was characterized by gas-and-steam and ash emissions and explosions of wet tephra (BGVN 47:10). This report covers a new eruption during February through May 2023 that consisted of a new lava flow, ash plumes, and sulfur dioxide emissions, using information from the Vanuatu Meteorology and Geo-Hazards Department (VMGD) and satellite data.
During the reporting period, the Alert Level remained at a 2 (on a scale of 0-5), which has been in place since December 2021. Activity during October 2022 through March 2023 remained relatively low and mostly consisted of gas-and-steam emissions in Lake Voui. VMGD reported that at 1300 on 15 November a satellite image captured a strong amount of sulfur dioxide rising above the volcano (figure 99), and that seismicity slightly increased. The southern and northern part of the island reported a strong sulfur dioxide smell and heard explosions. On 20 February 2023 a gas-and-ash plume rose 1.3 km above the summit and drifted SSW, according to a webcam image (figure 100). Gas-and-steam and possibly ash emissions continued on 23 February and volcanic earthquakes were recorded by the seismic network.
During April, volcanic earthquakes and gas-and-steam and ash emissions were reported from the cone in Lake Voui. VMGD reported that activity increased during 5-7 April; high gas-and-steam and ash plumes were visible, accompanied by nighttime incandescence. According to a Wellington VAAC report, a low-level ash plume rose as high as 2.5 km above the summit and drifted W and SW on 5 April, based on satellite imagery. Reports in Saratamata stated that a dark ash plume drifted to the WSW, but no loud explosion was heard. Webcam images from 2100 showed incandescence above the crater and reflected in the clouds. According to an aerial survey, field observations, and satellite data, water was no longer present in the lake. A lava flow was reported effusing from the vent and traveling N into the dry Lake Voui, which lasted three days. The next morning at 0745 on 6 April a gas-and-steam and ash plume rose 5.4 km above the summit and drifted ESE, based on information from VMGD (figure 101). The Wellington VAAC also reported that light ashfall was observed on the island. Intermittent gas-and-steam and ash emissions were visible on 7 April, some of which rose to an estimated 3 km above the summit and drifted E. Webcam images during 0107-0730 on 7 April showed continuing ash emissions. A gas-and-steam and ash plume rose 695 m above the summit crater at 0730 on 19 April and drifted ESE, based on a webcam image (figure 102).
According to visual and infrared satellite data, water was visible in Lake Voui as late as 24 March 2023 (figure 103). The vent in the caldera showed a gas-and-steam plume drifted SE. On 3 April thermal activity was first detected, accompanied by a gas-and-ash plume that drifted W (figure 103). The lava flow moved N within the dry lake and was shown cooling by 8 April. By 23 April much of the water in the lake had returned. Occasional sulfur dioxide plumes were detected by the TROPOMI instrument on the Sentinel-5P satellite that exceeded 2 Dobson Units (DU) and drifted in different directions (figure 104).
Geologic Background. The island of Ambae, also known as Aoba, is a massive 2,500 km3 basaltic shield that is the most voluminous volcano of the New Hebrides archipelago. A pronounced NE-SW-trending rift zone with numerous scoria cones gives the 16 x 38 km island an elongated form. A broad pyroclastic cone containing three crater lakes (Manaro Ngoru, Voui, and Manaro Lakua) is located at the summit within the youngest of at least two nested calderas, the largest of which is 6 km in diameter. That large central edifice is also called Manaro Voui or Lombenben volcano. Post-caldera explosive eruptions formed the summit craters about 360 years ago. A tuff cone was constructed within Lake Voui (or Vui) about 60 years later. The latest known flank eruption, about 300 years ago, destroyed the population of the Nduindui area near the western coast.
Information Contacts: Geo-Hazards Division, Vanuatu Meteorology and Geo-Hazards Department (VMGD), Ministry of Climate Change Adaptation, Meteorology, Geo-Hazards, Energy, Environment and Disaster Management, Private Mail Bag 9054, Lini Highway, Port Vila, Vanuatu (URL: http://www.vmgd.gov.vu/, https://www.facebook.com/VanuatuGeohazardsObservatory/); Wellington Volcanic Ash Advisory Centre (VAAC), Meteorological Service of New Zealand Ltd (MetService), PO Box 722, Wellington, New Zealand (URL: http://www.metservice.com/vaac/, http://www.ssd.noaa.gov/VAAC/OTH/NZ/messages.html); MIROVA (Middle InfraRed Observation of Volcanic Activity), a collaborative project between the Universities of Turin and Florence (Italy) supported by the Centre for Volcanic Risk of the Italian Civil Protection Department (URL: http://www.mirovaweb.it/); Global Sulfur Dioxide Monitoring Page, Atmospheric Chemistry and Dynamics Laboratory, NASA Goddard Space Flight Center (NASA/GSFC), 8800 Greenbelt Road, Goddard, Maryland, USA (URL: https://so2.gsfc.nasa.gov/); Copernicus Browser, Copernicus Data Space Ecosystem, European Space Agency (URL: https://dataspace.copernicus.eu/browser/).
Ibu
Indonesia
1.488°N, 127.63°E; summit elev. 1325 m
All times are local (unless otherwise noted)
Daily ash explosions continue, along with thermal anomalies in the crater, October 2022-May 2023
Persistent eruptive activity since April 2008 at Ibu, a stratovolcano on Indonesian’s Halmahera Island, has consisted of daily explosive ash emissions and plumes, along with observations of thermal anomalies (BGVN 47:04). The current eruption continued during October 2022-May 2023, described below, based on advisories issued by the Pusat Vulkanologi dan Mitigasi Bencana Geologi (PVMBG, also known as Indonesian Center for Volcanology and Geological Hazard Mitigation, CVGHM), daily reports by MAGMA Indonesia (a PVMBG platform), and the Darwin Volcanic Ash Advisory Centre (VAAC), and various satellite data. The Alert Level during the reporting period remained at 2 (on a scale of 1-4), except raised briefly to 3 on 27 May, and the public was warned to stay at least 2 km away from the active crater and 3.5 km away on the N side of the volcano.
According to MAGMA Indonesia, during October 2022-May 2023, daily gray-and-white ash plumes of variable densities rose 200-1,000 m above the summit and drifted in multiple directions. On 30 October and 11 November, plumes rose a maximum of 2 km and 1.5 km above the summit, respectively (figures 42 and 43). According to the Darwin VAAC, discrete ash emissions on 13 November rose to 2.1 km altitude, or 800 m above the summit, and drifted W, and multiple ash emissions on 15 November rose 1.4 km above the summit and drifted NE. Occasional larger ash explosions through May 2023 prompted PVMBG to issue Volcano Observatory Notice for Aviation (VONA) alerts (table 6); the Aviation Color Code remained at Orange throughout this period.
Table 6. Volcano Observatory Notice for Aviation (VONA) ash plume alerts for Ibu issued by PVMBG during October 2022-May 2023. Maximum height above the summit was estimated by a ground observer. VONAs in January-May 2023 all described the ash plumes as dense.
| Date |
Time (local) |
Max height above summit |
Direction |
| 17 Oct 2022 |
0858 |
800 m |
SW |
| 18 Oct 2022 |
1425 |
800 m |
S |
| 19 Oct 2022 |
2017 |
600 m |
SW |
| 21 Oct 2022 |
0916 |
800 m |
NW |
| 16 Jan 2023 |
1959 |
600 m |
NE |
| 22 Jan 2023 |
0942 |
1,000 m |
E |
| 29 Jan 2023 |
2138 |
1,000 m |
E |
| 10 May 2023 |
0940 |
800 m |
NW |
| 10 May 2023 |
2035 |
600 m |
E |
| 21 May 2023 |
2021 |
600 m |
W |
| 21 May 2023 |
2140 |
1,000 m |
W |
| 29 May 2023 |
1342 |
800 m |
N |
| 31 May 2023 |
1011 |
1,000 m |
SW |
Sentinel-2 L1C satellite images throughout the reporting period show two, sometimes three persistent thermal anomalies in the summit crater, with the most prominent hotspot from the top of a cone within the crater. Clear views were more common during March-April 2023, when a vent and lava flows on the NE flank of the intra-crater cone could be distinguished (figure 44). White-to-grayish emissions were also observed during brief periods when weather clouds allowed clear views.
The MIROVA space-based volcano hotspot detection system recorded almost daily thermal anomalies throughout the reporting period, though cloud cover often interfered with detections. Data from imaging spectroradiometers aboard NASA’s Aqua and Terra satellites and processed using the MODVOLC algorithm (MODIS-MODVOLC) recorded hotspots on one day during October 2022 and December 2022, two days in April 2023, three days in November 2022 and May 2023, and four days in March 2023.
Geologic Background. The truncated summit of Gunung Ibu stratovolcano along the NW coast of Halmahera Island has large nested summit craters. The inner crater, 1 km wide and 400 m deep, has contained several small crater lakes. The 1.2-km-wide outer crater is breached on the N, creating a steep-walled valley. A large cone grew ENE of the summit, and a smaller one to the WSW has fed a lava flow down the W flank. A group of maars is located below the N and W flanks. The first observed and recorded eruption was a small explosion from the summit crater in 1911. Eruptive activity began again in December 1998, producing a lava dome that eventually covered much of the floor of the inner summit crater along with ongoing explosive ash emissions.
Information Contacts: Pusat Vulkanologi dan Mitigasi Bencana Geologi (PVMBG, also known as Indonesian Center for Volcanology and Geological Hazard Mitigation, CVGHM), Jalan Diponegoro 57, Bandung 40122, Indonesia (URL: http://www.vsi.esdm.go.id/); MAGMA Indonesia (Multiplatform Application for Geohazard Mitigation and Assessment in Indonesia), Kementerian Energi dan Sumber Daya Mineral (URL: https://magma.esdm.go.id/v1); Copernicus Browser, Copernicus Data Space Ecosystem, European Space Agency (URL: https://dataspace.copernicus.eu/browser/); MIROVA (Middle InfraRed Observation of Volcanic Activity), a collaborative project between the Universities of Turin and Florence (Italy) supported by the Centre for Volcanic Risk of the Italian Civil Protection Department (URL: http://www.mirovaweb.it/); Hawai'i Institute of Geophysics and Planetology (HIGP) - MODVOLC Thermal Alerts System, School of Ocean and Earth Science and Technology (SOEST), Univ. of Hawai'i, 2525 Correa Road, Honolulu, HI 96822, USA (URL: http://modis.higp.hawaii.edu/).
Dukono
Indonesia
1.6992°N, 127.8783°E; summit elev. 1273 m
All times are local (unless otherwise noted)
Continuing ash emissions, SO2 plumes, and thermal signals during October 2022-May 2023
Dukono, a remote volcano on Indonesia’s Halmahera Island, has been erupting continuously since 1933, with frequent ash explosions and sulfur dioxide plumes (BGVN 46:11, 47:10). This activity continued during October 2022 through May 2023, based on reports from the Pusat Vulkanologi dan Mitigasi Bencana Geologi (PVMBG; also known as Indonesian Center for Volcanology and Geological Hazard Mitigation, CVGHM), the Darwin Volcanic Ash Advisory Centre (VAAC), and satellite data. During this period, the Alert Level remained at 2 (on a scale of 1-4) and the public was warned to remain outside of the 2-km exclusion zone. The highest reported plume of the period reached 9.4 km above the summit on 14 November 2022.
According to MAGMA Indonesia (a platform developed by PVMBG), white, gray, or dark plumes of variable densities were observed almost every day during the reporting period, except when fog obscured the volcano (figure 33). Plumes generally rose 25-450 m above the summit, but rose as high as 700-800 m on several days, somewhat lower than the maximum heights reached earlier in 2022 when plumes reached as high as 1 km. However, the Darwin VAAC reported that on 14 November 2022, a discrete ash plume rose 9.4 km above the summit (10.7 km altitude), accompanied by a strong hotspot and a sulfur dioxide signal observed in satellite imagery; a continuous ash plume that day and through the 15th rose to 2.1-2.4 km altitude and drifted NE.
Sentinel-2 images were obscured by weather clouds almost every viewing day during the reporting period. However, the few reasonably clear images showed a hotspot and white or gray emissions and plumes. Strong SO2 plumes from Dukono were present on many days during October 2022-May 2023, as detected using the TROPOMI instrument on the Sentinel-5P satellite (figure 34).
Geologic Background. Reports from this remote volcano in northernmost Halmahera are rare, but Dukono has been one of Indonesia's most active volcanoes. More-or-less continuous explosive eruptions, sometimes accompanied by lava flows, have occurred since 1933. During a major eruption in 1550 CE, a lava flow filled in the strait between Halmahera and the N-flank Gunung Mamuya cone. This complex volcano presents a broad, low profile with multiple summit peaks and overlapping craters. Malupang Wariang, 1 km SW of the summit crater complex, contains a 700 x 570 m crater that has also been active during historical time.
Information Contacts: Pusat Vulkanologi dan Mitigasi Bencana Geologi (PVMBG, also known as Indonesian Center for Volcanology and Geological Hazard Mitigation, CVGHM), Jalan Diponegoro 57, Bandung 40122, Indonesia (URL: http://www.vsi.esdm.go.id/); MAGMA Indonesia (Multiplatform Application for Geohazard Mitigation and Assessment in Indonesia), Kementerian Energi dan Sumber Daya Mineral (URL: https://magma.esdm.go.id/v1); Darwin Volcanic Ash Advisory Centre (VAAC), Bureau of Meteorology, Northern Territory Regional Office, PO Box 40050, Casuarina, NT 0811, Australia (URL: http://www.bom.gov.au/info/vaac/); NASA Global Sulfur Dioxide Monitoring Page, Atmospheric Chemistry and Dynamics Laboratory, NASA Goddard Space Flight Center (NASA/GSFC), 8800 Greenbelt Road, Goddard, Maryland, USA (URL: https://so2.gsfc.nasa.gov/); Sentinel Hub Playground (URL: https://www.sentinel-hub.com/explore/sentinel-playground).
Sabancaya
Peru
15.787°S, 71.857°W; summit elev. 5960 m
All times are local (unless otherwise noted)
Explosions, gas-and-ash plumes, and thermal activity persist during November 2022-April 2023
Sabancaya is located in Peru, NE of Ampato and SE of Hualca Hualca. Eruptions date back to 1750 and have been characterized by explosions, phreatic activity, ash plumes, and ashfall. The current eruption period began in November 2016 and has more recently consisted of daily explosions, gas-and-ash plumes, and thermal activity (BGVN 47:11). This report updates activity during November 2022 through April 2023 using information from Instituto Geophysico del Peru (IGP) that use weekly activity reports and various satellite data.
Intermittent low-to-moderate power thermal anomalies were reported by the MIROVA project during November 2022 through April 2023 (figure 119). There were few short gaps in thermal activity during mid-December 2022, late December-to-early January 2023, late January to mid-February, and late February. According to data recorded by the MODVOLC thermal algorithm, there were a total of eight thermal hotspots: three in November 2022, three in February 2023, one in March, and one in April. On clear weather days, some of this thermal anomaly was visible in infrared satellite imagery showing the active lava dome in the summit crater (figure 120). Almost daily moderate-to-strong sulfur dioxide plumes were recorded during the reporting period by the TROPOMI instrument on the Sentinel-5P satellite (figure 121). Many of these plumes exceeded 2 Dobson Units (DU) and drifted in multiple directions.
IGP reported that moderate activity during November and December 2022 continued; during November, an average number of explosions were reported each week: 30, 33, 36, and 35, and during December, it was 32, 40, 47, 52, and 67. Gas-and-ash plumes in November rose 3-3.5 km above the summit and drifted E, NE, SE, S, N, W, and SW. During December the gas-and-ash plumes rose 2-4 km above the summit and drifted in different directions. There were 1,259 volcanic earthquakes recorded during November and 1,693 during December. Seismicity also included volcano-tectonic-type events that indicate rock fracturing events. Slight inflation was observed in the N part of the volcano near Hualca Hualca (4 km N). Thermal activity was frequently reported in the crater at the active lava dome (figure 120).
Explosive activity continued during January and February 2023. The average number of explosions were reported each week during January (51, 50, 60, and 59) and February (43, 54, 51, and 50). Gas-and-ash plumes rose 1.6-2.9 km above the summit and drifted NW, SW, and W during January and rose 1.4-2.8 above the summit and drifted W, SW, E, SE, N, S, NW, and NE during February. IGP also detected 1,881 volcanic earthquakes during January and 1,661 during February. VT-type earthquakes were also reported. Minor inflation persisted near Hualca Hualca. Satellite imagery showed continuous thermal activity in the crater at the lava dome (figure 120).
During March, the average number of explosions each week was 46, 48, 31, 35, and 22 and during April, it was 29, 41, 31, and 27. Accompanying gas-and-ash plumes rose 1.7-2.6 km above the summit crater and drifted W, SW, NW, S, and SE during March. According to a Buenos Aires Volcano Ash Advisory Center (VAAC) notice, on 22 March at 1800 through 23 March an ash plume rose to 7 km altitude and drifted NW. By 0430 an ash plume rose to 7.6 km altitude and drifted W. On 24 and 26 March continuous ash emissions rose to 7.3 km altitude and drifted SW and on 28 March ash emissions rose to 7.6 km altitude. During April, gas-and-ash plumes rose 1.6-2.5 km above the summit and drifted W, SW, S, NW, NE, and E. Frequent volcanic earthquakes were recorded, with 1,828 in March and 1,077 in April, in addition to VT-type events. Thermal activity continued to be reported in the summit crater at the lava dome (figure 120).
Geologic Background. Sabancaya, located in the saddle NE of Ampato and SE of Hualca Hualca volcanoes, is the youngest of these volcanic centers and the only one to have erupted in historical time. The oldest of the three, Nevado Hualca Hualca, is of probable late-Pliocene to early Pleistocene age. The name Sabancaya (meaning "tongue of fire" in the Quechua language) first appeared in records in 1595 CE, suggesting activity prior to that date. Holocene activity has consisted of Plinian eruptions followed by emission of voluminous andesitic and dacitic lava flows, which form an extensive apron around the volcano on all sides but the south. Records of historical eruptions date back to 1750.
Information Contacts: Instituto Geofisico del Peru (IGP), Centro Vulcanológico Nacional (CENVUL), Calle Badajoz N° 169 Urb. Mayorazgo IV Etapa, Ate, Lima 15012, Perú (URL: https://www.igp.gob.pe/servicios/centro-vulcanologico-nacional/inicio); Buenos Aires Volcanic Ash Advisory Center (VAAC), Servicio Meteorológico Nacional-Fuerza Aérea Argentina, 25 de mayo 658, Buenos Aires, Argentina (URL: http://www.smn.gov.ar/vaac/buenosaires/inicio.php); MIROVA (Middle InfraRed Observation of Volcanic Activity), a collaborative project between the Universities of Turin and Florence (Italy) supported by the Centre for Volcanic Risk of the Italian Civil Protection Department (URL: http://www.mirovaweb.it/); Hawai'i Institute of Geophysics and Planetology (HIGP) - MODVOLC Thermal Alerts System, School of Ocean and Earth Science and Technology (SOEST), Univ. of Hawai'i, 2525 Correa Road, Honolulu, HI 96822, USA (URL: http://modis.higp.hawaii.edu/); NASA Global Sulfur Dioxide Monitoring Page, Atmospheric Chemistry and Dynamics Laboratory, NASA Goddard Space Flight Center (NASA/GSFC), 8800 Greenbelt Road, Goddard MD 20771, USA (URL: https://so2.gsfc.nasa.gov/); Copernicus Browser, Copernicus Data Space Ecosystem, European Space Agency (URL: https://dataspace.copernicus.eu/browser/).
Sheveluch
Russia
56.653°N, 161.36°E; summit elev. 3283 m
All times are local (unless otherwise noted)
Significant explosions destroyed part of the lava-dome complex during April 2023
Sheveluch (also spelled Shiveluch) in Kamchatka, has had at least 60 large eruptions during the last 10,000 years. The summit is truncated by a broad 9-km-wide caldera that is breached to the S, and many lava domes occur on the outer flanks. The lava dome complex was constructed within the large open caldera. Frequent collapses of the dome complex have produced debris avalanches; the resulting deposits cover much of the caldera floor. A major south-flank collapse during a 1964 Plinian explosion produced a scarp in which a “Young Sheveluch” dome began to form in 1980. Repeated episodes of dome formation and destruction since then have produced major and minor ash plumes, pyroclastic flows, block-and-ash flows, and “whaleback domes” of spine-like extrusions in 1993 and 2020 (BGVN 45:11). The current eruption period began in August 1999 and has more recently consisted of lava dome growth, explosions, ash plumes, and avalanches (BGVN 48:01). This report covers a significant explosive eruption during early-to-mid-April 2023 that generated a 20 km altitude ash plume, produced a strong sulfur dioxide plume, and destroyed part of the lava-dome complex; activity described during January through April 2023 use information primarily from the Kamchatka Volcanic Eruptions Response Team (KVERT) and various satellite data.
Satellite data. Activity during the majority of this reporting period was characterized by continued lava dome growth, strong fumarole activity, explosions, and hot avalanches. According to the MODVOLC Thermal Alerts System, 140 hotspots were detected through the reporting period, with 33 recorded in January 2023, 29 in February, 44 in March, and 34 in April. Frequent strong thermal activity was recorded during January 2023 through April, according to the MIROVA (Middle InfraRed Observation of Volcanic Activity) graph and resulted from the continuously growing lava dome (figure 94). A slightly stronger pulse in thermal activity was detected in early-to-mid-April, which represented the significant eruption that destroyed part of the lava-dome complex. Thermal anomalies were also visible in infrared satellite imagery at the summit crater (figure 95).
During January 2023 KVERT reported continued growth of the lava dome, accompanied by strong fumarolic activity, incandescence from the lava dome, explosions, ash plumes, and avalanches. Satellite data showed a daily thermal anomaly over the volcano. Video data showed ash plumes associated with collapses at the dome that generated avalanches that in turn produced ash plumes rising to 3.5 km altitude and drifting 40 km W on 4 January and rising to 7-7.5 km altitude and drifting 15 km SW on 5 January. A gas-and-steam plume containing some ash that was associated with avalanches rose to 5-6 km altitude and extended 52-92 km W on 7 January. Explosions that same day produced ash plumes that rose to 7-7.5 km altitude and drifted 10 km W. According to a Volcano Observatory Notice for Aviation (VONA) issued at 1344 on 19 January, explosions produced an ash cloud that was 15 x 25 km in size and rose to 9.6-10 km altitude, drifting 21-25 km W; as a result, the Aviation Color Code (ACC) was raised to Red (the highest level on a four-color scale). Another VONA issued at 1635 reported that no more ash plumes were observed, and the ACC was lowered to Orange (the second highest level on a four-color scale). On 22 January an ash plume from collapses and avalanches rose to 5 km altitude and drifted 25 km NE and SW; ash plumes associated with collapses extended 70 km NE on 27 and 31 January.
Lava dome growth, fumarolic activity, dome incandescence, and occasional explosions and avalanches continued during February and March. A daily thermal anomaly was visible in satellite data. Explosions on 1 February generated ash plumes that rose to 6.3-6.5 km altitude and extended 15 km NE. Video data showed an ash cloud from avalanches rising to 5.5 km altitude and drifting 5 km SE on 2 February. Satellite data showed gas-and-steam plumes containing some ash rose to 5-5.5 km altitude and drifted 68-110 km ENE and NE on 6 February, to 4.5-5 km altitude and drifted 35 km WNW on 22 February, and to 3.7-4 km altitude and drifted 47 km NE on 28 February. Scientists from the Kamchatka Volcanological Station (KVS) went on a field excursion on 25 February to document the growing lava dome, and although it was cloudy most of the day, nighttime incandescence was visible. Satellite data showed an ash plume extending up to 118 km E during 4-5 March. Video data from 1150 showed an ash cloud from avalanches rose to 3.7-5.5 km altitude and drifted 5-10 km ENE and E on 5 March. On 11 March an ash plume drifted 62 km E. On 27 March ash plumes rose to 3.5 km altitude and drifted 100 km E. Avalanches and constant incandescence at the lava dome was focused on the E and NE slopes on 28 March. A gas-and-steam plume containing some ash rose to 3.5 km altitude and moved 40 km E on 29 March. Ash plumes on 30 March rose to 3.5-3.7 km altitude and drifted 70 km NE.
Similar activity continued during April, with lava dome growth, strong fumarolic activity, incandescence in the dome, occasional explosions, and avalanches. A thermal anomaly persisted throughout the month. During 1-4 April weak ash plumes rose to 2.5-3 km altitude and extended 13-65 km SE and E.
Activity during 11 April 2023. The Institute of Volcanology and Seismology, Far Eastern Branch, Russian Academy of Sciences (IVS FEB RAS) reported a significant increase in seismicity around 0054 on 11 April, as reported by strong explosions detected on 11 April beginning at 0110 that sent ash plumes up to 7-10 km altitude and extended 100-435 km W, WNW, NNW, WSW, and SW. According to a Tokyo VAAC report the ash plume rose to 15.8 km altitude. By 0158 the plume extended over a 75 x 100 km area. According to an IVS FEB RAS report, the eruptive column was not vertical: the initial plume at 0120 on 11 April deviated to the NNE, at 0000 on 12 April, it drifted NW, and by 1900 it drifted SW. KVS reported that significant pulses of activity occurred at around 0200, 0320, and then a stronger phase around 0600. Levin Dmitry took a video from near Békés (3 km away) at around 0600 showing a rising plume; he also reported that a pyroclastic flow traveled across the road behind him as he left the area. According to IVS FEB RAS, the pyroclastic flow traveled several kilometers SSE, stopping a few hundred meters from a bridge on the road between Klyuchi and Petropavlovsk-Kamchatsky.
Ashfall was first observed in Klyuchi (45 km SW) at 0630, and a large, black ash plume blocked light by 0700. At 0729 KVERT issued a Volcano Observatory Notice for Aviation (VONA) raising the Aviation Color Code to Red (the highest level on a four-color scale). It also stated that a large ash plume had risen to 10 km altitude and drifted 100 km W. Near-constant lightning strikes were reported in the plume and sounds like thunderclaps were heard until about 1000. According to IVS FEB RAS the cloud was 200 km long and 76 km wide by 0830, and was spreading W at altitudes of 6-12 km. In the Klyuchi Village, the layer of both ash and snow reached 8.5 cm (figure 96); ashfall was also reported in Kozyrevsk (112 km SW) at 0930, Mayskoye, Anavgay, Atlasovo, Lazo, and Esso. Residents in Klyuchi reported continued darkness and ashfall at 1100. In some areas, ashfall was 6 cm deep and some residents reported dirty water coming from their plumbing. According to IVS FEB RAS, an ash cloud at 1150 rose to 5-20 km altitude and was 400 km long and 250 km wide, extending W. A VONA issued at 1155 reported that ash had risen to 10 km and drifted 340 km NNW and 240 km WSW. According to Simon Carn (Michigan Technological University), about 0.2 Tg of sulfur dioxide in the plume was measured in a satellite image from the TROPOMI instrument on the Sentinel-5P satellite acquired at 1343 that covered an area of about 189,000 km2 (figure 97). Satellite data at 1748 showed an ash plume that rose to 8 km altitude and drifted 430 km WSW and S, according to a VONA.
Activity during 12-15 April 2023. On 12 April at 0730 satellite images showed ash plumes rose to 7-8 km altitude and extended 600 km SW, 1,050 km ESE, and 1,300-3,000 km E. By 1710 that day, the explosions weakened. According to news sources, the ash-and-gas plumes drifted E toward the Aleutian Islands and reached the Gulf of Alaska by 13 April, causing flight disruptions. More than 100 flights involving Alaska airspace were cancelled due to the plume. Satellite data showed ash plumes rising to 4-5.5 km altitude and drifted 400-415 km SE and ESE on 13 April. KVS volcanologists observed the pyroclastic flow deposits and noted that steam rose from downed, smoldering trees. They also noted that the deposits were thin with very few large fragments, which differed from previous flows. The ash clouds traveled across the Pacific Ocean. Flight cancellations were also reported in NW Canada (British Columbia) during 13-14 April. During 14-15 April ash plumes rose to 6 km altitude and drifted 700 km NW.
Alaskan flight schedules were mostly back to normal by 15 April, with only minor delays and far less cancellations; a few cancellations continued to be reported in Canada. Clear weather on 15 April showed that most of the previous lava-dome complex was gone and a new crater roughly 1 km in diameter was observed (figure 98); gas-and-steam emissions were rising from this crater. Evidence suggested that there had been a directed blast to the SE, and pyroclastic flows traveled more than 20 km. An ash plume rose to 4.5-5.2 km altitude and drifted 93-870 km NW on 15 April.
Activity during 16-30 April 2023. Resuspended ash was lifted by the wind from the slopes and rose to 4 km altitude and drifted 224 km NW on 17 April. KVERT reported a plume of resuspended ash from the activity during 10-13 April on 19 April that rose to 3.5-4 km altitude and drifted 146-204 km WNW. During 21-22 April a plume stretched over the Scandinavian Peninsula. A gas-and-steam plume containing some ash rose to 3-3.5 km altitude and drifted 60 km SE on 30 April. A possible new lava dome was visible on the W slope of the volcano on 29-30 April (figure 99); satellite data showed two thermal anomalies, a bright one over the existing lava dome and a weaker one over the possible new one.
References. Girina, O., Loupian, E., Horvath, A., Melnikov, D., Manevich, A., Nuzhdaev, A., Bril, A., Ozerov, A., Kramareva, L., Sorokin, A., 2023, Analysis of the development of the paroxysmal eruption of Sheveluch volcano on April 10–13, 2023, based on data from various satellite systems, ??????????? ???????? ??? ?? ???????, 20(2).
Geologic Background. The high, isolated massif of Sheveluch volcano (also spelled Shiveluch) rises above the lowlands NNE of the Kliuchevskaya volcano group. The 1,300 km3 andesitic volcano is one of Kamchatka's largest and most active volcanic structures, with at least 60 large eruptions during the Holocene. The summit of roughly 65,000-year-old Stary Shiveluch is truncated by a broad 9-km-wide late-Pleistocene caldera breached to the south. Many lava domes occur on its outer flanks. The Molodoy Shiveluch lava dome complex was constructed during the Holocene within the large open caldera; Holocene lava dome extrusion also took place on the flanks of Stary Shiveluch. Widespread tephra layers from these eruptions have provided valuable time markers for dating volcanic events in Kamchatka. Frequent collapses of dome complexes, most recently in 1964, have produced debris avalanches whose deposits cover much of the floor of the breached caldera.
Information Contacts: Kamchatka Volcanic Eruptions Response Team (KVERT), Far Eastern Branch, Russian Academy of Sciences, 9 Piip Blvd., Petropavlovsk-Kamchatsky, 683006, Russia (URL: http://www.kscnet.ru/ivs/kvert/); Institute of Volcanology and Seismology, Far Eastern Branch, Russian Academy of Sciences (IVS FEB RAS), 9 Piip Blvd., Petropavlovsk-Kamchatsky 683006, Russia (URL: http://www.kscnet.ru/ivs/eng/); Kamchatka Volcanological Station, Kamchatka Branch of Geophysical Survey, (KB GS RAS), Klyuchi, Kamchatka Krai, Russia (URL: http://volkstat.ru/); Hawai'i Institute of Geophysics and Planetology (HIGP) - MODVOLC Thermal Alerts System, School of Ocean and Earth Science and Technology (SOEST), Univ. of Hawai'i, 2525 Correa Road, Honolulu, HI 96822, USA (URL: http://modis.higp.hawaii.edu/); MIROVA (Middle InfraRed Observation of Volcanic Activity), a collaborative project between the Universities of Turin and Florence (Italy) supported by the Centre for Volcanic Risk of the Italian Civil Protection Department (URL: http://www.mirovaweb.it/); Copernicus Browser, Copernicus Data Space Ecosystem, European Space Agency (URL: https://dataspace.copernicus.eu/browser/); Kam 24 News Agency, 683032, Kamchatka Territory, Petropavlovsk-Kamchatsky, Vysotnaya St., 2A (URL: https://kam24.ru/news/main/20230411/96657.html#.Cj5Jrky6.dpuf); Simon Carn, Geological and Mining Engineering and Sciences, Michigan Technological University, 1400 Townsend Drive, Houghton, MI 49931, USA (URL: http://www.volcarno.com/, Twitter: @simoncarn).
Bezymianny
Russia
55.972°N, 160.595°E; summit elev. 2882 m
All times are local (unless otherwise noted)
Explosions, ash plumes, lava flows, and avalanches during November 2022-April 2023
Bezymianny is located on the Kamchatka Peninsula of Russia as part of the Klyuchevskoy volcano group. Historic eruptions began in 1955 and have been characterized by dome growth, explosions, pyroclastic flows, ash plumes, and ashfall. During the 1955-56 eruption a large open crater was formed by collapse of the summit and an associated lateral blast. Subsequent episodic but ongoing lava-dome growth, accompanied by intermittent explosive activity and pyroclastic flows, has largely filled the 1956 crater. The current eruption period began in December 2016 and more recent activity has consisted of strong explosions, ash plumes, and thermal activity (BGVN 47:11). This report covers activity during November 2022 through April 2023, based on weekly and daily reports from the Kamchatka Volcano Eruptions Response Team (KVERT) and satellite data.
Activity during November and March 2023 was relatively low and mostly consisted of gas-and-steam emissions, occasional small collapses that generated avalanches along the lava dome slopes, and a persistent thermal anomaly over the volcano that was observed in satellite data on clear weather days. According to the Tokyo VAAC and KVERT, an explosion produced an ash plume that rose to 6 km altitude and drifted 25 km NE at 1825 on 29 March.
Gas-and-steam emissions, collapses generating avalanches, and thermal activity continued during April. According to two Volcano Observatory Notice for Aviation (VONA) issued on 2 and 6 April (local time) ash plumes rose to 3 km and 3.5-3.8 km altitude and drifted 35 km E and 140 km E, respectively. Satellite data from KVERT showed weak ash plumes extending up to 550 km E on 2 and 5-6 April.
A VONA issued at 0843 on 7 April described an ash plume that rose to 4.5-5 km altitude and drifted 250 km ESE. Later that day at 1326 satellite data showed an ash plume that rose to 5.5-6 km altitude and drifted 150 km ESE. A satellite image from 1600 showed an ash plume extending as far as 230 km ESE; KVERT noted that ash emissions were intensifying, likely due to avalanches from the growing lava dome. The Aviation Color Code (ACC) was raised to Red (the highest level on a four-color scale). At 1520 satellite data showed an ash plume rising to 5-5.5 km altitude and drifting 230 km ESE. That same day, Kamchatka Volcanological Station (KVS) volcanologists traveled to Ambon to collect ash; they reported that a notable eruption began at 1730, and within 20 minutes a large ash plume rose to 10 km altitude and drifted NW. KVERT reported that the strong explosive phase began at 1738. Video and satellite data taken at 1738 showed an ash plume that rose to 10-12 km altitude and drifted up to 2,800 km SE and E. Explosions were clearly audible 20 km away for 90 minutes, according to KVS. Significant amounts of ash fell at the Apakhonchich station, which turned the snow gray; ash continued to fall until the morning of 8 April. In a VONA issued at 0906 on 8 April, KVERT stated that the explosive eruption had ended; ash plumes had drifted 2,000 km E. The ACC was lowered to Orange (the third highest level on a four-color scale). The KVS team saw a lava flow on the active dome once the conditions were clear that same day (figure 53). On 20 April lava dome extrusion was reported; lava flows were noted on the flanks of the dome, and according to KVERT satellite data, a thermal anomaly was observed in the area. The ACC was lowered to Yellow (the second lowest on a four-color scale).
Satellite data showed an increase in thermal activity beginning in early April 2023. A total of 31 thermal hotspots were detected by the MODVOLC thermal algorithm on 4, 5, 7, and 12 April 2023. The elevated thermal activity resulted from an increase in explosive activity and the start of an active lava flow. The MIROVA (Middle InfraRed Observation of Volcanic Activity) volcano hotspot detection system based on the analysis of MODIS data also showed a pulse in thermal activity during the same time (figure 54). Infrared satellite imagery captured a continuous thermal anomaly at the summit crater, often accompanied by white gas-and-steam emissions (figure 55). On 4 April 2023 an active lava flow was observed descending the SE flank.
Geologic Background. The modern Bezymianny, much smaller than its massive neighbors Kamen and Kliuchevskoi on the Kamchatka Peninsula, was formed about 4,700 years ago over a late-Pleistocene lava-dome complex and an edifice built about 11,000-7,000 years ago. Three periods of intensified activity have occurred during the past 3,000 years. The latest period, which was preceded by a 1,000-year quiescence, began with the dramatic 1955-56 eruption. This eruption, similar to that of St. Helens in 1980, produced a large open crater that was formed by collapse of the summit and an associated lateral blast. Subsequent episodic but ongoing lava-dome growth, accompanied by intermittent explosive activity and pyroclastic flows, has largely filled the 1956 crater.
Information Contacts: Kamchatka Volcanic Eruptions Response Team (KVERT), Far Eastern Branch, Russian Academy of Sciences, 9 Piip Blvd., Petropavlovsk-Kamchatsky, 683006, Russia (URL: http://www.kscnet.ru/ivs/kvert/); Kamchatka Volcanological Station, Kamchatka Branch of Geophysical Survey, (KB GS RAS), Klyuchi, Kamchatka Krai, Russia (URL: http://volkstat.ru/); Hawai'i Institute of Geophysics and Planetology (HIGP) - MODVOLC Thermal Alerts System, School of Ocean and Earth Science and Technology (SOEST), Univ. of Hawai'i, 2525 Correa Road, Honolulu, HI 96822, USA (URL: http://modis.higp.hawaii.edu/); MIROVA (Middle InfraRed Observation of Volcanic Activity), a collaborative project between the Universities of Turin and Florence (Italy) supported by the Centre for Volcanic Risk of the Italian Civil Protection Department (URL: http://www.mirovaweb.it/); Copernicus Browser, Copernicus Data Space Ecosystem, European Space Agency (URL: https://dataspace.copernicus.eu/browser/).
Chikurachki
Russia
50.324°N, 155.461°E; summit elev. 1781 m
All times are local (unless otherwise noted)
New explosive eruption during late January-early February 2023
Chikurachki, located on Paramushir Island in the northern Kuriles, has had Plinian eruptions during the Holocene. Lava flows have reached the sea and formed capes on the NW coast; several young lava flows are also present on the E flank beneath a scoria deposit. Reported eruptions date back to 1690, with the most recent eruption period occurring during January through October 2022, characterized by occasional explosions, ash plumes, and thermal activity (BGVN 47:11). This report covers a new eruptive period during January through February 2023 that consisted of ash explosions and ash plumes, based on information from the Kamchatka Volcanic Eruptions Response Team (KVERT) and satellite data.
According to reports from KVERT, an explosive eruption began around 0630 on 29 January. Explosions generated ash plumes that rose to 3-3.5 km altitude and drifted 6-75 km SE and E, based on satellite data. As a result, the Aviation Color Code (ACC) was raised to Orange (the second highest level on a four-color scale). At 1406 and 1720 ash plumes were identified in satellite images that rose to 4.3 km altitude and extended 70 km E. By 2320 the ash plume had dissipated. A thermal anomaly was visible at the volcano on 31 January, according to a satellite image, and an ash plume was observed drifting 66 km NE.
Occasional explosions and ash plumes continued during early February. At 0850 on 1 February an ash plume rose to 3.5 km altitude and drifted 35 km NE. Satellite data showed an ash plume that rose to 3.2-3.5 km altitude and drifted 50 km NE at 1222 later that day (figure 22). A thermal anomaly was detected over the volcano during 5-6 February and ash plumes drifted as far as 125 km SE, E, and NE. Explosive events were reported at 0330 on 6 February that produced ash plumes rising to 4-4.5 km altitude and drifting 72-90 km N, NE, and ENE. KVERT noted that the last gas-and steam plume that contained some ash was observed on 8 February and drifted 55 km NE before the explosive eruption ended. The ACC was lowered to Yellow and then Green (the lowest level on a four-color scale) on 18 February.
Geologic Background. Chikurachki, the highest volcano on Paramushir Island in the northern Kuriles, is a relatively small cone constructed on a high Pleistocene edifice. Oxidized basaltic-to-andesitic scoria deposits covering the upper part of the young cone give it a distinctive red color. Frequent basaltic Plinian eruptions have occurred during the Holocene. Lava flows have reached the sea and formed capes on the NW coast; several young lava flows are also present on the E flank beneath a scoria deposit. The Tatarinov group of six volcanic centers is located immediately to the south, and the Lomonosov cinder cone group, the source of an early Holocene lava flow that reached the saddle between it and Fuss Peak to the west, lies at the southern end of the N-S-trending Chikurachki-Tatarinov complex. In contrast to the frequently active Chikurachki, the Tatarinov centers are extensively modified by erosion and have a more complex structure. Tephrochronology gives evidence of an eruption around 1690 CE from Tatarinov, although its southern cone contains a sulfur-encrusted crater with fumaroles that were active along the margin of a crater lake until 1959.
Information Contacts: Kamchatka Volcanic Eruptions Response Team (KVERT), Far East Division, Russian Academy of Sciences, 9 Piip Blvd., Petropavlovsk-Kamchatsky, 683006, Russia (URL: http://www.kscnet.ru/ivs/); Copernicus Browser, Copernicus Data Space Ecosystem, European Space Agency (URL: https://dataspace.copernicus.eu/browser/).
Search Bulletin Archive by Publication Date
Select a month and year from the drop-downs and click "Show Issue" to have that issue displayed in this tab.
The default month and year is the latest issue available.
Scientific Event Alert Network Bulletin - Volume 13, Number 09 (September 1988)
Managing Editor: Lindsay McClelland
Arenal (Costa Rica)
Explosive activity documented
Atmospheric Effects (1980-1989) (Unknown)
Aerosols continue to decline toward background levels
Bagana (Papua New Guinea)
Increased lava production feeds new lobe
Colima (Mexico)
1987 phreatic explosion and avalanche from summit dome
Erta Ale (Ethiopia)
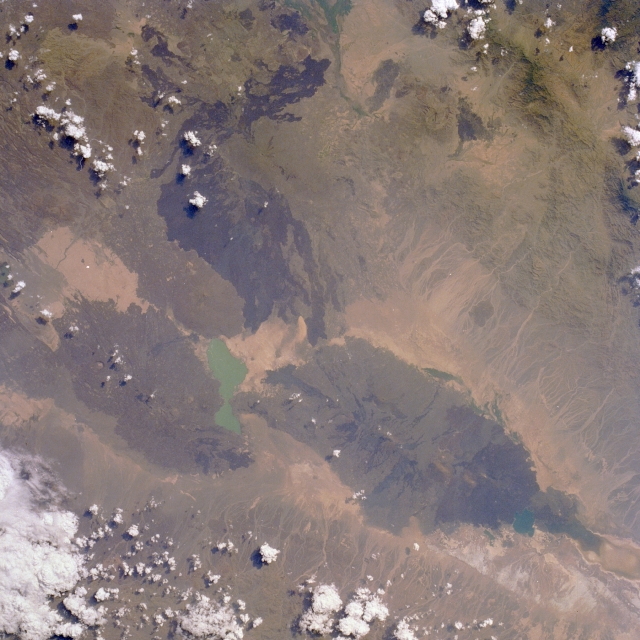
Space Shuttle photograph of the Rift Valley in Ethiopia
Fournaise, Piton de la (France)
Deformation precedes fissure eruption
Guagua Pichincha (Ecuador)
Increased seismicity; fumarolic activity slightly stronger
Irazu (Costa Rica)
Fumarolic activity continues; rain forms two crater lakes
Kilauea (United States)
Littoral explosions and lava bench collapse
Langila (Papua New Guinea)
Weak ash emission; glow
Macdonald (France)
Two weeks of submarine eruptive activity
Manam (Papua New Guinea)
Ash and vapor emission; weak glow
Mayon (Philippines)
Crater glow; new areas of steaming
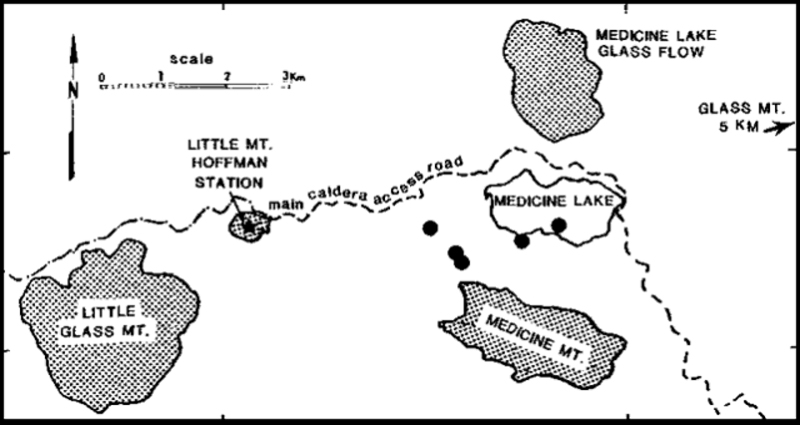
Medicine Lake (United States)
Earthquake swarm but no inflation
Monowai (New Zealand)
Shallow submarine eruption
Pagan (United States)
Satellite data on August eruption; renewed ash emission
Poas (Costa Rica)
Phreatic activity from crater lake
Rabaul (Papua New Guinea)
Seismicity declines but remains above normal
Ruapehu (New Zealand)
Coldest recorded crater lake temperature
Ruiz, Nevado del (Colombia)
Small ash emissions; continued strong seismicity
Siple (Antarctica)
Apparent ash plumes detected by satellite imagery
Arenal (Costa Rica) — September 1988 Cite this Report
Arenal
Costa Rica
10.463°N, 84.703°W; summit elev. 1670 m
All times are local (unless otherwise noted)
Explosive activity documented
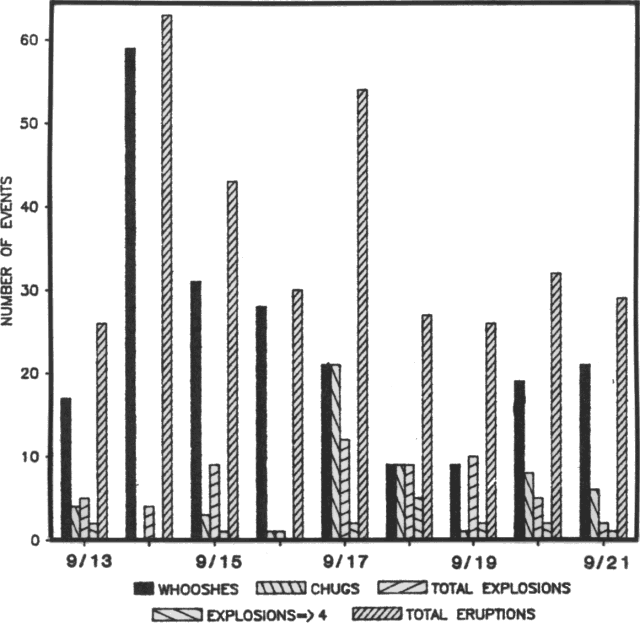
From 13 to 21 September, the number, type, and estimated magnitudes of Arenal's Vulcanian eruptions were continuously noted by volunteers from the Smithsonian Research Expedition Program. Because of poor summit visibility, eruption type was recognized by sound signature. Eruptions (figure 18) consisted of explosions, intense block and bomb fountains (identified by "whooshing" sounds), and smaller rhythmic block and bomb fountains (weak "chugging" noises at ~1- to 2-second intervals). The eruption rate varied greatly but averaged 1.5/hour. Seismic energy release was greatest for intense block and bomb fountaining and much less for explosions. The frequency of explosions continued a 2-year decline, but intense fountains of bombs, blocks, and ash continued to increase in number. At 0910 on 17 September, a fountaining episode produced a hot fallback avalanche (~60,000 m3) that descended to 1.5 km S of the summit crater. Explosions ejected incandescent, highly phyric, viscous, basaltic andesite bombs and blocks to ~650 m from the crater, and rarely to 1 km. No lava flows were emitted.
The activity continued to build a new cone (over Crater C) that reached 1,550 m elevation about 350 m W of the old summit cone, inactive except for numerous fumaroles. The old cone's walls, 1,633 m high prior to the 1968 eruption, continued to collapse, largely due to ballistic impacts from the explosions.
Acid rain within 2.5 km of the summit had pH values as low as 3.4. During the mid-September observations, the winds were typically from the W, contrary to the normal easterly trade winds. Ash frequently fell to the E, including the town of La Fortuna.
The Univ of Costa Rica reported that an average of 15 explosions were registered/day during the last week in September. The two main summit area fumaroles emitted gas that was predominantly white (water vapor) but included some basal bluish coloration, probably from sulfur compounds or chlorine.
Geologic Background. Conical Volcán Arenal is the youngest stratovolcano in Costa Rica and one of its most active. The 1670-m-high andesitic volcano towers above the eastern shores of Lake Arenal, which has been enlarged by a hydroelectric project. Arenal lies along a volcanic chain that has migrated to the NW from the late-Pleistocene Los Perdidos lava domes through the Pleistocene-to-Holocene Chato volcano, which contains a 500-m-wide, lake-filled summit crater. The earliest known eruptions of Arenal took place about 7000 years ago, and it was active concurrently with Cerro Chato until the activity of Chato ended about 3500 years ago. Growth of Arenal has been characterized by periodic major explosive eruptions at several-hundred-year intervals and periods of lava effusion that armor the cone. An eruptive period that began with a major explosive eruption in 1968 ended in December 2010; continuous explosive activity accompanied by slow lava effusion and the occasional emission of pyroclastic flows characterized the eruption from vents at the summit and on the upper western flank.
Information Contacts: W. Melson, SI; G. Soto, Univ de Costa Rica.
Atmospheric Effects (1980-1989) (Unknown) — September 1988 Cite this Report
Atmospheric Effects (1980-1989)
Unknown
Unknown, Unknown; summit elev. m
All times are local (unless otherwise noted)
Aerosols continue to decline toward background levels
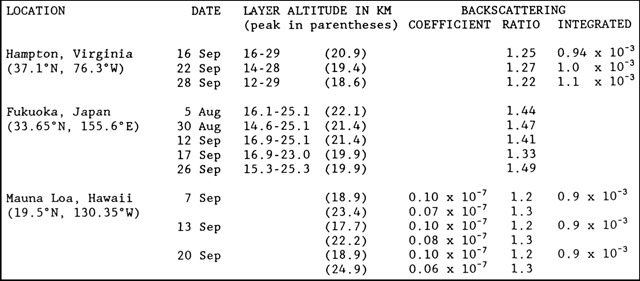
Lidar data from Virginia, Japan, and Hawaii indicated that stratospheric aerosol concentrations continued to decline toward background levels through September (figure 62). Small lower stratospheric layers measured in June at Mauna Loa, Hawaii and in early July at Fukuoka, Japan, perhaps from the May eruption of Banda Api, have not been evident since then. No large injections of volcanic material into the stratosphere have been detected since the November 1985 eruption of Ruiz.
Geologic Background. The enormous aerosol cloud from the March-April 1982 eruption of Mexico's El Chichón persisted for years in the stratosphere, and led to the Atmospheric Effects section becoming a regular feature of the Bulletin. Descriptions of the initial dispersal of major eruption clouds remain with the individual eruption reports, but observations of long-term stratospheric aerosol loading will be found here.
Information Contacts: William Fuller, NASA Langley Research Center, Hampton, VA 23665 USA; Thomas DeFoor, Mauna Loa Observatory, P.O. Box 275, Hilo, HI 96720 USA; Motowo Fujiwara, Physics Department, Fukuoka University, Jonanku, Fukuoka 814-01, Japan.
Bagana (Papua New Guinea) — September 1988 Cite this Report
Bagana
Papua New Guinea
6.137°S, 155.196°E; summit elev. 1855 m
All times are local (unless otherwise noted)
Increased lava production feeds new lobe
"An aerial inspection . . . on 5 September confirmed seismic evidence of increased lava effusion. A new lava lobe was observed on the S side of the one that had been active since September 1987. When the volcano was last inspected in April 1988, only one lobe (~1 km long) was present. It appears that this lobe had not advanced much beyond its April position. The new lobe was fed directly from the summit and its broad, moderately-sloping nose was ~200-300 m beyond the first lobe's terminus. Rockslides on the lobe's edges were observed . . . and pale-brown dust mantled the nose of the lobe, indicating that rockslides were occurring frequently. This observation confirmed seismic evidence of repeated rockslides. The top of the summit lava dome was flat. Voluminous white vapour emissions were fed from diffuse sources on the dome's upper flanks. The emission plume was 10-20 km long."
Geologic Background. Bagana volcano, in a remote portion of central Bougainville Island, is frequently active. This massive symmetrical cone was largely constructed by an accumulation of viscous andesitic lava flows. The entire edifice could have been constructed in about 300 years at its present rate of lava production. Eruptive activity is characterized by non-explosive effusion of viscous lava that maintains a small lava dome in the summit crater, although occasional explosive activity produces pyroclastic flows. Lava flows with tongue-shaped lobes up to 50 m thick and prominent levees descend the flanks on all sides.
Information Contacts: C. McKee and P. Lowenstein, RVO.
Colima (Mexico) — September 1988 Cite this Report
Colima
Mexico
19.514°N, 103.62°W; summit elev. 3850 m
All times are local (unless otherwise noted)
1987 phreatic explosion and avalanche from summit dome
On 2 July 1987, residents of the S side of Colima observed a mushroom cloud 500-1,000 m high emerge from the central dome, accompanied by a loud explosion. Tons of volcanic material fell on the SE side of the cone. Municipal authorities requested assistance, and a group of security personnel and two geologists from Guadalajara were sent to investigate. Their report described the activity as a "phreatic explosion from the central dome and an avalanche... of volcanic material accumulated forming the dome" (Flores and others, 1987).
The same two geologists and another from the National Univ climbed the volcano on 20 April 1988. The dome, 250-300 m in diameter, had a large depression (100 m diameter, 50 m deep [but see 15:12]) on its SE side. Only fragmented older rocks were found on the dome and in the avalanche; there was no evidence of fresh glass.
Fumarolic activity from three sites on the dome is watched by telescope from Ciudad Guzmán, 20 km NE. Weekly reports are sent to the Geography Department at the Univ of Guadalajara, 132 km N of the volcano. Geologists from the Univ visit the volcano every two months if weather permits.
Reference. Flores, J., and others, 1987, Informes de las recientes observaciones practicadas en el Volcan Colima: Revista del Instituto de Geografia y Estadistica, Universidad de Guadalajara, México, v. 3, no. 2.
Geologic Background. The Colima complex is the most prominent volcanic center of the western Mexican Volcanic Belt. It consists of two southward-younging volcanoes, Nevado de Colima (the high point of the complex) on the north and the historically active Volcán de Colima at the south. A group of late-Pleistocene cinder cones is located on the floor of the Colima graben west and east of the complex. Volcán de Colima (also known as Volcán Fuego) is a youthful stratovolcano constructed within a 5-km-wide scarp, breached to the south, that has been the source of large debris avalanches. Major slope failures have occurred repeatedly from both the Nevado and Colima cones, producing thick debris-avalanche deposits on three sides of the complex. Frequent recorded eruptions date back to the 16th century. Occasional major explosive eruptions have destroyed the summit (most recently in 1913) and left a deep, steep-sided crater that was slowly refilled and then overtopped by lava dome growth.
Information Contacts: Julian A. Flores Diaz, Instituto de Geografia y Estadistica, Univ de Guadalajara.
Erta Ale (Ethiopia) — September 1988
Erta Ale
Ethiopia
13.601°N, 40.666°E; summit elev. 585 m
All times are local (unless otherwise noted)
Space Shuttle photograph of the Rift Valley in Ethiopia
Astronauts aboard the Space Shuttle in September 1988 photographed the Rift Valley of northern Ethiopia, including Erta Ale volcano.
Geologic Background. The Erta Ale basaltic shield volcano in Ethiopia has a 50-km-wide edifice that rises more than 600 m from below sea level in the Danakil depression. The volcano includes a 0.7 x 1.6 km summit crater hosting steep-sided pit craters. Another larger 1.8 x 3.1 km wide depression elongated parallel to the trend of the Erta Ale range is located SE of the summit and is bounded by curvilinear fault scarps on the SE side. Basaltic lava flows from these fissures have poured into the caldera and locally overflowed its rim. The summit caldera usually also holds at least one long-term lava lake that has been active since at least 1967, and possibly since 1906. Recent fissure eruptions have occurred on the N flank.
Information Contacts: NASA JSC Digital Image Collection (URL: http://images.jsc.nasa.gov/).
Piton de la Fournaise (France) — September 1988 Cite this Report
Piton de la Fournaise
France
21.244°S, 55.708°E; summit elev. 2632 m
All times are local (unless otherwise noted)
Deformation precedes fissure eruption
During most of August, only weak summit-area microseismicity was detected. Permanent tiltmeter stations recorded inflation of a few µrads/week, similar to previous months. Seismicity increased in late August, and on the 31st at 1523, deformation measurements documented the onset of magma intrusion into the SE part of the summit (Dolomieu) crater. As the intrusion migrated W during the following 2.5 hours, tilt data provided good location estimates of the initial eruption fissures. These began to open at 1748, on the SW flank of neighboring Bory crater, and gradually propagated downslope from 2,250 to 2,150 m altitude (S of Rivals Crater and E of December 1983 Crater). Aphyric basalt extrusion was significant during the first 5 days and then declined until ceasing around 10 September [but see 13:11]. Lava production was <4 x 10⁶ m3. Since the eruption, activity has been limited to strong degassing and continuous weak tremor.
During September, deep earthquakes (30-50 km) were recorded NW of the volcano between Piton de la Fournaise and Piton des Neiges. One event (M 3.0) was felt by the population in the "Cirque de Mafate" and in the N island area.
Geologic Background. Piton de la Fournaise is a massive basaltic shield volcano on the French island of Réunion in the western Indian Ocean. Much of its more than 530,000-year history overlapped with eruptions of the deeply dissected Piton des Neiges shield volcano to the NW. Three scarps formed at about 250,000, 65,000, and less than 5,000 years ago by progressive eastward slumping, leaving caldera-sized embayments open to the E and SE. Numerous pyroclastic cones are present on the floor of the scarps and their outer flanks. Most recorded eruptions have originated from the summit and flanks of Dolomieu, a 400-m-high lava shield that has grown within the youngest scarp, which is about 9 km wide and about 13 km from the western wall to the ocean on the E side. More than 150 eruptions, most of which have produced fluid basaltic lava flows, have occurred since the 17th century. Only six eruptions, in 1708, 1774, 1776, 1800, 1977, and 1986, have originated from fissures outside the scarps.
Information Contacts: H. Delorme, D. Vandamme, P. Nerbusson, J. Delmond, and P. Taochi, OVPDLF; J. Dubois, J-L. Cheminee, P. Blum, A. Hirn, J. LePine, J. Zlotnicki, IPGP.
Guagua Pichincha (Ecuador) — September 1988 Cite this Report
Guagua Pichincha
Ecuador
0.171°S, 78.598°W; summit elev. 4784 m
All times are local (unless otherwise noted)
Increased seismicity; fumarolic activity slightly stronger
Local seismicity has increased substantially since mid-April, accompanied by minor changes in the summit crater's fumarole field. Seismicity gradually built from background levels of 5-10/month to >200/month by August, and was continuing in early October. August and September events were centered at 4-9 km depth (most 7-9 km) near and N of the S caldera wall. In late September and early October seismicity migrated N toward the modern vent and upward, with some foci as shallow as 1.5 km. All were A-type shocks. Magnitudes of the largest events reached 3-3.5 and a few were felt in . . . Quito . . . . Early October data from tilt stations and EDM lines showed no deformation above noise levels since the last measurements in 1987. Geologists climbed the volcano on 8 October and noted more vigorous activity at existing fumaroles, plus new vents, an expansion in the size of the fumarole field, and recently killed vegetation.
Geologic Background. Guagua Pichincha and the older Pleistocene Rucu Pichincha stratovolcanoes form a broad volcanic massif that rises immediately W of Ecuador's capital city, Quito. A lava dome grew at the head of a 6-km-wide scarp formed during a late-Pleistocene slope failure ~50,000 years ago. Subsequent late-Pleistocene and Holocene eruptions from the central vent consisted of explosive activity with pyroclastic flows accompanied by periodic growth and destruction of the lava dome. Many minor eruptions have been recorded since the mid-1500's; the largest took place in 1660, when ash fell over a 1,000 km radius and accumulated to 30 cm depth in Quito. Pyroclastic flows and surges also occurred, primarily to then W, and affected agricultural activity.
Information Contacts: M. Hall and H. Yépez, Instituto Geofísico de la Escuela Politécnica Nacional; N. Banks and J. Ewert, USGS.
Irazu (Costa Rica) — September 1988 Cite this Report
Irazu
Costa Rica
9.979°N, 83.852°W; summit elev. 3436 m
All times are local (unless otherwise noted)
Fumarolic activity continues; rain forms two crater lakes
For the past several years, fumarolic activity on the NW flank has continued unchanged. Because of intense precipitation during August and September, small greenish lakes have recently formed in the main crater and Diego de la Haya crater. No signs of solfataric degassing have been observed in the lakes.
Geologic Background. The massive Irazú volcano in Costa Rica, immediately E of the capital city of San José, covers an area of 500 km2 and is vegetated to within a few hundred meters of its broad summit crater complex. At least 10 satellitic cones are located on its S flank. No lava effusion is known since the eruption of the Cervantes lava flows from S-flank vents about 14,000 years ago, and all known Holocene eruptions have been explosive. The focus of eruptions at the summit crater complex has migrated to the W towards the main crater, which contains a small lake. The first well-documented eruption occurred in 1723, and frequent explosive eruptions have occurred since. Ashfall from the last major eruption during 1963-65 caused significant disruption to San José and surrounding areas. Phreatic activity reported in 1994 may have been a landslide event from the fumarolic area on the NW summit (Fallas et al., 2018).
Information Contacts: G. Soto, Escuela Centroamericana de Geologia & Red Sismologica Nacional, Univ de Costa Rica.
Kilauea (United States) — September 1988 Cite this Report
Kilauea
United States
19.421°N, 155.287°W; summit elev. 1222 m
All times are local (unless otherwise noted)
Littoral explosions and lava bench collapse
The . . . eruption continued to feed lava into the ocean near Kupapau Point. Fluctuating tremor associated with explosive lava entry into the sea was recorded 3 km away at Wahaula seismic station. Tube system surface outbreaks occurred on 19 and 20 September above the fault scarp at ~350 m elevation. The 19 September outbreak fed 1-km-long aa flows that stagnated the same day. The lava pond level at Kupaianaha remained 20 m below the N crater rim and lava was occasionally seen in Pu`u `O`o crater's main vent. Additional lava bench collapses occurred, with major episodes on 6, 15, and 26 September. Lava bench collapse was detected seismically as a series of high-amplitude bursts followed by smaller rockfall and explosion signals and a temporary decrease in tremor. At 2038 on the 26th, 1/3 to 1/2 of the 200-m-long and 50-70-m-wide bench collapsed. Strong explosions built a pair of littoral cones (4-5 m high) on the resulting collapse scarp. A new bench grew rapidly, and by 10 October, two small new cones (2-3 m) had built 20-30 m seaward. Small spits grew in front of the cones. Increased pyroclastic activity in early October covered 1/3 of the bench's western area with several centimeters of tephra and added to a pre-existing 250-m-long tephra blanket that covered the nearby beach.
Low-level tremor continued . . . near Pu`u `O`o and Kupaianaha. At Kīlauea's summit, the number of short period microearthquakes was relatively steady at ~100/day. Two moderate swarms of intermediate-depth (6-15 km), long-period earthquakes occurred 4-6 and 26-27 September and consisted of several hundred events (M>0.1). The month's largest event (M 4.4) at 1952 on 12 September was centered 11 km beneath Kīlauea's S flank and was widely felt in the S part of the island. No structural damage was reported.
Geologic Background. Kilauea overlaps the E flank of the massive Mauna Loa shield volcano in the island of Hawaii. Eruptions are prominent in Polynesian legends; written documentation since 1820 records frequent summit and flank lava flow eruptions interspersed with periods of long-term lava lake activity at Halemaumau crater in the summit caldera until 1924. The 3 x 5 km caldera was formed in several stages about 1,500 years ago and during the 18th century; eruptions have also originated from the lengthy East and Southwest rift zones, which extend to the ocean in both directions. About 90% of the surface of the basaltic shield volcano is formed of lava flows less than about 1,100 years old; 70% of the surface is younger than 600 years. The long-term eruption from the East rift zone between 1983 and 2018 produced lava flows covering more than 100 km2, destroyed hundreds of houses, and added new coastline.
Information Contacts: C. Heliker and R. Koyanagi, HVO.
Langila (Papua New Guinea) — September 1988 Cite this Report
Langila
Papua New Guinea
5.525°S, 148.42°E; summit elev. 1330 m
All times are local (unless otherwise noted)
Weak ash emission; glow
"Low-level activity continued in September. Weak-moderate white emissions and occasional grey ash clouds were released from Crater 2. Explosion and rumbling sounds were heard on a number of days and weak crater glow was observed on the nights of the 5th and 14th. No eruptive activity took place at Crater 3. Seismic activity was low and only a few explosion earthquakes were recorded during the month."
Geologic Background. Langila, one of the most active volcanoes of New Britain, consists of a group of four small overlapping composite basaltic-andesitic cones on the lower E flank of the extinct Talawe volcano in the Cape Gloucester area of NW New Britain. A rectangular, 2.5-km-long crater is breached widely to the SE; Langila was constructed NE of the breached crater of Talawe. An extensive lava field reaches the coast on the N and NE sides of Langila. Frequent mild-to-moderate explosive eruptions, sometimes accompanied by lava flows, have been recorded since the 19th century from three active craters at the summit. The youngest and smallest crater (no. 3 crater) was formed in 1960 and has a diameter of 150 m.
Information Contacts: C. McKee and P. Lowenstein, RVO.
Macdonald (France) — September 1988 Cite this Report
Macdonald
France
28.98°S, 140.25°W; summit elev. -39 m
All times are local (unless otherwise noted)
Two weeks of submarine eruptive activity
Numerous shallow submarine explosions of moderate intensity occurred . . . from 2155 on 2 September until 5 September, recorded as acoustic waves (T-phase) by the RSP. Sporadic weak activity persisted from 6 September until the eruption's end at about 0700 on 18 September. Periods of activity were also detected 6-18 May and 11 June 1988. No explosions accompanied the onsets of active periods during August 1987-June 1988, suggesting to seismologists that the eruption may have been continuous during that time.
Geologic Background. Discovered by the detection of teleseismic waves in 1967, Macdonald seamount (also known as Tamarii seamount) rises from a depth of about 1,800 m to within 27 m of the ocean surface at the eastern end of the Austral Islands. The basaltic submarine volcano marks the site of a hotspot that was the source of the Austral-Cook island chain. The summit, named after volcanologist Gordon Macdonald, consists of a flat plateau about 100 x 150 m wide with an average depth of about 40 m. The summit plateau is capped with spatter cones that form steep-sided pinnacles. Most eruptions have been seismically detected, but in 1987 and 1989 pumice emission was observed from research vessels. Pumice rafts observed in the South Pacific in 1928 and 1936 may also have originated here.
Information Contacts: J. Talandier, LDG Tahiti.
Manam (Papua New Guinea) — September 1988 Cite this Report
Manam
Papua New Guinea
4.08°S, 145.037°E; summit elev. 1807 m
All times are local (unless otherwise noted)
Ash and vapor emission; weak glow
"The low level of activity that continued in September was characterized by weak to moderate white vapour emissions from the summit craters. The emissions occasionally contained small amounts of grey ash and blue vapour. Weak fluctuating glow from Main Crater was seen on the 6th and 7th and from Southern Crater on the 7th and 8th. On a few days, rumbling sounds from Southern Crater were reported. Seismicity remained at a normal inter-eruptive level with a daily average of 1100 low-frequency events. Tilt measurements were somewhat erratic and no clear trends were evident."
Geologic Background. The 10-km-wide island of Manam, lying 13 km off the northern coast of mainland Papua New Guinea, is one of the country's most active volcanoes. Four large radial valleys extend from the unvegetated summit of the conical basaltic-andesitic stratovolcano to its lower flanks. These valleys channel lava flows and pyroclastic avalanches that have sometimes reached the coast. Five small satellitic centers are located near the island's shoreline on the northern, southern, and western sides. Two summit craters are present; both are active, although most observed eruptions have originated from the southern crater, concentrating eruptive products during much of the past century into the SE valley. Frequent eruptions, typically of mild-to-moderate scale, have been recorded since 1616. Occasional larger eruptions have produced pyroclastic flows and lava flows that reached flat-lying coastal areas and entered the sea, sometimes impacting populated areas.
Information Contacts: C. McKee and P. Lowenstein, RVO.
Mayon (Philippines) — September 1988 Cite this Report
Mayon
Philippines
13.257°N, 123.685°E; summit elev. 2462 m
All times are local (unless otherwise noted)
Crater glow; new areas of steaming
Faint crater glow was observed at Mayon almost nightly during September. White steam emission, occasionally accompanied by bluish fumes, remained moderate, occupying 1/2 of the vent area. When PHIVOLCS volcanologists climbed the volcano on 8 September, the crater was 40-50 m deep and new areas of steaming had developed near the summit. A temperature of 285°C was measured at one of several fumaroles. Strong static charges at the summit caused hair to stand on end. On 29 September, a mudflow with a velocity of 2.3 m/s traveled down Basud gully, along the volcano's SE slope.
During September, 36 high-frequency and 31 low-frequency earthquakes were recorded plus 129 low-frequency and 16 high-frequency tremor episodes. From 1 to 9 October, 19 high-frequency and seven low-frequency earthquakes were detected in addition to 71 harmonic tremor episodes.
Geologic Background. Symmetrical Mayon, which rises above the Albay Gulf NW of Legazpi City, is the most active volcano of the Philippines. The steep upper slopes are capped by a small summit crater. Recorded eruptions since 1616 CE range from Strombolian to basaltic Plinian, with cyclical activity beginning with basaltic eruptions, followed by longer term andesitic lava flows. Eruptions occur predominately from the central conduit and have also produced lava flows that travel far down the flanks. Pyroclastic flows and mudflows have commonly swept down many of the approximately 40 ravines that radiate from the summit and have often damaged populated lowland areas. A violent eruption in 1814 killed more than 1,200 people and devastated several towns.
Information Contacts: PHIVOLCS.
Medicine Lake (United States) — September 1988 Cite this Report
Medicine Lake
United States
41.611°N, 121.554°W; summit elev. 2412 m
All times are local (unless otherwise noted)
Earthquake swarm but no inflation
The quoted material is a report from Steve Walter. "On 29 September, 47 earthquakes were detected at Medicine Lake volcano, a large shield (50 km E of Mt. Shasta) that has experienced only 1 earthquake in the past eight years. The largest event (M 3.1) was located in the SW region of the caldera at a depth of 3.3 km (figure 1). Activity increased on 30 September when a total of 146 earthquakes were registered, 66 during a l-hour period. Four of these events (largest M 4.1) were located near the 29 September earthquake. After 30 September, seismicity declined to ~10 events/day until 4 October when there were 33 events, including a M 3.1 earthquake. Activity again declined with sporadic events (up to 5/day, M less than 2.0) continuing through 16 October. Most of the seismicity was recorded on the nearest instrument at Little Mt. Hoffman, ~4 km W of the epicentral zone. The next nearest stations are over 30 km from Medicine Lake in the Mt. Shasta network. On 3 October, a station was removed from the Mt. Shasta net and established at Medicine Mountain, ~1 km S of the epicentral zone on the S rim of the caldera. Although seismicity has declined, the USGS has selected six sites around the caldera for installation of one 3-component, low-gain, and six 1-component seismometers, scheduled for late October."
A levelling line, measured along the main caldera access road (figure 1) by Dan Dzurisin in August 1988, indicated at least 18 cm of deflation relative to a 1954 survey. Re-measurements of the same line in early October showed little or no additional deformation. Dzurisin and Phil Dawson attributed recent ground cracks, outside of the epicentral area and circumferential to Little Medicine Lake, as slumping possibly caused by the seismicity. No cracks were observed within the epicentral area, but recent tree falls were evident. Pre-existing weak fumarolic activity had not changed, although not all fumarolic areas were visited.
Geologic Background. Medicine Lake is a large Pleistocene-to-Holocene, basaltic-to-rhyolitic shield volcano east of the main axis of the Cascade Range. Volcanism, similar in style to that of Newberry volcano in Oregon, began less than one million years ago. A roughly 7 x 12 km caldera truncating the summit contains a lake that gives the volcano its name. A series of young eruptions lasting a few hundred years began about 10,500 years before present (BP) and produced 5 km3 of basaltic lava. Nine Holocene eruptions clustered during three eruptive episodes at about 5000, 3000, and 1000 years ago produced a chemically varied group of basaltic lava flows from flank vents and silicic obsidian flows from vents within the caldera and on the upper flanks. The last eruption produced the massive Glass Mountain obsidian flow on the E flank about 900 years BP. Lava Beds National Monument on the N flank of Medicine Lake shield volcano contains hundreds of lava-tube caves displaying a variety of spectacular lava-flow features, most of which are found in the voluminous Mammoth Crater lava flow, which extends in several lobes up to 24 km from the vent.
Information Contacts: S. Walter, USGS Menlo Park; D. Dzurisin, CVO.
Monowai (New Zealand) — September 1988 Cite this Report
Monowai
New Zealand
25.887°S, 177.188°W; summit elev. -132 m
All times are local (unless otherwise noted)
Shallow submarine eruption
A shallow submarine eruption from Monowai was detected by Polynesian Seismic Network (Réseau Sismique Polynésien, or RSP) stations (2,800 and 4,300 km from the volcano) on [9 September from 0950 until 1820]. Acoustic T-waves, generated from lava/seawater interaction, indicated an eruption of fluctuating intensity without explosions. RSP stations recorded seismic activity from Monowai in April 1977, January 1980, May 1982, and June 1986.
Geologic Background. Monowai, also known as Orion seamount, is a basaltic stratovolcano that rises from a depth of about 1,500 to within 100 m of the ocean surface about halfway between the Kermadec and Tonga island groups, at the southern end of the Tonga Ridge. Small cones occur on the N and W flanks, and an 8.5 x 11 km submarine caldera with a depth of more than 1,500 m lies to the NNE. Numerous eruptions have been identified using submarine acoustic signals since it was first recognized as a volcano in 1977. A shoal that had been reported in 1944 may have been a pumice raft or water disturbance due to degassing. Surface observations have included water discoloration, vigorous gas bubbling, and areas of upwelling water, sometimes accompanied by rumbling noises. It was named for one of the New Zealand Navy bathymetric survey ships that documented its morphology.
Information Contacts: J. Talandier, Laboratoire de Géophysique, (LDG) Tahiti.
Pagan (United States) — September 1988 Cite this Report
Pagan
United States
18.13°N, 145.8°E; summit elev. 570 m
All times are local (unless otherwise noted)
Satellite data on August eruption; renewed ash emission
Satellites provided additional plume heights and lengths 24-25 August (table 2). A press report described an ash eruption that began suddenly on 11 October at 0930. The ash cloud was about 3 km high and extended roughly 40 km.
Table 2. Satellite-derived estimates of altitudes, lengths, and azimuths of plumes from Pagan, August 1988. Courtesy of NOAA/NESDIS.
| Imagery Date |
Time |
Estimated Altitude |
Estimated Length |
Estimated Azimuth |
| 24 Aug 1988 |
0917 |
2 km |
95 km |
270° |
| 25 Aug 1988 |
0606 |
3.3 km |
122 km |
313° |
| 26 Aug 1988 |
0838 |
33-45 km |
102 km |
282° |
Geologic Background. Pagan Island, the largest and one of the most active of the Mariana Islands volcanoes, consists of two stratovolcanoes connected by a narrow isthmus. Both North and South Pagan stratovolcanoes were constructed within calderas, 7 and 4 km in diameter, respectively. North Pagan at the NE end of the island rises above the flat floor of the northern caldera, which may have formed less than 1,000 years ago. South Pagan is a stratovolcano with an elongated summit containing four distinct craters. Almost all of the recorded eruptions, which date back to the 17th century, have originated from North Pagan. The largest eruption during historical time took place in 1981 and prompted the evacuation of the sparsely populated island.
Information Contacts: M. Matson, NOAA; N. Banks, CVO; Marianas Variety.
Poas (Costa Rica) — September 1988 Cite this Report
Poas
Costa Rica
10.2°N, 84.233°W; summit elev. 2697 m
All times are local (unless otherwise noted)
Phreatic activity from crater lake
Activity in the hot crater lake has remained vigorous since the onset of geyser-type phreatic explosions in June 1987. The postulated mechanism of activity is shown schematically in figures 4 and 5. During the first half of August 1988, plumes containing mud were ejected at intervals of 3 minutes, reaching 30 m above the lake surface. Activity occurred from three sites in the lake, but remained strongest at the central vent (figure 6). The explosions were accompanied by strong noise and emission of gas that was generally blown W by the wind. Geyser-type activity was almost continuous during the second half of August and the first week of September, with black mud plumes rising 5-10 m. During the rest of the month, plumes rose as much as 25 m. Heavy rainfall caused small changes in lake level during September. A rockfall occurred in mid-September on the NE edge of the lake, facilitated by concentric fractures. The rockfall scar had a maximum diameter of 30 m, was 15 m high, and 25 m wide.
Vapor ejected by the phreatic explosions caused acid rain within the crater, and irritated mucous membranes of people at the overlook. Water in Lake Botos, SE of the crater, has acidified slightly. The lake supplies water to the visitor center at Volcán Poás National Park, where pH of piped water was 4.5-4.8. Fumaroles on the remnants of the 1953-55 [dome] showed high concentrations of H2S and water vapor, moderate amounts of CO2 and H2, and little Cl2 (data from a Drager gas detector). The temperature on the [dome] was about 500°C. Seismic records from Poás volcano station (VPS) have not shown significant changes in the past 6 months. Tens of B-type earthquakes were recorded daily, while A-type events were scarce, confirming the shallow character of the activity.
Geologic Background. The broad vegetated edifice of Poás, one of the most active volcanoes of Costa Rica, contains three craters along a N-S line. The frequently visited multi-hued summit crater lakes of the basaltic-to-dacitic volcano are easily accessible by vehicle from the nearby capital city of San José. A N-S-trending fissure cutting the complex stratovolcano extends to the lower N flank, where it has produced the Congo stratovolcano and several lake-filled maars. The southernmost of the two summit crater lakes, Botos, last erupted about 7,500 years ago. The more prominent geothermally heated northern lake, Laguna Caliente, is one of the world's most acidic natural lakes, with a pH of near zero. It has been the site of frequent phreatic and phreatomagmatic eruptions since an eruption was reported in 1828. Eruptions often include geyser-like ejections of crater-lake water.
Information Contacts: G. Soto, UCR; Seccion Sismologia e Ing. Sismica, ICE; Rodrigo Saenz and E. Fernández, OVSICORI-UNA.
Rabaul (Papua New Guinea) — September 1988 Cite this Report
Rabaul
Papua New Guinea
4.2459°S, 152.1937°E; summit elev. 688 m
All times are local (unless otherwise noted)
Seismicity declines but remains above normal
"Seismicity subsided in September but was still above normal levels. A total of 353 events was recorded in September. Most days, less than ~20 events were detected, but 60 were recorded on the 29th. Twelve events could be located, distributed on the NW, NE, and SE portions of the caldera seismic zone. Levelling measurements showed slight uplift (maximum 5 mm) of SE Matupit Island between 16 August and 20 September, and slight subsidence of a few millimeters between Rabaul town and Matupit Island. EDM results indicated little change during the month except at the entrance to Greet Harbour where slight expansion (~10 microstrain) was recorded."
Geologic Background. The low-lying Rabaul caldera on the tip of the Gazelle Peninsula at the NE end of New Britain forms a broad sheltered harbor utilized by what was the island's largest city prior to a major eruption in 1994. The outer flanks of the asymmetrical shield volcano are formed by thick pyroclastic-flow deposits. The 8 x 14 km caldera is widely breached on the east, where its floor is flooded by Blanche Bay and was formed about 1,400 years ago. An earlier caldera-forming eruption about 7,100 years ago is thought to have originated from Tavui caldera, offshore to the north. Three small stratovolcanoes lie outside the N and NE caldera rims. Post-caldera eruptions built basaltic-to-dacitic pyroclastic cones on the caldera floor near the NE and W caldera walls. Several of these, including Vulcan cone, which was formed during a large eruption in 1878, have produced major explosive activity during historical time. A powerful explosive eruption in 1994 occurred simultaneously from Vulcan and Tavurvur volcanoes and forced the temporary abandonment of Rabaul city.
Information Contacts: C. McKee and P. Lowenstein, RVO.
Ruapehu (New Zealand) — September 1988 Cite this Report
Ruapehu
New Zealand
39.28°S, 175.57°E; summit elev. 2797 m
All times are local (unless otherwise noted)
Coldest recorded crater lake temperature
When geologists visited Ruapehu on 15 September, Crater Lake's temperature was 10°C, a decrease of 4° since August and the lowest temperature on record. Geologists attributed this decrease to continuing low heat flow aided by recent cold weather. No central convection was evident in the lake . One of at least three remaining convection cells in the N portion of the lake produced a strand of yellow sulfur. Since mid-l986, Mg/Cl ratios have remained near 0.06-0.07, suggesting heating of the lake by steam rather than by direct magma-water interaction.
Geologists noted that similar slow declines in activity over the past 8 years have usually been followed closely by rapid lake reheating.
Geologic Background. Ruapehu, one of New Zealand's most active volcanoes, is a complex stratovolcano constructed during at least four cone-building episodes dating back to about 200,000 years ago. The dominantly andesitic 110 km3 volcanic massif is elongated in a NNE-SSW direction and surrounded by another 100 km3 ring plain of volcaniclastic debris, including the NW-flank Murimoto debris-avalanche deposit. A series of subplinian eruptions took place between about 22,600 and 10,000 years ago, but pyroclastic flows have been infrequent. The broad summait area and flank contain at least six vents active during the Holocene. Frequent mild-to-moderate explosive eruptions have been recorded from the Te Wai a-Moe (Crater Lake) vent, and tephra characteristics suggest that the crater lake may have formed as recently as 3,000 years ago. Lahars resulting from phreatic eruptions at the summit crater lake are a hazard to a ski area on the upper flanks and lower river valleys.
Information Contacts: P. Otway, NZGS Wairakei.
Nevado del Ruiz (Colombia) — September 1988 Cite this Report
Nevado del Ruiz
Colombia
4.892°N, 75.324°W; summit elev. 5279 m
All times are local (unless otherwise noted)
Small ash emissions; continued strong seismicity
The number of high- and low-frequency seismic events increased in September. Although seismic energy release declined slightly from August, energy release has risen substantially during 1988 (figure 18). Most September seismicity was centered ~4 km SE of the crater at depths of 0.5-7 km. A high-frequency earthquake swarm 2 km SE of the crater occurred 18 September. Brief increases in tremor were associated with small ash emissions. Tremor amplitude was at one of the year's highest levels. SO2 emissions averaged 2,870, up from 2,139 t/d in August (figure 19). No significant deformation was recorded.
Geologic Background. Nevado del Ruiz is a broad, glacier-covered volcano in central Colombia that covers more than 200 km2. Three major edifices, composed of andesitic and dacitic lavas and andesitic pyroclastics, have been constructed since the beginning of the Pleistocene. The modern cone consists of a broad cluster of lava domes built within the caldera of an older edifice. The 1-km-wide, 240-m-deep Arenas crater occupies the summit. The prominent La Olleta pyroclastic cone located on the SW flank may also have been active in historical time. Steep headwalls of massive landslides cut the flanks. Melting of its summit icecap during historical eruptions, which date back to the 16th century, has resulted in devastating lahars, including one in 1985 that was South America's deadliest eruption.
Information Contacts: C. Carvajal, INGEOMINAS, Manizales.
Siple (Antarctica) — September 1988 Cite this Report
Siple
Antarctica
73.43°S, 126.67°W; summit elev. 3110 m
All times are local (unless otherwise noted)
Apparent ash plumes detected by satellite imagery
Apparent ash plumes from Mt. Siple were detected by NOAA 10 satellite imagery (visible band, orbit 10406) on 18 September at 1301 and again on 4 October at 1534 (infrared and visible bands, orbit 10636). The 4 October plume extended ~160-170 km WNW and was well-defined, but it was uncertain whether the plume originated from the volcano's summit or base [but see 13:12]. A review of past LANDSAT images indicated a possible February 1988 ash deposit on the ice near the volcano. Michael Matson and George Stephens are currently applying additional satellite data aquisition and reduction techniques to refine these interpretations.
. . . Geologists hope to visit the volcano in November.
Geologic Background. Mount Siple is a shield volcano that forms an island along the Pacific Ocean coast of Antarctica's Marie Byrd Land. The massive 1,800 km3 volcano is truncated by a 4-5 km summit caldera and is ringed by tuff cones at sea level. A possible eruption cloud observed on satellite images on 18 September and 4 October 1988 was considered to result from atmospheric effects, after low-level aerial observations revealed no evidence of recent eruptions. Trachytic rocks at the summit have been Ar-Ar dated to about 227,000 and 169,000 years old.
Information Contacts: W. Gould, M. Matson, and G. Stephens, NOAA; W. LeMasurier, Univ of Colorado.