Recently Published Bulletin Reports
Kadovar (Papua New Guinea) An ash plume and weak thermal anomaly during May 2023
San Miguel (El Salvador) Small gas-and-ash explosions during March and May 2023
Ebeko (Russia) Continued explosions, ash plumes, and ashfall during October 2022-May 2023
Home Reef (Tonga) Discolored plumes continued during November 2022-April 2023
Semisopochnoi (United States) Occasional explosions, ash deposits, and gas-and-steam plumes during December 2022-May 2023
Ambae (Vanuatu) New lava flow, ash plumes, and sulfur dioxide plumes during February-May 2023
Ibu (Indonesia) Daily ash explosions continue, along with thermal anomalies in the crater, October 2022-May 2023
Dukono (Indonesia) Continuing ash emissions, SO2 plumes, and thermal signals during October 2022-May 2023
Sabancaya (Peru) Explosions, gas-and-ash plumes, and thermal activity persist during November 2022-April 2023
Sheveluch (Russia) Significant explosions destroyed part of the lava-dome complex during April 2023
Bezymianny (Russia) Explosions, ash plumes, lava flows, and avalanches during November 2022-April 2023
Chikurachki (Russia) New explosive eruption during late January-early February 2023
Kadovar (Papua New Guinea) — June 2023  Cite this Report
Kadovar
Papua New Guinea
3.608°S, 144.588°E; summit elev. 365 m
All times are local (unless otherwise noted)
An ash plume and weak thermal anomaly during May 2023
Kadovar is a 2-km-wide island that is the emergent summit of a Bismarck Sea stratovolcano. It lies off the coast of New Guinea, about 25 km N of the mouth of the Sepik River. Prior to an eruption that began in 2018, a lava dome formed the high point of the volcano, filling an arcuate landslide scarp open to the S. Submarine debris-avalanche deposits occur to the S of the island. The current eruption began in January 2018 and has comprised lava effusion from vents at the summit and at the E coast; more recent activity has consisted of ash plumes, weak thermal activity, and gas-and-steam plumes (BGVN 48:02). This report covers activity during February through May 2023 using information from the Darwin Volcanic Ash Advisory Center (VAAC) and satellite data.
Activity during the reporting period was relatively low and mainly consisted of white gas-and-steam plumes that were visible in natural color satellite images on clear weather days (figure 67). According to a Darwin VAAC report, at 2040 on 6 May an ash plume rose to 4.6 km altitude and drifted W; by 2300 the plume had dissipated. MODIS satellite instruments using the MODVOLC thermal algorithm detected a single thermal hotspot on the SE side of the island on 7 May. Weak thermal activity was also detected in a satellite image on the E side of the island on 14 May, accompanied by a white gas-and-steam plume that drifted SE (figure 68).
Geologic Background. The 2-km-wide island of Kadovar is the emergent summit of a Bismarck Sea stratovolcano of Holocene age. It is part of the Schouten Islands, and lies off the coast of New Guinea, about 25 km N of the mouth of the Sepik River. Prior to an eruption that began in 2018, a lava dome formed the high point of the andesitic volcano, filling an arcuate landslide scarp open to the south; submarine debris-avalanche deposits occur in that direction. Thick lava flows with columnar jointing forms low cliffs along the coast. The youthful island lacks fringing or offshore reefs. A period of heightened thermal phenomena took place in 1976. An eruption began in January 2018 that included lava effusion from vents at the summit and at the E coast.
Information Contacts: Darwin Volcanic Ash Advisory Centre (VAAC), Bureau of Meteorology, Northern Territory Regional Office, PO Box 40050, Casuarina, NT 0811, Australia (URL: http://www.bom.gov.au/info/vaac/); Hawai'i Institute of Geophysics and Planetology (HIGP) - MODVOLC Thermal Alerts System, School of Ocean and Earth Science and Technology (SOEST), Univ. of Hawai'i, 2525 Correa Road, Honolulu, HI 96822, USA (URL: http://modis.higp.hawaii.edu/); Copernicus Browser, Copernicus Data Space Ecosystem, European Space Agency (URL: https://dataspace.copernicus.eu/browser/).
San Miguel (El Salvador) — June 2023 Cite this Report
San Miguel
El Salvador
13.434°N, 88.269°W; summit elev. 2130 m
All times are local (unless otherwise noted)
Small gas-and-ash explosions during March and May 2023
San Miguel in El Salvador is a broad, deep crater complex that has been frequently modified by eruptions recorded since the early 16th century and consists of the summit known locally as Chaparrastique. Flank eruptions have produced lava flows that extended to the N, NE, and SE during the 17-19th centuries. The most recent activity has consisted of minor ash eruptions from the summit crater. The current eruption period began in November 2022 and has been characterized by frequent phreatic explosions, gas-and-ash emissions, and sulfur dioxide plumes (BGVN 47:12). This report describes small gas-and-ash explosions during December 2022 through May 2023 based on special reports from the Ministero de Medio Ambiente y Recursos Naturales (MARN).
Activity has been relatively low since the last recorded explosions on 29 November 2022. Seismicity recorded by the San Miguel Volcano Station (VSM) located on the N flank at 1.7 km elevation had decreased by 7 December. Sulfur dioxide gas measurements taken with DOAS (Differential Optical Absorption Spectroscopy) mobile equipment were below typical previously recorded values: 300 tons per day (t/d). During December, small explosions were recorded by the seismic network and manifested as gas-and-steam emissions.
Gas-and-ash explosions in the crater occurred during January 2023, which were recorded by the seismic network. Sulfur dioxide values remained low, between 300-400 t/d through 10 March. At 0817 on 14 January a gas-and-ash emission was visible in webcam images, rising just above the crater rim. Some mornings during February, small gas-and-steam plumes were visible in the crater. On 7 March at 2252 MARN noted an increase in degassing from the central crater; gas emissions were constantly observed through the early morning hours on 8 March. During the early morning of 8 March through the afternoon on 9 March, 12 emissions were registered, some accompanied by ash. The last gas-and-ash emission was recorded at 1210 on 9 March; very fine ashfall was reported in El Tránsito (10 km S), La Morita (6 km W), and La Piedrita (3 km W). The smell of sulfur was reported in Piedra Azul (5 km SW). On 16 March MARN reported that gas-and-steam emissions decreased.
Low degassing and very low seismicity were reported during April; no explosions have been detected between 9 March and 27 May. The sulfur dioxide emissions remained between 350-400 t/d; during 13-20 April sulfur dioxide values fluctuated between 30-300 t/d. Activity remained low through most of May; on 23 May seismicity increased. An explosion was detected at 1647 on 27 May generated a gas-and-ash plume that rose 700 m high (figure 32); a decrease in seismicity and gas emissions followed. The DOAS station installed on the W flank recorded sulfur dioxide values that reached 400 t/d on 27 May; subsequent measurements showed a decrease to 268 t/d on 28 May and 100 t/d on 29 May.
Geologic Background. The symmetrical cone of San Miguel, one of the most active volcanoes in El Salvador, rises from near sea level to form one of the country's most prominent landmarks. A broad, deep, crater complex that has been frequently modified by eruptions recorded since the early 16th century caps the truncated unvegetated summit, also known locally as Chaparrastique. Flanks eruptions of the basaltic-andesitic volcano have produced many lava flows, including several during the 17th-19th centuries that extended to the N, NE, and SE. The SE-flank flows are the largest and form broad, sparsely vegetated lava fields crossed by highways and a railroad skirting the base of the volcano. Flank vent locations have migrated higher on the edifice during historical time, and the most recent activity has consisted of minor ash eruptions from the summit crater.
Information Contacts: Ministero de Medio Ambiente y Recursos Naturales (MARN), Km. 5½ Carretera a Nueva San Salvador, Avenida las Mercedes, San Salvador, El Salvador (URL: http://www.snet.gob.sv/ver/vulcanologia).
Ebeko
Russia
50.686°N, 156.014°E; summit elev. 1103 m
All times are local (unless otherwise noted)
Continued explosions, ash plumes, and ashfall during October 2022-May 2023
Ebeko, located on the N end of Paramushir Island in the Kuril Islands, consists of three summit craters along a SSW-NNE line at the northern end of a complex of five volcanic cones. Eruptions date back to the late 18th century and have been characterized as small-to-moderate explosions from the summit crater, accompanied by intense fumarolic activity. The current eruption period began in June 2022 and has recently consisted of frequent explosions, ash plumes, and thermal activity (BGVN 47:10). This report covers similar activity during October 2022 through May 2023, based on information from the Kamchatka Volcanic Eruptions Response Team (KVERT) and satellite data.
Activity during October consisted of explosive activity, ash plumes, and occasional thermal anomalies. Visual data by volcanologists from Severo-Kurilsk showed explosions producing ash clouds up to 2.1-3 km altitude which drifted E, N, NE, and SE during 1-8, 10, 16, and 18 October. KVERT issued several Volcano Observatory Notices for Aviation (VONA) on 7, 13-15, and 27 October 2022, stating that explosions generated ash plumes that rose to 2.3-4 km altitude and drifted 5 km E, NE, and SE. Ashfall was reported in Severo-Kurilsk (Paramushir Island, about 7 km E) on 7 and 13 October. Satellite data showed a thermal anomaly over the volcano on 15-16 October. Visual data showed ash plumes rising to 2.5-3.6 km altitude on 22, 25-29, and 31 October and moving NE due to constant explosions.
Similar activity continued during November, with explosions, ash plumes, and ashfall occurring. KVERT issued VONAs on 1-2, 4, 6-7, 9, 13, and 16 November that reported explosions and resulting ash plumes that rose to 1.7-3.6 km altitude and drifted 3-5 km SE, ESE, E, and NE. On 1 November ash plumes extended as far as 110 km SE. On 5, 8, 12, and 24-25 November explosions and ash plumes rose to 2-3.1 km altitude and drifted N and E. Ashfall was observed in Severo-Kurilsk on 7 and 16 November. A thermal anomaly was visible during 1-4, 16, and 20 November. Explosions during 26 November rose as high as 2.7 km altitude and drifted NE (figure 45).
Explosions and ash plumes continued to occur in December. During 1-2 and 4 December volcanologists from Severo-Kurilsk observed explosions that sent ash to 1.9-2.5 km altitude and drifted NE and SE (figure 46). VONAs were issued on 5, 9, and 16 December reporting that explosions generated ash plumes rising to 1.9 km, 2.6 km, and 2.4 km altitude and drifted 5 km SE, E, and NE, respectively. A thermal anomaly was visible in satellite imagery on 16 December. On 18 and 27-28 December explosions produced ash plumes that rose to 2.5 km altitude and drifted NE and SE. On 31 December an ash plume rose to 2 km altitude and drifted NE.
Explosions continued during January 2023, based on visual observations by volcanologists from Severo-Kurilsk. During 1-7 January explosions generated ash plumes that rose to 4 km altitude and drifted NE, E, W, and SE. According to VONAs issued by KVERT on 2, 4, 10, and 23 January, explosions produced ash plumes that rose to 2-4 km altitude and drifted 5 km N, NE, E, and ENE; the ash plume that rose to 4 km altitude occurred on 10 January (figure 47). Satellite data showed a thermal anomaly during 3-4, 10, 13, 16, 21, 22, and 31 January. KVERT reported that an ash cloud on 4 January moved 12 km NE. On 6 and 9-11 January explosions sent ash plumes to 4.5 km altitude and drifted W and ESE. On 13 January an ash plume rose to 3 km altitude and drifted SE. During 20-24 January ash plumes from explosions rose to 3.7 km altitude and drifted SE, N, and NE. On 21 January the ash plume drifted as far as 40 km NE. During 28-29 and 31 January and 1 February ash plumes rose to 4 km altitude and drifted NE.
During February, explosions, ash plumes, and ashfall were reported. During 1, 4-5 and 7-8 February explosions generated ash plumes that rose to 4.5 km altitude and drifted E and NE; ashfall was observed on 5 and 8 February. On 6 February an explosion produced an ash plume that rose to 3 km altitude and drifted 7 km E, causing ashfall in Severo-Kurilsk. A thermal anomaly was visible in satellite data on 8, 9, 13, and 21 February. Explosions on 9 and 12-13 February produced ash plumes that rose to 4 km altitude and drifted E and NE; the ash cloud on 12 February extended as far as 45 km E. On 22 February explosions sent ash to 3 km altitude that drifted E. During 24 and 26-27 February ash plumes rose to 4 km altitude and drifted E. On 28 February an explosion sent ash to 2.5-3 km altitude and drifted 5 km E; ashfall was observed in Severo-Kurilsk.
Activity continued during March; visual observations showed that explosions generated ash plumes that rose to 3.6 km altitude on 3, 5-7, and 9-12 March and drifted E, NE, and NW. Thermal anomalies were visible on 10, 13, and 29-30 March in satellite imagery. On 18, 21-23, 26, and 29-30 March explosions produced ash plumes that rose to 2.8 km altitude and drifted NE and E; the ash plumes during 22-23 March extended up to 76 km E. A VONA issued on 21 March reported an explosion that produced an ash plume that rose to 2.8 km altitude and drifted 5 km E. Another VONA issued on 23 March reported that satellite data showed an ash plume rising to 3 km altitude and drifted 14 km E.
Explosions during April continued to generate ash plumes. On 1 and 4 April an ash plume rose to 2.8-3.5 km altitude and drifted SE and NE. A thermal anomaly was visible in satellite imagery during 1-6 April. Satellite data showed ash plumes and clouds rising to 2-3 km altitude and drifting up to 12 km SW and E on 3 and 6 April (figure 48). KVERT issued VONAs on 3, 5, 14, 16 April describing explosions that produced ash plumes rising to 3 km, 3.5 km, 3.5 km, and 3 km altitude and drifting 5 km S, 5 km NE and SE, 72 km NNE, and 5 km NE, respectively. According to satellite data, the resulting ash cloud from the explosion on 14 April was 25 x 7 km in size and drifted 72-104 km NNE during 14-15 April. According to visual data by volcanologists from Severo-Kurilsk explosions sent ash up to 3.5 km altitude that drifted NE and E during 15-16, 22, 25-26, and 29 April.
The explosive eruption continued during May. Explosions during 3-4, 6-7, and 9-10 May generated ash plumes that rose to 4 km altitude and drifted SW and E. Satellite data showed a thermal anomaly on 3, 9, 13-14, and 24 May. During 12-16, 23-25, and 27-28 May ash plumes rose to 3.5 km altitude and drifted in different directions due to explosions. Two VONA notices were issued on 16 and 25 May, describing explosions that generated ash plumes rising to 3 km and 3.5 km altitude, respectively and extending 5 km E. The ash cloud on 25 May drifted 75 km SE.
Thermal activity in the summit crater, occasionally accompanied by ash plumes and ash deposits on the SE and E flanks due to frequent explosions, were visible in infrared and true color satellite images (figure 49).
Geologic Background. The flat-topped summit of the central cone of Ebeko volcano, one of the most active in the Kuril Islands, occupies the northern end of Paramushir Island. Three summit craters located along a SSW-NNE line form Ebeko volcano proper, at the northern end of a complex of five volcanic cones. Blocky lava flows extend west from Ebeko and SE from the neighboring Nezametnyi cone. The eastern part of the southern crater contains strong solfataras and a large boiling spring. The central crater is filled by a lake about 20 m deep whose shores are lined with steaming solfataras; the northern crater lies across a narrow, low barrier from the central crater and contains a small, cold crescentic lake. Historical activity, recorded since the late-18th century, has been restricted to small-to-moderate explosive eruptions from the summit craters. Intense fumarolic activity occurs in the summit craters, on the outer flanks of the cone, and in lateral explosion craters.
Information Contacts: Kamchatka Volcanic Eruptions Response Team (KVERT), Far Eastern Branch, Russian Academy of Sciences, 9 Piip Blvd., Petropavlovsk-Kamchatsky, 683006, Russia (URL: http://www.kscnet.ru/ivs/kvert/); MIROVA (Middle InfraRed Observation of Volcanic Activity), a collaborative project between the Universities of Turin and Florence (Italy) supported by the Centre for Volcanic Risk of the Italian Civil Protection Department (URL: http://www.mirovaweb.it/); Copernicus Browser, Copernicus Data Space Ecosystem, European Space Agency (URL: https://dataspace.copernicus.eu/browser/).
Home Reef
Tonga
18.992°S, 174.775°W; summit elev. -10 m
All times are local (unless otherwise noted)
Discolored plumes continued during November 2022-April 2023
Home Reef is a submarine volcano located in the central Tonga islands between Lateiki (Metis Shoal) and Late Island. The first recorded eruption occurred in the mid-19th century, when an ephemeral island formed. An eruption in 1984 produced a 12-km-high eruption plume, a large volume of floating pumice, and an ephemeral island 500 x 1,500 m wide, with cliffs 30-50 m high that enclosed a water-filled crater. Another island-forming eruption in 2006 produced widespread pumice rafts that drifted as far as Australia; by 2008 the island had eroded below sea level. The previous eruption occurred during October 2022 and was characterized by a new island-forming eruption, lava effusion, ash plumes, discolored water, and gas-and-steam plumes (BGVN 47:11). This report covers discolored water plumes during November 2022 through April 2023 using satellite data.
Discolored plumes continued during the reporting period and were observed in true color satellite images on clear weather days. Satellite images show light green-yellow discolored water extending W on 8 and 28 November 2022 (figure 31), and SW on 18 November. Light green-yellow plumes extended W on 3 December, S on 13 December, SW on 18 December, and W and S on 23 December (figure 31). On 12 January 2023 discolored green-yellow plumes extended to the NE, E, SE, and N. The plume moved SE on 17 January and NW on 22 January. Faint discolored water in February was visible moving NE on 1 February. A discolored plume extended NW on 8 and 28 March and NW on 13 March (figure 31). During April, clear weather showed green-blue discolored plumes moving S on 2 April, W on 7 April, and NE and S on 12 April. A strong green-yellow discolored plume extended E and NE on 22 April for several kilometers (figure 31).
Geologic Background. Home Reef, a submarine volcano midway between Metis Shoal and Late Island in the central Tonga islands, was first reported active in the mid-19th century, when an ephemeral island formed. An eruption in 1984 produced a 12-km-high eruption plume, large amounts of floating pumice, and an ephemeral 500 x 1,500 m island, with cliffs 30-50 m high that enclosed a water-filled crater. In 2006 an island-forming eruption produced widespread dacitic pumice rafts that drifted as far as Australia. Another island was built during a September-October 2022 eruption.
Information Contacts: Copernicus Browser, Copernicus Data Space Ecosystem, European Space Agency (URL: https://dataspace.copernicus.eu/browser/).
Semisopochnoi (United States) — June 2023 Cite this Report
Semisopochnoi
United States
51.93°N, 179.58°E; summit elev. 1221 m
All times are local (unless otherwise noted)
Occasional explosions, ash deposits, and gas-and-steam plumes during December 2022-May 2023
Semisopochnoi is located in the western Aleutians, is 20-km-wide at sea level, and contains an 8-km-wide caldera. The three-peaked Mount Young (formerly Cerberus) was constructed within the caldera during the Holocene. Each of these peaks contains a summit crater; the lava flows on the N flank appear younger than those on the S side. The current eruption period began in early February 2021 and has more recently consisted of intermittent explosions and ash emissions (BGVN 47:12). This report updates activity during December 2022 through May 2023 using daily, weekly, and special reports from the Alaska Volcano Observatory (AVO). AVO monitors the volcano using local seismic and infrasound sensors, satellite data, web cameras, and remote infrasound and lightning networks.
Activity during most of December 2022 was relatively quiet; according to AVO no eruptive or explosive activity was observed since 7 November 2022. Intermittent tremor and occasional small earthquakes were observed in geophysical data. Continuous gas-and-steam emissions were observed from the N crater of Mount Young in webcam images on clear weather days (figure 25). On 24 December, there was a slight increase in earthquake activity and several small possible explosion signals were detected in infrasound data. Eruptive activity resumed on 27 December at the N crater of Mount Young; AVO issued a Volcano Activity Notice (VAN) that reported minor ash deposits on the flanks of Mount Young that extended as far as 1 km from the vent, according to webcam images taken during 27-28 December (figure 26). No ash plumes were observed in webcam or satellite imagery, but a persistent gas-and-steam plume that might have contained some ash rose to 1.5 km altitude. As a result, AVO raised the Aviation Color Code (ACC) to Orange (the second highest level on a four-color scale) and the Volcano Alert Level (VAL) to Watch (the second highest level on a four-level scale). Possible explosions were detected during 21 December 2022 through 1 January 2023 and seismic tremor was recorded during 30-31 December.
During January 2023 eruptive activity continued at the active N crater of Mount Young. Minor ash deposits were observed on the flanks, extending about 2 km SSW, based on webcam images from 1 and 3 January. A possible explosion occurred during 1-2 January based on elevated seismicity recorded on local seismometers and an infrasound signal recorded minutes later by an array at Adak. Though no ash plumes were observed in webcam or satellite imagery, a persistent gas-and-steam plume rose to 1.5 km altitude that might have carried minor traces of ash. Ash deposits were accompanied by periods of elevated seismicity and infrasound signals from the local geophysical network, which AVO reported were likely due to weak explosive activity. Low-level explosive activity was also detected during 2-3 January, with minor gas-and-steam emissions and a new ash deposit that was visible in webcam images. Low-level explosive activity was detected in geophysical data during 4-5 January, with elevated seismicity and infrasound signals observed on local stations. Volcanic tremor was detected during 7-9 January and very weak explosive activity was detected in seismic and infrasound data on 9 January. Weak seismic and infrasound signals were recorded on 17 January, which indicated minor explosive activity, but no ash emissions were observed in clear webcam images; a gas-and-steam plume continued to rise to 1.5 km altitude. During 29-30 January, ash deposits near the summit were observed on fresh snow, according to webcam images.
The active N cone at Mount Young continued to produce a gas-and-steam plume during February, but no ash emissions or explosive events were detected. Seismicity remained elevated with faint tremor during early February. Gas-and-steam emissions from the N crater were observed in clear webcam images on 11-13 and 16 February; no explosive activity was detected in seismic, infrasound, or satellite data. Seismicity has also decreased, with no significant seismic tremor observed since 25 January. Therefore, the ACC was lowered to Yellow (the second lowest level on a four-color scale) and the VAL was lowered to Advisory (the second lowest level on a four-color scale) on 22 February.
Gas-and-steam emissions persisted during March from the N cone of Mount Young, based on clear webcam images. A few brief episodes of weak tremor were detected in seismic data, although seismicity decreased over the month. A gas-and-steam plume detected in satellite data extended 150 km on 18 March. Low-level ash emissions from the N cone at Mount Young were observed in several webcam images during 18-19 March, in addition to small explosions and volcanic tremor. The ACC was raised to Orange and the VAL increased to Watch on 19 March. A small explosion was detected in seismic and infrasound data on 21 March.
Low-level unrest continued during April, although cloudy weather often obscured views of the summit; periods of seismic tremor and local earthquakes were recorded. During 3-4 April a gas-and-steam plume was visible traveling more than 200 km overnight; no ash was evident in the plume, according to AVO. A gas-and-steam plume was observed during 4-6 April that extended 400 km but did not seem to contain ash. Small explosions were detected in seismic and infrasound data on 5 April. Occasional clear webcam images showed continuing gas-and-steam emissions rose from Mount Young, but no ash deposits were observed on the snow. On 19 April small explosions and tremor were detected in seismic and infrasound data. A period of seismic tremor was detected during 22-25 April, with possible weak explosions on 25 April. Ash deposits were visible near the crater rim, but it was unclear if these deposits were recent or due to older deposits.
Occasional small earthquakes were recorded during May, but there were no signs of explosive activity seen in geophysical data. Gas-and-steam emissions continued from the N crater of Mount Young, based on webcam images, and seismicity remained slightly elevated. A new, light ash deposit was visible during the morning of 5 May on fresh snow on the NW flank of Mount Young. During 10 May periods of volcanic tremor were observed. The ACC was lowered to Yellow and the VAL to Advisory on 17 May due to no additional evidence of activity.
Geologic Background. Semisopochnoi, the largest subaerial volcano of the western Aleutians, is 20 km wide at sea level and contains an 8-km-wide caldera. It formed as a result of collapse of a low-angle, dominantly basaltic volcano following the eruption of a large volume of dacitic pumice. The high point of the island is Anvil Peak, a double-peaked late-Pleistocene cone that forms much of the island's northern part. The three-peaked Mount Cerberus (renamed Mount Young in 2023) was constructed within the caldera during the Holocene. Each of the peaks contains a summit crater; lava flows on the N flank appear younger than those on the south side. Other post-caldera volcanoes include the symmetrical Sugarloaf Peak SSE of the caldera and Lakeshore Cone, a small cinder cone at the edge of Fenner Lake in the NE part of the caldera. Most documented eruptions have originated from Young, although Coats (1950) considered that both Sugarloaf and Lakeshore Cone could have been recently active.
Information Contacts: Alaska Volcano Observatory (AVO), a cooperative program of a) U.S. Geological Survey, 4200 University Drive, Anchorage, AK 99508-4667 USA (URL: https://avo.alaska.edu/), b) Geophysical Institute, University of Alaska, PO Box 757320, Fairbanks, AK 99775-7320, USA, and c) Alaska Division of Geological & Geophysical Surveys, 794 University Ave., Suite 200, Fairbanks, AK 99709, USA (URL: http://dggs.alaska.gov/).
Ambae
Vanuatu
15.389°S, 167.835°E; summit elev. 1496 m
All times are local (unless otherwise noted)
New lava flow, ash plumes, and sulfur dioxide plumes during February-May 2023
Ambae, also known as Aoba, is a large basaltic shield volcano in Vanuatu. A broad pyroclastic cone containing three crater lakes (Manaro Ngoru, Voui, and Manaro Lakua) is located at the summit within the youngest of at least two nested calderas. Periodic phreatic and pyroclastic explosions have been reported since the 16th century. A large eruption more than 400 years ago resulted in a volcanic cone within the summit crater that is now filled by Lake Voui; the similarly sized Lake Manaro fills the western third of the caldera. The previous eruption ended in August 2022 that was characterized by gas-and-steam and ash emissions and explosions of wet tephra (BGVN 47:10). This report covers a new eruption during February through May 2023 that consisted of a new lava flow, ash plumes, and sulfur dioxide emissions, using information from the Vanuatu Meteorology and Geo-Hazards Department (VMGD) and satellite data.
During the reporting period, the Alert Level remained at a 2 (on a scale of 0-5), which has been in place since December 2021. Activity during October 2022 through March 2023 remained relatively low and mostly consisted of gas-and-steam emissions in Lake Voui. VMGD reported that at 1300 on 15 November a satellite image captured a strong amount of sulfur dioxide rising above the volcano (figure 99), and that seismicity slightly increased. The southern and northern part of the island reported a strong sulfur dioxide smell and heard explosions. On 20 February 2023 a gas-and-ash plume rose 1.3 km above the summit and drifted SSW, according to a webcam image (figure 100). Gas-and-steam and possibly ash emissions continued on 23 February and volcanic earthquakes were recorded by the seismic network.
During April, volcanic earthquakes and gas-and-steam and ash emissions were reported from the cone in Lake Voui. VMGD reported that activity increased during 5-7 April; high gas-and-steam and ash plumes were visible, accompanied by nighttime incandescence. According to a Wellington VAAC report, a low-level ash plume rose as high as 2.5 km above the summit and drifted W and SW on 5 April, based on satellite imagery. Reports in Saratamata stated that a dark ash plume drifted to the WSW, but no loud explosion was heard. Webcam images from 2100 showed incandescence above the crater and reflected in the clouds. According to an aerial survey, field observations, and satellite data, water was no longer present in the lake. A lava flow was reported effusing from the vent and traveling N into the dry Lake Voui, which lasted three days. The next morning at 0745 on 6 April a gas-and-steam and ash plume rose 5.4 km above the summit and drifted ESE, based on information from VMGD (figure 101). The Wellington VAAC also reported that light ashfall was observed on the island. Intermittent gas-and-steam and ash emissions were visible on 7 April, some of which rose to an estimated 3 km above the summit and drifted E. Webcam images during 0107-0730 on 7 April showed continuing ash emissions. A gas-and-steam and ash plume rose 695 m above the summit crater at 0730 on 19 April and drifted ESE, based on a webcam image (figure 102).
According to visual and infrared satellite data, water was visible in Lake Voui as late as 24 March 2023 (figure 103). The vent in the caldera showed a gas-and-steam plume drifted SE. On 3 April thermal activity was first detected, accompanied by a gas-and-ash plume that drifted W (figure 103). The lava flow moved N within the dry lake and was shown cooling by 8 April. By 23 April much of the water in the lake had returned. Occasional sulfur dioxide plumes were detected by the TROPOMI instrument on the Sentinel-5P satellite that exceeded 2 Dobson Units (DU) and drifted in different directions (figure 104).
Geologic Background. The island of Ambae, also known as Aoba, is a massive 2,500 km3 basaltic shield that is the most voluminous volcano of the New Hebrides archipelago. A pronounced NE-SW-trending rift zone with numerous scoria cones gives the 16 x 38 km island an elongated form. A broad pyroclastic cone containing three crater lakes (Manaro Ngoru, Voui, and Manaro Lakua) is located at the summit within the youngest of at least two nested calderas, the largest of which is 6 km in diameter. That large central edifice is also called Manaro Voui or Lombenben volcano. Post-caldera explosive eruptions formed the summit craters about 360 years ago. A tuff cone was constructed within Lake Voui (or Vui) about 60 years later. The latest known flank eruption, about 300 years ago, destroyed the population of the Nduindui area near the western coast.
Information Contacts: Geo-Hazards Division, Vanuatu Meteorology and Geo-Hazards Department (VMGD), Ministry of Climate Change Adaptation, Meteorology, Geo-Hazards, Energy, Environment and Disaster Management, Private Mail Bag 9054, Lini Highway, Port Vila, Vanuatu (URL: http://www.vmgd.gov.vu/, https://www.facebook.com/VanuatuGeohazardsObservatory/); Wellington Volcanic Ash Advisory Centre (VAAC), Meteorological Service of New Zealand Ltd (MetService), PO Box 722, Wellington, New Zealand (URL: http://www.metservice.com/vaac/, http://www.ssd.noaa.gov/VAAC/OTH/NZ/messages.html); MIROVA (Middle InfraRed Observation of Volcanic Activity), a collaborative project between the Universities of Turin and Florence (Italy) supported by the Centre for Volcanic Risk of the Italian Civil Protection Department (URL: http://www.mirovaweb.it/); Global Sulfur Dioxide Monitoring Page, Atmospheric Chemistry and Dynamics Laboratory, NASA Goddard Space Flight Center (NASA/GSFC), 8800 Greenbelt Road, Goddard, Maryland, USA (URL: https://so2.gsfc.nasa.gov/); Copernicus Browser, Copernicus Data Space Ecosystem, European Space Agency (URL: https://dataspace.copernicus.eu/browser/).
Ibu
Indonesia
1.488°N, 127.63°E; summit elev. 1325 m
All times are local (unless otherwise noted)
Daily ash explosions continue, along with thermal anomalies in the crater, October 2022-May 2023
Persistent eruptive activity since April 2008 at Ibu, a stratovolcano on Indonesian’s Halmahera Island, has consisted of daily explosive ash emissions and plumes, along with observations of thermal anomalies (BGVN 47:04). The current eruption continued during October 2022-May 2023, described below, based on advisories issued by the Pusat Vulkanologi dan Mitigasi Bencana Geologi (PVMBG, also known as Indonesian Center for Volcanology and Geological Hazard Mitigation, CVGHM), daily reports by MAGMA Indonesia (a PVMBG platform), and the Darwin Volcanic Ash Advisory Centre (VAAC), and various satellite data. The Alert Level during the reporting period remained at 2 (on a scale of 1-4), except raised briefly to 3 on 27 May, and the public was warned to stay at least 2 km away from the active crater and 3.5 km away on the N side of the volcano.
According to MAGMA Indonesia, during October 2022-May 2023, daily gray-and-white ash plumes of variable densities rose 200-1,000 m above the summit and drifted in multiple directions. On 30 October and 11 November, plumes rose a maximum of 2 km and 1.5 km above the summit, respectively (figures 42 and 43). According to the Darwin VAAC, discrete ash emissions on 13 November rose to 2.1 km altitude, or 800 m above the summit, and drifted W, and multiple ash emissions on 15 November rose 1.4 km above the summit and drifted NE. Occasional larger ash explosions through May 2023 prompted PVMBG to issue Volcano Observatory Notice for Aviation (VONA) alerts (table 6); the Aviation Color Code remained at Orange throughout this period.
Table 6. Volcano Observatory Notice for Aviation (VONA) ash plume alerts for Ibu issued by PVMBG during October 2022-May 2023. Maximum height above the summit was estimated by a ground observer. VONAs in January-May 2023 all described the ash plumes as dense.
| Date |
Time (local) |
Max height above summit |
Direction |
| 17 Oct 2022 |
0858 |
800 m |
SW |
| 18 Oct 2022 |
1425 |
800 m |
S |
| 19 Oct 2022 |
2017 |
600 m |
SW |
| 21 Oct 2022 |
0916 |
800 m |
NW |
| 16 Jan 2023 |
1959 |
600 m |
NE |
| 22 Jan 2023 |
0942 |
1,000 m |
E |
| 29 Jan 2023 |
2138 |
1,000 m |
E |
| 10 May 2023 |
0940 |
800 m |
NW |
| 10 May 2023 |
2035 |
600 m |
E |
| 21 May 2023 |
2021 |
600 m |
W |
| 21 May 2023 |
2140 |
1,000 m |
W |
| 29 May 2023 |
1342 |
800 m |
N |
| 31 May 2023 |
1011 |
1,000 m |
SW |
Sentinel-2 L1C satellite images throughout the reporting period show two, sometimes three persistent thermal anomalies in the summit crater, with the most prominent hotspot from the top of a cone within the crater. Clear views were more common during March-April 2023, when a vent and lava flows on the NE flank of the intra-crater cone could be distinguished (figure 44). White-to-grayish emissions were also observed during brief periods when weather clouds allowed clear views.
The MIROVA space-based volcano hotspot detection system recorded almost daily thermal anomalies throughout the reporting period, though cloud cover often interfered with detections. Data from imaging spectroradiometers aboard NASA’s Aqua and Terra satellites and processed using the MODVOLC algorithm (MODIS-MODVOLC) recorded hotspots on one day during October 2022 and December 2022, two days in April 2023, three days in November 2022 and May 2023, and four days in March 2023.
Geologic Background. The truncated summit of Gunung Ibu stratovolcano along the NW coast of Halmahera Island has large nested summit craters. The inner crater, 1 km wide and 400 m deep, has contained several small crater lakes. The 1.2-km-wide outer crater is breached on the N, creating a steep-walled valley. A large cone grew ENE of the summit, and a smaller one to the WSW has fed a lava flow down the W flank. A group of maars is located below the N and W flanks. The first observed and recorded eruption was a small explosion from the summit crater in 1911. Eruptive activity began again in December 1998, producing a lava dome that eventually covered much of the floor of the inner summit crater along with ongoing explosive ash emissions.
Information Contacts: Pusat Vulkanologi dan Mitigasi Bencana Geologi (PVMBG, also known as Indonesian Center for Volcanology and Geological Hazard Mitigation, CVGHM), Jalan Diponegoro 57, Bandung 40122, Indonesia (URL: http://www.vsi.esdm.go.id/); MAGMA Indonesia (Multiplatform Application for Geohazard Mitigation and Assessment in Indonesia), Kementerian Energi dan Sumber Daya Mineral (URL: https://magma.esdm.go.id/v1); Copernicus Browser, Copernicus Data Space Ecosystem, European Space Agency (URL: https://dataspace.copernicus.eu/browser/); MIROVA (Middle InfraRed Observation of Volcanic Activity), a collaborative project between the Universities of Turin and Florence (Italy) supported by the Centre for Volcanic Risk of the Italian Civil Protection Department (URL: http://www.mirovaweb.it/); Hawai'i Institute of Geophysics and Planetology (HIGP) - MODVOLC Thermal Alerts System, School of Ocean and Earth Science and Technology (SOEST), Univ. of Hawai'i, 2525 Correa Road, Honolulu, HI 96822, USA (URL: http://modis.higp.hawaii.edu/).
Dukono
Indonesia
1.6992°N, 127.8783°E; summit elev. 1273 m
All times are local (unless otherwise noted)
Continuing ash emissions, SO2 plumes, and thermal signals during October 2022-May 2023
Dukono, a remote volcano on Indonesia’s Halmahera Island, has been erupting continuously since 1933, with frequent ash explosions and sulfur dioxide plumes (BGVN 46:11, 47:10). This activity continued during October 2022 through May 2023, based on reports from the Pusat Vulkanologi dan Mitigasi Bencana Geologi (PVMBG; also known as Indonesian Center for Volcanology and Geological Hazard Mitigation, CVGHM), the Darwin Volcanic Ash Advisory Centre (VAAC), and satellite data. During this period, the Alert Level remained at 2 (on a scale of 1-4) and the public was warned to remain outside of the 2-km exclusion zone. The highest reported plume of the period reached 9.4 km above the summit on 14 November 2022.
According to MAGMA Indonesia (a platform developed by PVMBG), white, gray, or dark plumes of variable densities were observed almost every day during the reporting period, except when fog obscured the volcano (figure 33). Plumes generally rose 25-450 m above the summit, but rose as high as 700-800 m on several days, somewhat lower than the maximum heights reached earlier in 2022 when plumes reached as high as 1 km. However, the Darwin VAAC reported that on 14 November 2022, a discrete ash plume rose 9.4 km above the summit (10.7 km altitude), accompanied by a strong hotspot and a sulfur dioxide signal observed in satellite imagery; a continuous ash plume that day and through the 15th rose to 2.1-2.4 km altitude and drifted NE.
Sentinel-2 images were obscured by weather clouds almost every viewing day during the reporting period. However, the few reasonably clear images showed a hotspot and white or gray emissions and plumes. Strong SO2 plumes from Dukono were present on many days during October 2022-May 2023, as detected using the TROPOMI instrument on the Sentinel-5P satellite (figure 34).
Geologic Background. Reports from this remote volcano in northernmost Halmahera are rare, but Dukono has been one of Indonesia's most active volcanoes. More-or-less continuous explosive eruptions, sometimes accompanied by lava flows, have occurred since 1933. During a major eruption in 1550 CE, a lava flow filled in the strait between Halmahera and the N-flank Gunung Mamuya cone. This complex volcano presents a broad, low profile with multiple summit peaks and overlapping craters. Malupang Wariang, 1 km SW of the summit crater complex, contains a 700 x 570 m crater that has also been active during historical time.
Information Contacts: Pusat Vulkanologi dan Mitigasi Bencana Geologi (PVMBG, also known as Indonesian Center for Volcanology and Geological Hazard Mitigation, CVGHM), Jalan Diponegoro 57, Bandung 40122, Indonesia (URL: http://www.vsi.esdm.go.id/); MAGMA Indonesia (Multiplatform Application for Geohazard Mitigation and Assessment in Indonesia), Kementerian Energi dan Sumber Daya Mineral (URL: https://magma.esdm.go.id/v1); Darwin Volcanic Ash Advisory Centre (VAAC), Bureau of Meteorology, Northern Territory Regional Office, PO Box 40050, Casuarina, NT 0811, Australia (URL: http://www.bom.gov.au/info/vaac/); NASA Global Sulfur Dioxide Monitoring Page, Atmospheric Chemistry and Dynamics Laboratory, NASA Goddard Space Flight Center (NASA/GSFC), 8800 Greenbelt Road, Goddard, Maryland, USA (URL: https://so2.gsfc.nasa.gov/); Sentinel Hub Playground (URL: https://www.sentinel-hub.com/explore/sentinel-playground).
Sabancaya
Peru
15.787°S, 71.857°W; summit elev. 5960 m
All times are local (unless otherwise noted)
Explosions, gas-and-ash plumes, and thermal activity persist during November 2022-April 2023
Sabancaya is located in Peru, NE of Ampato and SE of Hualca Hualca. Eruptions date back to 1750 and have been characterized by explosions, phreatic activity, ash plumes, and ashfall. The current eruption period began in November 2016 and has more recently consisted of daily explosions, gas-and-ash plumes, and thermal activity (BGVN 47:11). This report updates activity during November 2022 through April 2023 using information from Instituto Geophysico del Peru (IGP) that use weekly activity reports and various satellite data.
Intermittent low-to-moderate power thermal anomalies were reported by the MIROVA project during November 2022 through April 2023 (figure 119). There were few short gaps in thermal activity during mid-December 2022, late December-to-early January 2023, late January to mid-February, and late February. According to data recorded by the MODVOLC thermal algorithm, there were a total of eight thermal hotspots: three in November 2022, three in February 2023, one in March, and one in April. On clear weather days, some of this thermal anomaly was visible in infrared satellite imagery showing the active lava dome in the summit crater (figure 120). Almost daily moderate-to-strong sulfur dioxide plumes were recorded during the reporting period by the TROPOMI instrument on the Sentinel-5P satellite (figure 121). Many of these plumes exceeded 2 Dobson Units (DU) and drifted in multiple directions.
IGP reported that moderate activity during November and December 2022 continued; during November, an average number of explosions were reported each week: 30, 33, 36, and 35, and during December, it was 32, 40, 47, 52, and 67. Gas-and-ash plumes in November rose 3-3.5 km above the summit and drifted E, NE, SE, S, N, W, and SW. During December the gas-and-ash plumes rose 2-4 km above the summit and drifted in different directions. There were 1,259 volcanic earthquakes recorded during November and 1,693 during December. Seismicity also included volcano-tectonic-type events that indicate rock fracturing events. Slight inflation was observed in the N part of the volcano near Hualca Hualca (4 km N). Thermal activity was frequently reported in the crater at the active lava dome (figure 120).
Explosive activity continued during January and February 2023. The average number of explosions were reported each week during January (51, 50, 60, and 59) and February (43, 54, 51, and 50). Gas-and-ash plumes rose 1.6-2.9 km above the summit and drifted NW, SW, and W during January and rose 1.4-2.8 above the summit and drifted W, SW, E, SE, N, S, NW, and NE during February. IGP also detected 1,881 volcanic earthquakes during January and 1,661 during February. VT-type earthquakes were also reported. Minor inflation persisted near Hualca Hualca. Satellite imagery showed continuous thermal activity in the crater at the lava dome (figure 120).
During March, the average number of explosions each week was 46, 48, 31, 35, and 22 and during April, it was 29, 41, 31, and 27. Accompanying gas-and-ash plumes rose 1.7-2.6 km above the summit crater and drifted W, SW, NW, S, and SE during March. According to a Buenos Aires Volcano Ash Advisory Center (VAAC) notice, on 22 March at 1800 through 23 March an ash plume rose to 7 km altitude and drifted NW. By 0430 an ash plume rose to 7.6 km altitude and drifted W. On 24 and 26 March continuous ash emissions rose to 7.3 km altitude and drifted SW and on 28 March ash emissions rose to 7.6 km altitude. During April, gas-and-ash plumes rose 1.6-2.5 km above the summit and drifted W, SW, S, NW, NE, and E. Frequent volcanic earthquakes were recorded, with 1,828 in March and 1,077 in April, in addition to VT-type events. Thermal activity continued to be reported in the summit crater at the lava dome (figure 120).
Geologic Background. Sabancaya, located in the saddle NE of Ampato and SE of Hualca Hualca volcanoes, is the youngest of these volcanic centers and the only one to have erupted in historical time. The oldest of the three, Nevado Hualca Hualca, is of probable late-Pliocene to early Pleistocene age. The name Sabancaya (meaning "tongue of fire" in the Quechua language) first appeared in records in 1595 CE, suggesting activity prior to that date. Holocene activity has consisted of Plinian eruptions followed by emission of voluminous andesitic and dacitic lava flows, which form an extensive apron around the volcano on all sides but the south. Records of historical eruptions date back to 1750.
Information Contacts: Instituto Geofisico del Peru (IGP), Centro Vulcanológico Nacional (CENVUL), Calle Badajoz N° 169 Urb. Mayorazgo IV Etapa, Ate, Lima 15012, Perú (URL: https://www.igp.gob.pe/servicios/centro-vulcanologico-nacional/inicio); Buenos Aires Volcanic Ash Advisory Center (VAAC), Servicio Meteorológico Nacional-Fuerza Aérea Argentina, 25 de mayo 658, Buenos Aires, Argentina (URL: http://www.smn.gov.ar/vaac/buenosaires/inicio.php); MIROVA (Middle InfraRed Observation of Volcanic Activity), a collaborative project between the Universities of Turin and Florence (Italy) supported by the Centre for Volcanic Risk of the Italian Civil Protection Department (URL: http://www.mirovaweb.it/); Hawai'i Institute of Geophysics and Planetology (HIGP) - MODVOLC Thermal Alerts System, School of Ocean and Earth Science and Technology (SOEST), Univ. of Hawai'i, 2525 Correa Road, Honolulu, HI 96822, USA (URL: http://modis.higp.hawaii.edu/); NASA Global Sulfur Dioxide Monitoring Page, Atmospheric Chemistry and Dynamics Laboratory, NASA Goddard Space Flight Center (NASA/GSFC), 8800 Greenbelt Road, Goddard MD 20771, USA (URL: https://so2.gsfc.nasa.gov/); Copernicus Browser, Copernicus Data Space Ecosystem, European Space Agency (URL: https://dataspace.copernicus.eu/browser/).
Sheveluch
Russia
56.653°N, 161.36°E; summit elev. 3283 m
All times are local (unless otherwise noted)
Significant explosions destroyed part of the lava-dome complex during April 2023
Sheveluch (also spelled Shiveluch) in Kamchatka, has had at least 60 large eruptions during the last 10,000 years. The summit is truncated by a broad 9-km-wide caldera that is breached to the S, and many lava domes occur on the outer flanks. The lava dome complex was constructed within the large open caldera. Frequent collapses of the dome complex have produced debris avalanches; the resulting deposits cover much of the caldera floor. A major south-flank collapse during a 1964 Plinian explosion produced a scarp in which a “Young Sheveluch” dome began to form in 1980. Repeated episodes of dome formation and destruction since then have produced major and minor ash plumes, pyroclastic flows, block-and-ash flows, and “whaleback domes” of spine-like extrusions in 1993 and 2020 (BGVN 45:11). The current eruption period began in August 1999 and has more recently consisted of lava dome growth, explosions, ash plumes, and avalanches (BGVN 48:01). This report covers a significant explosive eruption during early-to-mid-April 2023 that generated a 20 km altitude ash plume, produced a strong sulfur dioxide plume, and destroyed part of the lava-dome complex; activity described during January through April 2023 use information primarily from the Kamchatka Volcanic Eruptions Response Team (KVERT) and various satellite data.
Satellite data. Activity during the majority of this reporting period was characterized by continued lava dome growth, strong fumarole activity, explosions, and hot avalanches. According to the MODVOLC Thermal Alerts System, 140 hotspots were detected through the reporting period, with 33 recorded in January 2023, 29 in February, 44 in March, and 34 in April. Frequent strong thermal activity was recorded during January 2023 through April, according to the MIROVA (Middle InfraRed Observation of Volcanic Activity) graph and resulted from the continuously growing lava dome (figure 94). A slightly stronger pulse in thermal activity was detected in early-to-mid-April, which represented the significant eruption that destroyed part of the lava-dome complex. Thermal anomalies were also visible in infrared satellite imagery at the summit crater (figure 95).
During January 2023 KVERT reported continued growth of the lava dome, accompanied by strong fumarolic activity, incandescence from the lava dome, explosions, ash plumes, and avalanches. Satellite data showed a daily thermal anomaly over the volcano. Video data showed ash plumes associated with collapses at the dome that generated avalanches that in turn produced ash plumes rising to 3.5 km altitude and drifting 40 km W on 4 January and rising to 7-7.5 km altitude and drifting 15 km SW on 5 January. A gas-and-steam plume containing some ash that was associated with avalanches rose to 5-6 km altitude and extended 52-92 km W on 7 January. Explosions that same day produced ash plumes that rose to 7-7.5 km altitude and drifted 10 km W. According to a Volcano Observatory Notice for Aviation (VONA) issued at 1344 on 19 January, explosions produced an ash cloud that was 15 x 25 km in size and rose to 9.6-10 km altitude, drifting 21-25 km W; as a result, the Aviation Color Code (ACC) was raised to Red (the highest level on a four-color scale). Another VONA issued at 1635 reported that no more ash plumes were observed, and the ACC was lowered to Orange (the second highest level on a four-color scale). On 22 January an ash plume from collapses and avalanches rose to 5 km altitude and drifted 25 km NE and SW; ash plumes associated with collapses extended 70 km NE on 27 and 31 January.
Lava dome growth, fumarolic activity, dome incandescence, and occasional explosions and avalanches continued during February and March. A daily thermal anomaly was visible in satellite data. Explosions on 1 February generated ash plumes that rose to 6.3-6.5 km altitude and extended 15 km NE. Video data showed an ash cloud from avalanches rising to 5.5 km altitude and drifting 5 km SE on 2 February. Satellite data showed gas-and-steam plumes containing some ash rose to 5-5.5 km altitude and drifted 68-110 km ENE and NE on 6 February, to 4.5-5 km altitude and drifted 35 km WNW on 22 February, and to 3.7-4 km altitude and drifted 47 km NE on 28 February. Scientists from the Kamchatka Volcanological Station (KVS) went on a field excursion on 25 February to document the growing lava dome, and although it was cloudy most of the day, nighttime incandescence was visible. Satellite data showed an ash plume extending up to 118 km E during 4-5 March. Video data from 1150 showed an ash cloud from avalanches rose to 3.7-5.5 km altitude and drifted 5-10 km ENE and E on 5 March. On 11 March an ash plume drifted 62 km E. On 27 March ash plumes rose to 3.5 km altitude and drifted 100 km E. Avalanches and constant incandescence at the lava dome was focused on the E and NE slopes on 28 March. A gas-and-steam plume containing some ash rose to 3.5 km altitude and moved 40 km E on 29 March. Ash plumes on 30 March rose to 3.5-3.7 km altitude and drifted 70 km NE.
Similar activity continued during April, with lava dome growth, strong fumarolic activity, incandescence in the dome, occasional explosions, and avalanches. A thermal anomaly persisted throughout the month. During 1-4 April weak ash plumes rose to 2.5-3 km altitude and extended 13-65 km SE and E.
Activity during 11 April 2023. The Institute of Volcanology and Seismology, Far Eastern Branch, Russian Academy of Sciences (IVS FEB RAS) reported a significant increase in seismicity around 0054 on 11 April, as reported by strong explosions detected on 11 April beginning at 0110 that sent ash plumes up to 7-10 km altitude and extended 100-435 km W, WNW, NNW, WSW, and SW. According to a Tokyo VAAC report the ash plume rose to 15.8 km altitude. By 0158 the plume extended over a 75 x 100 km area. According to an IVS FEB RAS report, the eruptive column was not vertical: the initial plume at 0120 on 11 April deviated to the NNE, at 0000 on 12 April, it drifted NW, and by 1900 it drifted SW. KVS reported that significant pulses of activity occurred at around 0200, 0320, and then a stronger phase around 0600. Levin Dmitry took a video from near Békés (3 km away) at around 0600 showing a rising plume; he also reported that a pyroclastic flow traveled across the road behind him as he left the area. According to IVS FEB RAS, the pyroclastic flow traveled several kilometers SSE, stopping a few hundred meters from a bridge on the road between Klyuchi and Petropavlovsk-Kamchatsky.
Ashfall was first observed in Klyuchi (45 km SW) at 0630, and a large, black ash plume blocked light by 0700. At 0729 KVERT issued a Volcano Observatory Notice for Aviation (VONA) raising the Aviation Color Code to Red (the highest level on a four-color scale). It also stated that a large ash plume had risen to 10 km altitude and drifted 100 km W. Near-constant lightning strikes were reported in the plume and sounds like thunderclaps were heard until about 1000. According to IVS FEB RAS the cloud was 200 km long and 76 km wide by 0830, and was spreading W at altitudes of 6-12 km. In the Klyuchi Village, the layer of both ash and snow reached 8.5 cm (figure 96); ashfall was also reported in Kozyrevsk (112 km SW) at 0930, Mayskoye, Anavgay, Atlasovo, Lazo, and Esso. Residents in Klyuchi reported continued darkness and ashfall at 1100. In some areas, ashfall was 6 cm deep and some residents reported dirty water coming from their plumbing. According to IVS FEB RAS, an ash cloud at 1150 rose to 5-20 km altitude and was 400 km long and 250 km wide, extending W. A VONA issued at 1155 reported that ash had risen to 10 km and drifted 340 km NNW and 240 km WSW. According to Simon Carn (Michigan Technological University), about 0.2 Tg of sulfur dioxide in the plume was measured in a satellite image from the TROPOMI instrument on the Sentinel-5P satellite acquired at 1343 that covered an area of about 189,000 km2 (figure 97). Satellite data at 1748 showed an ash plume that rose to 8 km altitude and drifted 430 km WSW and S, according to a VONA.
Activity during 12-15 April 2023. On 12 April at 0730 satellite images showed ash plumes rose to 7-8 km altitude and extended 600 km SW, 1,050 km ESE, and 1,300-3,000 km E. By 1710 that day, the explosions weakened. According to news sources, the ash-and-gas plumes drifted E toward the Aleutian Islands and reached the Gulf of Alaska by 13 April, causing flight disruptions. More than 100 flights involving Alaska airspace were cancelled due to the plume. Satellite data showed ash plumes rising to 4-5.5 km altitude and drifted 400-415 km SE and ESE on 13 April. KVS volcanologists observed the pyroclastic flow deposits and noted that steam rose from downed, smoldering trees. They also noted that the deposits were thin with very few large fragments, which differed from previous flows. The ash clouds traveled across the Pacific Ocean. Flight cancellations were also reported in NW Canada (British Columbia) during 13-14 April. During 14-15 April ash plumes rose to 6 km altitude and drifted 700 km NW.
Alaskan flight schedules were mostly back to normal by 15 April, with only minor delays and far less cancellations; a few cancellations continued to be reported in Canada. Clear weather on 15 April showed that most of the previous lava-dome complex was gone and a new crater roughly 1 km in diameter was observed (figure 98); gas-and-steam emissions were rising from this crater. Evidence suggested that there had been a directed blast to the SE, and pyroclastic flows traveled more than 20 km. An ash plume rose to 4.5-5.2 km altitude and drifted 93-870 km NW on 15 April.
Activity during 16-30 April 2023. Resuspended ash was lifted by the wind from the slopes and rose to 4 km altitude and drifted 224 km NW on 17 April. KVERT reported a plume of resuspended ash from the activity during 10-13 April on 19 April that rose to 3.5-4 km altitude and drifted 146-204 km WNW. During 21-22 April a plume stretched over the Scandinavian Peninsula. A gas-and-steam plume containing some ash rose to 3-3.5 km altitude and drifted 60 km SE on 30 April. A possible new lava dome was visible on the W slope of the volcano on 29-30 April (figure 99); satellite data showed two thermal anomalies, a bright one over the existing lava dome and a weaker one over the possible new one.
References. Girina, O., Loupian, E., Horvath, A., Melnikov, D., Manevich, A., Nuzhdaev, A., Bril, A., Ozerov, A., Kramareva, L., Sorokin, A., 2023, Analysis of the development of the paroxysmal eruption of Sheveluch volcano on April 10–13, 2023, based on data from various satellite systems, ??????????? ???????? ??? ?? ???????, 20(2).
Geologic Background. The high, isolated massif of Sheveluch volcano (also spelled Shiveluch) rises above the lowlands NNE of the Kliuchevskaya volcano group. The 1,300 km3 andesitic volcano is one of Kamchatka's largest and most active volcanic structures, with at least 60 large eruptions during the Holocene. The summit of roughly 65,000-year-old Stary Shiveluch is truncated by a broad 9-km-wide late-Pleistocene caldera breached to the south. Many lava domes occur on its outer flanks. The Molodoy Shiveluch lava dome complex was constructed during the Holocene within the large open caldera; Holocene lava dome extrusion also took place on the flanks of Stary Shiveluch. Widespread tephra layers from these eruptions have provided valuable time markers for dating volcanic events in Kamchatka. Frequent collapses of dome complexes, most recently in 1964, have produced debris avalanches whose deposits cover much of the floor of the breached caldera.
Information Contacts: Kamchatka Volcanic Eruptions Response Team (KVERT), Far Eastern Branch, Russian Academy of Sciences, 9 Piip Blvd., Petropavlovsk-Kamchatsky, 683006, Russia (URL: http://www.kscnet.ru/ivs/kvert/); Institute of Volcanology and Seismology, Far Eastern Branch, Russian Academy of Sciences (IVS FEB RAS), 9 Piip Blvd., Petropavlovsk-Kamchatsky 683006, Russia (URL: http://www.kscnet.ru/ivs/eng/); Kamchatka Volcanological Station, Kamchatka Branch of Geophysical Survey, (KB GS RAS), Klyuchi, Kamchatka Krai, Russia (URL: http://volkstat.ru/); Hawai'i Institute of Geophysics and Planetology (HIGP) - MODVOLC Thermal Alerts System, School of Ocean and Earth Science and Technology (SOEST), Univ. of Hawai'i, 2525 Correa Road, Honolulu, HI 96822, USA (URL: http://modis.higp.hawaii.edu/); MIROVA (Middle InfraRed Observation of Volcanic Activity), a collaborative project between the Universities of Turin and Florence (Italy) supported by the Centre for Volcanic Risk of the Italian Civil Protection Department (URL: http://www.mirovaweb.it/); Copernicus Browser, Copernicus Data Space Ecosystem, European Space Agency (URL: https://dataspace.copernicus.eu/browser/); Kam 24 News Agency, 683032, Kamchatka Territory, Petropavlovsk-Kamchatsky, Vysotnaya St., 2A (URL: https://kam24.ru/news/main/20230411/96657.html#.Cj5Jrky6.dpuf); Simon Carn, Geological and Mining Engineering and Sciences, Michigan Technological University, 1400 Townsend Drive, Houghton, MI 49931, USA (URL: http://www.volcarno.com/, Twitter: @simoncarn).
Bezymianny
Russia
55.972°N, 160.595°E; summit elev. 2882 m
All times are local (unless otherwise noted)
Explosions, ash plumes, lava flows, and avalanches during November 2022-April 2023
Bezymianny is located on the Kamchatka Peninsula of Russia as part of the Klyuchevskoy volcano group. Historic eruptions began in 1955 and have been characterized by dome growth, explosions, pyroclastic flows, ash plumes, and ashfall. During the 1955-56 eruption a large open crater was formed by collapse of the summit and an associated lateral blast. Subsequent episodic but ongoing lava-dome growth, accompanied by intermittent explosive activity and pyroclastic flows, has largely filled the 1956 crater. The current eruption period began in December 2016 and more recent activity has consisted of strong explosions, ash plumes, and thermal activity (BGVN 47:11). This report covers activity during November 2022 through April 2023, based on weekly and daily reports from the Kamchatka Volcano Eruptions Response Team (KVERT) and satellite data.
Activity during November and March 2023 was relatively low and mostly consisted of gas-and-steam emissions, occasional small collapses that generated avalanches along the lava dome slopes, and a persistent thermal anomaly over the volcano that was observed in satellite data on clear weather days. According to the Tokyo VAAC and KVERT, an explosion produced an ash plume that rose to 6 km altitude and drifted 25 km NE at 1825 on 29 March.
Gas-and-steam emissions, collapses generating avalanches, and thermal activity continued during April. According to two Volcano Observatory Notice for Aviation (VONA) issued on 2 and 6 April (local time) ash plumes rose to 3 km and 3.5-3.8 km altitude and drifted 35 km E and 140 km E, respectively. Satellite data from KVERT showed weak ash plumes extending up to 550 km E on 2 and 5-6 April.
A VONA issued at 0843 on 7 April described an ash plume that rose to 4.5-5 km altitude and drifted 250 km ESE. Later that day at 1326 satellite data showed an ash plume that rose to 5.5-6 km altitude and drifted 150 km ESE. A satellite image from 1600 showed an ash plume extending as far as 230 km ESE; KVERT noted that ash emissions were intensifying, likely due to avalanches from the growing lava dome. The Aviation Color Code (ACC) was raised to Red (the highest level on a four-color scale). At 1520 satellite data showed an ash plume rising to 5-5.5 km altitude and drifting 230 km ESE. That same day, Kamchatka Volcanological Station (KVS) volcanologists traveled to Ambon to collect ash; they reported that a notable eruption began at 1730, and within 20 minutes a large ash plume rose to 10 km altitude and drifted NW. KVERT reported that the strong explosive phase began at 1738. Video and satellite data taken at 1738 showed an ash plume that rose to 10-12 km altitude and drifted up to 2,800 km SE and E. Explosions were clearly audible 20 km away for 90 minutes, according to KVS. Significant amounts of ash fell at the Apakhonchich station, which turned the snow gray; ash continued to fall until the morning of 8 April. In a VONA issued at 0906 on 8 April, KVERT stated that the explosive eruption had ended; ash plumes had drifted 2,000 km E. The ACC was lowered to Orange (the third highest level on a four-color scale). The KVS team saw a lava flow on the active dome once the conditions were clear that same day (figure 53). On 20 April lava dome extrusion was reported; lava flows were noted on the flanks of the dome, and according to KVERT satellite data, a thermal anomaly was observed in the area. The ACC was lowered to Yellow (the second lowest on a four-color scale).
Satellite data showed an increase in thermal activity beginning in early April 2023. A total of 31 thermal hotspots were detected by the MODVOLC thermal algorithm on 4, 5, 7, and 12 April 2023. The elevated thermal activity resulted from an increase in explosive activity and the start of an active lava flow. The MIROVA (Middle InfraRed Observation of Volcanic Activity) volcano hotspot detection system based on the analysis of MODIS data also showed a pulse in thermal activity during the same time (figure 54). Infrared satellite imagery captured a continuous thermal anomaly at the summit crater, often accompanied by white gas-and-steam emissions (figure 55). On 4 April 2023 an active lava flow was observed descending the SE flank.
Geologic Background. The modern Bezymianny, much smaller than its massive neighbors Kamen and Kliuchevskoi on the Kamchatka Peninsula, was formed about 4,700 years ago over a late-Pleistocene lava-dome complex and an edifice built about 11,000-7,000 years ago. Three periods of intensified activity have occurred during the past 3,000 years. The latest period, which was preceded by a 1,000-year quiescence, began with the dramatic 1955-56 eruption. This eruption, similar to that of St. Helens in 1980, produced a large open crater that was formed by collapse of the summit and an associated lateral blast. Subsequent episodic but ongoing lava-dome growth, accompanied by intermittent explosive activity and pyroclastic flows, has largely filled the 1956 crater.
Information Contacts: Kamchatka Volcanic Eruptions Response Team (KVERT), Far Eastern Branch, Russian Academy of Sciences, 9 Piip Blvd., Petropavlovsk-Kamchatsky, 683006, Russia (URL: http://www.kscnet.ru/ivs/kvert/); Kamchatka Volcanological Station, Kamchatka Branch of Geophysical Survey, (KB GS RAS), Klyuchi, Kamchatka Krai, Russia (URL: http://volkstat.ru/); Hawai'i Institute of Geophysics and Planetology (HIGP) - MODVOLC Thermal Alerts System, School of Ocean and Earth Science and Technology (SOEST), Univ. of Hawai'i, 2525 Correa Road, Honolulu, HI 96822, USA (URL: http://modis.higp.hawaii.edu/); MIROVA (Middle InfraRed Observation of Volcanic Activity), a collaborative project between the Universities of Turin and Florence (Italy) supported by the Centre for Volcanic Risk of the Italian Civil Protection Department (URL: http://www.mirovaweb.it/); Copernicus Browser, Copernicus Data Space Ecosystem, European Space Agency (URL: https://dataspace.copernicus.eu/browser/).
Chikurachki
Russia
50.324°N, 155.461°E; summit elev. 1781 m
All times are local (unless otherwise noted)
New explosive eruption during late January-early February 2023
Chikurachki, located on Paramushir Island in the northern Kuriles, has had Plinian eruptions during the Holocene. Lava flows have reached the sea and formed capes on the NW coast; several young lava flows are also present on the E flank beneath a scoria deposit. Reported eruptions date back to 1690, with the most recent eruption period occurring during January through October 2022, characterized by occasional explosions, ash plumes, and thermal activity (BGVN 47:11). This report covers a new eruptive period during January through February 2023 that consisted of ash explosions and ash plumes, based on information from the Kamchatka Volcanic Eruptions Response Team (KVERT) and satellite data.
According to reports from KVERT, an explosive eruption began around 0630 on 29 January. Explosions generated ash plumes that rose to 3-3.5 km altitude and drifted 6-75 km SE and E, based on satellite data. As a result, the Aviation Color Code (ACC) was raised to Orange (the second highest level on a four-color scale). At 1406 and 1720 ash plumes were identified in satellite images that rose to 4.3 km altitude and extended 70 km E. By 2320 the ash plume had dissipated. A thermal anomaly was visible at the volcano on 31 January, according to a satellite image, and an ash plume was observed drifting 66 km NE.
Occasional explosions and ash plumes continued during early February. At 0850 on 1 February an ash plume rose to 3.5 km altitude and drifted 35 km NE. Satellite data showed an ash plume that rose to 3.2-3.5 km altitude and drifted 50 km NE at 1222 later that day (figure 22). A thermal anomaly was detected over the volcano during 5-6 February and ash plumes drifted as far as 125 km SE, E, and NE. Explosive events were reported at 0330 on 6 February that produced ash plumes rising to 4-4.5 km altitude and drifting 72-90 km N, NE, and ENE. KVERT noted that the last gas-and steam plume that contained some ash was observed on 8 February and drifted 55 km NE before the explosive eruption ended. The ACC was lowered to Yellow and then Green (the lowest level on a four-color scale) on 18 February.
Geologic Background. Chikurachki, the highest volcano on Paramushir Island in the northern Kuriles, is a relatively small cone constructed on a high Pleistocene edifice. Oxidized basaltic-to-andesitic scoria deposits covering the upper part of the young cone give it a distinctive red color. Frequent basaltic Plinian eruptions have occurred during the Holocene. Lava flows have reached the sea and formed capes on the NW coast; several young lava flows are also present on the E flank beneath a scoria deposit. The Tatarinov group of six volcanic centers is located immediately to the south, and the Lomonosov cinder cone group, the source of an early Holocene lava flow that reached the saddle between it and Fuss Peak to the west, lies at the southern end of the N-S-trending Chikurachki-Tatarinov complex. In contrast to the frequently active Chikurachki, the Tatarinov centers are extensively modified by erosion and have a more complex structure. Tephrochronology gives evidence of an eruption around 1690 CE from Tatarinov, although its southern cone contains a sulfur-encrusted crater with fumaroles that were active along the margin of a crater lake until 1959.
Information Contacts: Kamchatka Volcanic Eruptions Response Team (KVERT), Far East Division, Russian Academy of Sciences, 9 Piip Blvd., Petropavlovsk-Kamchatsky, 683006, Russia (URL: http://www.kscnet.ru/ivs/); Copernicus Browser, Copernicus Data Space Ecosystem, European Space Agency (URL: https://dataspace.copernicus.eu/browser/).
Search Bulletin Archive by Publication Date
Select a month and year from the drop-downs and click "Show Issue" to have that issue displayed in this tab.
The default month and year is the latest issue available.
Bulletin of the Global Volcanism Network - Volume 21, Number 02 (February 1996)
Managing Editor: Richard Wunderman
Aira (Japan)
Explosive ash eruptions continue
Akutan (United States)
Several days of felt earthquakes during cloudy weather
Asosan (Japan)
Continuous tremor; crater floor still covered with water
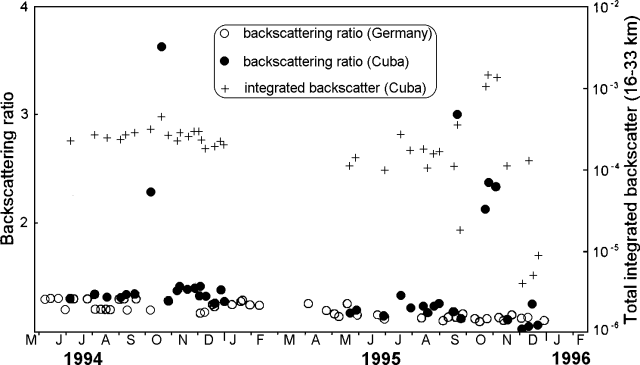
Atmospheric Effects (1995-2001) (Unknown)
Lidar data from Cuba, Germany, and Hawaii; aerosol layer with unknown source
Etna (Italy)
Two additional significant eruptive episodes during January-February
Fujisan (Japan)
Low-frequency earthquake swarm
Galeras (Colombia)
Slight increase in seismicity, but still at low levels
Gemini-Oscostar (Vanuatu)
Submarine eruption; the first recorded historical activity
Hokkaido-Komagatake (Japan)
Tremor and extension precede early March phreatic eruption
Iwatesan (Japan)
Small-amplitude tremor
Karymsky (Russia)
Ongoing explosions eject steam and minor ash
Kujusan (Japan)
Seismic activity continues but plume is devoid of ash
Kusatsu-Shiranesan (Japan)
Minor hydrothermal ejection in Yu-gama crater
Langila (Papua New Guinea)
Ash-and-vapor clouds and occasional night glow
Manam (Papua New Guinea)
Steam emitted at low-to-moderate rates
Miyakejima (Japan)
Low-frequency earthquakes
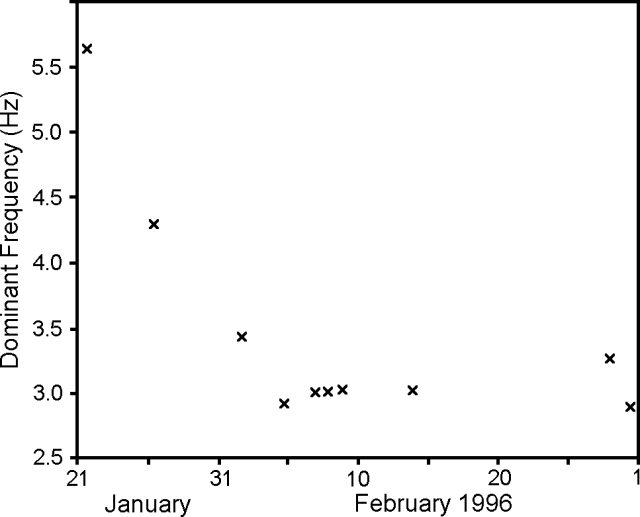
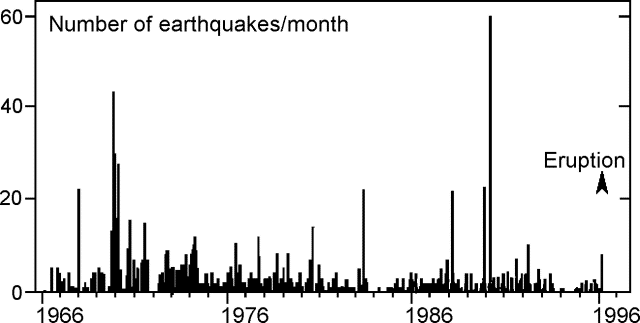
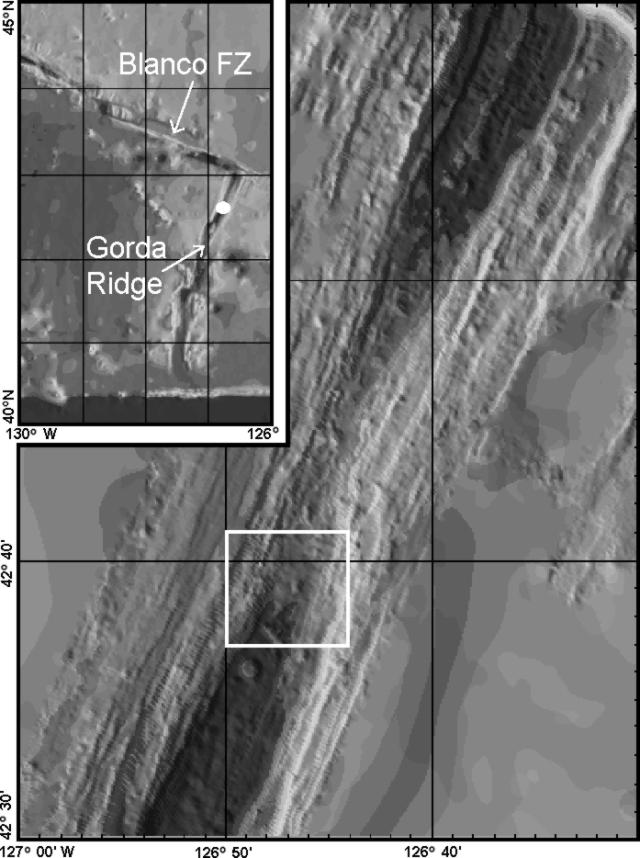
North Gorda Ridge Segment (United States)
Eruption or intrusive event detected by acoustic signals
Popocatepetl (Mexico)
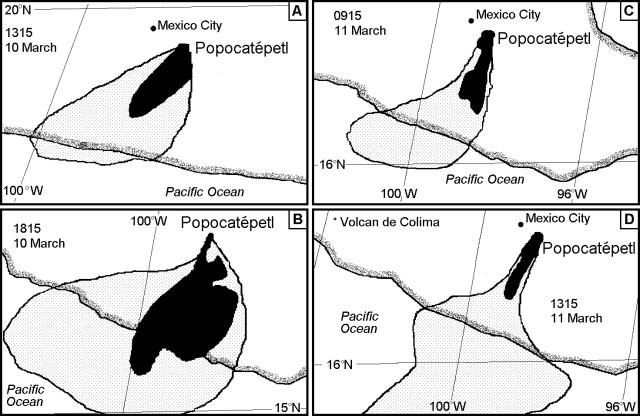
New eruptive episode produces ash plume that drifts over SW coast
Rabaul (Papua New Guinea)
Tavurvurs November eruption continues; 35% increase in seismicity
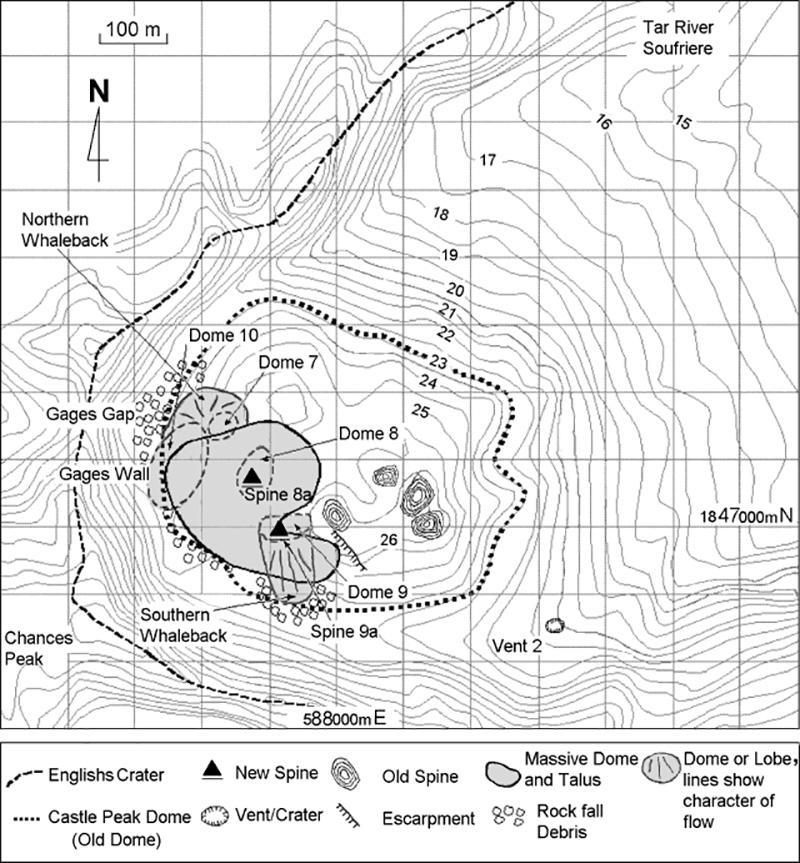
Soufriere Hills (United Kingdom)
Increasingly rapid dome growth
Stromboli (Italy)
Intense eruptive phase followed by a drop in seismicity
Ulawun (Papua New Guinea)
Noiseless steaming and seismic quiet continue
Unzendake (Japan)
Multiple small block-and-ash flows; the first since February 1995
Aira
Japan
31.5772°N, 130.6589°E; summit elev. 1117 m
All times are local (unless otherwise noted)
Explosive ash eruptions continue
During February Minami-dake Crater produced 35 eruptions, including 31 that were explosive. At the seismic station 2.3 km NW of Minami-dake Crater (Station B), 689 earthquakes and 879 tremors were recorded. On 11 February, the highest ash plume during the month rose 1,800 m above the summit crater. Ashfall measured at the Kagoshima Local Meteorological Observatory (KMO), 10 km W of the crater, was 10 g/m2.
Geologic Background. The Aira caldera in the northern half of Kagoshima Bay contains the post-caldera Sakurajima volcano, one of Japan's most active. Eruption of the voluminous Ito pyroclastic flow accompanied formation of the 17 x 23 km caldera about 22,000 years ago. The smaller Wakamiko caldera was formed during the early Holocene in the NE corner of the caldera, along with several post-caldera cones. The construction of Sakurajima began about 13,000 years ago on the southern rim and built an island that was joined to the Osumi Peninsula during the major explosive and effusive eruption of 1914. Activity at the Kitadake summit cone ended about 4,850 years ago, after which eruptions took place at Minamidake. Frequent eruptions since the 8th century have deposited ash on the city of Kagoshima, located across Kagoshima Bay only 8 km from the summit. The largest recorded eruption took place during 1471-76.
Information Contacts: Volcanological Division, Seismological and Volcanological Department, Japan Meteorological Agency (JMA), 1-3-4 Ote-machi, Chiyoda-ku, Tokyo 100 Japan.
Akutan (United States) — February 1996 Cite this Report
Akutan
United States
54.134°N, 165.986°W; summit elev. 1303 m
All times are local (unless otherwise noted)
Several days of felt earthquakes during cloudy weather
At 1930 on 10 March, residents of the city of Akutan on Akutan Island began feeling continuous earthquakes punctuated occasionally by strong, but non-damaging shocks. The coastal city has a seasonal population of 750 and lies 13 km E of the summit. Poor weather, which prevailed for at least the next few days, hampered visual observations of the volcano.
The strongly felt seismic activity continued throughout most of 11 March. At 1700 on 11 March, continuous tremor-like shaking in Akutan city began subsiding. A similar decrease also took place in the intensity of felt shocks and, by 2000 that day, event counts were on the decline. This decline continued through the night and into the morning of 12 March. As of the afternoon of 12 March, Akutan residents reported that they felt earthquakes at a rate of ~1/hour.
An AVO seismologist with an instrument arrived in Akutan city on the night of 12 March. Seismicity increased significantly beginning about 1700 on 13 March. Felt-earthquakes began occurring at a rate of about 1 a minute, similar to the 11 March rate.
Seismic observations at distant stations, and the felt-earthquakes, suggested a very shallow volcanic source, a possible prelude to, or indication of, eruptive activity at the nearby volcano. There were, however, no reports of airborne ash or sulfurous odors. Weather cloud tops were estimated to be at about 8 km with local winds blowing toward the N. If any ash discharged, it was localized. Without direct observation, AVO postulated that if the eruptive activity took place it was characterized by periodic low-level explosions.
Forwarded reports from aviators in mid-March noted abnormal amounts of steam or possible ash coming from the crater's SE corner. Plume height estimates were from 0.9-1.2 km in one case and 3.0-4.6 km in another. At the time of one particular observation the plume's width was relatively narrow. It was given as about a quarter of the width of the volcano's base (presumably the visible base, a distance that is difficult to determine exactly). Various reports also mentioned layers of weather clouds.
Geologic Background. Akutan contains a 2-km-wide caldera with a large cinder cone in the NE part of the caldera that has been the source of frequent explosive eruptions and occasional lava effusion that covers the caldera floor. An older, largely buried caldera was formed during the late Pleistocene or early Holocene. Two volcanic centers are located on the NW flank. Lava Peak is of Pleistocene age, and a cinder cone lower on the flank produced a lava flow in 1852 that extended the shoreline of the island and forms Lava Point. The 60-365 m deep younger caldera was formed during a major explosive eruption about 1,600 years ago and contains at least three lakes. A lava flow in 1978 traveled through a narrow breach in the north caldera rim almost to the coast. Fumaroles occur at the base of the caldera cinder cone, and hot springs are located NE of the caldera at the head of Hot Springs Bay valley and along the shores of Hot Springs Bay.
Information Contacts: Alaska Volcano Observatory (AVO), a cooperative program of a) U.S. Geological Survey, 4200 University Drive, Anchorage, AK 99508-4667, USA, b) Geophysical Institute, University of Alaska, PO Box 757320, Fairbanks, AK 99775-7320, USA, and c) Alaska Division of Geological & Geophysical Surveys, 794 University Ave., Suite 200, Fairbanks, AK 99709, USA.
Asosan
Japan
32.8849°N, 131.085°E; summit elev. 1592 m
All times are local (unless otherwise noted)
Continuous tremor; crater floor still covered with water
The floor of Naka-dake Crater 1 remained covered with water in January. Seismic station A, 800 m W of the crater, recorded continuous tremor of 0.1-0.3 µm amplitude. In addition, there were 4,966 isolated tremors during the month.
Aso, a 24-km-wide caldera, produced pyroclastic-flow deposits during the Pleistocene that cover much of Kyushu. Its frequently active Naka-dake is one of a group of 15 intra-caldera cones.
Geologic Background. The 24-km-wide Asosan caldera was formed during four major explosive eruptions from 300,000 to 90,000 years ago. These produced voluminous pyroclastic flows that covered much of Kyushu. The last of these, the Aso-4 eruption, produced more than 600 km3 of airfall tephra and pyroclastic-flow deposits. A group of 17 central cones was constructed in the middle of the caldera, one of which, Nakadake, is one of Japan's most active volcanoes. It was the location of Japan's first documented historical eruption in 553 CE. The Nakadake complex has remained active throughout the Holocene. Several other cones have been active during the Holocene, including the Kometsuka scoria cone as recently as about 210 CE. Historical eruptions have largely consisted of basaltic to basaltic-andesite ash emission with periodic strombolian and phreatomagmatic activity. The summit crater of Nakadake is accessible by toll road and cable car, and is one of Kyushu's most popular tourist destinations.
Information Contacts: Japan Meteorological Agency (JMA), Volcanological Division, Seismological and Volcanological Department, 1-3-4 Ote-machi, Chiyoda-ku, Tokyo 100, Japan.
Atmospheric Effects (1995-2001) (Unknown) — February 1996 Cite this Report
Atmospheric Effects (1995-2001)
Unknown
Unknown, Unknown; summit elev. m
All times are local (unless otherwise noted)
Lidar data from Cuba, Germany, and Hawaii; aerosol layer with unknown source
Colorful twilights of long duration have been reported since late September 1995 by observers in England and across the United States in Florida, Maryland, Kentucky, Arkansas, Texas, New Mexico, Colorado, California and Hawaii (F. M. Mims III and others, 1996). This report describes information compiled by Mims and co-authors and includes lidar backscatter data from sites in Cuba, Germany, and Hawaii (figure 1 and table 5). Lidar values are similar to those from earlier in 1995 (Bulletin v. 20, nos. 7 and 10).
Table 5. Lidar data from Cuba and Germany showing altitudes of aerosol layers; some layers have multiple peaks. Backscattering ratios are for the Nd-YAG wavelength of 0.53 microns, with equivalent ruby values (0.69 microns) in parentheses for data from Germany. The integrated value shows total backscatter, expressed in steradians^-1, integrated over 300-m intervals from 16-33 km for Cuba and from the tropopause to 30 km at Garmisch-Partenkirchen. Courtesy of Rene Estevan and Horst Jäger.
| DATE |
LAYER ALTITUDE (km) (peak) |
BACKSCATTERING RATIO |
BACKSCATTERING INTEGRATED |
| Camaguey, Cuba (21.2°N, 77.5°W) |
| 28 Jul 1995 |
15.1 (21.4) |
1.23 |
1.75 x 10⁻⁴ |
| 28 Jul 1995 |
15.1 (22.0) |
1.21 |
-- |
| 13 Aug 1995 |
15.4 (23.8) |
1.24 |
1.79 x 10⁻⁴ |
| 18 Aug 1995 |
16.0 (20.5) |
1.18 |
1.04 x 10⁻⁴ |
| 26 Aug 1995 |
13.9 (19.9) |
1.24 |
1.58 x 10⁻⁴ |
| 26 Aug 1995 |
13.9 (20.0) |
1.31 |
-- |
| 30 Aug 1995 |
14.5 (22.6) |
1.26 |
1.69 x 10⁻⁴ |
| 15 Sep 1995 |
16.6 (18.4) |
1.20 |
1.10 x 10⁻⁴ |
| 15 Sep 1995 |
16.6 (21.1) |
1.17 |
-- |
| Garmisch-Partenkirchen, Germany (47.5°N, 11.0°E) |
| 10 Aug 1995 |
10-28 (19.8) |
1.13 (1.3) |
-- |
| 04 Sep 1995 |
11-26 (17.9) |
1.11 (1.2) |
-- |
| 09 Sep 1995 |
10-27 (18.2) |
1.14 (1.3) |
-- |
| 18 Sep 1995 |
11-33 (18.4) |
1.14 (1.3) |
-- |
| 26 Sep 1995 |
13-27 (18.4) |
1.17 (1.3) |
-- |
| 09 Oct 1995 |
14-32 (18.5) |
1.13 (1.3) |
-- |
| 15 Oct 1995 |
11-27 (19.0) |
1.10 (1.2) |
-- |
| 23 Oct 1995 |
13-29 (17.5) |
1.13 (1.3) |
-- |
| 05 Nov 1995 |
9-32 (16.3) |
1.14 (1.3) |
-- |
| 11 Nov 1995 |
11-31 (18.1) |
1.11 (1.2) |
-- |
| 20 Nov 1995 |
11-29 (17.3) |
1.16 (1.3) |
-- |
| 01 Dec 1995 |
8-32 (17.4) |
1.13 (1.3) |
-- |
| 09 Dec 1995 |
11-31 (14.9) |
1.14 (1.3) |
-- |
| 28 Dec 1995 |
10-27 (16.5) |
1.11 (1.2) |
-- |
| Mauna Loa, Hawaii (19.5°N, 155.6°W) |
| 01 Aug 1995 |
16-27 (22.0) |
1.38 |
0.93 x 10⁻⁴ |
| 08 Aug 1995 |
16-27 (22.0) |
1.31 |
0.61 x 10⁻⁴ |
| 16 Aug 1995 |
16-27 (22.0) |
1.35 |
0.71 x 10⁻⁴ |
| 23 Aug 1995 |
16-27 (22.3) |
1.27 |
0.59 x 10⁻⁴ |
| 31 Aug 1995 |
16-27 (22.0) |
1.32 |
0.67 x 10⁻⁴ |
| 12 Sep 1995 |
16-26 (21.7) |
1.31 |
0.53 x 10⁻⁴ |
| 12 Oct 1995 |
16-26 (23.2) |
1.28 |
0.74 x 10⁻⁴ |
Visual observations from both the ground and commercial aircraft of colorful twilights and a prominent solar aureole suggest a stratospheric cloud now extends from about 20 to 37°N. The origin of the scattering aerosols is presently unknown. Many of the twilights last fall and winter had a duration of 45-60 minutes, which implies an altitude for the aerosols of ~23-35 km. Photographs of the twilights closely resemble images of El Chichón and Pinatubo twilights.
Increased aerosol optical thickness (AOT) has been measured at two sites (Seguin, Texas, and San Diego, California) where extended twilights have been reported. (The optical thickness is equal to the negative natural logarithm of the attenuation of incident light, or Tau = -ln(I/Io), where I and Io are the initial and final light intensity, respectively.) The lowest AOT (1.003 µm) at Seguin, Texas, during winter 1995-96 was 0.03 higher, double the smallest AOT during the previous two winters (figure 2).
Visual and AOT observations of the aerosol cloud have been corroborated by lidar measurements in Cuba from September-December 1995 (figure 1 and table 5). Several episodes of unusually high total integrated backscatter at 16-33 km occurred during this period. Finally, backscatter data from Germany confirm visual and Sun photometer observations that the new aerosol has not reached 47.5°N.
Reference. Mims, F.M., III, Meinel, C., Roosen, R.G., Russell, R.T., Hawkins, G.P., and Easton, H., 1996, Stratospheric aerosol cloud of unknown origin: unpublished manuscript.
Geologic Background. The enormous aerosol cloud from the March-April 1982 eruption of Mexico''s El Chichón persisted for years in the stratosphere, and led to the Atmospheric Effects section becoming a regular feature of the Bulletin thorugh 1989. Lidar data and other atmospheric observations were again published intermittently between 1995 and 2001; those reports are included here.
Information Contacts: Horst Jäger, Fraunhofer -- Institut für Atmosphärische Umweltforschung, Kreuzeckbahnstrasse 19, D-8100 Garmisch-Partenkirchen, Germany; Forrest M. Mims III, Sun Photometer Atmospheric Network (SPAN), 433 Twin Oak Rd., Seguin, TX 78155 USA; Rene Estevan and Juan Carlos Antuña, Centro Meteorologico de Camagüey, Apartado 134, Camagüey 70100, Cuba [J.C.A is presently at Univ. Maryland, Dept. of Meteorology, College Park, MD 20742 USA]; John Barnes, Mauna Loa Observatory, P.O. Box 275, Hilo, HI 96720 USA.
Etna
Italy
37.748°N, 14.999°E; summit elev. 3357 m
All times are local (unless otherwise noted)
Two additional significant eruptive episodes during January-February
After the sixth eruptive episode at Northeast Crater (NEC) on 23 December 1995 (BGVN 20:11/12), continuous steam emission was observed at the other summit craters in early January. After sunrise on 4 January, ash puffs were observed at Bocca Nuova crater (BN). The abundant black ash emissions were apparently not linked to explosive activity; the frequency of ash puffs ranged between 2 and 5/minute and slowly declined during the afternoon. The next day only a white plume was present. A few small ash puffs observed on 5 and 9 January came from BN and NEC.
In the early morning of 17 January, a strong explosion from NEC ejected lithic material. Intermittent blasts (up to 15 minutes apart) were heard during the day, but no ejections were observed. Fieldwork two days later revealed that Strombolian explosions with ash puffs had occurred from two vents in the NW part of the Bocca Nuova crater floor, in the same place where activity resumed at the end of July 1995 (BGVN 20:08). The Voragine crater produced unusually strong gas blasts, but no sign of eruptive activity was observed. NEC produced a strong explosion at 1010, but then remained quiet without any gas emission. A 20 January explosion at NEC had similar characteristics. Explosive activity on 21 January was more intense and caused ash emission mainly from BN, but some strong blasts also came from NEC during the day.
Seventh eruptive episode. During the night of 24 January, red glows were intermittently observed at NEC, and after 0600 on 25 January lava jets inside a dense ash cloud were observed by the surveillance video camera at La Montagnola (3.5 km from the summit). This seventh eruptive episode, 33 days after the start of the previous one, probably began around 0130 when a strong increase in tremor amplitude was recorded by the summit stations of the IIV seismic network. A pulsating ash column developed around 0430 and was flattened down to the ground by strong winds. The lava jets were fairly low (~100 m above the crater rim) so the spatter deposit mantled only the upper part of the NEC cone, whereas fine material was blown onto the NE flank. Lapilli fallout ended around 1045, but the explosive activity continued for several hours. The lapilli-fall deposit covered a sector of the volcano >20 km long and 3.5 km wide at 12 km from the vent, where the thickness of the deposit was 1-2 mm. The volume of the pyroclastic material erupted during this episode was estimated at ~500,000 m3.
During the night of 26-27 January several strong blasts from the summit were heard in the nearest villages and strong red glows were sometimes observed at the summit. This activity was marked by short periods of high tremor amplitude. At sunrise two intense ash emissions from NEC were observed by the video surveillance system. Aerial observations revealed that one or more short lava-fountaining episodes occurred at NEC during the night. A hot spatter deposit covered a wide band on the upper SE flank down to 2,500 m elevation; no fine distal deposit was observed. Ash puffs and blasts were observed and heard from BN and NEC in the following days (in particular on the morning of 28 January) up to around 1000 on 30 January when tremor amplitude increased and ashfall was reported by skiers on the S flank. However, these phenomena vanished in the afternoon.
The summit craters remained quiet in early February, showing continuous steam emission sporadically darkened by minor ash. However, tremor amplitude fluctuated above background levels. On 8 February copious ash emitted by BN thinly covered the snow on the S flank.
Eigth eruptive episode. Another fire fountaining episode at NEC began at 2335 on 9 February and ended around 0115 the next day. Pulsating lava jets reached 200 m above the crater rim. Lapilli fallout covered a narrow band (1-3 km wide) from the vent to the shoreline (25 km away) on the SE flank (figure 63). A light ash fallout reached the town of Catania. However, the estimated volume of eruptive products was the estimated volume of eruptive products was < 300,000 m3.
Minor eruptive activity continued until 0145-0200 on 10 February. A strong explosion at 1022 ejected a large amount of material from NEC. Several ash puffs occurred during the day at NEC and BN craters. In the late evening the ash emission at BN increased and Strombolian activity resumed at NEC, marked by increased tremor amplitude that decreased again during the night. At dawn on 11 February several ash puffs were observed at BN; this activity decreased during the day but around 1700 the tremor amplitude increased again and strong Strombolian activity resumed at NEC. Eruptive activity continued through 2130 and then dropped.
On 12 February numerous ash puffs were observed at both BN and NEC. At 0030 the following day strong Strombolian activity was observed at NEC by the surveillance camera. The intensity of explosions grew up to 0130 when another sharp tremor amplitude increase was recorded. Strombolian explosions often threw incandescent bombs up to 200 m above the crater at a rate of ~5/minute until 0200. Strombolian activity gradually decreased and after 0300 was seldom observed. At sunrise several black ash puffs were observed at both BN and NEC craters and ash emissions became less frequent at 1100.
Ash puffs were next observed on 14 February, becoming more frequent on 17-18 February and during the morning of 19 February when BN produced almost continuous ash emissions for periods of up to tens of minutes. At sunrise on 21 February the snow was covered by a thin ash layer. At 1757 pulsating red glows were visible above NEC; at 1830 the glow became continuous until sunrise the next day (22 February). Higher intensity glow occurred for up to a few tens of minutes when bomb ejections were recognized.
During 22 February activity was apparently low, with only a few ash puffs from NEC. At 0240 on 23 February red glows resumed at NEC and continued through sunrise. Red glow resumed at 1820, alternating between a few tens of minutes of strong activity and longer periods of reduced activity. The same phenomena occurred the following night but poor visibility prevented good observations.
Good visibility on the night of 24-25 February permitted detailed observations of the Strombolian activity at NEC. It was continuous all night and produced by two vents; the rate of explosions ranged between 1 and 5/minute, and ejecta rose to a maximum of 150 m above the crater. During daytime no evidence of this activity was recognizable from the surveillance camera, but the next night (25-26 February) the two vents were often active simultaneously and their frequency of explosions exceeded 5/minute; moreover, the strong explosions at the start of each higher intensity phase threw bombs up to 300 m above the crater.
Poor weather conditions after the morning of 26 February prevented regular observations. Decreasing tremor amplitude in late February suggested that the period of quasi-continuous Strombolian activity at NEC ended during daylight on 27 February.
Geologic Background. Mount Etna, towering above Catania on the island of Sicily, has one of the world's longest documented records of volcanism, dating back to 1500 BCE. Historical lava flows of basaltic composition cover much of the surface of this massive volcano, whose edifice is the highest and most voluminous in Italy. The Mongibello stratovolcano, truncated by several small calderas, was constructed during the late Pleistocene and Holocene over an older shield volcano. The most prominent morphological feature of Etna is the Valle del Bove, a 5 x 10 km caldera open to the east. Two styles of eruptive activity typically occur, sometimes simultaneously. Persistent explosive eruptions, sometimes with minor lava emissions, take place from one or more summit craters. Flank vents, typically with higher effusion rates, are less frequently active and originate from fissures that open progressively downward from near the summit (usually accompanied by Strombolian eruptions at the upper end). Cinder cones are commonly constructed over the vents of lower-flank lava flows. Lava flows extend to the foot of the volcano on all sides and have reached the sea over a broad area on the SE flank.
Information Contacts: Mauro Coltelli, CNR Istituto Internazionale di Vulcanologia (IIV), Piazza Roma 2, Catania, Italy (URL: http://www.ingv.it/en/).
Fujisan
Japan
35.361°N, 138.728°E; summit elev. 3776 m
All times are local (unless otherwise noted)
Low-frequency earthquake swarm
On 20, 24, 25, and 30 January about a dozen low-frequency earthquakes were recorded.
Geologic Background. The conical form of Fujisan, Japan's highest and most noted volcano, belies its complex origin. The modern postglacial stratovolcano is constructed above a group of overlapping volcanoes, remnants of which form irregularities on Fuji's profile. Growth of the Younger Fuji volcano began with a period of voluminous lava flows from 11,000 to 8000 years before present (BP), accounting for four-fifths of the volume of the Younger Fuji volcano. Minor explosive eruptions dominated activity from 8000 to 4500 BP, with another period of major lava flows occurring from 4500 to 3000 BP. Subsequently, intermittent major explosive eruptions occurred, with subordinate lava flows and small pyroclastic flows. Summit eruptions dominated from 3000 to 2000 BP, after which flank vents were active. The extensive basaltic lava flows from the summit and some of the more than 100 flank cones and vents blocked drainages against the Tertiary Misaka Mountains on the north side of the volcano, forming the Fuji Five Lakes, popular resort destinations. The last confirmed eruption of this dominantly basaltic volcano in 1707 was Fuji's largest during historical time. It deposited ash on Edo (Tokyo) and formed a large new crater on the east flank.
Information Contacts: Volcanological Division, Japan Meteorological Agency, 1-3-4 Ote-machi, Chiyoda-ku, Tokyo 100, Japan
Galeras (Colombia) — February 1996 Cite this Report
Galeras
Colombia
1.22°N, 77.37°W; summit elev. 4276 m
All times are local (unless otherwise noted)
Slight increase in seismicity, but still at low levels
Seismicity during January and February remained low, similar to previous months. The activity was characterized by fracture events at the seismogenic source 2-8 km NE of the main crater. One M 2.9 volcano-tectonic event from this source on 26 January was felt by residents in Pasto and near the epicenter. Earthquakes were also felt on 4 and 19 February (M 2.4 and 2.7, respectively). Long-period events associated with gas movement increased slightly at the end of January and early February, but remained at low levels. This activity was mainly characterized by tornillo signals (screw-type events) lasting 30 seconds. The dominant frequency of these events also declined in late January (figure 79). A similar pattern was observed before eruptions in 1992-93.
The two electronic tiltmeters showed no significant changes. SO2 measurements using COSPEC registered emission rates of
Geologic Background. Galeras, a stratovolcano with a large breached caldera located immediately west of the city of Pasto, is one of Colombia's most frequently active volcanoes. The dominantly andesitic complex has been active for more than 1 million years, and two major caldera collapse eruptions took place during the late Pleistocene. Long-term extensive hydrothermal alteration has contributed to large-scale edifice collapse on at least three occasions, producing debris avalanches that swept to the west and left a large open caldera inside which the modern cone has been constructed. Major explosive eruptions since the mid-Holocene have produced widespread tephra deposits and pyroclastic flows that swept all but the southern flanks. A central cone slightly lower than the caldera rim has been the site of numerous small-to-moderate eruptions since the time of the Spanish conquistadors.
Information Contacts: Pablo Chamorro, INGEOMINAS Observatorio Vulcanologico y Sismologico de Pasto (OVP), A.A. 1795, San Juan de Pasto, Nariño, Colombia (URL: https://www2.sgc.gov.co/volcanes/index.html).
Gemini-Oscostar (Vanuatu) — February 1996 Cite this Report
Gemini-Oscostar
Vanuatu
20.957°S, 170.13°E; summit elev. -33 m
All times are local (unless otherwise noted)
Submarine eruption; the first recorded historical activity
A submarine eruption was observed in the southern New Hebrides island arc (Vanuatu), an area without previously documented historical activity. The activity was first observed by the merchant ship OSCO STAR cruising in this area on 18 February around 1800. It was described as "continual steam and frequent vertical bursts of very dark water." Observations during a New Caledonia Coast Guard flight on 19 February revealed a white zone within a steaming black patch. A similar flight on 22 February enabled a television crew from RFO New Caledonia to take videotape footage for the local news. Observers on that flight noted that the white zone, from which steam was rising, had a diameter of ~400 m. This zone was located inside a wider ellipse, brown-ochre in color, elongated ~4 km down-current. Every 3-9 minutes an explosion sent black products ~20 m above sea level. After each explosion, the diameter of the white area diminished drastically, rising again during the next explosion. The black products were diluted to form the brown-ochre zone. This activity was probably similar to that documented on 18 February.
Located ~100 km S of Anatom Island, about halfway between Yasur Volcano (Tanna Island) and Matthew Island, the Eastern Gemini seamount is one of several seamounts along the southern submarine extension of the New Hebrides island arc. Several basalt samples and one andesite dredged from this seamount in 1989 (Monzier and others, 1993) were described as glassy, vesicular, and extremely fresh (Bargibant and others, 1989). Because all of the samples were devoid of marine animal traces, the activity was described as very recent. The nearby Western Gemini seamount is located near 21.0°S, 170.05°E, at a depth of 30 m below sea level. Well-developed marine life around its summit suggests that its activity is older.
References. Monzier, M., Danyushevsky, L.V., Crawford, A.J., Bellon, H., and Cotten, J., 1993, High-Mg andesites from the southern termination of the New Hebrides island arc (SW Pacific): Journal of Volcanology and Geothermal Research, v. 57, p. 193-217.
Bargibant and others, 1989, ORSTOM Noumea Earth Sciences Report, no. 12, 13 p. (unpublished).
Geologic Background. The submarine Gemini-Oscostar volcanic field lies near the southern end of the Vanuatu (or New Hebrides) Volcanic Arc, ~100 km S of Aneityum Island. Water discoloration and bursts of very dark water were observed from Oscostar seamount (also known as Eastern Gemini) from a passing ship on 18 February 1996. Overflights as late as 22 February noted periodic explosions that ejected black material to about 20 m above sea level. It consists of an elongated NNE-SSW-trending ridge of submarine volcanoes with satellitic cones. Several basaltic samples and one andesitic rock dredged in 1989 were described as glassy, vesicular, and extremely fresh.
Information Contacts: Bernard Pelletier, Centre ORSTOM de Noumea, BP A5, Noumea, New Caledonia; Michel Lardy, ORSTOM, BP 76, Port Vila, Vanuatu; Michel Monzier and Claude Robin, ORSTOM, AP 17-11-6596 CCI, Quito, Ecuador; Jean-Philippe Eissen, Centre ORSTOM de Brest, BP 70, 29280 Plouzane, France.
Hokkaido-Komagatake (Japan) — February 1996 Cite this Report
Hokkaido-Komagatake
Japan
42.063°N, 140.677°E; summit elev. 1131 m
All times are local (unless otherwise noted)
Tremor and extension precede early March phreatic eruption
In the early evening of 5 March, >=6 minutes of large amplitude volcanic tremor registered and during the night an eruption began. The monthly record of earthquakes from 1966 until the eruption showed little in the way of a diagnostic rise prior to the eruption (figure 1). The above mentioned tremor was detected at the local Japan Meteorological Agency (JMA) seismic station (4.1 km WSW from the crater). Tremor was also noted by Usu Volcano Observatory (UVO), which maintains five seismic stations. On 5 March UVO recorded 5 minutes of premonitory tremor and an abnormally high number (> 10) of small volcanic earthquakes. Prior to the heightened seismicity, UVO researchers found continuous extension of Komaga-take's 1929 crater area begining in 1989, and their leveling survey in November 1995 showed a reversal from subsidence to uplift.
On the morning of 6 March JMA reported that a white plume rose to 150 m above the summit and ashfall was visible for >10 km from the summit on the SSE flank. According to Tad Ui, who made observations from a helicopter during the morning of 6 March, steam-dominated eruption clouds rose from inside the craters of the 1929 eruption and also from new, 100-m-long, N-S trending fissures S of the craters. He estimated the cloud height at around 400 m. Ashfall covered new snow; no mudflows were observed. Videos taken around this time by the press and local residents showed violent, gray, ash-laden clouds jetting from newly formed fissures.
On 8 March, a white-colored plume was 900 m above the summit. By 12 March, eruptive activity declined. Post-eruption seismicity was weak: tremor was not observed from 5 March to as late as 10 March, and after 6 March small earthquakes occurred several times a day.
An aviation notice on 7 March stated that the top of the ash cloud was at ~1,500-m altitude (~300 m above the summit) and drifting SE; a notice the next day reported ash to ~1,700 m altitude drifting W. Notices were again issued on 13 and 19 March for ash clouds to ~1,300-m altitude.
Ui and other scientists from Hokkaido University will analyze new products; preliminary analysis suggested that the initially erupted tephra contained little fresh glass, and other magmatic materials appeared absent. The mass of tephra erupted in this event was estimated at ~25,000 tons.
Residents evacuated the night of 5 March were permitted to return on 8 March. Small phreatic eruptions of the kind witnessed beginning on 5 March 1996 could be precursors to larger explosions. Phreatic eruptions were observed during June 1919, and in June 1929, prior to larger events.
Geologic Background. Much of the truncated Hokkaido-Komagatake andesitic volcano on the Oshima Peninsula of southern Hokkaido is Pleistocene in age. The sharp-topped summit lies at the western side of a large breached crater that formed as a result of edifice collapse in 1640 CE. Hummocky debris avalanche material occurs at the base of the volcano on three sides. Two late-Pleistocene and two Holocene Plinian eruptions occurred prior to the first historical eruption in 1640, which began a period of more frequent explosive activity. The 1640 eruption, one of the largest in Japan during historical time, deposited ash as far away as central Honshu and produced a debris avalanche that reached the sea. The resulting tsunami caused 700 fatalities. Three Plinian eruptions have occurred since 1640; in 1694, 1856, and 1929.
Information Contacts: Tadahide Ui, Hokkaido University, Grad School Sci., Kita-ku, Sapporo 060 Japan; Usu Volcano Observatory (UVO), Faculty of Science, Hokkaido University, Sohbetsu-cho, Usu-gun, Hokkaido 052-01 Japan; Volcanological Division, Seismological and Volcanological Dept, Japan Meteorological Agency (JMA), 1-3-4 Ote-machi, Chiyoda-ku, Tokyo 100 Japan; Setsuya Nakada, Volcano Research Center, Earthquake Research Institute, University of Tokyo, Yayoi 1-1-1, Bunkyo-ku, Tokyo 113, Japan (URL: http://www.eri.u-tokyo.ac.jp/VRC/index_E.html); Bureau of Meteorology, Darwin, Australia.
Iwatesan (Japan) — February 1996 Cite this Report
Iwatesan
Japan
39.853°N, 141.001°E; summit elev. 2038 m
All times are local (unless otherwise noted)
Small-amplitude tremor
On 13, 24, and 29 January small-amplitude volcanic tremors occurred. Such tremors were previously observed on 20 October 1995.
Geologic Background. Viewed from the east, Iwatesan volcano has a symmetrical profile that invites comparison with Fuji, but on the west an older cone is visible containing an oval-shaped, 1.8 x 3 km caldera. After the growth of Nishi-Iwate volcano beginning about 700,000 years ago, activity migrated eastward to form Higashi-Iwate volcano. Iwate has collapsed seven times during the past 230,000 years, most recently between 739 and 1615 CE. The dominantly basaltic summit cone of Higashi-Iwate volcano, Yakushidake, is truncated by a 500-m-wide crater. It rises well above and buries the eastern rim of the caldera, which is breached by a narrow gorge on the NW. A central cone containing a 500-m-wide crater partially filled by a lake is located in the center of the oval-shaped caldera. A young lava flow from Yakushidake descended into the caldera, and a fresh-looking lava flow from the 1732 eruption traveled down the NE flank.
Information Contacts: Japan Meteorological Agency (JMA), Volcanological Division, Seismological and Volcanological Department, 1-3-4 Ote-machi, Chiyoda-ku, Tokyo 100, Japan.
Karymsky (Russia) — February 1996 Cite this Report
Karymsky
Russia
54.049°N, 159.443°E; summit elev. 1513 m
All times are local (unless otherwise noted)
Ongoing explosions eject steam and minor ash
Following the main eruptive period in early January, Karymsky had produced one to several small explosions a day. The explosions consisted mainly of steam with minor ash rising to heights <=1.5 km above the summit. Daily explosions continued until at least ~7 March. The lava flow erupted in January stopped growing during early February and continued cooling. The Institute of Volcanic Geology and Geochemistry (IVGG) reported that during the first week of March, Karymsky lake had a temperature of 23°C with a hotter area (32°C) located at its N end.
Ground reports noted one eruptive pulse at 2330 on 29 February; it sent ash and steam to ~4 km altitude; satellite imagery failed to detect this pulse. Simulated trajectory for plumes showed them generally blowing S to SSW.
Geologic Background. Karymsky, the most active volcano of Kamchatka's eastern volcanic zone, is a symmetrical stratovolcano constructed within a 5-km-wide caldera that formed during the early Holocene. The caldera cuts the south side of the Pleistocene Dvor volcano and is located outside the north margin of the large mid-Pleistocene Polovinka caldera, which contains the smaller Akademia Nauk and Odnoboky calderas. Most seismicity preceding Karymsky eruptions originated beneath Akademia Nauk caldera, located immediately south. The caldera enclosing Karymsky formed about 7600-7700 radiocarbon years ago; construction of the stratovolcano began about 2000 years later. The latest eruptive period began about 500 years ago, following a 2300-year quiescence. Much of the cone is mantled by lava flows less than 200 years old. Historical eruptions have been vulcanian or vulcanian-strombolian with moderate explosive activity and occasional lava flows from the summit crater.
Information Contacts: Vladimir Kirianov and Yuri Doubik, IVGG; Alaska Volcano Observatory; Synoptic Analysis Branch, NOAA/NESDIS, USA.
Kujusan
Japan
33.086°N, 131.249°E; summit elev. 1791 m
All times are local (unless otherwise noted)
Seismic activity continues but plume is devoid of ash
High seismicity was recorded throughout February: earthquakes totaled 303. No volcanic tremors were observed. The height of the ash-free plume remained at 100-300 m throughout the month. There was no ashfall.
Geologic Background. Kujusan is a complex of stratovolcanoes and lava domes lying NE of Aso caldera in north-central Kyushu. The group consists of 16 andesitic lava domes, five andesitic stratovolcanoes, and one basaltic cone. Activity dates back about 150,000 years. Six major andesitic-to-dacitic tephra deposits, many associated with the growth of lava domes, have been recorded during the Holocene. Eruptive activity has migrated systematically eastward during the past 5000 years. The latest magmatic activity occurred about 1600 years ago, when Kurodake lava dome at the E end of the complex was formed. The first reports of historical eruptions were in the 17th and 18th centuries, when phreatic or hydrothermal activity occurred. There are also many hot springs and hydrothermal fields. A fumarole on Hosho lava dome was the site of a sulfur mine for at least 500 years. Two geothermal power plants are in operation at Kuju.
Information Contacts: Volcanological Division, Seismological and Volcanological Department, Japan Meteorological Agency (JMA), 1-3-4 Ote-machi, Chiyoda-ku, Tokyo 100 Japan.
Kusatsu-Shiranesan (Japan) — February 1996 Cite this Report
Kusatsu-Shiranesan
Japan
36.618°N, 138.528°E; summit elev. 2165 m
All times are local (unless otherwise noted)
Minor hydrothermal ejection in Yu-gama crater
According to Kusatsu-Shirane Volcano Observatory (Tokyo Institute of Technology), at 1044 on 7 February geophysical changes occurred. A hydrophone submerged in Yu-gama pond recorded large amplitude sound waves and a meter registered water-level changes. Observers on 14 and 24 February saw discolored water near the NW part of the pond's surface and pieces of broken ice, 20-30 cm in size, along the shore. Therefore, on 7 February, a small magnitude ejection might have occurred at the pond. When a similar phenomenon was last observed, 6 January 1989, it was ascribed to hydrothermal activity.
Geologic Background. The Kusatsu-Shiranesan complex, located immediately north of Asama volcano, consists of a series of overlapping pyroclastic cones and three crater lakes. The andesitic-to-dacitic volcano was formed in three eruptive stages beginning in the early to mid-Pleistocene. The Pleistocene Oshi pyroclastic flow produced extensive welded tuffs and non-welded pumice that covers much of the E, S, and SW flanks. The latest eruptive stage began about 14,000 years ago. Historical eruptions have consisted of phreatic explosions from the acidic crater lakes or their margins. Fumaroles and hot springs that dot the flanks have strongly acidified many rivers draining from the volcano. The crater was the site of active sulfur mining for many years during the 19th and 20th centuries.
Information Contacts: Volcanological Division, Japan Meteorological Agency, 1-3-4 Ote-machi, Chiyoda-ku, Tokyo 100, Japan
Langila (Papua New Guinea) — February 1996 Cite this Report
Langila
Papua New Guinea
5.525°S, 148.42°E; summit elev. 1330 m
All times are local (unless otherwise noted)
Ash-and-vapor clouds and occasional night glow
Activity at Crater 2 was low to moderate in January and moderate in February. During this time, the explosions produced thick white-gray ash-and-vapor clouds; these usually blew SE over unpopulated areas. Eruption sounds varied between rumblings and detonations. On most February nights, observers saw variable glow over Crater 2 and, on 2, 8, and 23 February, ejection of incandescent lava fragments. During January and February, Crater 3 was inactive, but moderate seismicity prevailed. The daily total of explosion earthquakes during February ranged between 0 and 5.
Geologic Background. Langila, one of the most active volcanoes of New Britain, consists of a group of four small overlapping composite basaltic-andesitic cones on the lower E flank of the extinct Talawe volcano in the Cape Gloucester area of NW New Britain. A rectangular, 2.5-km-long crater is breached widely to the SE; Langila was constructed NE of the breached crater of Talawe. An extensive lava field reaches the coast on the N and NE sides of Langila. Frequent mild-to-moderate explosive eruptions, sometimes accompanied by lava flows, have been recorded since the 19th century from three active craters at the summit. The youngest and smallest crater (no. 3 crater) was formed in 1960 and has a diameter of 150 m.
Information Contacts: Ima Itikarai and Ben Talai, RVO.
Manam (Papua New Guinea) — February 1996 Cite this Report
Manam
Papua New Guinea
4.08°S, 145.037°E; summit elev. 1807 m
All times are local (unless otherwise noted)
Steam emitted at low-to-moderate rates
During January and February both summit craters emitted white vapors at low to moderate rates. While activity at Manam was very subdued in February, S Crater released blue emissions on two days (11-12 February) and weak booming noises were heard during the month. Neither ash emissions nor increased white vapor emissions were noted at the time of the sound effects.
No seismic monitoring took place at Manam during February. Tilt measurements from the water-tube tilt meters at Tabele Observatory (4 km from the summit) indicated little or no tilt for the month.
Geologic Background. The 10-km-wide island of Manam, lying 13 km off the northern coast of mainland Papua New Guinea, is one of the country's most active volcanoes. Four large radial valleys extend from the unvegetated summit of the conical basaltic-andesitic stratovolcano to its lower flanks. These valleys channel lava flows and pyroclastic avalanches that have sometimes reached the coast. Five small satellitic centers are located near the island's shoreline on the northern, southern, and western sides. Two summit craters are present; both are active, although most observed eruptions have originated from the southern crater, concentrating eruptive products during much of the past century into the SE valley. Frequent eruptions, typically of mild-to-moderate scale, have been recorded since 1616. Occasional larger eruptions have produced pyroclastic flows and lava flows that reached flat-lying coastal areas and entered the sea, sometimes impacting populated areas.
Information Contacts: RVO.
Miyakejima (Japan) — February 1996 Cite this Report
Miyakejima
Japan
34.094°N, 139.526°E; summit elev. 775 m
All times are local (unless otherwise noted)
Low-frequency earthquakes
Low-frequency earthquakes were recorded on 21 and 23 January.
Geologic Background. The circular, 8-km-wide island of Miyakejima forms a low-angle stratovolcano that rises about 1,100 m from the sea floor in the northern Izu Islands about 200 km SSW of Tokyo. The basaltic volcano is truncated by small summit calderas, one of which, 3.5 km wide, was formed during a major eruption about 2,500 years ago. Numerous craters and vents, including maars near the coast and radially oriented fissure vents, are present on the flanks. Frequent eruptions have been recorded since 1085 CE at vents ranging from the summit to below sea level, causing much damage on this small populated island. After a three-century-long hiatus ending in 1469 CE, activity has been dominated by flank fissure eruptions sometimes accompanied by minor summit eruptions. A 1.6-km-wide summit crater was slowly formed by subsidence during an eruption in 2000.
Information Contacts: Volcanological Division, Seismological and Volcanological Department, Japan Meteorological Agency (JMA), 1-3-4 Ote-machi, Chiyoda-ku, Tokyo 100 Japan.
North Gorda Ridge Segment (United States) — February 1996 Cite this Report
North Gorda Ridge Segment
United States
42.67°N, 126.78°W; summit elev. -3000 m
All times are local (unless otherwise noted)
Eruption or intrusive event detected by acoustic signals
In late February and early March a possible submarine eruption was detected on the Gorda Ridge. Seismo-acoustic T-waves established the epicenter at between 42.41 and 42.75°N. Vertical conductivity-temperature-depth (CTD) casts found a candidate plume at 42.67°N, 126.78°W.
Beginning at 0700 GMT on 28 February, intense seismicity was detected using the T-phase Monitoring System developed by National Oceanic and Atmospheric Administration's Pacific Marine Environmental laboratory (NOAA/PMEL) to access the U.S. Navy's Sound Surveillance System (SOSUS) in the NE Pacific. The event was located on the northernmost segment of the Gorda Ridge (figure 1), over 200 km W of the Oregon coast. The seismicity was very similar to that observed in June 1993 at the CoAxial Segment of the Juan de Fuca Ridge at 46.5°N (BGVN 18:07), which was later documented to be the lateral injection of magma with a subsequent eruption.
For the first 42 hours of T-wave seismicity, two proximal SOSUS arrays were not operating, so the presence of seismicity in the general area of the northern Gorda Ridge was confirmed based on distant arrays. The proximal SOSUS array became operational on 6 March, allowing improved sensitivity and epicenter estimates. Seismicity continued during 6-8 March, located thoughout the S half of the ridge segment from 42°25' to 42°45'N.
The Gorda Ridge Eruption Assessment Team (GREAT), aboard the NOAA Ship MacArthur, reached the area on 8 March. They began a series of vertical CTD casts starting at 42°26.2'N, 126°55.3' W, and proceeding N along the ridge axis with measurements at ~2' intervals; only 2,900 m of wire was useable. No plume signals were detected on the first six casts, although up to 1 km of the water column remained below the deepest CTD depths reached. At 42°37.9'N, 126°47.8'W, temperature and particle plumes were found between 1,850 and 2,800 m above a bottom depth of 3,300 m. The main plume lens was centered at 1,850-2,300 m, with several thinner and less intense plumes below. Plume distribution was similar at the next two stations N, though the overall plume became thinner and less intense. A plume located 24 hours later was similar, perhaps indicating advection of the plume to the W.
On 9 March seismicity decreased to <10 events/hour. Only minor seismic activity was recorded on 10 March, mostly from the shallower "narrow-gate" (summit) area near 42°45'N. That day, GREAT detected a large hydrothermal plume centered near 42°40'N, 126°47'W that may have been due to recent magmatic activity. Initial survey work indicated that the plume may have been an agglomeration of more than one discharge. It had a maximum thickness of ~700 m, a maximum diameter of ~10 km, and a maximum temperature anomaly of ~0.12°C. Seismicity continued at a low level (<5 earthquakes/hour) during 11-14 March. Seismic activity increased again at 1625 GMT on 15 March to >25 events in the first hour. The nature of the seismicity appeared to be due to magma injection rather than eruption. Preliminary locations for the 15 March activity were in the summit area.
Based on their exceptional height above the axial valley, most of the major plumes detected through 15 March were thought to be event plumes. The capability to demonstrate the vertical and horizontal symmetry characteristic of event plumes was not available. Apparently, several distinct event plumes were mapped that differ in depth and in horizontal and vertical dimensions. One alternative hypothesis is that all, or some, of the plumes are chronic plumes originating high on the valley walls. No substantial near-seafloor plumes have been found. The source of the presumed event plumes may be S of their present position in water too deep for available equipment to reach, farther to the N where samples had not yet been taken, or beneath their present position but as yet undetected.
Remaining unanswered questions regarding the Gorda Ridge event, as well as mid-ocean ridge events generally include: spatial and temporal patterns of seismicity, intrusive vs. extrusive behavior, the origin of the event plumes, and patterns and rates of geochemical and microbiological processes associated with event plumes and resulting chronic plumes. A second response cruise on the UNOLS RV Wecoma during the first two weeks of April 1996 will focus on water column work and camera tows.
Substantial data sets have been previously collected in this area. Water column surveys collected by NOAA in 1985 and later surveys by Oregon State University showed water column temperature anomalies in the area, which was labelled GR-14. Full SeaBeam coverage has been collected by NOAA. SeamarC II surveys were collected in the area in 1983 by USGS/University of Hawaii. Detailed SeamarC I surveys were collected by NOAA/PMEL in the northern half of the segment in 1987. Camera surveys were conducted in 1985-86 by USGS and NOAA/PMEL. Extensive dredges were also collected by USGS. The Navy's SeaCliff submersible dove in the area in 1988.
Geologic Background. The northernmost of five segments of the Gorda Ridge lies immediately south of the Blanco Transform Fault that offsets the Gorda and Juan de Fuca oceanic spreading ridges. The 65-km-long segment is located about 200 km W of the southern Oregon coast and has deep 5- 10-km-wide valleys at either ends with a shallower narrow axial valley at the center. This morphology, which in plan view resembles an hourglass, is typical of magmatically active spreading segments. A submarine lava flow was erupted in late February and early March 1996, near the center of the segment. The eruption was initially detected through acoustic T-waves from a seismic swarm and the emission of large thermal plumes. In April submarine cameras revealed new lava flows about 100-200 m wide along a fissure that was at least 3.5 km long. A seismic swarm of uncertain origin also occurred at this location in January 1998.
Information Contacts: Chris Fox, Bob Embley, Bob Dziak, and Ed Baker, NOAA Pacific Marine Environmental Laboratory, 2115 SE Osu Drive, Newport, OR 97365 USA (URL: http://www.pmel.noaa.gov); RIDGE Office, Ocean Processes Analysis Laboratory, Morse Hall, 39 College Road, University of New Hampshire, Durham, NH 03824-3525 USA (URL: http://ridge.unh.edu).
Popocatepetl (Mexico) — February 1996 Cite this Report
Popocatepetl
Mexico
19.023°N, 98.622°W; summit elev. 5393 m
All times are local (unless otherwise noted)
New eruptive episode produces ash plume that drifts over SW coast
An ash-emission event was detected at 0349 on 5 March when continuous tremor began. This seismicity remained at relatively high levels for about one hour, and then decreased. Mild ashfalls were reported in the immediate area around the volcano, particularly in the N sector. During a helicopter reconnaissance flight at 1200, ash deposits were confirmed, especially in the close neigborhood of Tlamacas (figure 12). The glacier and snow near the summit were entirely covered by ash, confirming statements made by witnesses who saw ash emissions in the morning. A vigorous ash-and-gas column could be seen rising ~800 m vertically; it dispersed NE in a long plume. A sulfur smell could clearly be perceived near the crater. The emission of gas, steam, and ash appeared to come from the same three sources in the E side of the crater that produced the 1994-95 activity (BGVN 19:11, 19:12, and 20:01-20:04). This event on 5 March seemed very similar to that of 21 December 1994, but perhaps about an order of magnitude lower, an intensity comparable to the levels of activity observed on 26 December 1994. The only activity that may be regarded as precursory was a small A-type event at 0227 (M 1.2).
Tremor activity slowly decreased through the night of 5-6 March. At 0710 on 6 March another sudden increase in the gas and ash emission rates was accompanied by tremor signals comparable to those of the previous day. These levels persisted through at least 1030 on 6 March. During a second helicopter reconnaissance flight, between 0825 and 0930, the ash plume was larger than the previous day, and directed E. However, the plume, consisting of steam, gases, and dilute fine-grained ash, bent as it exited the crater. Considering the low wind speed at the summit (~28 km/hour), this suggested a low thermal power in the emission.
At 1245 on 6 March a new and stronger ash-emission event was detected. Volcanic tremor increased correspondingly. Tremor amplitude continued to increase until 1532, when it reached the relatively high levels of early 5 March, where it remained for at least three hours. The ash plume, now with a higher particle density, was blown SE at ~22 km/hour. Besides tremor, during the first two days of the eruption there were mixed low-magnitude A- and B-type earthquakes at shallow to intermediate depths, with the greatest concentration at ~5-9 km beneath the summit (figure 13).
Volcanic tremor amplitude and the ash emission rate remained fairly constant until 1030 on 7 March, when tremor amplitudes decreased by a factor of about two. However, a helicopter flight at 0800-0900 showed some increase in the apparent emission rate. Mild ashfall on the volcanoþs flank was observed under the plume; wind speed was low (10-12 km/h). These conditions remained stable until 7 March at 1650, when tremor amplitude and duration increased to levels exceeding those of December 1994. Stronger winds (60 km/hour at 1100) bent the plume horizontally from the crater, dispersing the ash farther E. Tiltmeters showed some oscillations, probably related to the high tremor level, but no actual deformation was detected. High tremor amplitudes persisted until 1400 on 10 March, when tremor amplitude and the ash emission rate slowly underwent a 5-fold decrease.
Low-level activity persisted until 11 March at 1800, with three important exceptions. At 1845 on 10 March, a strong emission produced an ash column nearly 3 km high accompanied by a small 2-minute duration B-type volcanic earthquake. These events repeated at 0921 and 0937 on 11 March. The 0921 event was preceded by a fairly high-frequency A-type earthquake at 0906. On 11 March at 1800, the pattern of activity started to return to continuous tremor and ash emission. These tremor signals have been interpreted as high-speed exhaust of volcanic gases that remobilize non-juvenile ash.
Satellite imagery, 10-11 March. Analysis of satellite imagery by the NOAA Synoptic Analysis Branch revealed that an eruption at 0245 on 10 March was followed 30 minutes later by a larger burst. The height of the ash was estimated to be just above the summit level (5.5 km). By 1315 that day the ash plume had extended S and SW as far as the Pacific Ocean (figure 14a). Movement of the ash cloud by 1515 suggested that the ash probably extended upwards to ~7 km. The last usable visible imagery on 10 March (at 1815) showed the thicker portion of the ash cloud over the ocean (figure 14b), but less ash in the immediate vicinity of the volcano. This correlates with the decrease in tremor amplitude and ash emission that began at 1400 as noted above. However, infrared imagery indicated continued eruptive activity through the night.
The first visible imagery the next morning, at 0915, showed the volcano still erupting with the ash moving S and then W over the East Pacific Ocean (figure 14c), possibly with thinner ash even farther away. A stronger eruptive event at 0945 (probably the 0921 and 0937 events as noted above) sent a plume to perhaps 7.5 km altitude where it was blown SE. The cloud from these events had dissipated by the time of the next visible image at 1015. Eruptions became intermittent over the next three hours, with the estimated plume height remaining at ~7 km altitude. Ash seen on imagery at 1315 was present in a very narrow S-directed area (figure 14d), with thinner ash detected over the ocean.
Geologic Background. Volcán Popocatépetl, whose name is the Aztec word for smoking mountain, rises 70 km SE of Mexico City to form North America's 2nd-highest volcano. The glacier-clad stratovolcano contains a steep-walled, 400 x 600 m wide crater. The generally symmetrical volcano is modified by the sharp-peaked Ventorrillo on the NW, a remnant of an earlier volcano. At least three previous major cones were destroyed by gravitational failure during the Pleistocene, producing massive debris-avalanche deposits covering broad areas to the south. The modern volcano was constructed south of the late-Pleistocene to Holocene El Fraile cone. Three major Plinian eruptions, the most recent of which took place about 800 CE, have occurred since the mid-Holocene, accompanied by pyroclastic flows and voluminous lahars that swept basins below the volcano. Frequent historical eruptions, first recorded in Aztec codices, have occurred since Pre-Columbian time.
Information Contacts: Servando De la Cruz (CENAPRED and Instituto de Geofisica, UNAM); Roberto Quaas, Enrique Guevara, Bertha López, Alicia Martínez, and Carlos Gutierrez, Centro Nacional de Prevencion de Desastres (CENAPRED), México; Claus Siebe, Instituto de Geofisica, UNAM, Coyoacán 04510 DF, México; Carlos Valdes-Gonzalez, Depto de Sismología y Volcanología, Instituto de Geofísica, UNAM, Ciudad Universitaría 04510 DF, México; Jim Lynch, NOAA/ NESDIS Synoptic Analysis Branch, Room 401, 5200 Auth Road, Camp Springs, MD 20746, USA.
Rabaul (Papua New Guinea) — February 1996 Cite this Report
Rabaul
Papua New Guinea
4.2459°S, 152.1937°E; summit elev. 688 m
All times are local (unless otherwise noted)
Tavurvurs November eruption continues; 35% increase in seismicity
Tavurvur's two-month-long eruption continued in February with weak to moderate explosions every few minutes. At close range, roaring and detonation sounds could be heard. Pale to dark gray ash and vapor clouds rose ~400-1,000 m above the crater rim and formed a plume 10-15 km long. The plume generally trended SE over the sea, but occasionally it moved NW over Rabaul Town. At times, ballistic blocks were ejected as far as the outer slopes of Tavurvur's low cone. Sprays of incandescent lava were occasionally seen at night. There were no emissions from Vulcan.
During February, seismicity reached its highest level since the current phase of eruptive activity began on 28 November, 1995 (BGVN 20:11/12). A total of 5,212 eruption-related seismic events were recorded in February, which compares to 3,850 in January, and 1,283 in December. Seismicity peaked in mid-February, declining slightly during the second half of the month. February earthquakes consisted of 4 short-duration volcanic tremors, 5,187 explosion earthquakes, and 21 high-frequency earthquakes. The first two groups of events were directly associated with Tavurur's eruptive activity; 707 of the explosion earthquakes had a distinct air-wave phase recorded at distant seismic stations.
High-frequency earthquakes chiefly occurred in two main time intervals of dissimilar duration. The first interval included 10 events and occurred during 5 minutes on the 10th. The largest event had a magnitude (ML) of 3.1 and was felt in Rabaul Town with a Modified Mercalli intensity of III. The second interval included nine events and occurred over four consecutive days. Except for one earthquake on the W side of the caldera seismic zone, all others were located immediately NE of the caldera.
Ground deformation measurements indicated slight inflation. Between 1 February and 1 March, just W of Tavurvur (Greet Harbor area), tilt amounted to ~15 µrad. In the second half of February, on the opposite side of the caldera (the SW, in vicinity of Vulcan), tilt amounted to ~5 µrad.
Reference. Lauer, S., Pumice and ash: a personal account of the 1994 Rabaul volcanic eruptions, Quality Plus Printers, Ltd., Ballina, NSW, Australia, 1995.
Geologic Background. The low-lying Rabaul caldera on the tip of the Gazelle Peninsula at the NE end of New Britain forms a broad sheltered harbor utilized by what was the island's largest city prior to a major eruption in 1994. The outer flanks of the asymmetrical shield volcano are formed by thick pyroclastic-flow deposits. The 8 x 14 km caldera is widely breached on the east, where its floor is flooded by Blanche Bay and was formed about 1,400 years ago. An earlier caldera-forming eruption about 7,100 years ago is thought to have originated from Tavui caldera, offshore to the north. Three small stratovolcanoes lie outside the N and NE caldera rims. Post-caldera eruptions built basaltic-to-dacitic pyroclastic cones on the caldera floor near the NE and W caldera walls. Several of these, including Vulcan cone, which was formed during a large eruption in 1878, have produced major explosive activity during historical time. A powerful explosive eruption in 1994 occurred simultaneously from Vulcan and Tavurvur volcanoes and forced the temporary abandonment of Rabaul city.
Information Contacts: Ima Itikarai and Ben Talai, Rabaul Volcano Observatory, P.O. Box 386, Rabaul, Papua New Guinea.
Soufriere Hills (United Kingdom) — February 1996 Cite this Report
Soufriere Hills
United Kingdom
16.72°N, 62.18°W; summit elev. 915 m
All times are local (unless otherwise noted)
Increasingly rapid dome growth
As reported in Montserrat Volcano Observatory (MVO) Scientific Reports, during February the growing dome became higher than Castle Peak and was visible on the volcano's W margins. Based on qualitative estimates, during the third week of February and early March the dome's growth probably reached the highest rates seen since extrusion began around 16 November 1995 (BGVN 20:11/12).
Dome growth and visible observations. As the dome enlarged, the focus of its growth migrated. During 1-7 February the dome's N side grew upward, and the S side grew outward. The dome's N side first became visible from the volcano's W margins beginning on 31 January. Under clear conditions on 2 February it was confirmed that this side of the dome had grown higher than Castle Peak. On 4 February this side of the dome reached a height equal to adjacent parts of the crater wall; talus from the dome's N side filled the adjacent moat and began piling up against the crater wall.
Although low cloud cover generally hampered visibility during the week of 8-14 February, observations around 9 February indicated slowed growth on the N and S coupled with a shift in the focus of activity to the dome's W side. On 11 February a spine was seen in the dome's central sector; its height then was equal to the dome's N side. That day, talus made contact with the crater wall around much of the dome. On 12 February a late morning helicopter flight allowed observers to see a small pyroclastic flow created as debris from the central dome avalanched S. Later in the week, growth took place on the dome's SE side and, in the form of two new protrusions, on the dome's W side.
A second consecutive week of low cloud cover occurred, 15-21 February, and by the end of this interval it was learned that the dome's SE side included a large whaleback-shaped lobe. This new lobe grew to reach the size of the southern whaleback, a lobe emplaced around 19 January (figure 8). The new lobe (not shown on figure 8) was the source of comparatively few rockfalls, and therefore was considered to be relatively massive and coherent. In contrast, frequent rockfalls fell down off the dome's central region and NW side and by the end of the week this area became the focus of growth. The moat's W margin, at the base of Gage's wall (figure 8), received considerable debris. Previously, this area had been the last part of the moat's W margin without appreciable debris.
During the week of 22-28 February, the dome growth rate, which was estimated qualitatively, may have been the highest since extrusion began. High steam and gas fluxes also prevailed. Although the resulting plumes thwarted aerial photo-documentation, the dome grew in both vertical and horizontal directions. Semi-continuous rockfalls from specific zones indicated growth in a pattern similar to the previous week. Specifically, most 22-28 February rockfalls came from the dome's central region, as well as its NW, and to a lesser extent, SE sides. A gas sampling visit on 27 February revealed extensive gas escaping from areas on and surrounding the dome, but the primary vent identified was still the 18 July one (see map, BGVN 20:11/12). At this vent escaping gases were 720°C and red-hot rock was seen ~2 m below the surface.
During the week of 29 February-6 March rockfalls from the new dome were abundant, especially from the SW and NW sides; qualitative estimates suggested the highest rate of growth yet seen. Similar to the previous several months, during February and March ash clouds were produced by rock avalanches. A large avalanche on 1 February detached from the dome's S side resulting in a small convective cloud that deposited fine-grained ash on Chances Peak.
Higher than normal amounts of acidic aerosols were noted in the upper Gages valley and through the first 3 weeks of February. During the last week of February, however, the plume rose higher so there was typically less volcanic fog near the ground. During the first week the largest steam emissions came from the dome's top central region. As a result, brown acid burns on vegetation reached as far as Plymouth and Richmond Hill (~5 km W) and some residents suffered irritations.
Rain water sampled during 1-8 February in the Gages valley had a pH of 2.5 and contained sulfates, <3 mg/l; fluorides, 1.5 mg/l; and chlorides, 106 mg/l. The pH has ranged from 2.5 to 3.5 in weekly rainwater tests made beneath the plume on the volcano's W flanks (Upper Amersham). In contrast, the local source springs used for drinking water, also on the W flank, had consistently shown little or no geochemical perturbation. During February it was reported that gases from both the dome and three fumaroles (soufrieres) around the volcano appeared to have changed little during the course of the increased activity.
Results obtained on 27-28 February suggested that neither the Castle Peak nor Gages Wall reflectors showed any greater movement than the reflectors farther from the area of dome extrusion. This was taken to indicate a lack of local deformation at these two sites on the edifice.
Seismicity. During the first week of February, tremor was rare. The chief exceptions were a 4-hour interval of low-amplitude tremor and an 18-hour interval of low- to moderate-amplitude tremor. Throughout much of February, and particularly between the 8th and 14th, intermittent episodes of low- to moderate-amplitude tremor were recorded. Increased tremor amplitude was seen on 17, 19, and 20 February; another episode that started on the 25th lasted ~12 hours.
Small (M 0.0-0.5) hybrid events fluctuated in amplitude but occurred often during February. In a particularly intense episode between 23 January and 6 February, they took place 5-6 times/minute. These hybrid events generally took place less frequently, particularly in late February.
Early in February, long-period earthquakes of M <=2.5 were located. During the most intense interval they took place at a rate of 34/day. Late in February, instrumental locations were obtained for many of the larger (M 1.0-1.8) long-period earthquakes. They all occurred <=3 km beneath the volcano. In addition to thedaily seismic events diagnostic of rockfalls, on 7 February a 10-minute-long signal was received exclusively at Gages station. This signal was probably caused by a mudflow down a nearby drainage (Gages Ghaut).
Geologic Background. The complex, dominantly andesitic Soufrière Hills volcano occupies the southern half of the island of Montserrat. The summit area consists primarily of a series of lava domes emplaced along an ESE-trending zone. The volcano is flanked by Pleistocene complexes to the north and south. English's Crater, a 1-km-wide crater breached widely to the east by edifice collapse, was formed about 2000 years ago as a result of the youngest of several collapse events producing submarine debris-avalanche deposits. Block-and-ash flow and surge deposits associated with dome growth predominate in flank deposits, including those from an eruption that likely preceded the 1632 CE settlement of the island, allowing cultivation on recently devegetated land to near the summit. Non-eruptive seismic swarms occurred at 30-year intervals in the 20th century, but no historical eruptions were recorded until 1995. Long-term small-to-moderate ash eruptions beginning in that year were later accompanied by lava-dome growth and pyroclastic flows that forced evacuation of the southern half of the island and ultimately destroyed the capital city of Plymouth, causing major social and economic disruption.
Information Contacts: Montserrat Volcano Observatory (MVO), c/o Chief Minister's Office, PO Box 292, Plymouth, Montserrat.
Stromboli (Italy) — February 1996 Cite this Report
Stromboli
Italy
38.789°N, 15.213°E; summit elev. 924 m
All times are local (unless otherwise noted)
Intense eruptive phase followed by a drop in seismicity
The following presents previously unreported observations of October 1995 activity made by Roberto Carniel (University of Udine), and seismicity recorded near the summit since mid-September 1995. A contribution from the Istituto Internazionale di Vulcanologia (IIV) provides information about a significant explosive event on 16 February.
October 1995 activity. Abundant light fumarolic activity was seen in the crater area on 13 October 1995 by Carniel. A shallow lava pond in vent 3/1 (see map in BGVN 20:11/12) was inferred by continuous night glow and ejection of small spatters that sometimes reached 3-4 m above the crater rim and only rarely fell outside the vent area. The other active vent in the SW crater (vent 3/2) produced regular explosions, with ejecta reaching considerable heights. Crater 2 was quiet, exhibiting neither explosions nor the gas-jet activity that often characterizes this crater. In Crater 1, the only activity occurred at a hole in cone 1/4; it consisted of continuous gas puffing, strong glow visible during the day, and very short blasts of air and smoke. Vent 1/1 was also active, although its eruptions were not as spectacular as those from 3/2, with occasional emission of a black cloud and ejection of sufficient material to trigger noteworthy movement of pyroclasts down the Sciara del Fuoco.
Mauro Coltelli (IIV) noted that the low lava fountains reported during August-October (BGVN 20:11/12) were typical of the Strombolian activity at the volcano, which was relatively low during that period.
Seismicity recorded at the summit, September-December 1995.Seismic activity recorded by the University of Udine summit station during the last three months of 1995 showed little variation in volcanic tremor intensity (figure 47). The daily number of recorded events was low (<100) in mid-September, reached a maximum of 337 on 18 October, and then decreased again until November. This period was interesting because of rapid transitions between days of very quiet activity (3-5 and 8-9 November) and days with a greater number of events (6-7 November). The minimum of the period was reached on 8 November, with only 53 events recorded during a full day of operation. A greater number of stronger events (either more energetic or less shallow) was recorded at the end of November and in early December (high of 46 events on 4 December).
January-February 1996 activity. January and the first half of February showed increased seismicity, with an average of 200-300 events/day and higher tremor intensity recorded at the summit. IIV reported that explosive activity during the first half of February remained low, ranging from days with an explosion almost every hour to days with a very few explosions. The main activity consisted of Crater 3 explosions that ejected minor spatter and ash puffs. Crater 2 exhibited continuous degassing, rarely interrupted by short periods of low-level spattering. Crater 1 produced daily strong gas explosions, sometimes with minor spatter.
At 2258 GMT on 16 February the seismic stations of the IIV permanent network on Stromboli recorded a sequence of explosion events, some of which were characterized by remarkable amplitudes. The events occurred in a very short time and were followed by increased tremor amplitude lasting ~12 minutes. Thereafter, the increment of tremor amplitude gradually vanished. The seismicity marked an intense eruptive phase from the summit craters. Eyewitnesses in Stromboli village reported a strong blast followed in the next few minutes by some incandescent bombs and glow on the summit; a dark column rose 200-300 m above the craters. No significant activity was observed by local residents for the next several hours. An IIV field survey on 20 February revealed that the bombs fell on an area 200-300 m wide. Both black scoriaceous bombs, covered by Pele's hairs, and reddish fumarolized blocks were observed; the vent that produced these materials was probably in Crater 2 or 3, but no relevant morphological variation of the shape of these craters was observed.
The University of Udine summit seismic station showed a general drop in activity after the event (figure 47). This repeats the pattern already observed after the explosions of 10 February and 16 October 1993 (BGVN 18:01 and 18:09) and after the small lava flow of May 1993 (BGVN 18:09), when similar abrupt decays were observed. The following days show increasing seismicity in terms of both tremor intensity and number of events.
Geologic Background. Spectacular incandescent nighttime explosions at Stromboli have long attracted visitors to the "Lighthouse of the Mediterranean" in the NE Aeolian Islands. This volcano has lent its name to the frequent mild explosive activity that has characterized its eruptions throughout much of historical time. The small island is the emergent summit of a volcano that grew in two main eruptive cycles, the last of which formed the western portion of the island. The Neostromboli eruptive period took place between about 13,000 and 5,000 years ago. The active summit vents are located at the head of the Sciara del Fuoco, a prominent scarp that formed about 5,000 years ago due to a series of slope failures which extends to below sea level. The modern volcano has been constructed within this scarp, which funnels pyroclastic ejecta and lava flows to the NW. Essentially continuous mild Strombolian explosions, sometimes accompanied by lava flows, have been recorded for more than a millennium.
Information Contacts: Roberto Carniel, Dipartimento di Georisorse e Territorio, Univ. di Udine, via Cotonificio 114, I- 33100 Udine; Mauro Coltelli, IIV (URL: http://www.ingv.it/).
Ulawun (Papua New Guinea) — February 1996 Cite this Report
Ulawun
Papua New Guinea
5.05°S, 151.33°E; summit elev. 2334 m
All times are local (unless otherwise noted)
Noiseless steaming and seismic quiet continue
During January and, although less closely monitored, during February, Ulawun continued to release moderate to high volumes of white vapor without any audible sounds. There were no night glows. Seismic activity was low during January; the equipment did not operate during February.
Geologic Background. The symmetrical basaltic-to-andesitic Ulawun stratovolcano is the highest volcano of the Bismarck arc, and one of Papua New Guinea's most frequently active. The volcano, also known as the Father, rises above the N coast of the island of New Britain across a low saddle NE of Bamus volcano, the South Son. The upper 1,000 m is unvegetated. A prominent E-W escarpment on the south may be the result of large-scale slumping. Satellitic cones occupy the NW and E flanks. A steep-walled valley cuts the NW side, and a flank lava-flow complex lies to the south of this valley. Historical eruptions date back to the beginning of the 18th century. Twentieth-century eruptions were mildly explosive until 1967, but after 1970 several larger eruptions produced lava flows and basaltic pyroclastic flows, greatly modifying the summit crater.
Information Contacts: Ima Itikarai and Ben Talai, RVO.
Unzendake (Japan) — February 1996 Cite this Report
Unzendake
Japan
32.761°N, 130.299°E; summit elev. 1483 m
All times are local (unless otherwise noted)
Multiple small block-and-ash flows; the first since February 1995
On 10 February, a pyroclastic flow took place that was caused by collapse of the dome's lobe 7 or 8. No pyroclastic flows had been observed since 11 February 1995. In the next five days, six more small block-and-ash flows occurred; the highest plume reached 500 m.
According to the Shimabara Earthquake and Volcano Observatory, the pyroclastic flows descended SE, traveling ~1 km from the source. The resulting deposits were reddish brown and based on infrared camera measurements hosted lava blocks with temperatures > 60°C. The ash-clouds accompanied by these flows were similar to those of pyroclastic (block-and-ash) flows that took place frequently during 1991-94. Simple rockfalls (without ash-clouds) also occurred simultaneously and reached ~1.5 km from the source, beyond the front of the block-and-ash flows.
Neither volcanic earthquakes nor near-dome tiltmeter perturbations occurred before or after the pyroclastic flows. The collapses may have been due to stresses from either cooling-related or seasonal temperature changes.
Unzen is a large volcanic complex that covers much of the Shimabara Peninsula E of Nagasaki. The Mayu-yama lava dome was the source of a devastating 1792 avalanche and tsunami. Partial dome collapses have continued following Unzen's 1990-93 eruption.
Geologic Background. The massive Unzendake volcanic complex comprises much of the Shimabara Peninsula east of the city of Nagasaki. An E-W graben, 30-40 km long, extends across the peninsula. Three large stratovolcanoes with complex structures, Kinugasa on the north, Fugen-dake at the east-center, and Kusenbu on the south, form topographic highs on the broad peninsula. Fugendake and Mayuyama volcanoes in the east-central portion of the andesitic-to-dacitic volcanic complex have been active during the Holocene. The Mayuyama lava dome complex, located along the eastern coast west of Shimabara City, formed about 4000 years ago and was the source of a devastating 1792 CE debris avalanche and tsunami. Historical eruptive activity has been restricted to the summit and flanks of Fugendake. The latest activity during 1990-95 formed a lava dome at the summit, accompanied by pyroclastic flows that caused fatalities and damaged populated areas near Shimabara City.
Information Contacts: Japan Meteorological Agency (JMA), Volcanological Division, Seismological and Volcanological Department, 1-3-4 Ote-machi, Chiyoda-ku, Tokyo 100, Japan; Shimbara Earthquake and Volcano Observatory (SEVO), Kyushu University, Shimabara-shi, Nagasaki-ken 855 Japan; Setsuya Nakada, Volcano Research Center, Earthquake Research Institute, University of Tokyo, Yayoi 1-1-1, Bunkyo-ku, Tokyo 113, Japan (URL: http://www.eri.u-tokyo.ac.jp/VRC/index_E.html).