Recently Published Bulletin Reports
Ibu (Indonesia) Daily ash explosions continue, along with thermal anomalies in the crater, October 2022-May 2023
Dukono (Indonesia) Continuing ash emissions, SO2 plumes, and thermal signals during October 2022-May 2023
Sabancaya (Peru) Explosions, gas-and-ash plumes, and thermal activity persist during November 2022-April 2023
Sheveluch (Russia) Significant explosions destroyed part of the lava-dome complex during April 2023
Bezymianny (Russia) Explosions, ash plumes, lava flows, and avalanches during November 2022-April 2023
Chikurachki (Russia) New explosive eruption during late January-early February 2023
Marapi (Indonesia) New explosive eruption with ash emissions during January-March 2023
Kikai (Japan) Intermittent white gas-and-steam plumes, discolored water, and seismicity during May 2021-April 2023
Lewotolok (Indonesia) Strombolian eruption continues through April 2023 with intermittent ash plumes
Barren Island (India) Thermal activity during December 2022-March 2023
Villarrica (Chile) Nighttime crater incandescence, ash emissions, and seismicity during October 2022-March 2023
Fuego (Guatemala) Daily explosions, gas-and-ash plumes, avalanches, and ashfall during December 2022-March 2023
Ibu
Indonesia
1.488°N, 127.63°E; summit elev. 1325 m
All times are local (unless otherwise noted)
Daily ash explosions continue, along with thermal anomalies in the crater, October 2022-May 2023
Persistent eruptive activity since April 2008 at Ibu, a stratovolcano on Indonesian’s Halmahera Island, has consisted of daily explosive ash emissions and plumes, along with observations of thermal anomalies (BGVN 47:04). The current eruption continued during October 2022-May 2023, described below, based on advisories issued by the Pusat Vulkanologi dan Mitigasi Bencana Geologi (PVMBG, also known as Indonesian Center for Volcanology and Geological Hazard Mitigation, CVGHM), daily reports by MAGMA Indonesia (a PVMBG platform), and the Darwin Volcanic Ash Advisory Centre (VAAC), and various satellite data. The Alert Level during the reporting period remained at 2 (on a scale of 1-4), except raised briefly to 3 on 27 May, and the public was warned to stay at least 2 km away from the active crater and 3.5 km away on the N side of the volcano.
According to MAGMA Indonesia, during October 2022-May 2023, daily gray-and-white ash plumes of variable densities rose 200-1,000 m above the summit and drifted in multiple directions. On 30 October and 11 November, plumes rose a maximum of 2 km and 1.5 km above the summit, respectively (figures 42 and 43). According to the Darwin VAAC, discrete ash emissions on 13 November rose to 2.1 km altitude, or 800 m above the summit, and drifted W, and multiple ash emissions on 15 November rose 1.4 km above the summit and drifted NE. Occasional larger ash explosions through May 2023 prompted PVMBG to issue Volcano Observatory Notice for Aviation (VONA) alerts (table 6); the Aviation Color Code remained at Orange throughout this period.
Table 6. Volcano Observatory Notice for Aviation (VONA) ash plume alerts for Ibu issued by PVMBG during October 2022-May 2023. Maximum height above the summit was estimated by a ground observer. VONAs in January-May 2023 all described the ash plumes as dense.
| Date |
Time (local) |
Max height above summit |
Direction |
| 17 Oct 2022 |
0858 |
800 m |
SW |
| 18 Oct 2022 |
1425 |
800 m |
S |
| 19 Oct 2022 |
2017 |
600 m |
SW |
| 21 Oct 2022 |
0916 |
800 m |
NW |
| 16 Jan 2023 |
1959 |
600 m |
NE |
| 22 Jan 2023 |
0942 |
1,000 m |
E |
| 29 Jan 2023 |
2138 |
1,000 m |
E |
| 10 May 2023 |
0940 |
800 m |
NW |
| 10 May 2023 |
2035 |
600 m |
E |
| 21 May 2023 |
2021 |
600 m |
W |
| 21 May 2023 |
2140 |
1,000 m |
W |
| 29 May 2023 |
1342 |
800 m |
N |
| 31 May 2023 |
1011 |
1,000 m |
SW |
Sentinel-2 L1C satellite images throughout the reporting period show two, sometimes three persistent thermal anomalies in the summit crater, with the most prominent hotspot from the top of a cone within the crater. Clear views were more common during March-April 2023, when a vent and lava flows on the NE flank of the intra-crater cone could be distinguished (figure 44). White-to-grayish emissions were also observed during brief periods when weather clouds allowed clear views.
The MIROVA space-based volcano hotspot detection system recorded almost daily thermal anomalies throughout the reporting period, though cloud cover often interfered with detections. Data from imaging spectroradiometers aboard NASA’s Aqua and Terra satellites and processed using the MODVOLC algorithm (MODIS-MODVOLC) recorded hotspots on one day during October 2022 and December 2022, two days in April 2023, three days in November 2022 and May 2023, and four days in March 2023.
Geologic Background. The truncated summit of Gunung Ibu stratovolcano along the NW coast of Halmahera Island has large nested summit craters. The inner crater, 1 km wide and 400 m deep, has contained several small crater lakes. The 1.2-km-wide outer crater is breached on the N, creating a steep-walled valley. A large cone grew ENE of the summit, and a smaller one to the WSW has fed a lava flow down the W flank. A group of maars is located below the N and W flanks. The first observed and recorded eruption was a small explosion from the summit crater in 1911. Eruptive activity began again in December 1998, producing a lava dome that eventually covered much of the floor of the inner summit crater along with ongoing explosive ash emissions.
Information Contacts: Pusat Vulkanologi dan Mitigasi Bencana Geologi (PVMBG, also known as Indonesian Center for Volcanology and Geological Hazard Mitigation, CVGHM), Jalan Diponegoro 57, Bandung 40122, Indonesia (URL: http://www.vsi.esdm.go.id/); MAGMA Indonesia (Multiplatform Application for Geohazard Mitigation and Assessment in Indonesia), Kementerian Energi dan Sumber Daya Mineral (URL: https://magma.esdm.go.id/v1); Copernicus Browser, Copernicus Data Space Ecosystem, European Space Agency (URL: https://dataspace.copernicus.eu/browser/); MIROVA (Middle InfraRed Observation of Volcanic Activity), a collaborative project between the Universities of Turin and Florence (Italy) supported by the Centre for Volcanic Risk of the Italian Civil Protection Department (URL: http://www.mirovaweb.it/); Hawai'i Institute of Geophysics and Planetology (HIGP) - MODVOLC Thermal Alerts System, School of Ocean and Earth Science and Technology (SOEST), Univ. of Hawai'i, 2525 Correa Road, Honolulu, HI 96822, USA (URL: http://modis.higp.hawaii.edu/).
Dukono
Indonesia
1.6992°N, 127.8783°E; summit elev. 1273 m
All times are local (unless otherwise noted)
Continuing ash emissions, SO2 plumes, and thermal signals during October 2022-May 2023
Dukono, a remote volcano on Indonesia’s Halmahera Island, has been erupting continuously since 1933, with frequent ash explosions and sulfur dioxide plumes (BGVN 46:11, 47:10). This activity continued during October 2022 through May 2023, based on reports from the Pusat Vulkanologi dan Mitigasi Bencana Geologi (PVMBG; also known as Indonesian Center for Volcanology and Geological Hazard Mitigation, CVGHM), the Darwin Volcanic Ash Advisory Centre (VAAC), and satellite data. During this period, the Alert Level remained at 2 (on a scale of 1-4) and the public was warned to remain outside of the 2-km exclusion zone. The highest reported plume of the period reached 9.4 km above the summit on 14 November 2022.
According to MAGMA Indonesia (a platform developed by PVMBG), white, gray, or dark plumes of variable densities were observed almost every day during the reporting period, except when fog obscured the volcano (figure 33). Plumes generally rose 25-450 m above the summit, but rose as high as 700-800 m on several days, somewhat lower than the maximum heights reached earlier in 2022 when plumes reached as high as 1 km. However, the Darwin VAAC reported that on 14 November 2022, a discrete ash plume rose 9.4 km above the summit (10.7 km altitude), accompanied by a strong hotspot and a sulfur dioxide signal observed in satellite imagery; a continuous ash plume that day and through the 15th rose to 2.1-2.4 km altitude and drifted NE.
Sentinel-2 images were obscured by weather clouds almost every viewing day during the reporting period. However, the few reasonably clear images showed a hotspot and white or gray emissions and plumes. Strong SO2 plumes from Dukono were present on many days during October 2022-May 2023, as detected using the TROPOMI instrument on the Sentinel-5P satellite (figure 34).
Geologic Background. Reports from this remote volcano in northernmost Halmahera are rare, but Dukono has been one of Indonesia's most active volcanoes. More-or-less continuous explosive eruptions, sometimes accompanied by lava flows, have occurred since 1933. During a major eruption in 1550 CE, a lava flow filled in the strait between Halmahera and the N-flank Gunung Mamuya cone. This complex volcano presents a broad, low profile with multiple summit peaks and overlapping craters. Malupang Wariang, 1 km SW of the summit crater complex, contains a 700 x 570 m crater that has also been active during historical time.
Information Contacts: Pusat Vulkanologi dan Mitigasi Bencana Geologi (PVMBG, also known as Indonesian Center for Volcanology and Geological Hazard Mitigation, CVGHM), Jalan Diponegoro 57, Bandung 40122, Indonesia (URL: http://www.vsi.esdm.go.id/); MAGMA Indonesia (Multiplatform Application for Geohazard Mitigation and Assessment in Indonesia), Kementerian Energi dan Sumber Daya Mineral (URL: https://magma.esdm.go.id/v1); Darwin Volcanic Ash Advisory Centre (VAAC), Bureau of Meteorology, Northern Territory Regional Office, PO Box 40050, Casuarina, NT 0811, Australia (URL: http://www.bom.gov.au/info/vaac/); NASA Global Sulfur Dioxide Monitoring Page, Atmospheric Chemistry and Dynamics Laboratory, NASA Goddard Space Flight Center (NASA/GSFC), 8800 Greenbelt Road, Goddard, Maryland, USA (URL: https://so2.gsfc.nasa.gov/); Sentinel Hub Playground (URL: https://www.sentinel-hub.com/explore/sentinel-playground).
Sabancaya
Peru
15.787°S, 71.857°W; summit elev. 5960 m
All times are local (unless otherwise noted)
Explosions, gas-and-ash plumes, and thermal activity persist during November 2022-April 2023
Sabancaya is located in Peru, NE of Ampato and SE of Hualca Hualca. Eruptions date back to 1750 and have been characterized by explosions, phreatic activity, ash plumes, and ashfall. The current eruption period began in November 2016 and has more recently consisted of daily explosions, gas-and-ash plumes, and thermal activity (BGVN 47:11). This report updates activity during November 2022 through April 2023 using information from Instituto Geophysico del Peru (IGP) that use weekly activity reports and various satellite data.
Intermittent low-to-moderate power thermal anomalies were reported by the MIROVA project during November 2022 through April 2023 (figure 119). There were few short gaps in thermal activity during mid-December 2022, late December-to-early January 2023, late January to mid-February, and late February. According to data recorded by the MODVOLC thermal algorithm, there were a total of eight thermal hotspots: three in November 2022, three in February 2023, one in March, and one in April. On clear weather days, some of this thermal anomaly was visible in infrared satellite imagery showing the active lava dome in the summit crater (figure 120). Almost daily moderate-to-strong sulfur dioxide plumes were recorded during the reporting period by the TROPOMI instrument on the Sentinel-5P satellite (figure 121). Many of these plumes exceeded 2 Dobson Units (DU) and drifted in multiple directions.
IGP reported that moderate activity during November and December 2022 continued; during November, an average number of explosions were reported each week: 30, 33, 36, and 35, and during December, it was 32, 40, 47, 52, and 67. Gas-and-ash plumes in November rose 3-3.5 km above the summit and drifted E, NE, SE, S, N, W, and SW. During December the gas-and-ash plumes rose 2-4 km above the summit and drifted in different directions. There were 1,259 volcanic earthquakes recorded during November and 1,693 during December. Seismicity also included volcano-tectonic-type events that indicate rock fracturing events. Slight inflation was observed in the N part of the volcano near Hualca Hualca (4 km N). Thermal activity was frequently reported in the crater at the active lava dome (figure 120).
Explosive activity continued during January and February 2023. The average number of explosions were reported each week during January (51, 50, 60, and 59) and February (43, 54, 51, and 50). Gas-and-ash plumes rose 1.6-2.9 km above the summit and drifted NW, SW, and W during January and rose 1.4-2.8 above the summit and drifted W, SW, E, SE, N, S, NW, and NE during February. IGP also detected 1,881 volcanic earthquakes during January and 1,661 during February. VT-type earthquakes were also reported. Minor inflation persisted near Hualca Hualca. Satellite imagery showed continuous thermal activity in the crater at the lava dome (figure 120).
During March, the average number of explosions each week was 46, 48, 31, 35, and 22 and during April, it was 29, 41, 31, and 27. Accompanying gas-and-ash plumes rose 1.7-2.6 km above the summit crater and drifted W, SW, NW, S, and SE during March. According to a Buenos Aires Volcano Ash Advisory Center (VAAC) notice, on 22 March at 1800 through 23 March an ash plume rose to 7 km altitude and drifted NW. By 0430 an ash plume rose to 7.6 km altitude and drifted W. On 24 and 26 March continuous ash emissions rose to 7.3 km altitude and drifted SW and on 28 March ash emissions rose to 7.6 km altitude. During April, gas-and-ash plumes rose 1.6-2.5 km above the summit and drifted W, SW, S, NW, NE, and E. Frequent volcanic earthquakes were recorded, with 1,828 in March and 1,077 in April, in addition to VT-type events. Thermal activity continued to be reported in the summit crater at the lava dome (figure 120).
Geologic Background. Sabancaya, located in the saddle NE of Ampato and SE of Hualca Hualca volcanoes, is the youngest of these volcanic centers and the only one to have erupted in historical time. The oldest of the three, Nevado Hualca Hualca, is of probable late-Pliocene to early Pleistocene age. The name Sabancaya (meaning "tongue of fire" in the Quechua language) first appeared in records in 1595 CE, suggesting activity prior to that date. Holocene activity has consisted of Plinian eruptions followed by emission of voluminous andesitic and dacitic lava flows, which form an extensive apron around the volcano on all sides but the south. Records of historical eruptions date back to 1750.
Information Contacts: Instituto Geofisico del Peru (IGP), Centro Vulcanológico Nacional (CENVUL), Calle Badajoz N° 169 Urb. Mayorazgo IV Etapa, Ate, Lima 15012, Perú (URL: https://www.igp.gob.pe/servicios/centro-vulcanologico-nacional/inicio); Buenos Aires Volcanic Ash Advisory Center (VAAC), Servicio Meteorológico Nacional-Fuerza Aérea Argentina, 25 de mayo 658, Buenos Aires, Argentina (URL: http://www.smn.gov.ar/vaac/buenosaires/inicio.php); MIROVA (Middle InfraRed Observation of Volcanic Activity), a collaborative project between the Universities of Turin and Florence (Italy) supported by the Centre for Volcanic Risk of the Italian Civil Protection Department (URL: http://www.mirovaweb.it/); Hawai'i Institute of Geophysics and Planetology (HIGP) - MODVOLC Thermal Alerts System, School of Ocean and Earth Science and Technology (SOEST), Univ. of Hawai'i, 2525 Correa Road, Honolulu, HI 96822, USA (URL: http://modis.higp.hawaii.edu/); NASA Global Sulfur Dioxide Monitoring Page, Atmospheric Chemistry and Dynamics Laboratory, NASA Goddard Space Flight Center (NASA/GSFC), 8800 Greenbelt Road, Goddard MD 20771, USA (URL: https://so2.gsfc.nasa.gov/); Copernicus Browser, Copernicus Data Space Ecosystem, European Space Agency (URL: https://dataspace.copernicus.eu/browser/).
Sheveluch
Russia
56.653°N, 161.36°E; summit elev. 3283 m
All times are local (unless otherwise noted)
Significant explosions destroyed part of the lava-dome complex during April 2023
Sheveluch (also spelled Shiveluch) in Kamchatka, has had at least 60 large eruptions during the last 10,000 years. The summit is truncated by a broad 9-km-wide caldera that is breached to the S, and many lava domes occur on the outer flanks. The lava dome complex was constructed within the large open caldera. Frequent collapses of the dome complex have produced debris avalanches; the resulting deposits cover much of the caldera floor. A major south-flank collapse during a 1964 Plinian explosion produced a scarp in which a “Young Sheveluch” dome began to form in 1980. Repeated episodes of dome formation and destruction since then have produced major and minor ash plumes, pyroclastic flows, block-and-ash flows, and “whaleback domes” of spine-like extrusions in 1993 and 2020 (BGVN 45:11). The current eruption period began in August 1999 and has more recently consisted of lava dome growth, explosions, ash plumes, and avalanches (BGVN 48:01). This report covers a significant explosive eruption during early-to-mid-April 2023 that generated a 20 km altitude ash plume, produced a strong sulfur dioxide plume, and destroyed part of the lava-dome complex; activity described during January through April 2023 use information primarily from the Kamchatka Volcanic Eruptions Response Team (KVERT) and various satellite data.
Satellite data. Activity during the majority of this reporting period was characterized by continued lava dome growth, strong fumarole activity, explosions, and hot avalanches. According to the MODVOLC Thermal Alerts System, 140 hotspots were detected through the reporting period, with 33 recorded in January 2023, 29 in February, 44 in March, and 34 in April. Frequent strong thermal activity was recorded during January 2023 through April, according to the MIROVA (Middle InfraRed Observation of Volcanic Activity) graph and resulted from the continuously growing lava dome (figure 94). A slightly stronger pulse in thermal activity was detected in early-to-mid-April, which represented the significant eruption that destroyed part of the lava-dome complex. Thermal anomalies were also visible in infrared satellite imagery at the summit crater (figure 95).
During January 2023 KVERT reported continued growth of the lava dome, accompanied by strong fumarolic activity, incandescence from the lava dome, explosions, ash plumes, and avalanches. Satellite data showed a daily thermal anomaly over the volcano. Video data showed ash plumes associated with collapses at the dome that generated avalanches that in turn produced ash plumes rising to 3.5 km altitude and drifting 40 km W on 4 January and rising to 7-7.5 km altitude and drifting 15 km SW on 5 January. A gas-and-steam plume containing some ash that was associated with avalanches rose to 5-6 km altitude and extended 52-92 km W on 7 January. Explosions that same day produced ash plumes that rose to 7-7.5 km altitude and drifted 10 km W. According to a Volcano Observatory Notice for Aviation (VONA) issued at 1344 on 19 January, explosions produced an ash cloud that was 15 x 25 km in size and rose to 9.6-10 km altitude, drifting 21-25 km W; as a result, the Aviation Color Code (ACC) was raised to Red (the highest level on a four-color scale). Another VONA issued at 1635 reported that no more ash plumes were observed, and the ACC was lowered to Orange (the second highest level on a four-color scale). On 22 January an ash plume from collapses and avalanches rose to 5 km altitude and drifted 25 km NE and SW; ash plumes associated with collapses extended 70 km NE on 27 and 31 January.
Lava dome growth, fumarolic activity, dome incandescence, and occasional explosions and avalanches continued during February and March. A daily thermal anomaly was visible in satellite data. Explosions on 1 February generated ash plumes that rose to 6.3-6.5 km altitude and extended 15 km NE. Video data showed an ash cloud from avalanches rising to 5.5 km altitude and drifting 5 km SE on 2 February. Satellite data showed gas-and-steam plumes containing some ash rose to 5-5.5 km altitude and drifted 68-110 km ENE and NE on 6 February, to 4.5-5 km altitude and drifted 35 km WNW on 22 February, and to 3.7-4 km altitude and drifted 47 km NE on 28 February. Scientists from the Kamchatka Volcanological Station (KVS) went on a field excursion on 25 February to document the growing lava dome, and although it was cloudy most of the day, nighttime incandescence was visible. Satellite data showed an ash plume extending up to 118 km E during 4-5 March. Video data from 1150 showed an ash cloud from avalanches rose to 3.7-5.5 km altitude and drifted 5-10 km ENE and E on 5 March. On 11 March an ash plume drifted 62 km E. On 27 March ash plumes rose to 3.5 km altitude and drifted 100 km E. Avalanches and constant incandescence at the lava dome was focused on the E and NE slopes on 28 March. A gas-and-steam plume containing some ash rose to 3.5 km altitude and moved 40 km E on 29 March. Ash plumes on 30 March rose to 3.5-3.7 km altitude and drifted 70 km NE.
Similar activity continued during April, with lava dome growth, strong fumarolic activity, incandescence in the dome, occasional explosions, and avalanches. A thermal anomaly persisted throughout the month. During 1-4 April weak ash plumes rose to 2.5-3 km altitude and extended 13-65 km SE and E.
Activity during 11 April 2023. The Institute of Volcanology and Seismology, Far Eastern Branch, Russian Academy of Sciences (IVS FEB RAS) reported a significant increase in seismicity around 0054 on 11 April, as reported by strong explosions detected on 11 April beginning at 0110 that sent ash plumes up to 7-10 km altitude and extended 100-435 km W, WNW, NNW, WSW, and SW. According to a Tokyo VAAC report the ash plume rose to 15.8 km altitude. By 0158 the plume extended over a 75 x 100 km area. According to an IVS FEB RAS report, the eruptive column was not vertical: the initial plume at 0120 on 11 April deviated to the NNE, at 0000 on 12 April, it drifted NW, and by 1900 it drifted SW. KVS reported that significant pulses of activity occurred at around 0200, 0320, and then a stronger phase around 0600. Levin Dmitry took a video from near Békés (3 km away) at around 0600 showing a rising plume; he also reported that a pyroclastic flow traveled across the road behind him as he left the area. According to IVS FEB RAS, the pyroclastic flow traveled several kilometers SSE, stopping a few hundred meters from a bridge on the road between Klyuchi and Petropavlovsk-Kamchatsky.
Ashfall was first observed in Klyuchi (45 km SW) at 0630, and a large, black ash plume blocked light by 0700. At 0729 KVERT issued a Volcano Observatory Notice for Aviation (VONA) raising the Aviation Color Code to Red (the highest level on a four-color scale). It also stated that a large ash plume had risen to 10 km altitude and drifted 100 km W. Near-constant lightning strikes were reported in the plume and sounds like thunderclaps were heard until about 1000. According to IVS FEB RAS the cloud was 200 km long and 76 km wide by 0830, and was spreading W at altitudes of 6-12 km. In the Klyuchi Village, the layer of both ash and snow reached 8.5 cm (figure 96); ashfall was also reported in Kozyrevsk (112 km SW) at 0930, Mayskoye, Anavgay, Atlasovo, Lazo, and Esso. Residents in Klyuchi reported continued darkness and ashfall at 1100. In some areas, ashfall was 6 cm deep and some residents reported dirty water coming from their plumbing. According to IVS FEB RAS, an ash cloud at 1150 rose to 5-20 km altitude and was 400 km long and 250 km wide, extending W. A VONA issued at 1155 reported that ash had risen to 10 km and drifted 340 km NNW and 240 km WSW. According to Simon Carn (Michigan Technological University), about 0.2 Tg of sulfur dioxide in the plume was measured in a satellite image from the TROPOMI instrument on the Sentinel-5P satellite acquired at 1343 that covered an area of about 189,000 km2 (figure 97). Satellite data at 1748 showed an ash plume that rose to 8 km altitude and drifted 430 km WSW and S, according to a VONA.
Activity during 12-15 April 2023. On 12 April at 0730 satellite images showed ash plumes rose to 7-8 km altitude and extended 600 km SW, 1,050 km ESE, and 1,300-3,000 km E. By 1710 that day, the explosions weakened. According to news sources, the ash-and-gas plumes drifted E toward the Aleutian Islands and reached the Gulf of Alaska by 13 April, causing flight disruptions. More than 100 flights involving Alaska airspace were cancelled due to the plume. Satellite data showed ash plumes rising to 4-5.5 km altitude and drifted 400-415 km SE and ESE on 13 April. KVS volcanologists observed the pyroclastic flow deposits and noted that steam rose from downed, smoldering trees. They also noted that the deposits were thin with very few large fragments, which differed from previous flows. The ash clouds traveled across the Pacific Ocean. Flight cancellations were also reported in NW Canada (British Columbia) during 13-14 April. During 14-15 April ash plumes rose to 6 km altitude and drifted 700 km NW.
Alaskan flight schedules were mostly back to normal by 15 April, with only minor delays and far less cancellations; a few cancellations continued to be reported in Canada. Clear weather on 15 April showed that most of the previous lava-dome complex was gone and a new crater roughly 1 km in diameter was observed (figure 98); gas-and-steam emissions were rising from this crater. Evidence suggested that there had been a directed blast to the SE, and pyroclastic flows traveled more than 20 km. An ash plume rose to 4.5-5.2 km altitude and drifted 93-870 km NW on 15 April.
Activity during 16-30 April 2023. Resuspended ash was lifted by the wind from the slopes and rose to 4 km altitude and drifted 224 km NW on 17 April. KVERT reported a plume of resuspended ash from the activity during 10-13 April on 19 April that rose to 3.5-4 km altitude and drifted 146-204 km WNW. During 21-22 April a plume stretched over the Scandinavian Peninsula. A gas-and-steam plume containing some ash rose to 3-3.5 km altitude and drifted 60 km SE on 30 April. A possible new lava dome was visible on the W slope of the volcano on 29-30 April (figure 99); satellite data showed two thermal anomalies, a bright one over the existing lava dome and a weaker one over the possible new one.
References. Girina, O., Loupian, E., Horvath, A., Melnikov, D., Manevich, A., Nuzhdaev, A., Bril, A., Ozerov, A., Kramareva, L., Sorokin, A., 2023, Analysis of the development of the paroxysmal eruption of Sheveluch volcano on April 10–13, 2023, based on data from various satellite systems, ??????????? ???????? ??? ?? ???????, 20(2).
Geologic Background. The high, isolated massif of Sheveluch volcano (also spelled Shiveluch) rises above the lowlands NNE of the Kliuchevskaya volcano group. The 1,300 km3 andesitic volcano is one of Kamchatka's largest and most active volcanic structures, with at least 60 large eruptions during the Holocene. The summit of roughly 65,000-year-old Stary Shiveluch is truncated by a broad 9-km-wide late-Pleistocene caldera breached to the south. Many lava domes occur on its outer flanks. The Molodoy Shiveluch lava dome complex was constructed during the Holocene within the large open caldera; Holocene lava dome extrusion also took place on the flanks of Stary Shiveluch. Widespread tephra layers from these eruptions have provided valuable time markers for dating volcanic events in Kamchatka. Frequent collapses of dome complexes, most recently in 1964, have produced debris avalanches whose deposits cover much of the floor of the breached caldera.
Information Contacts: Kamchatka Volcanic Eruptions Response Team (KVERT), Far Eastern Branch, Russian Academy of Sciences, 9 Piip Blvd., Petropavlovsk-Kamchatsky, 683006, Russia (URL: http://www.kscnet.ru/ivs/kvert/); Institute of Volcanology and Seismology, Far Eastern Branch, Russian Academy of Sciences (IVS FEB RAS), 9 Piip Blvd., Petropavlovsk-Kamchatsky 683006, Russia (URL: http://www.kscnet.ru/ivs/eng/); Kamchatka Volcanological Station, Kamchatka Branch of Geophysical Survey, (KB GS RAS), Klyuchi, Kamchatka Krai, Russia (URL: http://volkstat.ru/); Hawai'i Institute of Geophysics and Planetology (HIGP) - MODVOLC Thermal Alerts System, School of Ocean and Earth Science and Technology (SOEST), Univ. of Hawai'i, 2525 Correa Road, Honolulu, HI 96822, USA (URL: http://modis.higp.hawaii.edu/); MIROVA (Middle InfraRed Observation of Volcanic Activity), a collaborative project between the Universities of Turin and Florence (Italy) supported by the Centre for Volcanic Risk of the Italian Civil Protection Department (URL: http://www.mirovaweb.it/); Copernicus Browser, Copernicus Data Space Ecosystem, European Space Agency (URL: https://dataspace.copernicus.eu/browser/); Kam 24 News Agency, 683032, Kamchatka Territory, Petropavlovsk-Kamchatsky, Vysotnaya St., 2A (URL: https://kam24.ru/news/main/20230411/96657.html#.Cj5Jrky6.dpuf); Simon Carn, Geological and Mining Engineering and Sciences, Michigan Technological University, 1400 Townsend Drive, Houghton, MI 49931, USA (URL: http://www.volcarno.com/, Twitter: @simoncarn).
Bezymianny
Russia
55.972°N, 160.595°E; summit elev. 2882 m
All times are local (unless otherwise noted)
Explosions, ash plumes, lava flows, and avalanches during November 2022-April 2023
Bezymianny is located on the Kamchatka Peninsula of Russia as part of the Klyuchevskoy volcano group. Historic eruptions began in 1955 and have been characterized by dome growth, explosions, pyroclastic flows, ash plumes, and ashfall. During the 1955-56 eruption a large open crater was formed by collapse of the summit and an associated lateral blast. Subsequent episodic but ongoing lava-dome growth, accompanied by intermittent explosive activity and pyroclastic flows, has largely filled the 1956 crater. The current eruption period began in December 2016 and more recent activity has consisted of strong explosions, ash plumes, and thermal activity (BGVN 47:11). This report covers activity during November 2022 through April 2023, based on weekly and daily reports from the Kamchatka Volcano Eruptions Response Team (KVERT) and satellite data.
Activity during November and March 2023 was relatively low and mostly consisted of gas-and-steam emissions, occasional small collapses that generated avalanches along the lava dome slopes, and a persistent thermal anomaly over the volcano that was observed in satellite data on clear weather days. According to the Tokyo VAAC and KVERT, an explosion produced an ash plume that rose to 6 km altitude and drifted 25 km NE at 1825 on 29 March.
Gas-and-steam emissions, collapses generating avalanches, and thermal activity continued during April. According to two Volcano Observatory Notice for Aviation (VONA) issued on 2 and 6 April (local time) ash plumes rose to 3 km and 3.5-3.8 km altitude and drifted 35 km E and 140 km E, respectively. Satellite data from KVERT showed weak ash plumes extending up to 550 km E on 2 and 5-6 April.
A VONA issued at 0843 on 7 April described an ash plume that rose to 4.5-5 km altitude and drifted 250 km ESE. Later that day at 1326 satellite data showed an ash plume that rose to 5.5-6 km altitude and drifted 150 km ESE. A satellite image from 1600 showed an ash plume extending as far as 230 km ESE; KVERT noted that ash emissions were intensifying, likely due to avalanches from the growing lava dome. The Aviation Color Code (ACC) was raised to Red (the highest level on a four-color scale). At 1520 satellite data showed an ash plume rising to 5-5.5 km altitude and drifting 230 km ESE. That same day, Kamchatka Volcanological Station (KVS) volcanologists traveled to Ambon to collect ash; they reported that a notable eruption began at 1730, and within 20 minutes a large ash plume rose to 10 km altitude and drifted NW. KVERT reported that the strong explosive phase began at 1738. Video and satellite data taken at 1738 showed an ash plume that rose to 10-12 km altitude and drifted up to 2,800 km SE and E. Explosions were clearly audible 20 km away for 90 minutes, according to KVS. Significant amounts of ash fell at the Apakhonchich station, which turned the snow gray; ash continued to fall until the morning of 8 April. In a VONA issued at 0906 on 8 April, KVERT stated that the explosive eruption had ended; ash plumes had drifted 2,000 km E. The ACC was lowered to Orange (the third highest level on a four-color scale). The KVS team saw a lava flow on the active dome once the conditions were clear that same day (figure 53). On 20 April lava dome extrusion was reported; lava flows were noted on the flanks of the dome, and according to KVERT satellite data, a thermal anomaly was observed in the area. The ACC was lowered to Yellow (the second lowest on a four-color scale).
Satellite data showed an increase in thermal activity beginning in early April 2023. A total of 31 thermal hotspots were detected by the MODVOLC thermal algorithm on 4, 5, 7, and 12 April 2023. The elevated thermal activity resulted from an increase in explosive activity and the start of an active lava flow. The MIROVA (Middle InfraRed Observation of Volcanic Activity) volcano hotspot detection system based on the analysis of MODIS data also showed a pulse in thermal activity during the same time (figure 54). Infrared satellite imagery captured a continuous thermal anomaly at the summit crater, often accompanied by white gas-and-steam emissions (figure 55). On 4 April 2023 an active lava flow was observed descending the SE flank.
Geologic Background. The modern Bezymianny, much smaller than its massive neighbors Kamen and Kliuchevskoi on the Kamchatka Peninsula, was formed about 4,700 years ago over a late-Pleistocene lava-dome complex and an edifice built about 11,000-7,000 years ago. Three periods of intensified activity have occurred during the past 3,000 years. The latest period, which was preceded by a 1,000-year quiescence, began with the dramatic 1955-56 eruption. This eruption, similar to that of St. Helens in 1980, produced a large open crater that was formed by collapse of the summit and an associated lateral blast. Subsequent episodic but ongoing lava-dome growth, accompanied by intermittent explosive activity and pyroclastic flows, has largely filled the 1956 crater.
Information Contacts: Kamchatka Volcanic Eruptions Response Team (KVERT), Far Eastern Branch, Russian Academy of Sciences, 9 Piip Blvd., Petropavlovsk-Kamchatsky, 683006, Russia (URL: http://www.kscnet.ru/ivs/kvert/); Kamchatka Volcanological Station, Kamchatka Branch of Geophysical Survey, (KB GS RAS), Klyuchi, Kamchatka Krai, Russia (URL: http://volkstat.ru/); Hawai'i Institute of Geophysics and Planetology (HIGP) - MODVOLC Thermal Alerts System, School of Ocean and Earth Science and Technology (SOEST), Univ. of Hawai'i, 2525 Correa Road, Honolulu, HI 96822, USA (URL: http://modis.higp.hawaii.edu/); MIROVA (Middle InfraRed Observation of Volcanic Activity), a collaborative project between the Universities of Turin and Florence (Italy) supported by the Centre for Volcanic Risk of the Italian Civil Protection Department (URL: http://www.mirovaweb.it/); Copernicus Browser, Copernicus Data Space Ecosystem, European Space Agency (URL: https://dataspace.copernicus.eu/browser/).
Chikurachki
Russia
50.324°N, 155.461°E; summit elev. 1781 m
All times are local (unless otherwise noted)
New explosive eruption during late January-early February 2023
Chikurachki, located on Paramushir Island in the northern Kuriles, has had Plinian eruptions during the Holocene. Lava flows have reached the sea and formed capes on the NW coast; several young lava flows are also present on the E flank beneath a scoria deposit. Reported eruptions date back to 1690, with the most recent eruption period occurring during January through October 2022, characterized by occasional explosions, ash plumes, and thermal activity (BGVN 47:11). This report covers a new eruptive period during January through February 2023 that consisted of ash explosions and ash plumes, based on information from the Kamchatka Volcanic Eruptions Response Team (KVERT) and satellite data.
According to reports from KVERT, an explosive eruption began around 0630 on 29 January. Explosions generated ash plumes that rose to 3-3.5 km altitude and drifted 6-75 km SE and E, based on satellite data. As a result, the Aviation Color Code (ACC) was raised to Orange (the second highest level on a four-color scale). At 1406 and 1720 ash plumes were identified in satellite images that rose to 4.3 km altitude and extended 70 km E. By 2320 the ash plume had dissipated. A thermal anomaly was visible at the volcano on 31 January, according to a satellite image, and an ash plume was observed drifting 66 km NE.
Occasional explosions and ash plumes continued during early February. At 0850 on 1 February an ash plume rose to 3.5 km altitude and drifted 35 km NE. Satellite data showed an ash plume that rose to 3.2-3.5 km altitude and drifted 50 km NE at 1222 later that day (figure 22). A thermal anomaly was detected over the volcano during 5-6 February and ash plumes drifted as far as 125 km SE, E, and NE. Explosive events were reported at 0330 on 6 February that produced ash plumes rising to 4-4.5 km altitude and drifting 72-90 km N, NE, and ENE. KVERT noted that the last gas-and steam plume that contained some ash was observed on 8 February and drifted 55 km NE before the explosive eruption ended. The ACC was lowered to Yellow and then Green (the lowest level on a four-color scale) on 18 February.
Geologic Background. Chikurachki, the highest volcano on Paramushir Island in the northern Kuriles, is a relatively small cone constructed on a high Pleistocene edifice. Oxidized basaltic-to-andesitic scoria deposits covering the upper part of the young cone give it a distinctive red color. Frequent basaltic Plinian eruptions have occurred during the Holocene. Lava flows have reached the sea and formed capes on the NW coast; several young lava flows are also present on the E flank beneath a scoria deposit. The Tatarinov group of six volcanic centers is located immediately to the south, and the Lomonosov cinder cone group, the source of an early Holocene lava flow that reached the saddle between it and Fuss Peak to the west, lies at the southern end of the N-S-trending Chikurachki-Tatarinov complex. In contrast to the frequently active Chikurachki, the Tatarinov centers are extensively modified by erosion and have a more complex structure. Tephrochronology gives evidence of an eruption around 1690 CE from Tatarinov, although its southern cone contains a sulfur-encrusted crater with fumaroles that were active along the margin of a crater lake until 1959.
Information Contacts: Kamchatka Volcanic Eruptions Response Team (KVERT), Far East Division, Russian Academy of Sciences, 9 Piip Blvd., Petropavlovsk-Kamchatsky, 683006, Russia (URL: http://www.kscnet.ru/ivs/); Copernicus Browser, Copernicus Data Space Ecosystem, European Space Agency (URL: https://dataspace.copernicus.eu/browser/).
Marapi
Indonesia
0.38°S, 100.474°E; summit elev. 2885 m
All times are local (unless otherwise noted)
New explosive eruption with ash emissions during January-March 2023
Marapi in Sumatra, Indonesia, is a massive stratovolcano that rises 2 km above the Bukittinggi Plain in the Padang Highlands. A broad summit contains multiple partially overlapping summit craters constructed within the small 1.4-km-wide Bancah caldera and trending ENE-WSW, with volcanism migrating to the west. Since the end of the 18th century, more than 50 eruptions, typically characterized by small-to-moderate explosive activity, have been recorded. The previous eruption consisted of two explosions during April-May 2018, which caused ashfall to the SE (BGVN 43:06). This report covers a new eruption during January-March 2023, which included explosive events and ash emissions, as reported by Pusat Vulkanologi dan Mitigasi Bencana Geologi (PVMBG, also known as Indonesian Center for Volcanology and Geological Hazard Mitigation, CVGHM) and MAGMA Indonesia.
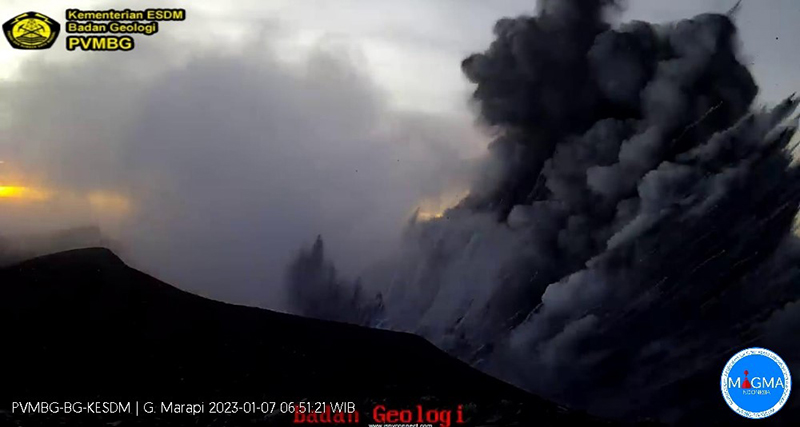
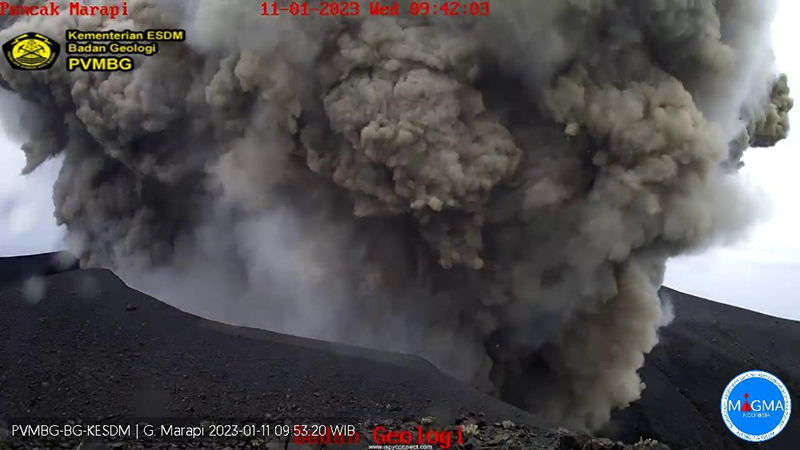
According to a press release issued by PVMBG and MAGMA Indonesia on 26 December, primary volcanic activity at Marapi consisted of white gas-and-steam puffs that rose 500-100 m above the summit during April-December 2022. On 25 December 2022 there was an increase in the number of deep volcanic earthquakes and summit inflation. White gas-and-steam emissions rose 80-158 m above the summit on 5 January. An explosive eruption began at 0611 on 7 January 2023, which generated white gas-and-steam emissions and gray ash emissions mixed with ejecta that rose 300 m above the summit and drifted SE (figure 10). According to ground observations, white-to-gray ash clouds during 0944-1034 rose 200-250 m above the summit and drifted SE and around 1451 emissions rose 200 m above the summit. Seismic signals indicated that eruptive events also occurred at 1135, 1144, 1230, 1715, and 1821, but no ash emissions were visually observed. On 8 January white-and-gray emissions rose 150-250 m above the summit that drifted E and SE. Seismic signals indicated eruptive events at 0447, 1038, and 1145, but again no ash emissions were visually observed on 8 January. White-to-gray ash plumes continued to be observed on clear weather days during 9-15, 18-21, 25, and 29-30 January, rising 100-1,000 m above the summit and drifted generally NE, SE, N, and E, based on ground observations (figure 11).
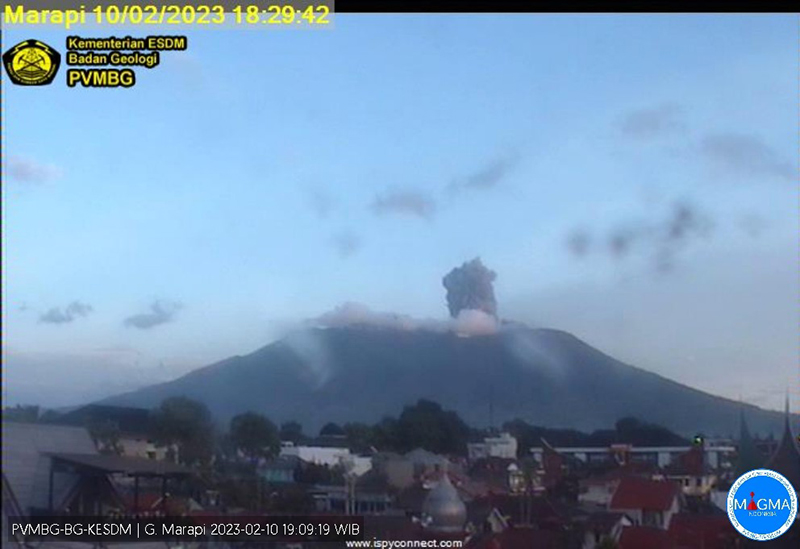
White-and-gray and brown emissions persisted in February, rising 50-500 m above the summit and drifting E, S, SW, N, NE, and W, though weather sometimes prevented clear views of the summit. An eruption at 1827 on 10 February produced a black ash plume that rose 400 m above the summit and drifted NE and E (figure 12). Similar activity was reported on clear weather days, with white gas-and-steam emissions rising 50 m above the summit on 9, 11-12, 20, and 27 March and drifted E, SE, SW, NE, E, and N. On 17 March white-and-gray emissions rose 400 m above the summit and drifted N and E.
Geologic Background. Gunung Marapi, not to be confused with the better-known Merapi volcano on Java, is Sumatra's most active volcano. This massive complex stratovolcano rises 2,000 m above the Bukittinggi Plain in the Padang Highlands. A broad summit contains multiple partially overlapping summit craters constructed within the small 1.4-km-wide Bancah caldera. The summit craters are located along an ENE-WSW line, with volcanism migrating to the west. More than 50 eruptions, typically consisting of small-to-moderate explosive activity, have been recorded since the end of the 18th century; no lava flows outside the summit craters have been reported in historical time.
Information Contacts: Pusat Vulkanologi dan Mitigasi Bencana Geologi (PVMBG, also known as Indonesian Center for Volcanology and Geological Hazard Mitigation, CVGHM), Jalan Diponegoro 57, Bandung 40122, Indonesia (URL: http://www.vsi.esdm.go.id/); MAGMA Indonesia, Kementerian Energi dan Sumber Daya Mineral (URL: https://magma.esdm.go.id/v1).
Kikai
Japan
30.793°N, 130.305°E; summit elev. 704 m
All times are local (unless otherwise noted)
Intermittent white gas-and-steam plumes, discolored water, and seismicity during May 2021-April 2023
Kikai, located just S of the Ryukyu islands of Japan, contains a 19-km-wide mostly submarine caldera. The island of Satsuma Iwo Jima (also known as Satsuma-Iwo Jima and Tokara Iojima) is located at the NW caldera rim, as well as the island’s highest peak, Iodake. Its previous eruption period occurred on 6 October 2020 and was characterized by an explosion and thermal anomalies in the crater (BGVN 45:11). More recent activity has consisted of intermittent thermal activity and gas-and-steam plumes (BGVN 46:06). This report covers similar low-level activity including white gas-and-steam plumes, nighttime incandescence, seismicity, and discolored water during May 2021 through April 2023, using information from the Japan Meteorological Agency (JMA) and various satellite data. During this time, the Alert Level remained at a 2 (on a 5-level scale), according to JMA.
Activity was relatively low throughout the reporting period and has consisted of intermittent white gas-and-steam emissions that rose 200-1,400 m above the Iodake crater and nighttime incandescence was observed at the Iodake crater using a high-sensitivity surveillance camera. Each month, frequent volcanic earthquakes were detected, and sulfur dioxide masses were measured by the University of Tokyo Graduate School of Science, Kyoto University Disaster Prevention Research Institute, Mishima Village, and JMA (table 6).
Table 6. Summary of gas-and-steam plume heights, number of volcanic earthquakes detected, and amount of sulfur dioxide emissions in tons per day (t/d). Courtesy of JMA monthly reports.
| Month |
Max plume height (m) |
Volcanic earthquakes |
Sulfur dioxide emissions (t/d) |
| May 2021 |
400 |
162 |
900-1,300 |
| Jun 2021 |
800 |
117 |
500 |
| Jul 2021 |
1,400 |
324 |
800-1,500 |
| Aug 2021 |
1,000 |
235 |
700-1,000 |
| Sep 2021 |
800 |
194 |
500-1,100 |
| Oct 2021 |
800 |
223 |
600-800 |
| Nov 2021 |
900 |
200 |
400-900 |
| Dec 2021 |
1,000 |
161 |
500-1,800 |
| Jan 2022 |
1,000 |
164 |
600-1,100 |
| Feb 2022 |
1,000 |
146 |
500-1,600 |
| Mar 2022 |
1,200 |
171 |
500-1,200 |
| Apr 2022 |
1,000 |
144 |
600-1,000 |
| May 2022 |
1,200 |
126 |
300-500 |
| Jun 2022 |
1,000 |
154 |
400 |
| Jul 2022 |
1,300 |
153 |
600-1,100 |
| Aug 2022 |
1,100 |
109 |
600-1,500 |
| Sep 2022 |
1,000 |
170 |
900 |
| Oct 2022 |
800 |
249 |
700-1,200 |
| Nov 2022 |
800 |
198 |
800-1,200 |
| Dec 2022 |
700 |
116 |
600-1,500 |
| Jan 2023 |
800 |
146 |
500-1,400 |
| Feb 2023 |
800 |
135 |
600-800 |
| Mar 2023 |
1,100 |
94 |
500-600 |
| Apr 2023 |
800 |
82 |
500-700 |
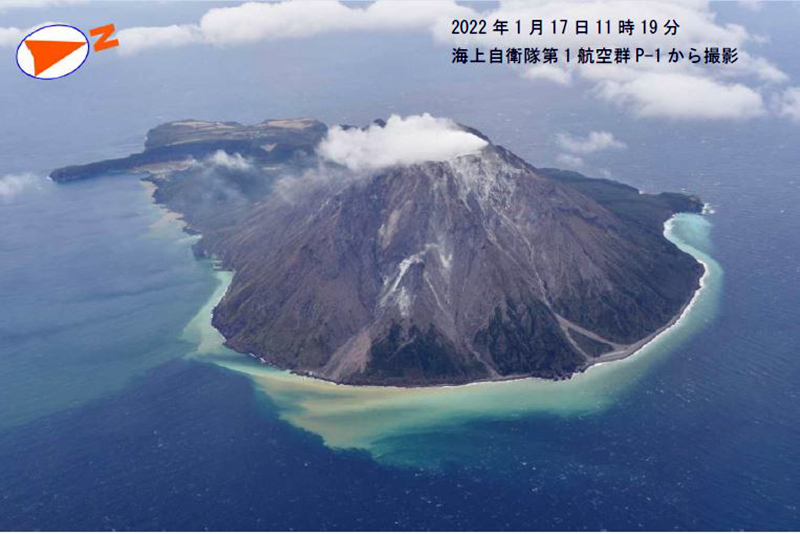
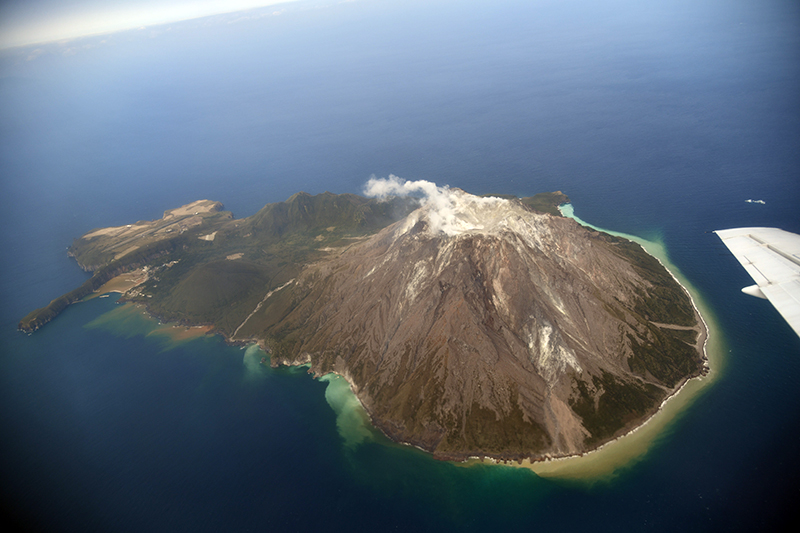
Sentinel-2 satellite images show weak thermal anomalies at the Iodake crater on clear weather days, accompanied by white gas-and-steam emissions and occasional discolored water (figure 24). On 17 January 2022 JMA conducted an aerial overflight in cooperation with the Japan Maritime Self-Defense Force’s 1st Air Group, which confirmed a white gas-and-steam plume rising from the Iodake crater (figure 25). They also observed plumes from fumaroles rising from around the crater and on the E, SW, and N slopes. In addition, discolored water was reported near the coast around Iodake, which JMA stated was likely related to volcanic activity (figure 25). Similarly, an overflight taken on 11 January 2023 showed white gas-and-steam emissions rising from the Iodake crater, as well as discolored water that spread E from the coast around the island. On 14 February 2023 white fumaroles and discolored water were also captured during an overflight (figure 26).
Geologic Background. Multiple eruption centers have exhibited recent activity at Kikai, a mostly submerged, 19-km-wide caldera near the northern end of the Ryukyu Islands south of Kyushu. It was the source of one of the world's largest Holocene eruptions about 6,300 years ago when rhyolitic pyroclastic flows traveled across the sea for a total distance of 100 km to southern Kyushu, and ashfall reached the northern Japanese island of Hokkaido. The eruption devastated southern and central Kyushu, which remained uninhabited for several centuries. Post-caldera eruptions formed Iodake (or Iwo-dake) lava dome and Inamuradake scoria cone, as well as submarine lava domes. Recorded eruptions have occurred at or near Satsuma-Iojima (also known as Tokara-Iojima), a small 3 x 6 km island forming part of the NW caldera rim. Showa-Iojima lava dome (also known as Iojima-Shinto), a small island 2 km E of Satsuma-Iojima, was formed during submarine eruptions in 1934 and 1935. Mild-to-moderate explosive eruptions have occurred during the past few decades from Iodake, a rhyolitic lava dome at the eastern end of Satsuma-Iojima.
Information Contacts: Japan Meteorological Agency (JMA), Otemachi, 1-3-4, Chiyoda-ku Tokyo 100-8122, Japan (URL: http://www.jma.go.jp/jma/indexe.html); Japan Coast Guard (JCG) Volcano Database, Hydrographic and Oceanographic Department, 3-1-1, Kasumigaseki, Chiyoda-ku, Tokyo 100-8932, Japan (URL: https://www1.kaiho.mlit.go.jp/kaiikiDB/kaiyo30-2.htm); Copernicus Browser, Copernicus Data Space Ecosystem, European Space Agency (URL: https://dataspace.copernicus.eu/browser/).
Lewotolok (Indonesia) — May 2023  Cite this Report
Lewotolok
Indonesia
8.274°S, 123.508°E; summit elev. 1431 m
All times are local (unless otherwise noted)
Strombolian eruption continues through April 2023 with intermittent ash plumes
The current eruption at Lewotolok, in Indonesian’s Lesser Sunda Islands, began in late November 2020 and has included Strombolian explosions, occasional ash plumes, incandescent ejecta, intermittent thermal anomalies, and persistent white and white-and-gray emissions (BGVN 47:10). Similar activity continued during October 2022-April 2023, as described in this report based on information provided by Pusat Vulkanologi dan Mitigasi Bencana Geologi (PVMBG, also known as CVGHM, or the Center of Volcanology and Geological Hazard Mitigation), MAGMA Indonesia, the Darwin Volcanic Ash Advisory Centre (VAAC), and satellite data.
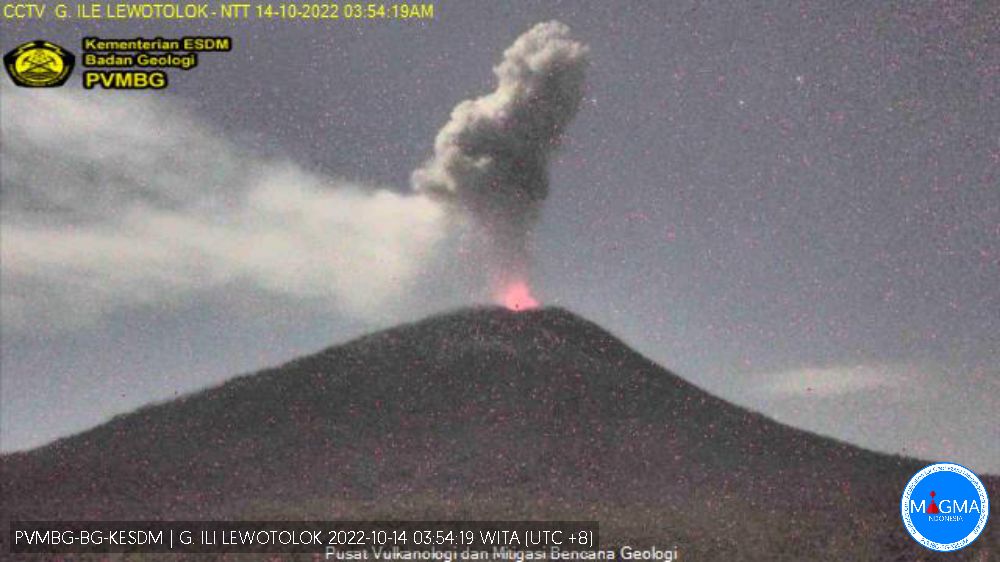
During most days in October 2022 white and white-gray emissions rose as high as 200-600 m above the summit. Webcam images often showed incandescence above the crater rim. At 0351 on 14 October, an explosion produced a dense ash plume that rose about 1.2 km above the summit and drifted SW (figure 43). After this event, activity subsided and remained low through the rest of the year, but with almost daily white emissions.
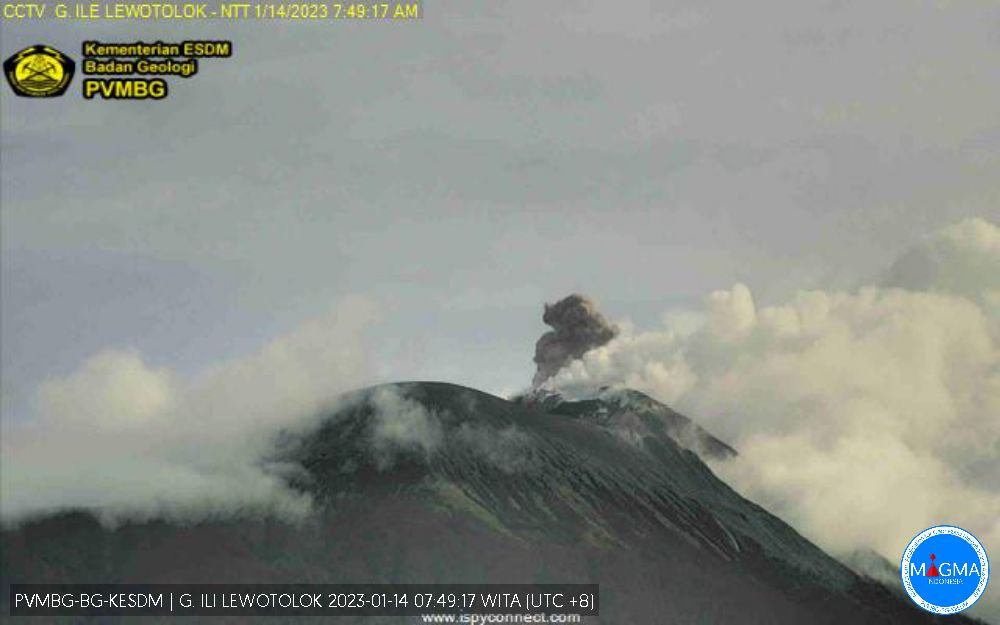
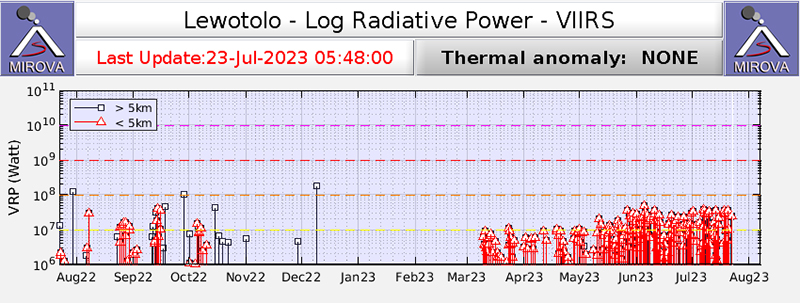
After more than two months of relative quiet, PVMBG reported that explosions at 0747 on 14 January 2023 and at 2055 on 16 January produced white-and-gray ash plumes that rose around 400 m above the summit and drifted E and SE (figure 44). During the latter half of January through April, almost daily white or white-and-gray emissions were observed rising 25-800 m above the summit, and nighttime webcam images often showed incandescent material being ejected above the summit crater. Strombolian activity was visible in webcam images at 2140 on 11 February, 0210 on 18 February, and during 22-28 March. Frequent hotspots were recorded by the MIROVA detection system starting in approximately the second week of March 2023 that progressively increased into April (figure 45).
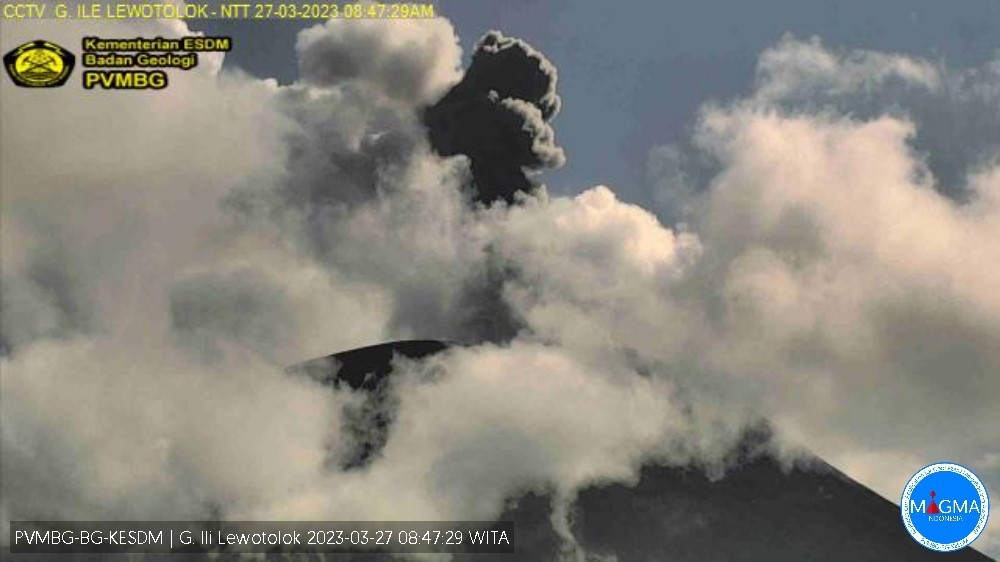
Explosions that produced dense ash plumes as high as 750 m above the summit were described in Volcano Observatory Notices for Aviation (VONA) at 0517, 1623, and 2016 on 22 March, at 1744 on 24 March, at 0103 on 26 March, at 0845 and 1604 on 27 March (figure 46), and at 0538 on 28 March. According to the Darwin VAAC, on 6 April another ash plume rose to 1.8 km altitude (about 370 m above the summit) and drifted N.
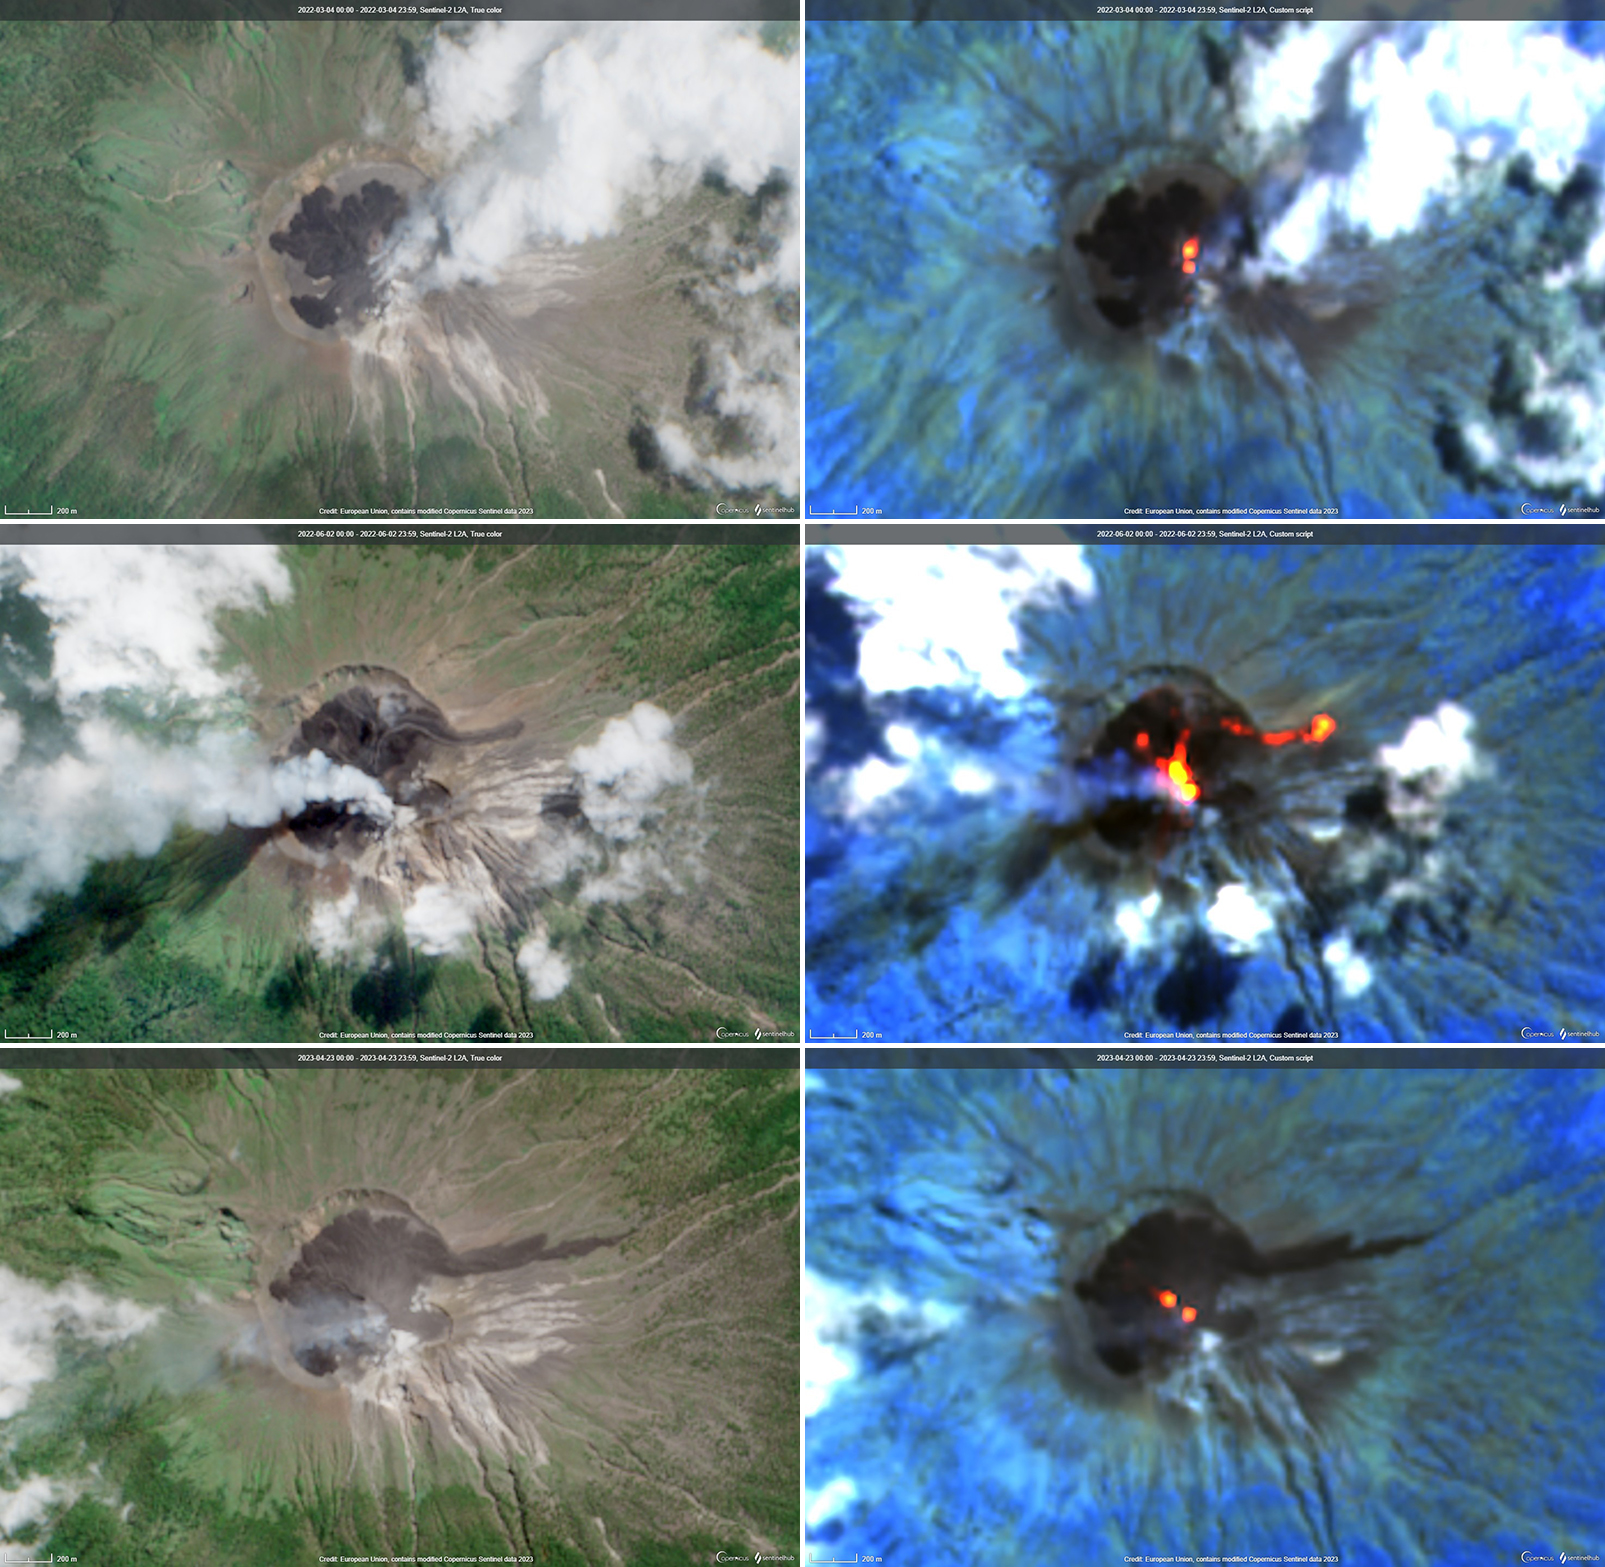
Sentinel-2 images over the previous year recorded thermal anomalies as well as the development of a lava flow that descended the NE flank beginning in June 2022 (figure 47). The volcano was often obscured by weather clouds, which also often hampered ground observations. Ash emissions were reported in March 2022 (BGVN 47:10), and clear imagery from 4 March 2022 showed recent lava flows confined to the crater, two thermal anomaly spots in the eastern part of the crater, and mainly white emissions from the SE. Thermal anomalies became stronger and more frequent in mid-May 2022, followed by strong Strombolian activity through June and July (BGVN 47:10); Sentinel-2 images on 2 June 2022 showed active lava flows within the crater and overflowing onto the NE flank. Clear images from 23 April 2023 (figure 47) show the extent of the cooled NE-flank lava flow, more extensive intra-crater flows, and two hotspots in slightly different locations compared to the previous March.
Geologic Background. The Lewotolok (or Lewotolo) stratovolcano occupies the eastern end of an elongated peninsula extending north into the Flores Sea, connected to Lembata (formerly Lomblen) Island by a narrow isthmus. It is symmetrical when viewed from the north and east. A small cone with a 130-m-wide crater constructed at the SE side of a larger crater forms the volcano's high point. Many lava flows have reached the coastline. Eruptions recorded since 1660 have consisted of explosive activity from the summit crater.
Information Contacts: Pusat Vulkanologi dan Mitigasi Bencana Geologi (PVMBG, also known as Indonesian Center for Volcanology and Geological Hazard Mitigation, CVGHM), Jalan Diponegoro 57, Bandung 40122, Indonesia (URL: http://www.vsi.esdm.go.id/); MAGMA Indonesia, Kementerian Energi dan Sumber Daya Mineral (URL: https://magma.esdm.go.id/v1); Darwin Volcanic Ash Advisory Centre (VAAC), Bureau of Meteorology, Northern Territory Regional Office, PO Box 40050, Casuarina, NT 0811, Australia (URL: http://www.bom.gov.au/info/vaac/); MIROVA (Middle InfraRed Observation of Volcanic Activity), a collaborative project between the Universities of Turin and Florence (Italy) supported by the Centre for Volcanic Risk of the Italian Civil Protection Department (URL: http://www.mirovaweb.it/); Copernicus Browser, Copernicus Data Space Ecosystem, European Space Agency (URL: https://dataspace.copernicus.eu/browser/).
Barren Island (India) — April 2023 Cite this Report
Barren Island
India
12.278°N, 93.858°E; summit elev. 354 m
All times are local (unless otherwise noted)
Thermal activity during December 2022-March 2023
Barren Island is part of a N-S-trending volcanic arc extending between Sumatra and Burma (Myanmar). The caldera, which is open to the sea on the west, was created during a major explosive eruption in the late Pleistocene that produced pyroclastic flow and surge deposits. Eruptions dating back to 1787, have changed the morphology of the pyroclastic cone in the center of the caldera, and lava flows that fill much of the caldera floor have reached the sea along the western coast. Previous activity was detected during mid-May 2022, consisting of intermittent thermal activity. This report covers June 2022 through March 2023, which included strong thermal activity beginning in late December 2022, based on various satellite data.
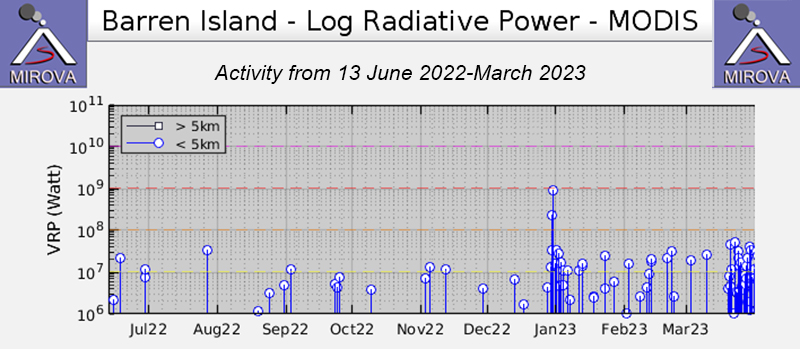
Activity was relatively quiet during June through late December 2022 and mostly consisted of low-power thermal anomalies, based on the MIROVA (Middle InfraRed Observation of Volcanic Activity) graph. During late December, a spike in both power and frequency of thermal anomalies was detected (figure 58). There was another pulse in thermal activity in mid-March, which consisted of more frequent and relatively strong anomalies.
The Suomi NPP/VIIRS sensor data showed five thermal alerts on 29 December 2022. The number of alerts increased to 19 on 30 December. According to the Darwin VAAC, ash plumes identified in satellite images captured at 2340 on 30 December and at 0050 on 31 December rose to 1.5 km altitude and drifted SW. The ash emissions dissipated by 0940. On 31 December, a large thermal anomaly was detected; based on a Sentinel-2 infrared satellite image, the anomaly was relatively strong and extended to the N (figure 59).
Thermal activity continued during January through March. Sentinel-2 infrared satellite data showed some thermal anomalies of varying intensity on clear weather days on 5, 10, 15, 20, and 30 January 2023, 9, 14, 19, and 24 February 2023, and 21, 26, and 31 March (figure 59). According to Suomi NPP/VIIRS sensor data, a total of 30 thermal anomalies were detected over 18 days on 2-3, 7, 9-14, 16-17, 20, 23, 25, and 28-31 January. The sensor data showed a total of six hotspots detected over six days on 1, 4-5, and 10-12 February. During March, a total of 33 hotspots were visible over 11 days on 20-31 March. Four MODVOLC thermal alerts were issued on 25, 27, and 29 March.
Geologic Background. Barren Island, a possession of India in the Andaman Sea about 135 km NE of Port Blair in the Andaman Islands, is the only historically active volcano along the N-S volcanic arc extending between Sumatra and Burma (Myanmar). It is the emergent summit of a volcano that rises from a depth of about 2250 m. The small, uninhabited 3-km-wide island contains a roughly 2-km-wide caldera with walls 250-350 m high. The caldera, which is open to the sea on the west, was created during a major explosive eruption in the late Pleistocene that produced pyroclastic-flow and -surge deposits. Historical eruptions have changed the morphology of the pyroclastic cone in the center of the caldera, and lava flows that fill much of the caldera floor have reached the sea along the western coast.
Information Contacts: Darwin Volcanic Ash Advisory Centre (VAAC), Bureau of Meteorology, Northern Territory Regional Office, PO Box 40050, Casuarina, NT 0811, Australia (URL: http://www.bom.gov.au/info/vaac/); MIROVA (Middle InfraRed Observation of Volcanic Activity), a collaborative project between the Universities of Turin and Florence (Italy) supported by the Centre for Volcanic Risk of the Italian Civil Protection Department (URL: http://www.mirovaweb.it/); Hawai'i Institute of Geophysics and Planetology (HIGP) - MODVOLC Thermal Alerts System, School of Ocean and Earth Science and Technology (SOEST), Univ. of Hawai'i, 2525 Correa Road, Honolulu, HI 96822, USA (URL: http://modis.higp.hawaii.edu/); Sentinel Hub Playground (URL: https://www.sentinel-hub.com/explore/sentinel-playground); NASA Worldview (URL: https://worldview.earthdata.nasa.gov/).
Villarrica
Chile
39.42°S, 71.93°W; summit elev. 2847 m
All times are local (unless otherwise noted)
Nighttime crater incandescence, ash emissions, and seismicity during October 2022-March 2023
Villarrica, located in central Chile, consists of a 2-km-wide caldera that formed about 3,500 years ago, located at the base of the presently active cone. Historical eruptions date back to 1558 and have been characterized by mild-to-moderate explosive activity with occasional lava effusions. The current eruption period began in December 2014 and has recently consisted of ongoing seismicity, gas-and-steam emissions, and thermal activity (BGVN 47:10). This report covers activity during October 2022 through March 2023 and describes Strombolian explosions, ash emissions, and crater incandescence. Information for this report primarily comes from the Southern Andes Volcano Observatory (Observatorio Volcanológico de Los Andes del Sur, OVDAS), part of Chile's National Service of Geology and Mining (Servicio Nacional de Geología y Minería, SERNAGEOMIN) and satellite data.
Seismicity during October consisted of discrete long-period (LP)-type events, tremor (TR), and volcano-tectonic (VT)-type events. Webcam images showed eruption plumes rising as high as 460 m above the crater rim; plumes deposited tephra on the E, S, and SW flanks within 500 m of the crater on 2, 18, 23, and 31 October. White gas-and-steam emissions rose 80-300 m above the crater accompanied by crater incandescence during 2-3 October. There was a total of 5 VT-type events, 10,625 LP-type events, and 2,232 TR-type events detected throughout the month. Sulfur dioxide data was obtained by the Differential Absorption Optical Spectroscopy Equipment (DOAS) installed 6 km in an ESE direction. The average value of the sulfur dioxide emissions was 535 ± 115 tons per day (t/d); the highest daily maximum was 1,273 t/d on 13 October. These values were within normal levels and were lower compared to September. During the night of 3-4 October Strombolian activity ejected blocks as far as 40 m toward the NW flank. Small, gray-brown ash pulses rose 60 m above the crater accompanied white gas-and-steam emissions that rose 40-300 m high during 4-5 October. In addition, crater incandescence and Strombolian explosions that ejected blocks were reported during 4-5 and 9-11 October. Based on satellite images from 12 October, ballistic ejecta traveled as far as 400 m and the resulting ash was deposited 3.2 km to the E and SE and 900 m to the NW.
Satellite images from 14 October showed an active lava lake that covered an area of 36 square meters in the E part of the crater floor. There was also evidence of a partial collapse (less than 300 square meters) at the inner SSW crater rim. POVI posted an 18 October photo that showed incandescence above the crater rim, noting that crater incandescence was visible during clear weather nights. In addition, webcam images at 1917 showed lava fountaining and Strombolian explosions; tourists also described seeing splashes of lava ejected from a depth of 80 m and hearing loud degassing sounds. Tephra deposits were visible around the crater rim and on the upper flanks on 24 October. On 25 October SERNAGEOMIN reported that both the number and amplitude of LP earthquakes had increased, and continuous tremor also increased; intense crater incandescence was visible in satellite images. On 31 October Strombolian explosions intensified and ejected material onto the upper flanks.
Activity during November consisted of above-baseline seismicity, including intensifying continuous tremor and an increase in the number of LP earthquakes. On 1 November a lava fountain was visible rising above the crater rim. Nighttime crater incandescence was captured in webcam images on clear weather days. Strombolian explosions ejected incandescent material on the NW and SW flanks during 1, 2, and 6-7 November. POVI reported that the width of the lava fountains that rose above the crater rim on 2 November suggested that the vent on the crater floor was roughly 6 m in diameter. Based on reports from observers and analyses of satellite imagery, material that was deposited on the upper flanks, primarily to the NW, consisted of clasts up to 20 cm in diameter. During an overflight on 19 November SERNAGEOMIN scientists observed a cone on the crater floor with an incandescent vent at its center that contained a lava lake. Deposits of ejecta were also visible on the flanks. That same day a 75-minute-long series of volcano-tectonic earthquakes was detected at 1940; a total of 21 events occurred 7.8 km ESE of the crater. Another overflight on 25 November showed the small cone on the crater floor with an incandescent lava lake at the center; the temperature of the lava lake was 1,043 °C, based data gathered during the overflight.
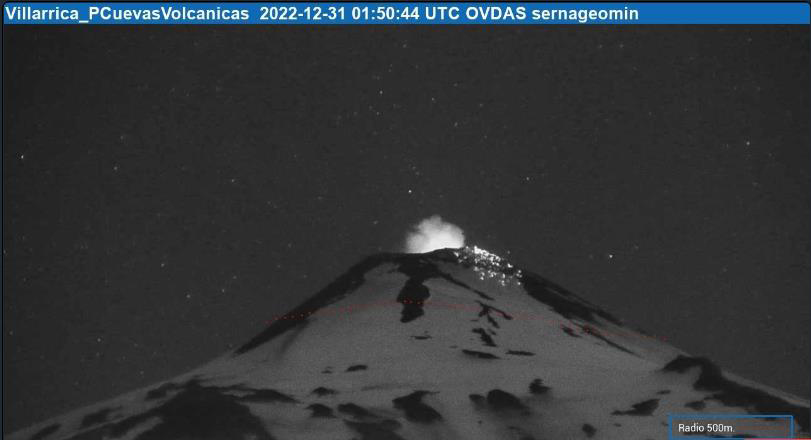
Similar seismicity, crater incandescence, and gas-and-steam emissions continued during December. On 1 December incandescent material was ejected 80-220 m above the crater rim. During an overflight on 6 December, intense gas-and-steam emissions from the lava lake was reported, in addition to tephra deposits on the S and SE flanks as far as 500 m from the crater. During 7-12 December seismicity increased slightly and white, low-altitude gas-and-steam emissions and crater incandescence were occasionally visible. On 24 December at 0845 SERNAGEOMIN reported an increase in Strombolian activity; explosions ejected material that generally rose 100 m above the crater, although one explosion ejected incandescent tephra as far as 400 m from the crater onto the SW flank. According to POVI, 11 explosions ejected incandescent material that affected the upper SW flank between 2225 on 25 December to 0519 on 26 December. POVI recorded 21 Strombolian explosions that ejected incandescent material onto the upper SW flank from 2200 on 28 December to 0540 on 29 December. More than 100 Strombolian explosions ejected material onto the upper W and NW flanks during 30-31 December. On 30 December at 2250 an explosion was detected that generated an eruptive column rising 120 m above the crater and ejecting incandescent material 300 m on the NW flank (figure 120). Explosions detected at 2356 on 31 December ejected material 480 m from the crater rim onto the NW flank and at 0219 material was deposited on the same flank as far as 150 m. Both explosions ejected material as high as 120 m above the crater rim.
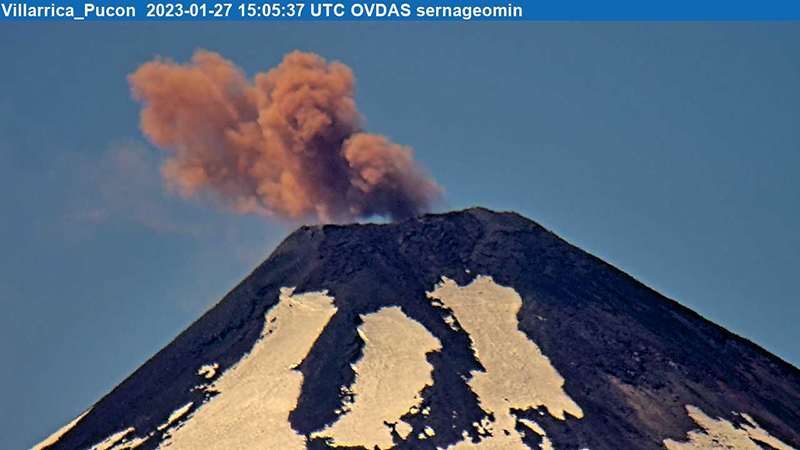
During January 2023, Strombolian explosions and lava fountaining continued mainly in the crater, ejecting material 100 m above the crater. Gas-and-steam emissions rose 40-260 m above the crater and drifted in different directions, and LP-type events continued. Emissions during the night of 11 January including some ash rose 80 m above the crater and as far as 250 m NE flank. POVI scientists reported about 70 lava fountaining events from 2130 on 14 January to 0600 on 15 January. At 2211 on 15 January there was an increase in frequency of Strombolian explosions that ejected incandescent material 60-150 m above the crater. Some ashfall was detected around the crater. POVI noted that on 19 January lava was ejected as high as 140 m above the crater rim and onto the W and SW flanks. Explosion noises were heard on 19 and 22 January in areas within a radius of 10 km. During 22-23 January Strombolian explosions ejected incandescent material 60-100 m above the crater that drifted SE. A seismic event at 1204 on 27 January was accompanied by an ash plume that rose 220 m above the crater and drifted E (figure 121); later that same day at 2102 an ash plume rose 180 m above the crater and drifted E.
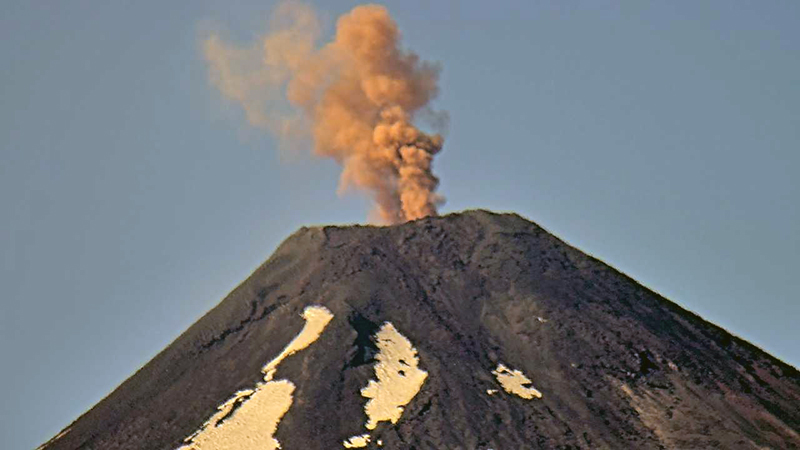
Seismicity, primarily characterized by LP-type events, and Strombolian explosions persisted during February and March. POVI reported that three explosions were heard during 1940-1942 on 6 February, and spatter was seen rising 30 m above the crater rim hours later. On 9 February lava fountains were visible rising 50 m above the crater rim. On 17 February Strombolian explosions ejected material 100 m above the crater rim and onto the upper SW flank. Webcam images from 20 February showed two separate fountains of incandescent material, which suggested that a second vent had opened to the E of the first vent. Spatter was ejected as high as 80 m above the crater rim and onto the upper NE flank. A sequence of Strombolian explosions was visible from 2030 on 20 February to 0630 on 21 February. Material was ejected as high as 80 m above the crater rim and onto the upper E flank. LP-type earthquakes recorded 1056 and at 1301 on 27 February were associated with ash plumes that rose 300 m above the crater and drifted NE (figure 122). Crater incandescence above the crater rim was observed in webcam images on 13 March, which indicated Strombolian activity. POVI posted a webcam image from 2227 on 18 March showing Strombolian explosions that ejected material as high as 100 m above the crater rim. Explosions were heard up to 8 km away. On 19 March at 1921 an ash emission rose 340 m above the crater and drifted NE. On 21 and 26 March Strombolian explosions ejected material 100 and 110 m above the crater rim, respectively. On 21 March Strombolian explosions ejected material 100 m above the crater rim. Low-intensity nighttime crater incandescence was detected by surveillance cameras on 24 March.
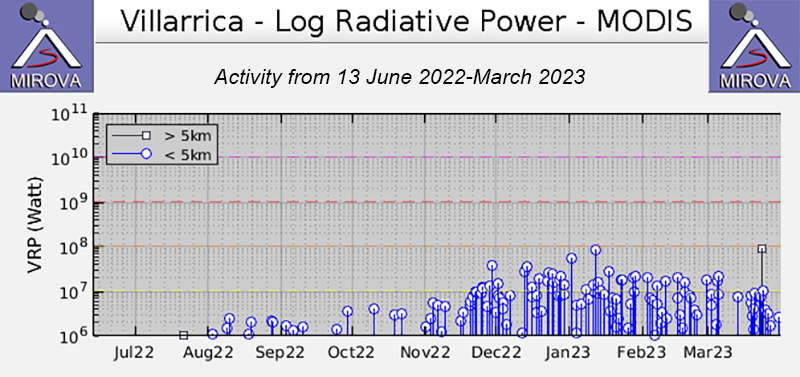
Infrared MODIS satellite data processed by MIROVA (Middle InfraRed Observation of Volcanic Activity) detected an increase in thermal activity during mid-November, which corresponds to sustained Strombolian explosions, lava fountaining, and crater incandescence (figure 123). This activity was also consistently captured on clear weather days throughout the reporting period in Sentinel-2 infrared satellite images (figure 124).
Geologic Background. The glacier-covered Villarrica stratovolcano, in the northern Lakes District of central Chile, is ~15 km south of the city of Pucon. A 2-km-wide caldera that formed about 3,500 years ago is located at the base of the presently active, dominantly basaltic to basaltic-andesite cone at the NW margin of a 6-km-wide Pleistocene caldera. More than 30 scoria cones and fissure vents are present on the flanks. Plinian eruptions and pyroclastic flows that have extended up to 20 km from the volcano were produced during the Holocene. Lava flows up to 18 km long have issued from summit and flank vents. Eruptions documented since 1558 CE have consisted largely of mild-to-moderate explosive activity with occasional lava effusion. Glaciers cover 40 km2 of the volcano, and lahars have damaged towns on its flanks.
Information Contacts: Servicio Nacional de Geología y Minería (SERNAGEOMIN), Observatorio Volcanológico de Los Andes del Sur (OVDAS), Avda Sta María No. 0104, Santiago, Chile (URL: http://www.sernageomin.cl/); Proyecto Observación Villarrica Internet (POVI) (URL: http://www.povi.cl/); MIROVA (Middle InfraRed Observation of Volcanic Activity), a collaborative project between the Universities of Turin and Florence (Italy) supported by the Centre for Volcanic Risk of the Italian Civil Protection Department (URL: http://www.mirovaweb.it/); Sentinel Hub Playground (URL: https://www.sentinel-hub.com/explore/sentinel-playground).
Fuego
Guatemala
14.473°N, 90.88°W; summit elev. 3763 m
All times are local (unless otherwise noted)
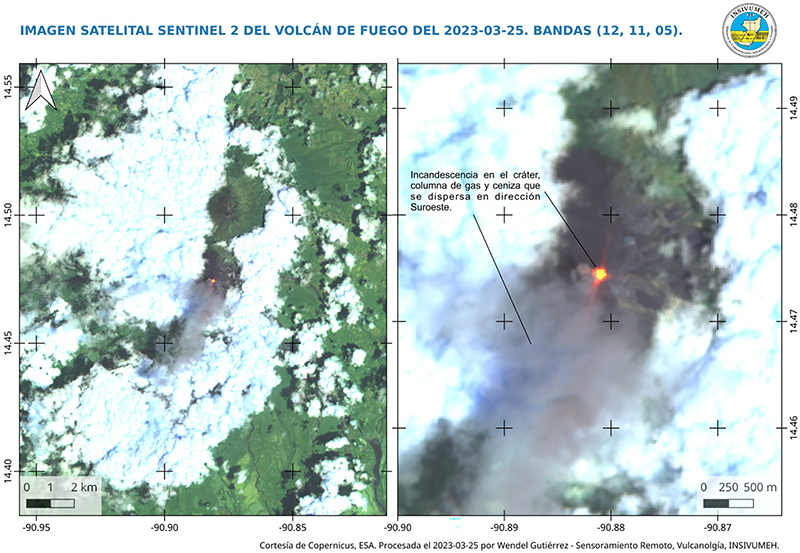
Daily explosions, gas-and-ash plumes, avalanches, and ashfall during December 2022-March 2023
Fuego, one of three large stratovolcanoes overlooking the city of Antigua, Guatemala, has been vigorously erupting since January 2002, with recorded eruptions dating back to 1531 CE. Eruptive activity has included major ashfalls, pyroclastic flows, lava flows, and lahars. Frequent explosions with ash emissions, block avalanches, and lava flows have persisted since 2018. More recently, activity remained relatively consistent with daily explosions, ash plumes, ashfall, avalanches, and lahars (BGVN 48:03). This report covers similar activity during December 2022 through March 2023, based on information from the Instituto Nacional de Sismologia, Vulcanología, Meteorología e Hidrologia (INSIVUMEH) daily reports, Coordinadora Nacional para la Reducción de Desastres (CONRED) newsletters, and various satellite data.
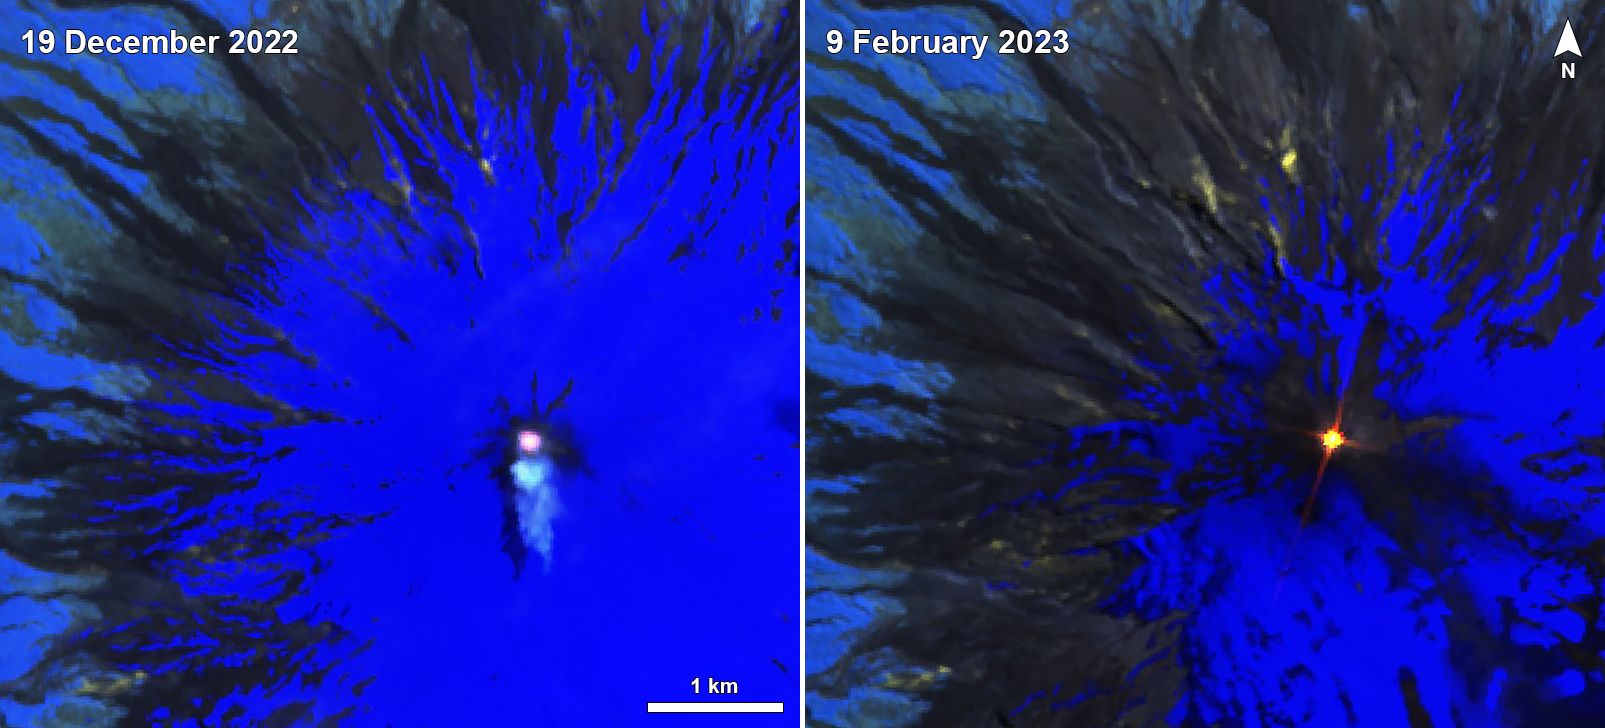
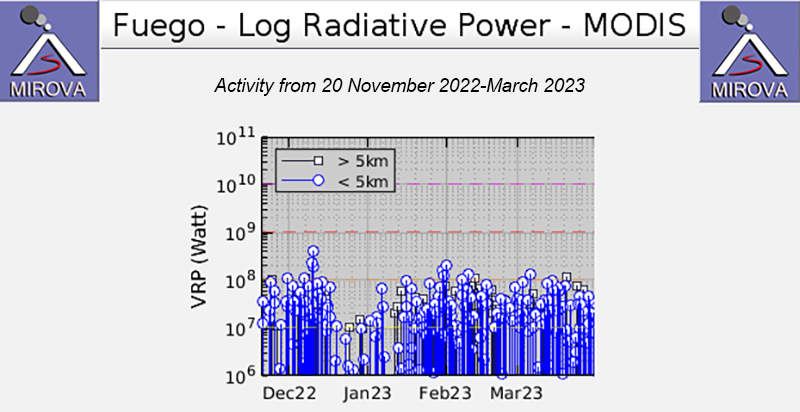
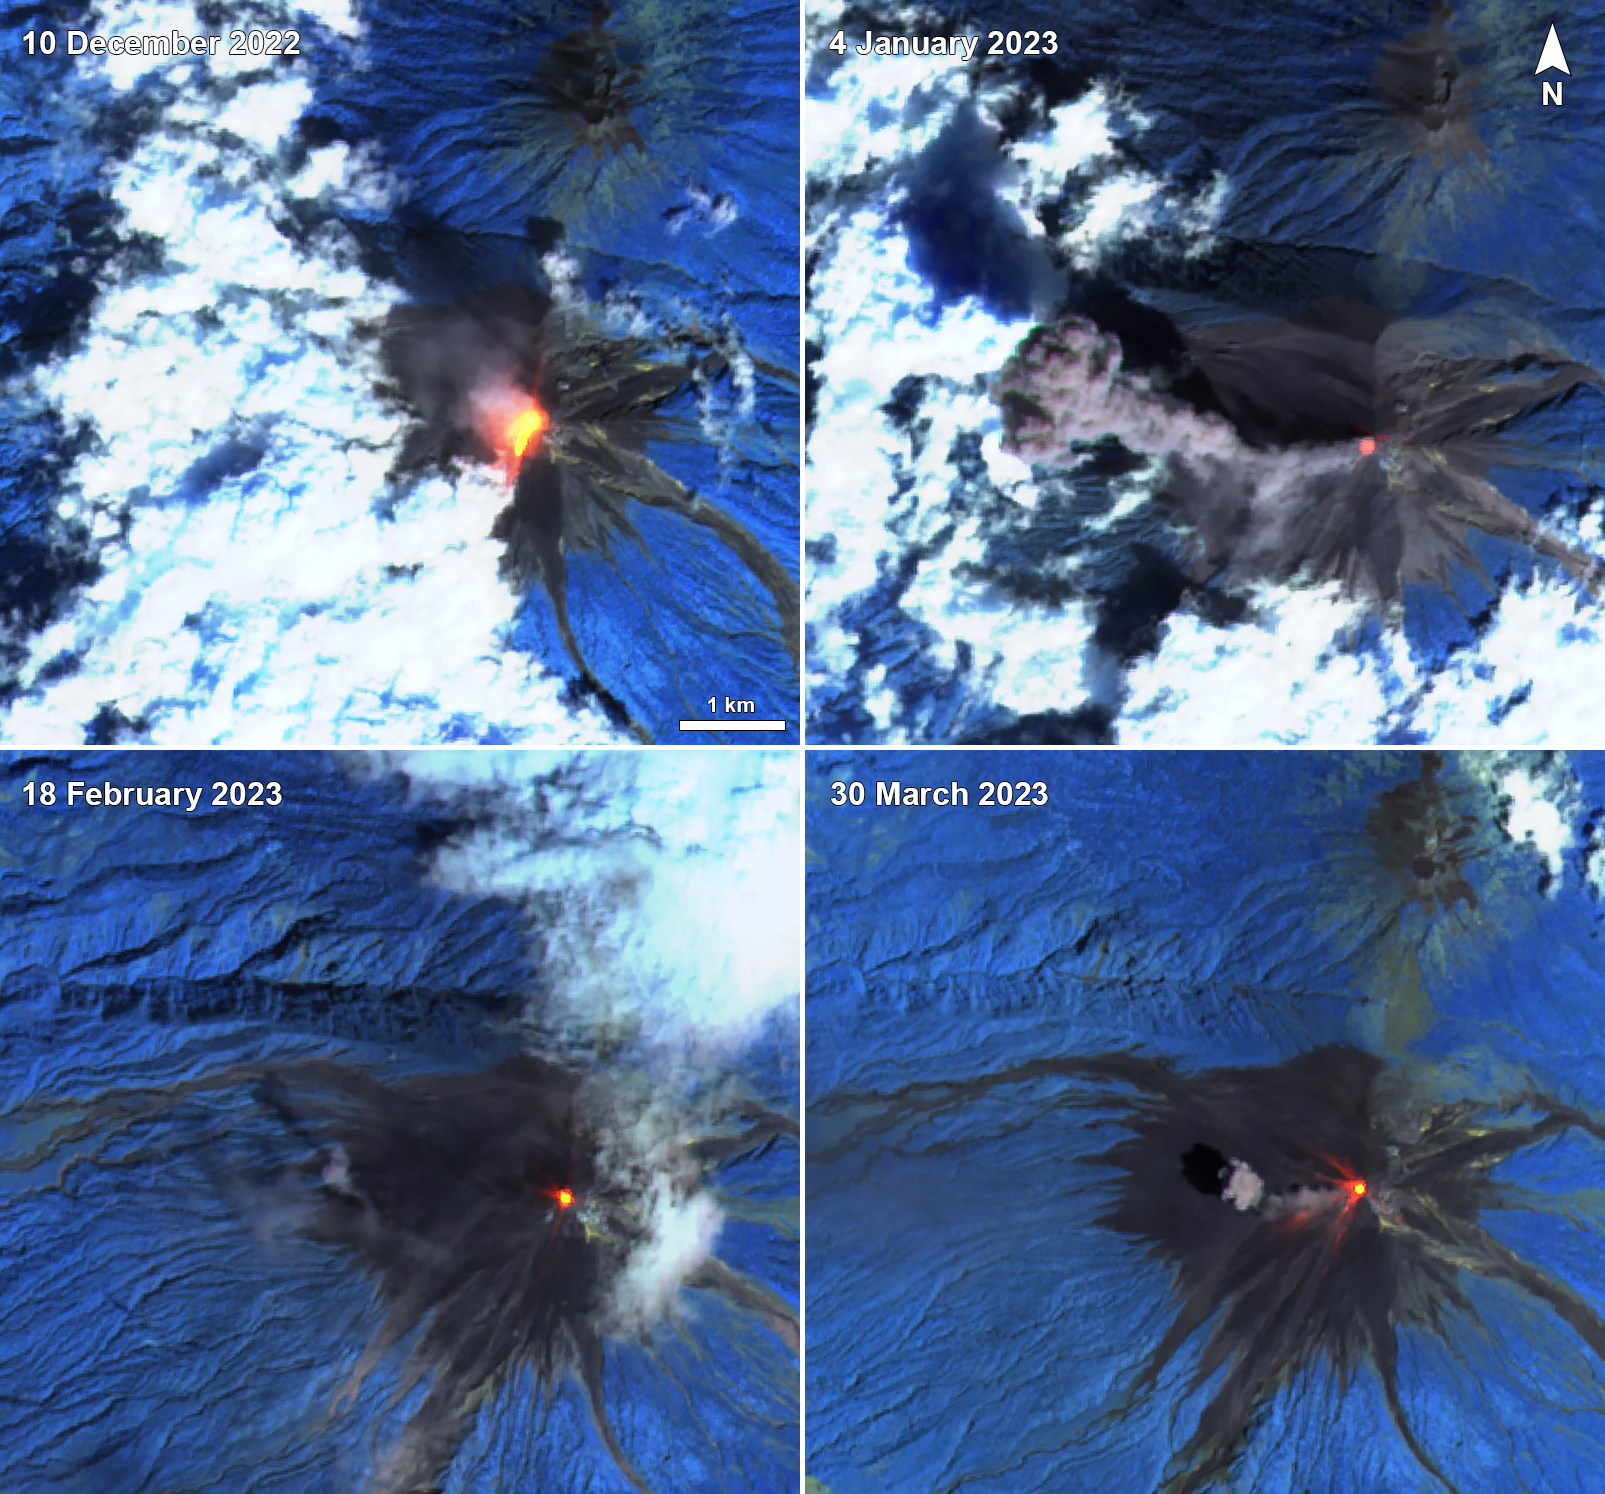
Daily explosions reported throughout December 2022-March 2023 generated ash plumes to 6 km altitude that drifted as far as 60 km in multiple directions. The explosions also caused rumbling sounds of varying intensities, with shock waves that vibrated the roofs and windows of homes near the volcano. Incandescent pulses of material rose 100-500 m above the crater, which caused block avalanches around the crater and toward the Santa Teresa, Taniluyá (SW), Ceniza (SSW), El Jute, Honda, Las Lajas (SE), Seca (W), and Trinidad (S) drainages. Fine ashfall was also frequently reported in nearby communities (table 27). MIROVA (Middle InfraRed Observation of Volcanic Activity) analysis of MODIS satellite data showed frequent, moderate thermal activity throughout the reporting period; however, there was a brief decline in both power and frequency during late-to-mid-January 2023 (figure 166). A total of 79 MODVOLC thermal alerts were issued: 16 during December 2022, 17 during January 2023, 23 during February, and 23 during March. Some of these thermal evets were also visible in Sentinel-2 infrared satellite imagery at the summit crater, which also showed occasional incandescent block avalanches descending the S, W, and NW flanks, and accompanying ash plumes that drifted W (figure 167).
Table 27. Activity at Fuego during December 2022 through March 2023 included multiple explosions every hour. Ash emissions rose as high as 6 km altitude and drifted generally W and SW as far as 60 km, causing ashfall in many communities around the volcano. Data from daily INSIVUMEH reports and CONRED newsletters.
| Month |
Explosions per hour |
Ash plume altitude (max) |
Ash plume distance (km) and direction |
Drainages affected by block avalanches |
Communities reporting ashfall |
| Dec 2022 |
1-12 |
6 km |
WSW, W, SW, NW, S, SE, NE, and E, 10-30 km |
Santa Teresa, Taniluyá, Ceniza, El Jute, Honda, Las Lajas, Seca, and Trinidad |
Panimaché I and II, Morelia, Santa Sofía, El Porvenir, Finca Palo Verde, Yepocapa, Yucales, Sangre de Cristo, La Rochela, Ceilán, San Andrés Osuna, and Aldea La Cruz |
| Jan 2023 |
1-12 |
5 km |
W, SW, NW, S, N, NE, E, and SE, 7-60 km |
Ceniza, Las Lajas, Santa Teresa, Taniluyá, Trinidad, Seca, Honda, and El Jute |
Panimaché I and II, Morelia, Santa Sofía, El Porvenir, Palo Verde, Yucales, Yepocapa, Sangre de Cristo, La Rochela, Ceylon, Alotenango, and San Andrés Osuna |
| Feb 2023 |
1-12 |
4.9 km |
SW, W, NW, and N, 10-30 km |
Santa Teresa, Taniluyá, Ceniza, Las Lajas, Seca, Trinidad, El Jute, and Honda |
Panimaché I and II, Morelia, Santa Sofía, Palo Verde, San Pedro Yepocapa, El Porvenir, Sangre de Cristo, La Soledad, Acatenango, El Campamento, and La Asunción |
| Mar 2023 |
3-11 |
5 km |
W, SW, NW, NE, N, S, SE, and E, 10-30 km |
Seca, Ceniza, Taniluyá, Las Lajas, Honda, Trinidad, El Jute, and Santa Teresa |
Yepocapa, Sangre de Cristo, Panimaché I and II, Morelia, Santa Sofía, El Porvenir, La Asunción, Palo Verde, La Rochela, San Andrés Osuna, Ceilán, and Aldeas |
Daily explosions ranged between 1 and 12 per hour during December 2022, generating ash plumes that rose to 4.5-6 km altitude and drifted 10-30 km in multiple directions. These explosions created rumbling sounds with a shock wave that vibrated the roofs and windows of homes near the volcano. Frequent white gas-and-steam plumes rose to 4.6 km altitude. Strombolian activity resulted in incandescent pulses that generally rose 100-500 m above the crater, which generated weak-to-moderate avalanches around the crater and toward the Santa Teresa, Taniluyá, Ceniza, El Jute, Honda, Las Lajas, Seca, and Trinidad drainages, where material sometimes reached vegetation. Fine ashfall was recorded in Panimaché I and II (8 km SW), Morelia (9 km SW), Santa Sofía (12 km SW), El Porvenir (8 km ENE), Finca Palo Verde, Yepocapa (8 km NW), Yucales (12 km SW), Sangre de Cristo (8 km WSW), La Rochela, Ceilán, San Andrés Osuna, and Aldea La Cruz. INSIVUMEH reported that on 10 December a lava flow formed in the Ceniza drainage and measured 800 m long; it remained active at least through 12 December and block avalanches were reported at the front of the flow. A pyroclastic flow was reported at 1100 on 10 December, descending the Las Lajas drainage for several kilometers and reaching the base of the volcano. Pyroclastic flows were also observed in the Ceniza drainage for several kilometers, reaching the base of the volcano on 11 December. Ash plumes rose as high as 6 km altitude, according to a special bulletin from INSIVUMEH. On 31 December explosions produced incandescent pulses that rose 300 m above the crater, which covered the upper part of the cone.
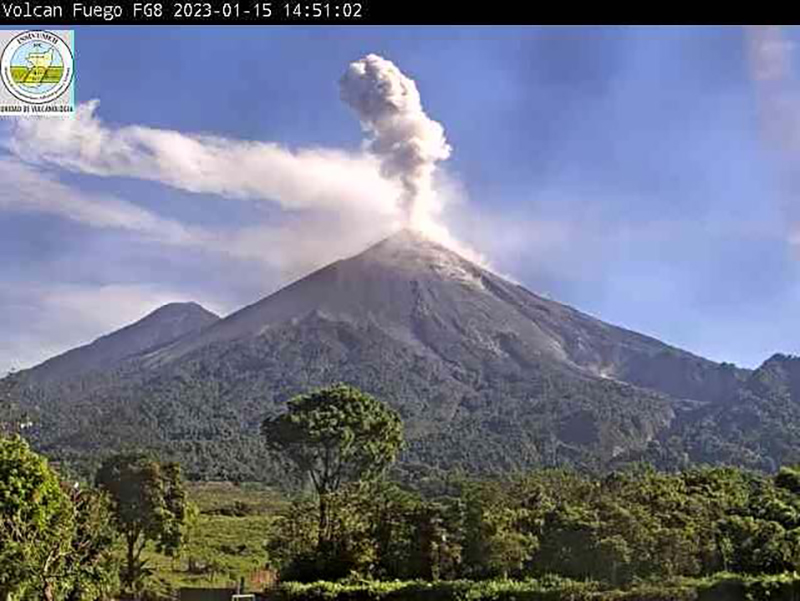
Activity during January 2023 consisted of 1-12 daily explosions, which produced ash plumes that rose to 4.2-5 km altitude and drifted 7-60 km in multiple directions (figure 168). Incandescent pulses of material were observed 100-350 m above the crater, which generated avalanches around the crater and down the Ceniza, Las Lajas, Santa Teresa, Taniluyá, Trinidad, Seca, Honda, and El Jute drainages. Sometimes, the avalanches resuspended older fine material 100-500 m above the surface that drifted W and SW. Ashfall was recorded in Panimaché I and II, Morelia, Santa Sofía, El Porvenir, Palo Verde, Yucales, Yepocapa, Sangre de Cristo, La Rochela, Ceylon, Alotenango, and San Andrés Osuna. Intermittent white gas-and-steam plumes rose to 4.5 km altitude and drifted W and NW.
There were 1-12 daily explosions recorded through February, which generated ash plumes that rose to 4.2-4.9 km altitude and drifted 10-30 km SW, W, NW, and N. Intermittent white gas-and-steam emissions rose 4.5 km altitude and drifted W and SW. During the nights and early mornings, incandescent pulses were observed 100-400 m above the crater. Weak-to-moderate avalanches were also observed down the Santa Teresa, Taniluyá, Ceniza, Las Lajas, Seca, Trinidad, El Jute, and Honda drainages, sometimes reaching the edge of vegetated areas. Occasional ashfall was reported in Panimaché I and II, Morelia, Santa Sofía, Palo Verde, San Pedro Yepocapa, El Porvenir, Sangre de Cristo, La Soledad, Acatenango, El Campamento, and La Asunción. On 18 February strong winds resuspended previous ash deposits as high as 1 km above the surface that blew 12 km SW and S.
During March, daily explosions ranged from 3-11 per hour, producing ash plumes that rose to 4-5 km altitude and drifted 10-30 km W, SW, NW, NE, N, S, SE, and E. During the night and early morning, crater incandescence (figure 169) and incandescent pulses of material were observed 50-400 m above the crater. Weak-to-moderate avalanches affected the Seca, Ceniza, Taniluyá, Las Lajas, Honda, Trinidad, El Jute, and Santa Teresa drainages, sometimes reaching the edge of vegetation. Frequent ashfall was detected in Yepocapa, Sangre de Cristo, Panimaché I and II, Morelia, Santa Sofía, El Porvenir, La Asunción, Palo Verde, La Rochela, San Andrés Osuna, Ceilán, and Aldeas. Weak ashfall was recorded in San Andrés Osuna, La Rochela, Ceylon during 8-9 March. A lahar was reported in the Ceniza drainage on 15 March, carrying fine, hot volcanic material, tree branches, trunks, and blocks from 30 cm to 1.5 m in diameter. On 18 March lahars were observed in the Las Lajas and El Jute drainages, carrying fine volcanic material, tree branches and trunks, and blocks from 30 cm to 1.5 m in diameter. As a result, there was also damage to the road infrastructure between El Rodeo and El Zapote.
Geologic Background. Volcán Fuego, one of Central America's most active volcanoes, is also one of three large stratovolcanoes overlooking Guatemala's former capital, Antigua. The scarp of an older edifice, Meseta, lies between Fuego and Acatenango to the north. Construction of Meseta dates back to about 230,000 years and continued until the late Pleistocene or early Holocene. Collapse of Meseta may have produced the massive Escuintla debris-avalanche deposit, which extends about 50 km onto the Pacific coastal plain. Growth of the modern Fuego volcano followed, continuing the southward migration of volcanism that began at the mostly andesitic Acatenango. Eruptions at Fuego have become more mafic with time, and most historical activity has produced basaltic rocks. Frequent vigorous historical eruptions have been recorded since the onset of the Spanish era in 1524, and have produced major ashfalls, along with occasional pyroclastic flows and lava flows.
Information Contacts: Instituto Nacional de Sismologia, Vulcanologia, Meteorologia e Hydrologia (INSIVUMEH), Unit of Volcanology, Geologic Department of Investigation and Services, 7a Av. 14-57, Zona 13, Guatemala City, Guatemala (URL: http://www.insivumeh.gob.gt/ ); MIROVA (Middle InfraRed Observation of Volcanic Activity), a collaborative project between the Universities of Turin and Florence (Italy) supported by the Centre for Volcanic Risk of the Italian Civil Protection Department (URL: http://www.mirovaweb.it/); Hawai'i Institute of Geophysics and Planetology (HIGP) - MODVOLC Thermal Alerts System, School of Ocean and Earth Science and Technology (SOEST), Univ. of Hawai'i, 2525 Correa Road, Honolulu, HI 96822, USA (URL: http://modis.higp.hawaii.edu/); Sentinel Hub Playground (URL: https://www.sentinel-hub.com/explore/sentinel-playground).
Search Bulletin Archive by Publication Date
Select a month and year from the drop-downs and click "Show Issue" to have that issue displayed in this tab.
The default month and year is the latest issue available.
Bulletin of the Global Volcanism Network - Volume 22, Number 04 (April 1997)
Managing Editor: Richard Wunderman
Bezymianny (Russia)
Eruption sends plume to 4 km above crater on 9 May
Deception Island (Antarctica)
Seismicity lower than previously recorded
Kilauea (United States)
Lava issuing from three sites; Pu`u `O`o lava lake 20 m from W crater rim
Langila (Papua New Guinea)
Fluctuating activity, with variable March and April plumes
Manam (Papua New Guinea)
Outburst on 6 April sends ash clouds to 1 km
Okmok (United States)
Activity waning by month's end
Popocatepetl (Mexico)
Ash ejections send ash above 4 km altitude and cause ashfalls
Rabaul (Papua New Guinea)
Typical eruptive behavior and plumes up to 7 km altitude
Soufriere Hills (United Kingdom)
Pyroclastic flows over Galway's Wall reach 500 m from the shore
Vesuvius (Italy)
Low seismicity prevails after March-May 1996 earthquake swarm
Villarrica (Chile)
Strombolian activity and lava in central pit; red glow returns at night
Bezymianny (Russia) — April 1997 Cite this Report
Bezymianny
Russia
55.972°N, 160.595°E; summit elev. 2882 m
All times are local (unless otherwise noted)
Eruption sends plume to 4 km above crater on 9 May
Although more vigorous eruptions took place in May, scientists at the Institute of Volcanology (IV) reported that activity in early April was limited to moderate gas-and-steam emissions. Between 19 and 23 April, seismic stations at Zelenaya and Podkova, 14 and 23 km from the volcano, respectively, detected very low (up to 0.1 µm) tremor.
IV scientists also reported that at 0545 on 9 May an eruption plume rose to ~4 km above the crater and extended 40 km SE early in the eruption. Within two hours activity declined slightly, but pyroclastic outbursts reached 3,000 m above the crater. At 1312, Kozyrevsk and Klyuchi stations detected a strong explosion that sent an eruption column >10 km above the crater. The plume changed directions, drifted NNE, and at 1630 ashfall began in the town of Klyuchi, 47 km from the volcano. The two-hour ashfall deposited 180 g/m2 of measured ash in Klyuchi.
A scientist from the Institute of Volcanic Geology and Geochemistry (IVGG) reported that the column from this event extended ENE for several tens of kilometers. He also reported that at 1600 two vents may have been active. Satellite images acquired at 1930 on 9 May indicated the plume extended ~400 km ENE.
At about 0300 on 10 May, visual observations made by IVGG volcanologists revealed that the plume rose to ~6,100 m and extended at least several tens of kilometers SE. They also reported that seismic activity had declined from the high levels recorded during the most explosive events of 9 May. At 0600 on 10 May, GMS-5 satellite imagery showed the plume extended ~700 km ENE.
Geologic Background. The modern Bezymianny, much smaller than its massive neighbors Kamen and Kliuchevskoi on the Kamchatka Peninsula, was formed about 4,700 years ago over a late-Pleistocene lava-dome complex and an edifice built about 11,000-7,000 years ago. Three periods of intensified activity have occurred during the past 3,000 years. The latest period, which was preceded by a 1,000-year quiescence, began with the dramatic 1955-56 eruption. This eruption, similar to that of St. Helens in 1980, produced a large open crater that was formed by collapse of the summit and an associated lateral blast. Subsequent episodic but ongoing lava-dome growth, accompanied by intermittent explosive activity and pyroclastic flows, has largely filled the 1956 crater.
Information Contacts: N.A. Zharinov and Yu.V. Demyanchuk, Institute of Volcanology, Petropavlovsk-Kamchatsky, 683006, Russia; Tom Miller, Alaska Volcano Observatory (AVO), a cooperative program of a) U.S. Geological Survey, 4200 University Drive, Anchorage, AK 99508-4667, USA (URL: http://www.avo.alaska.edu/), b) Geophysical Institute, University of Alaska, PO Box 757320, Fairbanks, AK 99775-7320, USA, and c) Alaska Division of Geological & Geophysical Surveys, 794 University Ave., Suite 200, Fairbanks, AK 99709, USA; Vladimir Kirianov, Kamchatka Volcanic Eruptions Response Team (KVERT), Institute of Volcanic Geology and Geochemistry, Piip Ave. 9, Petropavlovsk-Kamchatsky, 683006, Russia; Bureau of Meteorology, Northern Territory Regional Office, P.O. Box 735, Darwin, NT 0801 Australia.
Deception Island (Antarctica) — April 1997 Cite this Report
Deception Island
Antarctica
62.9567°S, 60.6367°W; summit elev. 602 m
All times are local (unless otherwise noted)
Seismicity lower than previously recorded
The following describes work completed during the 1996-97 austral summer, carried out from 6 December 1996 to 25 February 1997. The survey scientists deployed magnetometer instruments, gravimeters, and a meteorological station.
Seismicity (figure 11) was monitored with a digital seismic array with 16-bit dynamic range. The array included 24 geophones (24 Mark L4C-L25b). The array was placed in the same location as the 1994-95 and 1995- 95 surveys (BGVN 20:04 and 21:04) but in addition four additional seismometers were installed in active areas of the island to gather information on the spectral characteristics of the volcanic events. The recorded seismic activity was lower in both energy level and number of events than for the previous years.
The recorded events included six intermediate-focus earthquakes, eight regional earthquakes, 13 events with S-P arrival times smaller than 5 seconds and M 2.5, and five volcanic tremors. There were also 119 long-period events and 43 hybrid events, some of which had S-P arrival times under 1 second.
Scientists investigated fumarole geochemistry, thermal anomalies, and rock rheology. Temperatures of hot soils remained stable with respect to the last survey. Anhydrous gas compositions were mainly CO2 (96-99%) and H2S (0.2-3.9%), with no SO2 detected.
Geologic Background. Ring-shaped Deception Island, at the SW end of the South Shetland Islands, NE of Graham Land Peninsula, was constructed along the axis of the Bransfield Rift spreading center. A narrow passageway named Neptunes Bellows provides an entrance to a natural harbor within the 8.5 x 10 km caldera that was utilized as an Antarctic whaling station. Numerous vents along ring fractures circling the low 14-km-wide island have been reported active for more than 200 years. Maars line the shores of 190-m-deep Port Foster caldera bay. Among the largest of these maars is 1-km-wide Whalers Bay, at the entrance to the harbor. Eruptions during the past 8,700 years have been dated from ash layers in lake sediments on the Antarctic Peninsula and neighboring islands.
Information Contacts: A. Garcia, M. Astiz, and M. T. Villeguas, Depto. Volcanolog¡a, Museo Nacional de Ciencias Naturales, C.S.I.C. José Gutierrez Abascal 2, 28006 Madrid, Spain; J.M. Ibañez, J. Norales, and E Carmona, Instituto Andaluz de Geofísica, Apartado 2145, University of Granada, Granada, Spain; A. Caselli, G. Badi, and A. Baraldo, Instituo Antártico Argentino, Cerrito 1248, Buenos Aires, Argentina.
Kilauea (United States) — April 1997 Cite this Report
Kilauea
United States
19.421°N, 155.287°W; summit elev. 1222 m
All times are local (unless otherwise noted)
Lava issuing from three sites; Pu`u `O`o lava lake 20 m from W crater rim
Between 8 and 21 April, lava continued to issue in a steady stream from a vent on the W flank of Pu`u `O`o that began erupting on 28 March 1997 (BGVN 22:03). This vent formed during episode-51 vent and sits on a broad shield, also constructed during that episode. The 8-21 April flows mainly advanced S and either remained at the surface as sluggish moving lobes or collected in terraced pools and pits that fed into pre-existing tubes. On 13 April, a spatter cone began to build and by 21 April had reached a height of 15 m above the shield (figure 108).
By 15 April, flows emitted at elevations of ~685-705 had ceased to spread. A flow emitted near 685 m stagnated within 1 km of a steep escarpment (pali) that slopes downward to the coast.
On 17 April, lava issued from the S flank of Pu`u `O`o 270 m downslope from the active spatter cone. This lava flowed in a channel to the SE; advancing at 1 m/minute, it became 3 km long flowing as pahoehoe upslope and aa downslope. This lava's source remained ambiguous; magma at the nearby spatter cone could have traveled to the new discharge point, or it may have traveled from a deeper origin beneath the Pu`u `O`o area.
Between 22 April and 5 May lava issued from three sites: 1) a sluggish spatter cone within the Pu`u `O`o crater; 2) a more robust spatter cone on the SW flank of the Pu`u `O`o cone (figure 108); and 3) an uplifted mound of lava and tephra on the S flank Pu`u `O`o. The first site discharged pahoehoe flows onto the crater floor. Also, the level of the lava lake in the Pu`u `O`o crater was within 20 m of the low point on the W rim. Although the previous low point on the crater rim was the N spillway, since the 30 January collapse (BGVN 22:01) the W rim has remained the low point (figure 108).
Pahoehoe and aa lava flows from the latter two sites continued to mantle an area within 2 km of Pu`u `O`o. The second site, the spatter cone on the SW flank, issued low-level fountains and draped enough thick sheets of molten lava onto the cone to generate small flows that oozed outward. Periodically, this fountaining became more vigorous than typically seen. Spectacular footage of this fountaining appeared on television newscasts; unfortunately, in some cases the fountaining was incorrectly described as marking a fundamental change in Kīlauea's volcanic activity. Both fountaining and lava flows are characteristic of this particular cone.
The third site, informally called "the uplift" by HVO, formed early in episode 55 (BGVN 22:04) when crusted lava flows were pressed against the flank of Pu`u `O`o and pushed a large wad of tephra upward by 3-4 m. A near-constant stream of lava issued from the uplift; it passed onto the flow field and in many cases it commonly ponded behind its own flow front to form broad pools. Once ponded, the lava generally drained SE forming a complex field of aa lava.
Shallow, long-period summit earthquakes peaked during and shortly after the episode-54 eruption on 30 January (BGVN 22:01) and have since continued to decrease (figure 109). Between 8 April and 5 May, eruption tremor along the E rift zone had amplitudes between background and 3x background. For example, at 0346 on April 16, tremor amplitudes decreased to background levels for over an hour. At about 1900 on 24 April, there were bursts of high tremor that lasted nearly six hours. Around 1700 on 25 April tremor amplitudes dropped to very low levels for several hours. Continuous high tremor was recorded at about 0100 on 28 April, and by about 0001 on 3 May, tremor had dropped to near background levels for ~5 hours.
Thirteen episodes of deep tremor occurred from the usual source to the SW. Amplitudes ranged from very low to very high. The two largest tremors occurred during 0400-0448 on 24 April and 1543-1631 on 25 April.
Kīlauea is one of five coalescing volcanoes that comprise the island of Hawaii. Historically its eruptions originate primarily from the summit caldera or along one of the lengthy E and SW rift zones that extend from the summit caldera to the sea. This latest Kīlauea eruption began in January 1983 along the E rift zone. The eruption's early phases, or episodes, occurred along a portion of the rift zone that extends from Napau Crater on the uprift (towards the summit) end to ~8 km E on the downrift (towards the sea) end. Activity eventually centered on what was later named Pu`u `O`o. Between January 1983 and December 1996, erupted lava totaled ~1.45 km3.
Geologic Background. Kilauea overlaps the E flank of the massive Mauna Loa shield volcano in the island of Hawaii. Eruptions are prominent in Polynesian legends; written documentation since 1820 records frequent summit and flank lava flow eruptions interspersed with periods of long-term lava lake activity at Halemaumau crater in the summit caldera until 1924. The 3 x 5 km caldera was formed in several stages about 1,500 years ago and during the 18th century; eruptions have also originated from the lengthy East and Southwest rift zones, which extend to the ocean in both directions. About 90% of the surface of the basaltic shield volcano is formed of lava flows less than about 1,100 years old; 70% of the surface is younger than 600 years. The long-term eruption from the East rift zone between 1983 and 2018 produced lava flows covering more than 100 km2, destroyed hundreds of houses, and added new coastline.
Information Contacts: Hawaiian Volcano Observatory (HVO), U.S. Geological Survey, PO Box 51, Hawaii National Park, HI 96718, USA (URL: https://volcanoes.usgs.gov/observatories/hvo/); Steve O'Meara, PO Box 218, Volcano, HI 96785, USA.
Langila (Papua New Guinea) — April 1997 Cite this Report
Langila
Papua New Guinea
5.525°S, 148.42°E; summit elev. 1330 m
All times are local (unless otherwise noted)
Fluctuating activity, with variable March and April plumes
Although visibility was limited by a cyclonic depression during much of March, on the 22nd an ash plume rose to 3 km. Then, during the first ten days of April a brief lull took place as Crater 2 typically issued moderate volumes of white vapor and produced isolated weak explosions.
Between 11 and 16 April, ash emissions became more frequent. During 17-20 April, emissions consisted of continuous, thick pale brown to dark gray clouds. For the remainder of the month the emissions occasionally consisted of thin to thick ash of pale brown to pale gray color.
Crater 3 exhibited weak fumarolic activity in April. The seismographs were inoperative during March and April.
Geologic Background. Langila, one of the most active volcanoes of New Britain, consists of a group of four small overlapping composite basaltic-andesitic cones on the lower E flank of the extinct Talawe volcano in the Cape Gloucester area of NW New Britain. A rectangular, 2.5-km-long crater is breached widely to the SE; Langila was constructed NE of the breached crater of Talawe. An extensive lava field reaches the coast on the N and NE sides of Langila. Frequent mild-to-moderate explosive eruptions, sometimes accompanied by lava flows, have been recorded since the 19th century from three active craters at the summit. The youngest and smallest crater (no. 3 crater) was formed in 1960 and has a diameter of 150 m.
Information Contacts: B. Talai, H. Patia, D. Lolok, P. de Saint Ours, and C. McKee, RVO.
Manam (Papua New Guinea) — April 1997 Cite this Report
Manam
Papua New Guinea
4.08°S, 145.037°E; summit elev. 1807 m
All times are local (unless otherwise noted)
Outburst on 6 April sends ash clouds to 1 km
A brief period of heightened emissions took place at South Crater in early April. Following several days of weak vapor emission only occasionally containing a little ash, on 6 April the crater continuously discharged thick gray ash clouds that rose to ~1 km above the summit. The emission was accompanied by roaring sounds heard at 5- to 10-minute intervals. At night incandescent lava fragments were ejected hundreds of meters above the summit. Similar activity persisted over the following two days although at a slightly reduced intensity.
South Crater emissions weakened significantly after 9 April and then waned through the remainder of the month. Crater glow was seen on most nights until 20 April. Emissions typically contained ash until 21 April. During the rest of the month the only emissions at South Crater consisted of gentle, weak to moderate, white vapors.
Main Crater produced only white vapor during the first five days of April and then began emitting weak to moderate amounts of ash on many days, particularly in the last week of April. Weak to very weak crater glow was seen on two nights (1 and 12 April).
As of 22 May, the seismic records for the first three weeks of April had not yet been analyzed. Seismicity in the last week of April was weak to moderate with ~300-800 low-frequency earthquakes/day. Seismic amplitudes were low. Measurements from the water-tube tiltmeters 4 km SW of the summit lacked any apparent trend.
Geologic Background. The 10-km-wide island of Manam, lying 13 km off the northern coast of mainland Papua New Guinea, is one of the country's most active volcanoes. Four large radial valleys extend from the unvegetated summit of the conical basaltic-andesitic stratovolcano to its lower flanks. These valleys channel lava flows and pyroclastic avalanches that have sometimes reached the coast. Five small satellitic centers are located near the island's shoreline on the northern, southern, and western sides. Two summit craters are present; both are active, although most observed eruptions have originated from the southern crater, concentrating eruptive products during much of the past century into the SE valley. Frequent eruptions, typically of mild-to-moderate scale, have been recorded since 1616. Occasional larger eruptions have produced pyroclastic flows and lava flows that reached flat-lying coastal areas and entered the sea, sometimes impacting populated areas.
Information Contacts: B. Talai, H. Patia, D. Lolok, P. de Saint Ours, and C. McKee, RVO.
Okmok (United States) — April 1997 Cite this Report
Okmok
United States
53.43°N, 168.13°W; summit elev. 1073 m
All times are local (unless otherwise noted)
Activity waning by month's end
The activity that began on 13 February continued through the first half of May, but appeared to be waning by month's end. Prior to 9 May, hot lava flows were observed within the caldera. Also, satellite imagery revealed thin low-level ash plumes. Activity was continuing at a relatively low level on 16 May. By 23 May, satellite images contained no signs of activity or hotspots. Okmok is not monitored seismically.
Geologic Background. The broad, basaltic Okmok shield volcano, which forms the NE end of Umnak Island, has a dramatically different profile than most other Aleutian volcanoes. The summit of the low, 35-km-wide volcano is cut by two overlapping 10-km-wide calderas formed during eruptions about 12,000 and 2050 years ago that produced dacitic pyroclastic flows that reached the coast. More than 60 tephra layers from Okmok have been found overlying the 12,000-year-old caldera-forming tephra layer. Numerous satellitic cones and lava domes dot the flanks of the volcano down to the coast, including 1253-m Mount Tulik on the SE flank, which is almost 200 m higher than the caldera rim. Some of the post-caldera cones show evidence of wave-cut lake terraces; the more recent cones, some of which have been active historically, were formed after the caldera lake, once 150 m deep, disappeared. Hot springs and fumaroles are found within the caldera. Historical eruptions have occurred since 1805 from cinder cones within the caldera.
Information Contacts: Alaska Volcano Observatory (AVO).
Popocatepetl (Mexico) — April 1997 Cite this Report
Popocatepetl
Mexico
19.023°N, 98.622°W; summit elev. 5393 m
All times are local (unless otherwise noted)
Ash ejections send ash above 4 km altitude and cause ashfalls
A series of non-technical reports covering the volcano's behavior during the interval 20 March to 30 April are summarized in table 5. During this interval the hazard alert remained at yellow on a scale that encompasses the categories green (low), yellow, and red (high). The summaries documented a pattern of isolated explosions and occasional type-A seismic events.
Table 5. Summary of non-technical reports describing activity at Popocatépetl, 20 March-7 April 1997. The alert status remained moderate (yellow) during this entire interval. Courtesy of Roberto Quaas, CENAPRED-UNAM.
| Report Date |
Comment |
| 20 Mar 1997 |
After 12 hours of seismic quiescence, at 1020 on 20 March a 7-minute- long emission sent ash to 4 km altitude. Tephra fell NE and was reported as far as 18 km from the volcano. |
| 31 Mar 1997 |
The level of activity remained low; only small A-type events were detected (up to M 3 on 30 March). During 26 to 31 March the average number of low-level emissions per day decreased from 12 to 2. |
| 07 Apr 1997 |
A-type events were recorded sporadically; the largest occurred on 6 April (M 2.9 and 2.7). Emissions were infrequent and of moderate intensity. |
| 11 Apr 1997 |
No more A-type events were recorded; activity was reduced to low-intensity exhalations. |
| 16 Apr 1997 |
Slight increase in activity since 11 April, with a few small A-type earthquakes recorded. Low-intensity exhalations. |
| 21 Apr 1997 |
Activity decreased starting on 19 April; however, the lava body inside the crater kept growing slowly. |
| 25 Apr 1997 |
Microseismicity increased slightly on 23 April and at 1226 on 24 April a 15- minute explosive eruption sent an ash plume 4 km above the summit. Another smaller emission followed within 30 minutes. The wind carried the plume E. Activity decreased again on 25 April. |
| 28 Apr 1997 |
Sporadic emissions of variable intensity. The largest on 26 April blew E and deposited ash. |
| 29 Apr 1997 |
Major explosive eruption at 0110, followed by minor ones at 0122, 0159, and 0407. The first event caused ashfalls E of the volcano. Incandescent material was observed in the proximity of the volcano. |
| 30 Apr 1997 |
Activity decreased; the last ejection occurred at 1131. Variable-intensity white-to-yellow fumarolic emissions. |
Three large explosions on 20 March and 24 and 29 April sent ash up to 4 km above the summit and caused tephra-falls on the NE slopes of the volcano.
The Satellite Analysis Branch of NOAA (SAB) conveyed several messages about the ash plume of April 24. The plume was seen in visible imagery moving E; one hour after the eruption started the plume was 65 km long and 8 km wide at an estimated height below 13 km. The plume remained visible in multi-spectral (MS) imagery for most of the following day, when a wedge-shaped ash cloud (maximum width at the leading edge reached 148 km) was moving NE at 100 km/hour at an altitude of ~6-8 km.
During the following weeks press agencies reported a major increase in activity. A sensationalistic Reuters news report described as "one of its most intense eruptions" of the past three years took place on the late evening of 11 May, with ash fall as far away as Veracruz city, 280 km E of the volcano.
On 27 May a message from a United Airlines flight noted ash moving ENE at ~13.3 km altitude, presumably related to another explosion. Visible satellite imagery the same day confirmed the presence of ash reaching the Gulf of Mexico and convective debris N and W of the summit.
Geologic Background. Volcán Popocatépetl, whose name is the Aztec word for smoking mountain, rises 70 km SE of Mexico City to form North America's 2nd-highest volcano. The glacier-clad stratovolcano contains a steep-walled, 400 x 600 m wide crater. The generally symmetrical volcano is modified by the sharp-peaked Ventorrillo on the NW, a remnant of an earlier volcano. At least three previous major cones were destroyed by gravitational failure during the Pleistocene, producing massive debris-avalanche deposits covering broad areas to the south. The modern volcano was constructed south of the late-Pleistocene to Holocene El Fraile cone. Three major Plinian eruptions, the most recent of which took place about 800 CE, have occurred since the mid-Holocene, accompanied by pyroclastic flows and voluminous lahars that swept basins below the volcano. Frequent historical eruptions, first recorded in Aztec codices, have occurred since Pre-Columbian time.
Information Contacts: Roberto Meli, Roberto Quaas Weppen, Servando De la Cruz-Reyna, Alejandro Mirano, Bertha López Najera, and Alicia Martinez Bringas, Centro Nacional de Prevencion de Desastres (CENAPRED); NOAA/NESDIS Satellite Analysis Branch (SAB), USA; Reuters.
Rabaul (Papua New Guinea) — April 1997 Cite this Report
Rabaul
Papua New Guinea
4.2459°S, 152.1937°E; summit elev. 688 m
All times are local (unless otherwise noted)
Typical eruptive behavior and plumes up to 7 km altitude
Another phase of strong Strombolian eruptions took place at Tavurvur in April. There were both gas-rich explosions and a small but complex lava flow on the upper S flank of the cone. The lead-up to these eruptions was characterized by episodes of relatively gas-rich, low-pressure vapor emissions punctuated by occasional moderate to large explosions. The explosions seemed to increase in strength from late March to early April. One of the largest explosions took place on 28 March and its cloud rose ~4.3 km above the vent. One on 5 April rose ~5.3 km.
In early- to mid-April Tavurvur displayed a variety of notable eruptive phenomena: odd-colored gases, unusual lava-venting styles, a small pyroclastic flow, and the ejection of very large bombs. The water-tube tiltmeter at Sulphur Creek (3.5 km from Tavurvur) showed inflation at a rate of 0.4 µrad/day in the direction of Tavurvur until about 8 April when a reversal occurred.
COSPEC measurements indicated low outputs of SO2, 100-200 metric tons/day (t/d) following the higher output of the mid-March eruption (BGVN 22:03). During 29 March-2 April, briefly elevated SO2 outputs (400-600 t/d) were measured. There was a decline in SO2 flux in early April, reaching a low of 220-370 t/d when measurements ceased on 8 April. Unfortunately, the COSPEC was removed from Rabaul at a critical time, denying the opportunity to monitor SO2 during the subsequent eruptive cycle.
Small swarms of low-frequency earthquakes preceded several of the 9-12 April explosions. An explosion on 10 April ejected a plume that may have risen as high as 7 km, and generated small pyroclastic flows on Tavurvur's upper flanks. Heavy ballistic fallout on the N flank also triggered a small landslide.
Eruption of 12 April. At 0829 on 12 April a Strombolian eruption was accompanied by a strong explosion. This explosion generated a very dense and dark ash cloud. Part of the ash cloud may have been projected at a low angle eastward, or alternately, the E part of the eruption column may have collapsed. In any case, the end result was the generation of a small pyroclastic flow on Tavurvur's E flank. A very dense, dark ash fall-out cloud hung over the area NE of Tavurvur until about 1000 on 12 April. About this time, the ash content of emissions dropped markedly.
During this episode, from about 0830 the RSAM level rose very sharply, peaking at 1000 at about 850 RSAM units. The seismicity remained at this level until about 1100 when it started to decline.
At 1030, nearby observers saw ejecta that looked incandescent and quite fluid. Accompanying explosions repeated at intervals of 1 second or less. The maximum height reached by ballistic ejecta was a little over 1 km. Some of the ejecta were tens of meters across. Orange gas clouds of unknown composition accompanied some explosions.
From about 1130 it seemed as though lava collecting in the crater had risen, although no lava flow had commenced. By about 1200 strong fumes escaped from Tavurvur's upper S flank, which began to bulge outward. Incandescence was seen occasionally on the flank as chunks of the bulging part of the cone tumbled downslope. At 1215 a breach in the S rim of the crater developed in an area that had been undermined by the subsurface passage of lava. Black lava without visible incandescence was moving down the S flank at 1218. By 1226, a broad flow-front (several hundred meters wide) reached a mound about half-way down the S flank. Soon after, by 1229, a W lobe developed.
At 1236 on 12 April, following 1-2 minutes of silence, a lava fountain rose rapidly several tens of meters above the crater. It then expanded at its top, forming a large ball of lava ~50 m across. The lava ball then exploded, showering the S flank with huge clots of brightly incandescent lava. A similar event followed at 1245 when a large mound of lava (50 m across) rose rapidly in the crater before exploding.
During the early afternoon, the multi-lobed front of the slowly descending lava flow headed mostly S and W. No incandescence could then be seen in the frontal parts of the flow, but weak incandescence was visible in the 20- 30 m channel through the breach in the S rim of the summit crater. Observers first saw an E lobe at about 1420, but it had certainly developed prior to that time.
An aviation report around 1335 on 12 April (issued by Darwin VAAC) described an ash cloud to 4 km that was "pale gray and low in ash content." The report also noted that ash clouds blew NE and satellite imagery lacked clear evidence of an ash cloud. At 2123 the Rabaul Volcano Observatory issued a warning to aviators that "a large ash column was ejected forcefully up to several kilometers."
During the early afternoon there was a gradual decline in seismicity, although some individual explosions accompanied very strong signals. By 1800 the RSAM level had dropped to about 640 RSAM units.
The night-time activity on 12 April remained spectacular even though the strength of the eruption had markedly declined. A particularly large bubble of lava formed in the crater at 1816 and shattered, causing a brilliant shower of incandescent ejecta, accompanied by a loud cracking detonation. Many similar explosions occurred through the night but none was as large or as bright as the one at 1816.
The outline of the new lava flow was difficult to see when viewed from ~1 km away on the night of 12 April. Only the part of the flow front on the S flank remained incandescent, and it lacked detectable movement.
Although there were occasional, powerful explosions through the night of 12 April, an overall decline in eruptive and seismic activity continued. At about 1000 on 13 April, seismicity reached a low of about 150 RSAM units. Strong explosions continued through the 13th, but they took place less frequently than they had previously. A key feature of the explosions was the very low ash content in emission clouds. Fluid or plastic incandescent ballistic lava fragments were the principal solid products from the explosions. The gas component was a white to pale gray fume emitted in moderate to large quantities.
The vigor of Tavurvur's outbursts gradually declined through the remainder of the month. Crater glow was still present at month's end.
Post-eruptive activity and observations. Strong, caldera-wide harmonic tremor was a significant feature of the post-Strombolian activity. Commonly, a pulsing and roaring noise accompanied the tremor; the noise suggested that the tremor may have been linked to a near-surface degassing process. On many occasions a large explosion took place followed by a prolonged period of degassing and tremor. There were instances, however, when tremor would commence without an attendant explosion and audible sounds. Tremor mostly ceased by 24 April, but isolated periods still occurred at the month's end.
In contrast to earlier Strombolian eruptions at Tavurvur, tiltmeter readings at Sulphur Creek lacked offset, an observation that appeared consistent with this eruption's relatively small volume. By late April there was evidence from the Sulphur Creek tiltmeter that inflation of the Tavurvur area had resumed, presumably in conjunction with a possible forthcoming Strombolian eruption.
Inspections on the E, N, and S sides of Tavurvur revealed abundant "cow-dung" lava bombs. The largest one seen had landed ~1 km from the vent and measured ~8-9 m across. The lava had obviously been very fluid, and after impact the bomb displayed delicate surface features. No fine ash-fall deposit was found around Tavurvur's base. This was consistent with the absence of ash in the emissions from about 1000 on 12 April, yet the early part of the eruption generated much ash. A search for deposits from the pyroclastic flows found only a light dusting of very fine gray ash in a gully at Tavurvur's NE foot.
The lava flow produced in this eruption differed slightly from the earlier flows seen in October 1996, and January and March 1997. The April flow was ~3-4 m thick (compared to earlier flows that were 4-5 m thick). The most recent flows only covered a relatively small area (105 m2, compared to 106 m2 for each of the earlier flows).
Inspection on 23 April revealed that the E lobe of the flow actually overrode the E margin of the initial flow. Thus, part of the April flow was compound and in this respect unlike the simple flows of the earlier eruptions.
Analysis of one sample from the 12 April eruption indicated a significant change in lava chemistry. The April sample was an andesite having ~59% SiO2 and 4.4% MgO. In comparison, the 1994-95 samples had the compositions of high-silica andesites to low-silica dacites. As with earlier samples, the April one showed evidence of mixing of the caldera's resident dacite with a basalt.
Geologic Background. The low-lying Rabaul caldera on the tip of the Gazelle Peninsula at the NE end of New Britain forms a broad sheltered harbor utilized by what was the island's largest city prior to a major eruption in 1994. The outer flanks of the asymmetrical shield volcano are formed by thick pyroclastic-flow deposits. The 8 x 14 km caldera is widely breached on the east, where its floor is flooded by Blanche Bay and was formed about 1,400 years ago. An earlier caldera-forming eruption about 7,100 years ago is thought to have originated from Tavui caldera, offshore to the north. Three small stratovolcanoes lie outside the N and NE caldera rims. Post-caldera eruptions built basaltic-to-dacitic pyroclastic cones on the caldera floor near the NE and W caldera walls. Several of these, including Vulcan cone, which was formed during a large eruption in 1878, have produced major explosive activity during historical time. A powerful explosive eruption in 1994 occurred simultaneously from Vulcan and Tavurvur volcanoes and forced the temporary abandonment of Rabaul city.
Information Contacts: B. Talai, H. Patia, D. Lolok, P. de Saint Ours, and C. McKee, Rabaul Volcano Observatory (RVO), P.O. Box 386, Rabaul, Papua New Guinea; Bureau of Meteorology, Northern Territory Regional Office, P.O. Box 735, Darwin, NT 0801 Australia.
Soufriere Hills (United Kingdom) — April 1997 Cite this Report
Soufriere Hills
United Kingdom
16.72°N, 62.18°W; summit elev. 915 m
All times are local (unless otherwise noted)
Pyroclastic flows over Galway's Wall reach 500 m from the shore
The following summarizes the visual observations of Stephen O'Meara on 2 April, NOAA/NESDIS satellite observation reports for April, and the weekly Scientific Reports of the Montserrat Volcano Observatory for the period 6 April-10 May 1997. For a map showing the locations of the places mentioned in this report see this BGVN 22:02. An article on the ongoing activity in Montserrat was published in April on Science magazine.
Visual observations. On 2 April O'Meara flew over Montserrat in a small chartered aircraft at an altitude of ~ 3 km. As he approached from the NE around 1050, with good views of the new delta (figures 20 and 21), the volcano was sending light-gray ash-and-steam clouds up to 4 km. Light-brown material covered much of the pyroclastic deposits in the Tar River Valley, while the delta itself retained a weak mantle of grayish ash. Light veils of ash originating from near Farrell's Wall fell to the N, discoloring a kilometer-long channel. Despite ash and clouds covering most of the summit (except for the E section of the dome), boulders could be seen falling down the NE, E, and SE sides, leaving trails of grayish dust.
A reddish-gray ash that obscured about two-thirds of SW Montserrat was slowly blown toward Plymouth. By the time the aircraft started circling the island again, activity had picked up substantially. A vent on the E side of the dome shot tall columns of ash and steam at a 45° angle to the N, and another vent in the direction of Galway's Wall sent a similarly angled plume of ash and steam to the SW. Within 10 minutes a pyroclastic flow originating in the breach at Galway's Wall went down the White River valley. The comparatively slow moving flow had a curved front trailed by tall convecting ash clouds.
On 6 April MVO reported that coarse rockfall debris had completely filled the chute carved by pyroclastic flows during the Easter collapse. The debris resembled a talus slope ~100 m wide and dipping at 50°. In the center of the scarp between the two peaks, observers saw vigorous degassing and milky, ash-laden steam jets.
A survey of the dome on the same day using both GPS and laser range finding binocular showed that the steep headwall representing the active face of the new lobe was then 100 m high, 150 wide, and dipping 60° (i.e. 10 m higher and 30 m wider, but 20° less steep than on 3 April). In a 3-day period the dome's elevation decreased from 968 m to 950 m and at the headwall the dome had also advanced S by about 20 m toward the top of the chute. In contrast, the N peak of the January dome remained at ~965 m elevation, but it appeared more fractured.
A dome collapse on 11 April sent pyroclastic flows ~500 m farther than any previous flows down the White River valley on the volcano's S flank. The flows stopped ~500 m before reaching the seashore at O'Garra's. The deposits in the valley completely buried the Great Alp Falls. Two distinct flow paths developed in the area around the Galway's Soufriere: 1) a main channel in the White River valley itself, and 2) a path over flat ground W of the main valley and then back into the main valley at a point half way along it. In the upper half of the valley surge clouds covered the topography with deposits.
Observations after 11 April revealed that collapses had eaten away another 100 m of pre-September material on the dome's SW side. The lobe built up again, rapidly replacing the material lost.
Satellite imagery on 12 April indicated a low-level (3 km) ash plume reaching as far as 75 km W of the volcano. Maximum width of the visible plume was 15 km at 40 km from the summit. The day after the plume was still extended 95 km WNW from the volcano. A maximum width of 25 km was measured at 75 km from the summit.
A GPS/laser binocular survey conducted on 15 April showed that the S dome's summit, then at 947 m, continued to slowly decrease in elevation. The maximum size of the lobe was calculated at ~ 0.9 x 10⁶ m3, but no change was detected for the N summit. The most noticeable change in the S region was an increase in the width of the lobe to ~180 m. Most of this expansion had occurred on its W side, and fresh material was encroaching on the remains of the September scar. To the E, the edge of the lobe was now against the Easter collapse scar. Shortly after 15 April the smooth surface of the lobe became increasingly fractured, allowing gas to be emitted from it. Gas and ashy steam was also emitted from the saddle between the dome's summits. Until the end of April the chute over the Galway's Wall continued to widen and fill slowly. The material eroded from the base of the chute by the 11 April collapse was being replaced by short-runout rockfalls and small pyroclastic flows. The soufriere area also continued to be filled by pyroclastic-flow deposits that didn't progress much farther.
Volume estimates in the White River area showed that that the rockfall and pyroclastic-flow activity had deposited 2.3 x 10⁶ m3 of material on 2 April and 2.1 x 10⁶ m3 more by 15 April (values given as Dense Rock Equivalents). These values have helped to constrain the magma extrusion rate at 4.6 m3 /s after the 11 April collapse, in agreement with other field observations.
Ash clouds from pyroclastic flows and rockfalls were detected both in visible and infrared imagery from 24 to 27 April, drifting NW and WSW at ~1 km altitude.
During brief breaks in the weather on 2, 3 and 5 May there was evidence of continued pyroclastic flows and dome growth above Galway's Wall, S of the dome. Most of the dome was visible from the Tar River Estate House on 8 May. Rockfalls were heard from the S side of the Tar River valley, and several large blocks bounced toward Perches Mountain.
No major changes were seen on the E face of the dome during the entire observation period. Several fumaroles were present but only very small rockfalls were noted from the N and E flanks of the dome.
Seismicity. Seismic activity was low until the dome collapse on 11 April. The collapse began with sustained low-amplitude signals. Two pulses of high-intensity activity were recorded at 1107 and 1155, respectively; the second one lasted 15 minutes. A short, high-amplitude signal was recorded as a pyroclastic flow traveled down the lower reaches of the White River valley. Fifteen hours after the end of the pyroclastic-flow activity a short-lived hybrid earthquake swarm took place. During 23-26 April, rockfall activity reached the highest event counts recorded since the beginning of the year. The largest signals were associated with small pyroclastic flows over the Galway's Wall. For the remainder of the month most of the seismicity dropped to a low level, dominated by rockfalls and long-period earthquakes. The number of long-period earthquakes remained high, though, and on a daily basis 40 to 100% of them triggered rockfalls.
A swarm of 28 shallow (2.4-3.6 km below the crater) volcano-tectonic earthquakes occurred on 7-8 May. During the swarm, the level of rockfall and long-period earthquake activity dropped, only to rise to previous levels when the swarm ended. This anti-correlation pattern between hybrid or volcano-tectonic swarms and rockfalls was observed many times before at this volcano, but had been absent since the explosion in September 1996.
Ground deformation. Survey measurements of the W triangle (Lower Amersham Upper Amersham Chance's Peak) continued to show a very slow shortening of the slant distances. There was indication of very slow subsidence of the two target sites relative to the instrument site at Lower Amersham. This trend was also detected during earlier occupations and seemed to reflect the removal of magma at depth below the volcano.
A long GPS occupation of the sites at Harris Lookout (M18) and the site on the crater rim above Farrell's Yard (FT3) was performed on 6 April. The recent outward movement of the FT3 site (BGVN 22:03) away from the dome appeared to have stopped. However an occupation of the Long Ground-Whites-M18 and Harris Lookout-Windy Hill-Farrell's triangles on 16 April using both the GPS and EDM techniques detected slow movement of the Farrell's site away from the crater toward the NNW. The baseline to Harris had shortened by 4 cm since last June. Further occupations at sites on the crater wall close to the dome with a fixed point at M18 Harris Lookout recorded significant movement of the crater rim close to the lava dome complex. These movements, radially outward from the dome, diminished with distance.
An EDM occupation of the N triangle (Windy Hill Farrell's St. George's Hill) on 15 April showed a 40-mm shortening of the Windy Hill Farrell's slant distance since 2 April. This apparent major change, however, was likely affected by atmospheric conditions. A subsequent occupation on 18 April indicated that the Windy Hill Farrell's slant distance had increased by 22 mm in three days. Later occupations during this report period confirmed slow continuous outward and downward movement of the Farrell's target.
Measurements of the cracks on Chance's Peak and on the E side of the Galway's Wall were carried out on 28 April and 3 May, respectively. The Chance's Peak crack recorded 6 mm of extension and 7 mm of dextral shear since 6 April. The crack on the E side of Galway's Wall opened a few millimeters and underwent a total 25 mm of sinistral shear since late March. These measurements suggested that the area between the cracks, which contains the remains of Galways, wall was moving slowly to the SSW, away from the dome.
COSPEC and other measurements. SO2 values recorded on 7 and 11 April were 223 and 1524 t/d, respectively. The latter value, measured immediately after the collapse over the Galway's Wall, was one of the highest ever measured at the Soufriere Hills Volcano. Results from SO2 diffusion tubes collected on 23 March and 6 April (table 17) showed a return to the levels of the past few months, within the recommended limits for occupation or habitation in these areas. The Whites Landfill site on the NE side of the volcano had no detectable sulfur dioxide.
Table 17. Sulfur dioxide diffusion tube results at Soufriere Hills for 23 March and 6 April 1997. Concentrations are in ppb.
| Location |
23 Mar 1997 |
06 Apr 1997 |
| Upper Amersham |
45.10 |
31.05 |
| Lower Amersham |
17.70 |
11.90 |
| White Landfill |
0.00 |
1.4 |
| Police HQ, Plymouth |
8.05 |
5.1 |
| Weekes |
0.00 |
0.00 |
| Control |
0.00 |
0.00 |
Some analyses of rain water samples collected at various locations from 31 March to 11 May appear in table 18. The rainwater continues to be highly acidic and certain anions are present in high concentrations, but well within World Health Organization guidelines.
Table 18. Rain and surface water geochemistry at Soufriere Hills for 31 March, 12 and 29 April, and 11 May 1997. Courtesy of MVO.
| Date |
Location |
pH |
Conductivity (mS/cm) |
Total Dissolved Solids (g/l) |
Sulfates (mg/l) |
Chlorides (mg/l) |
Fluorides (mg/l) |
| 31 Mar 1997 |
Upper Amersham |
-- |
1.566 |
0.784 |
39 |
16.2 |
1.5 |
| 31 Mar 1997 |
Lower Amersham |
-- |
1.394 |
0.698 |
50 |
158 |
1.4 |
| 31 Mar 1997 |
Police HQ, Plymouth |
-- |
1.553 |
0.727 |
20 |
16.6 |
>1.5 |
| 31 Mar 1997 |
Weekes |
-- |
0.058 |
0.028 |
-- |
10.3 |
0.2 |
| 12 Apr 1997 |
Upper Amersham |
-- |
0.235 |
0.117 |
20 |
135.5 |
1.4 |
| 12 Apr 1997 |
Lower Amersham |
-- |
0.300 |
0.150 |
32 |
64.0 |
>1.5 |
| 12 Apr 1997 |
Police HQ, Plymouth |
-- |
0.243 |
0.121 |
-- |
28.5 |
>1.5 |
| 12 Apr 1997 |
Weekes |
-- |
0.112 |
0.055 |
3 |
20.0 |
0.55 |
| 29 Apr 1997 |
Upper Amersham |
2.60 |
1.902 |
0.953 |
0.60 |
-- |
-- |
| 29 Apr 1997 |
Lower Amersham |
2.90 |
1.166 |
0.584 |
>1.5 |
-- |
-- |
| 29 Apr 1997 |
Police HQ, Plymouth |
3.26 |
0.622 |
0.311 |
1.25 |
-- |
-- |
| 29 Apr 1997 |
Weekes |
5.21 |
0.223 |
0.111 |
1.20 |
54 |
8 |
| 11 May 1997 |
Upper Amersham |
2.69 |
1.525 |
0.764 |
0.85 |
166 |
37 |
| 11 May 1997 |
Police HQ, Plymouth |
2.98 |
-- |
-- |
-- |
-- |
-- |
| 11 May 1997 |
Weekes |
5.56 |
0.051 |
0.025 |
0.25 |
11.8 |
3 |
| 11 May 1997 |
Trials overflow |
7.78 |
0.776 |
0.388 |
0.4 |
103 |
38 |
Further Reference. Montserrat Volcano Observatory Team, 1997, The ongoing eruption in Montserrat: Science, v. 276 (5311), p. 371.
Geologic Background. The complex, dominantly andesitic Soufrière Hills volcano occupies the southern half of the island of Montserrat. The summit area consists primarily of a series of lava domes emplaced along an ESE-trending zone. The volcano is flanked by Pleistocene complexes to the north and south. English's Crater, a 1-km-wide crater breached widely to the east by edifice collapse, was formed about 2000 years ago as a result of the youngest of several collapse events producing submarine debris-avalanche deposits. Block-and-ash flow and surge deposits associated with dome growth predominate in flank deposits, including those from an eruption that likely preceded the 1632 CE settlement of the island, allowing cultivation on recently devegetated land to near the summit. Non-eruptive seismic swarms occurred at 30-year intervals in the 20th century, but no historical eruptions were recorded until 1995. Long-term small-to-moderate ash eruptions beginning in that year were later accompanied by lava-dome growth and pyroclastic flows that forced evacuation of the southern half of the island and ultimately destroyed the capital city of Plymouth, causing major social and economic disruption.
Information Contacts: Montserrat Volcano Observatory (MVO), c/o Chief Minister's Office, PO Box 292, Plymouth, Montserrat (URL: http://www.mvo.ms/); Stephen and Donna O'Meara Nature Stock, PO Box 218, Volcano, HI 96785, USA.
Vesuvius
Italy
40.821°N, 14.426°E; summit elev. 1281 m
All times are local (unless otherwise noted)
Low seismicity prevails after March-May 1996 earthquake swarm
During late 1996 through early 1997 Somma-Vesuvius remained volcanically quiet and characterized by low seismicity both in terms of energy and number of events.
A few episodes of moderate seismic activity have occurred in the last twenty years. The crisis of March-May 1996, characterized by an M 3.4 event (BGVN 21:08) was followed by a significant decrease of the seismic activity (figure 3). After the crisis, during June 1996-April 1997, 350 microearthquakes (maximum magnitude, 2.7) were recorded at the permanent seismic network of the Osservatorio Vesuviano. As has been typical in the past, foci appeared in a small volume below the crater area, rarely at depths below 6 km.
During January 1996-April 1997 the monthly temporal distribution of both earthquakes and their energy fluctuated, as had been the case in the past. The distribution of the cumulative strain release (figure 3) had its regular trend, disturbed only by the seismic crisis of March-May 1996. Both ground deformation and fumarolic gas composition data remained stable.
Geologic Background. One of the world's most noted volcanoes, Vesuvius (Vesuvio) forms a dramatic backdrop to the Bay of Naples. The active cone was constructed within a large caldera of the older Monte Somma edifice, thought to have formed incrementally beginning about 17,000 years ago. The Monte Somma caldera wall has channeled lava flows and pyroclastic flows primarily to the south and west. Eight major explosive eruptions have taken place in the last 17,000 years, often accompanied by large pyroclastic flows and surges, such as during the 79 CE Pompeii eruption. Intermittent eruptions since 79 CE were followed by a period of frequent long-term explosive and effusive eruptions between 1631 and 1944. The large 1631 eruption produced pyroclastic flows that reached as far as the coast and caused great destruction. Many towns are located on the flanks, and several million people live within areas that could be affected by eruptions.
Information Contacts: Lucia Civetta, Francesca Bianco, Giuseppe Vilardo, and Mario Castellano, Osservatorio Vesuviano, Via Manzoni 249, 80123 Napoli, Italy.
Villarrica
Chile
39.42°S, 71.93°W; summit elev. 2847 m
All times are local (unless otherwise noted)
Strombolian activity and lava in central pit; red glow returns at night
In October and November 1996, activity was characterized by a rapidly convecting lava lake that nearly filled the central crater pit (BGVN 21:12). Fountains were noted on the lake's surface and frequent bursts ejected spatter and incandescent bombs beyond the summit crater. In December, the magmatic column subsided and the characteristic nocturnal crater glow disappeared. During the first two weeks of January 1997, incandescent lava returned to the central pit (BGVN 21:12). The following summarizes observations made from mid- January through mid-March by volcano guides Victor Sepulveda and Lorena Morales and documentary film makers.
The volcano guides reported that between 15 and 19 January few observations of the crater were made because of strong fumarolic activity. On 21 January a clear view revealed that the crater was unchanged since 13 January (BGVN 21:12). That day two small ash emissions from the summit crater were seen from Pucon, ~ 17 km N. The cause of these emissions may have been a landslide in the E crater, detected on 27 January. On 3 February, the crater floor was partially covered with talus, but a small vent was actively degassing in the N part of the crater floor. Another significant collapse of the NE crater wall occurred sometime before 15 February. By 17 February, two vents on the NE side of the crater floor had small Strombolian eruptions and extruded incandescent lava onto the crater floor. On 22 February, small lava fountains on the NE side of the crater floor were actively filling the crater with lava.
On 24 February, the guides reported that the crater floor had risen by several meters and convection was occurring within the lava pond. The film crew noted that two red spots in the crater produced irregular Strombolian activity, gas emissions, and strong noises. The film crew also reported that strong sulfur emissions required them to wear gas masks while at the summit and that these emissions appeared to be extruded from vents at the ash-covered icefields on the upper terrace in the crater (figure 7, number 1).
During late February the film crew reported seeing a light red glow at night above Villarrica's summit crater. These reports were confirmed by the volcano guides report of residents in Pucon seeing the glow on 2 March following several months of absence.
The documentary film crew took a summit overflight on 2 March and reported a change in crater morphology due to the collapse of the S terrace (figure 7, number 2). When they returned to the summit on 5 March there were no further morphological changes in the crater and degassing appeared the same as on 24 February.
On 12 March, the volcano guides observed a light dusting of ash that covered the NE flank of the volcano. Strombolian explosions from a vent on the crater floor continued throughout the remainder of March.
Geologic Background. The glacier-covered Villarrica stratovolcano, in the northern Lakes District of central Chile, is ~15 km south of the city of Pucon. A 2-km-wide caldera that formed about 3,500 years ago is located at the base of the presently active, dominantly basaltic to basaltic-andesite cone at the NW margin of a 6-km-wide Pleistocene caldera. More than 30 scoria cones and fissure vents are present on the flanks. Plinian eruptions and pyroclastic flows that have extended up to 20 km from the volcano were produced during the Holocene. Lava flows up to 18 km long have issued from summit and flank vents. Eruptions documented since 1558 CE have consisted largely of mild-to-moderate explosive activity with occasional lava effusion. Glaciers cover 40 km2 of the volcano, and lahars have damaged towns on its flanks.
Information Contacts: Werner Keller, Wiesenstr. 8, 86438 Kissing, Germany; Boris Behncke, Geomar Research Center for Marine Geosciences, Wischhofstrasse 1-3, 24148 Kiel, Germany; Monika Steinmetz and Jürgen Kendzior, Carmanah Film and Fotodokumentationen, Klausenmühle 5, 64625 Bensheim, Germany.