Recently Published Bulletin Reports
Kadovar (Papua New Guinea) An ash plume and weak thermal anomaly during May 2023
San Miguel (El Salvador) Small gas-and-ash explosions during March and May 2023
Ebeko (Russia) Continued explosions, ash plumes, and ashfall during October 2022-May 2023
Home Reef (Tonga) Discolored plumes continued during November 2022-April 2023
Semisopochnoi (United States) Occasional explosions, ash deposits, and gas-and-steam plumes during December 2022-May 2023
Ambae (Vanuatu) New lava flow, ash plumes, and sulfur dioxide plumes during February-May 2023
Ibu (Indonesia) Daily ash explosions continue, along with thermal anomalies in the crater, October 2022-May 2023
Dukono (Indonesia) Continuing ash emissions, SO2 plumes, and thermal signals during October 2022-May 2023
Sabancaya (Peru) Explosions, gas-and-ash plumes, and thermal activity persist during November 2022-April 2023
Sheveluch (Russia) Significant explosions destroyed part of the lava-dome complex during April 2023
Bezymianny (Russia) Explosions, ash plumes, lava flows, and avalanches during November 2022-April 2023
Chikurachki (Russia) New explosive eruption during late January-early February 2023
Kadovar (Papua New Guinea) — June 2023  Cite this Report
Kadovar
Papua New Guinea
3.608°S, 144.588°E; summit elev. 365 m
All times are local (unless otherwise noted)
An ash plume and weak thermal anomaly during May 2023
Kadovar is a 2-km-wide island that is the emergent summit of a Bismarck Sea stratovolcano. It lies off the coast of New Guinea, about 25 km N of the mouth of the Sepik River. Prior to an eruption that began in 2018, a lava dome formed the high point of the volcano, filling an arcuate landslide scarp open to the S. Submarine debris-avalanche deposits occur to the S of the island. The current eruption began in January 2018 and has comprised lava effusion from vents at the summit and at the E coast; more recent activity has consisted of ash plumes, weak thermal activity, and gas-and-steam plumes (BGVN 48:02). This report covers activity during February through May 2023 using information from the Darwin Volcanic Ash Advisory Center (VAAC) and satellite data.
Activity during the reporting period was relatively low and mainly consisted of white gas-and-steam plumes that were visible in natural color satellite images on clear weather days (figure 67). According to a Darwin VAAC report, at 2040 on 6 May an ash plume rose to 4.6 km altitude and drifted W; by 2300 the plume had dissipated. MODIS satellite instruments using the MODVOLC thermal algorithm detected a single thermal hotspot on the SE side of the island on 7 May. Weak thermal activity was also detected in a satellite image on the E side of the island on 14 May, accompanied by a white gas-and-steam plume that drifted SE (figure 68).
Geologic Background. The 2-km-wide island of Kadovar is the emergent summit of a Bismarck Sea stratovolcano of Holocene age. It is part of the Schouten Islands, and lies off the coast of New Guinea, about 25 km N of the mouth of the Sepik River. Prior to an eruption that began in 2018, a lava dome formed the high point of the andesitic volcano, filling an arcuate landslide scarp open to the south; submarine debris-avalanche deposits occur in that direction. Thick lava flows with columnar jointing forms low cliffs along the coast. The youthful island lacks fringing or offshore reefs. A period of heightened thermal phenomena took place in 1976. An eruption began in January 2018 that included lava effusion from vents at the summit and at the E coast.
Information Contacts: Darwin Volcanic Ash Advisory Centre (VAAC), Bureau of Meteorology, Northern Territory Regional Office, PO Box 40050, Casuarina, NT 0811, Australia (URL: http://www.bom.gov.au/info/vaac/); Hawai'i Institute of Geophysics and Planetology (HIGP) - MODVOLC Thermal Alerts System, School of Ocean and Earth Science and Technology (SOEST), Univ. of Hawai'i, 2525 Correa Road, Honolulu, HI 96822, USA (URL: http://modis.higp.hawaii.edu/); Copernicus Browser, Copernicus Data Space Ecosystem, European Space Agency (URL: https://dataspace.copernicus.eu/browser/).
San Miguel (El Salvador) — June 2023 Cite this Report
San Miguel
El Salvador
13.434°N, 88.269°W; summit elev. 2130 m
All times are local (unless otherwise noted)
Small gas-and-ash explosions during March and May 2023
San Miguel in El Salvador is a broad, deep crater complex that has been frequently modified by eruptions recorded since the early 16th century and consists of the summit known locally as Chaparrastique. Flank eruptions have produced lava flows that extended to the N, NE, and SE during the 17-19th centuries. The most recent activity has consisted of minor ash eruptions from the summit crater. The current eruption period began in November 2022 and has been characterized by frequent phreatic explosions, gas-and-ash emissions, and sulfur dioxide plumes (BGVN 47:12). This report describes small gas-and-ash explosions during December 2022 through May 2023 based on special reports from the Ministero de Medio Ambiente y Recursos Naturales (MARN).
Activity has been relatively low since the last recorded explosions on 29 November 2022. Seismicity recorded by the San Miguel Volcano Station (VSM) located on the N flank at 1.7 km elevation had decreased by 7 December. Sulfur dioxide gas measurements taken with DOAS (Differential Optical Absorption Spectroscopy) mobile equipment were below typical previously recorded values: 300 tons per day (t/d). During December, small explosions were recorded by the seismic network and manifested as gas-and-steam emissions.
Gas-and-ash explosions in the crater occurred during January 2023, which were recorded by the seismic network. Sulfur dioxide values remained low, between 300-400 t/d through 10 March. At 0817 on 14 January a gas-and-ash emission was visible in webcam images, rising just above the crater rim. Some mornings during February, small gas-and-steam plumes were visible in the crater. On 7 March at 2252 MARN noted an increase in degassing from the central crater; gas emissions were constantly observed through the early morning hours on 8 March. During the early morning of 8 March through the afternoon on 9 March, 12 emissions were registered, some accompanied by ash. The last gas-and-ash emission was recorded at 1210 on 9 March; very fine ashfall was reported in El Tránsito (10 km S), La Morita (6 km W), and La Piedrita (3 km W). The smell of sulfur was reported in Piedra Azul (5 km SW). On 16 March MARN reported that gas-and-steam emissions decreased.
Low degassing and very low seismicity were reported during April; no explosions have been detected between 9 March and 27 May. The sulfur dioxide emissions remained between 350-400 t/d; during 13-20 April sulfur dioxide values fluctuated between 30-300 t/d. Activity remained low through most of May; on 23 May seismicity increased. An explosion was detected at 1647 on 27 May generated a gas-and-ash plume that rose 700 m high (figure 32); a decrease in seismicity and gas emissions followed. The DOAS station installed on the W flank recorded sulfur dioxide values that reached 400 t/d on 27 May; subsequent measurements showed a decrease to 268 t/d on 28 May and 100 t/d on 29 May.
Geologic Background. The symmetrical cone of San Miguel, one of the most active volcanoes in El Salvador, rises from near sea level to form one of the country's most prominent landmarks. A broad, deep, crater complex that has been frequently modified by eruptions recorded since the early 16th century caps the truncated unvegetated summit, also known locally as Chaparrastique. Flanks eruptions of the basaltic-andesitic volcano have produced many lava flows, including several during the 17th-19th centuries that extended to the N, NE, and SE. The SE-flank flows are the largest and form broad, sparsely vegetated lava fields crossed by highways and a railroad skirting the base of the volcano. Flank vent locations have migrated higher on the edifice during historical time, and the most recent activity has consisted of minor ash eruptions from the summit crater.
Information Contacts: Ministero de Medio Ambiente y Recursos Naturales (MARN), Km. 5½ Carretera a Nueva San Salvador, Avenida las Mercedes, San Salvador, El Salvador (URL: http://www.snet.gob.sv/ver/vulcanologia).
Ebeko
Russia
50.686°N, 156.014°E; summit elev. 1103 m
All times are local (unless otherwise noted)
Continued explosions, ash plumes, and ashfall during October 2022-May 2023
Ebeko, located on the N end of Paramushir Island in the Kuril Islands, consists of three summit craters along a SSW-NNE line at the northern end of a complex of five volcanic cones. Eruptions date back to the late 18th century and have been characterized as small-to-moderate explosions from the summit crater, accompanied by intense fumarolic activity. The current eruption period began in June 2022 and has recently consisted of frequent explosions, ash plumes, and thermal activity (BGVN 47:10). This report covers similar activity during October 2022 through May 2023, based on information from the Kamchatka Volcanic Eruptions Response Team (KVERT) and satellite data.
Activity during October consisted of explosive activity, ash plumes, and occasional thermal anomalies. Visual data by volcanologists from Severo-Kurilsk showed explosions producing ash clouds up to 2.1-3 km altitude which drifted E, N, NE, and SE during 1-8, 10, 16, and 18 October. KVERT issued several Volcano Observatory Notices for Aviation (VONA) on 7, 13-15, and 27 October 2022, stating that explosions generated ash plumes that rose to 2.3-4 km altitude and drifted 5 km E, NE, and SE. Ashfall was reported in Severo-Kurilsk (Paramushir Island, about 7 km E) on 7 and 13 October. Satellite data showed a thermal anomaly over the volcano on 15-16 October. Visual data showed ash plumes rising to 2.5-3.6 km altitude on 22, 25-29, and 31 October and moving NE due to constant explosions.
Similar activity continued during November, with explosions, ash plumes, and ashfall occurring. KVERT issued VONAs on 1-2, 4, 6-7, 9, 13, and 16 November that reported explosions and resulting ash plumes that rose to 1.7-3.6 km altitude and drifted 3-5 km SE, ESE, E, and NE. On 1 November ash plumes extended as far as 110 km SE. On 5, 8, 12, and 24-25 November explosions and ash plumes rose to 2-3.1 km altitude and drifted N and E. Ashfall was observed in Severo-Kurilsk on 7 and 16 November. A thermal anomaly was visible during 1-4, 16, and 20 November. Explosions during 26 November rose as high as 2.7 km altitude and drifted NE (figure 45).
Explosions and ash plumes continued to occur in December. During 1-2 and 4 December volcanologists from Severo-Kurilsk observed explosions that sent ash to 1.9-2.5 km altitude and drifted NE and SE (figure 46). VONAs were issued on 5, 9, and 16 December reporting that explosions generated ash plumes rising to 1.9 km, 2.6 km, and 2.4 km altitude and drifted 5 km SE, E, and NE, respectively. A thermal anomaly was visible in satellite imagery on 16 December. On 18 and 27-28 December explosions produced ash plumes that rose to 2.5 km altitude and drifted NE and SE. On 31 December an ash plume rose to 2 km altitude and drifted NE.
Explosions continued during January 2023, based on visual observations by volcanologists from Severo-Kurilsk. During 1-7 January explosions generated ash plumes that rose to 4 km altitude and drifted NE, E, W, and SE. According to VONAs issued by KVERT on 2, 4, 10, and 23 January, explosions produced ash plumes that rose to 2-4 km altitude and drifted 5 km N, NE, E, and ENE; the ash plume that rose to 4 km altitude occurred on 10 January (figure 47). Satellite data showed a thermal anomaly during 3-4, 10, 13, 16, 21, 22, and 31 January. KVERT reported that an ash cloud on 4 January moved 12 km NE. On 6 and 9-11 January explosions sent ash plumes to 4.5 km altitude and drifted W and ESE. On 13 January an ash plume rose to 3 km altitude and drifted SE. During 20-24 January ash plumes from explosions rose to 3.7 km altitude and drifted SE, N, and NE. On 21 January the ash plume drifted as far as 40 km NE. During 28-29 and 31 January and 1 February ash plumes rose to 4 km altitude and drifted NE.
During February, explosions, ash plumes, and ashfall were reported. During 1, 4-5 and 7-8 February explosions generated ash plumes that rose to 4.5 km altitude and drifted E and NE; ashfall was observed on 5 and 8 February. On 6 February an explosion produced an ash plume that rose to 3 km altitude and drifted 7 km E, causing ashfall in Severo-Kurilsk. A thermal anomaly was visible in satellite data on 8, 9, 13, and 21 February. Explosions on 9 and 12-13 February produced ash plumes that rose to 4 km altitude and drifted E and NE; the ash cloud on 12 February extended as far as 45 km E. On 22 February explosions sent ash to 3 km altitude that drifted E. During 24 and 26-27 February ash plumes rose to 4 km altitude and drifted E. On 28 February an explosion sent ash to 2.5-3 km altitude and drifted 5 km E; ashfall was observed in Severo-Kurilsk.
Activity continued during March; visual observations showed that explosions generated ash plumes that rose to 3.6 km altitude on 3, 5-7, and 9-12 March and drifted E, NE, and NW. Thermal anomalies were visible on 10, 13, and 29-30 March in satellite imagery. On 18, 21-23, 26, and 29-30 March explosions produced ash plumes that rose to 2.8 km altitude and drifted NE and E; the ash plumes during 22-23 March extended up to 76 km E. A VONA issued on 21 March reported an explosion that produced an ash plume that rose to 2.8 km altitude and drifted 5 km E. Another VONA issued on 23 March reported that satellite data showed an ash plume rising to 3 km altitude and drifted 14 km E.
Explosions during April continued to generate ash plumes. On 1 and 4 April an ash plume rose to 2.8-3.5 km altitude and drifted SE and NE. A thermal anomaly was visible in satellite imagery during 1-6 April. Satellite data showed ash plumes and clouds rising to 2-3 km altitude and drifting up to 12 km SW and E on 3 and 6 April (figure 48). KVERT issued VONAs on 3, 5, 14, 16 April describing explosions that produced ash plumes rising to 3 km, 3.5 km, 3.5 km, and 3 km altitude and drifting 5 km S, 5 km NE and SE, 72 km NNE, and 5 km NE, respectively. According to satellite data, the resulting ash cloud from the explosion on 14 April was 25 x 7 km in size and drifted 72-104 km NNE during 14-15 April. According to visual data by volcanologists from Severo-Kurilsk explosions sent ash up to 3.5 km altitude that drifted NE and E during 15-16, 22, 25-26, and 29 April.
The explosive eruption continued during May. Explosions during 3-4, 6-7, and 9-10 May generated ash plumes that rose to 4 km altitude and drifted SW and E. Satellite data showed a thermal anomaly on 3, 9, 13-14, and 24 May. During 12-16, 23-25, and 27-28 May ash plumes rose to 3.5 km altitude and drifted in different directions due to explosions. Two VONA notices were issued on 16 and 25 May, describing explosions that generated ash plumes rising to 3 km and 3.5 km altitude, respectively and extending 5 km E. The ash cloud on 25 May drifted 75 km SE.
Thermal activity in the summit crater, occasionally accompanied by ash plumes and ash deposits on the SE and E flanks due to frequent explosions, were visible in infrared and true color satellite images (figure 49).
Geologic Background. The flat-topped summit of the central cone of Ebeko volcano, one of the most active in the Kuril Islands, occupies the northern end of Paramushir Island. Three summit craters located along a SSW-NNE line form Ebeko volcano proper, at the northern end of a complex of five volcanic cones. Blocky lava flows extend west from Ebeko and SE from the neighboring Nezametnyi cone. The eastern part of the southern crater contains strong solfataras and a large boiling spring. The central crater is filled by a lake about 20 m deep whose shores are lined with steaming solfataras; the northern crater lies across a narrow, low barrier from the central crater and contains a small, cold crescentic lake. Historical activity, recorded since the late-18th century, has been restricted to small-to-moderate explosive eruptions from the summit craters. Intense fumarolic activity occurs in the summit craters, on the outer flanks of the cone, and in lateral explosion craters.
Information Contacts: Kamchatka Volcanic Eruptions Response Team (KVERT), Far Eastern Branch, Russian Academy of Sciences, 9 Piip Blvd., Petropavlovsk-Kamchatsky, 683006, Russia (URL: http://www.kscnet.ru/ivs/kvert/); MIROVA (Middle InfraRed Observation of Volcanic Activity), a collaborative project between the Universities of Turin and Florence (Italy) supported by the Centre for Volcanic Risk of the Italian Civil Protection Department (URL: http://www.mirovaweb.it/); Copernicus Browser, Copernicus Data Space Ecosystem, European Space Agency (URL: https://dataspace.copernicus.eu/browser/).
Home Reef
Tonga
18.992°S, 174.775°W; summit elev. -10 m
All times are local (unless otherwise noted)
Discolored plumes continued during November 2022-April 2023
Home Reef is a submarine volcano located in the central Tonga islands between Lateiki (Metis Shoal) and Late Island. The first recorded eruption occurred in the mid-19th century, when an ephemeral island formed. An eruption in 1984 produced a 12-km-high eruption plume, a large volume of floating pumice, and an ephemeral island 500 x 1,500 m wide, with cliffs 30-50 m high that enclosed a water-filled crater. Another island-forming eruption in 2006 produced widespread pumice rafts that drifted as far as Australia; by 2008 the island had eroded below sea level. The previous eruption occurred during October 2022 and was characterized by a new island-forming eruption, lava effusion, ash plumes, discolored water, and gas-and-steam plumes (BGVN 47:11). This report covers discolored water plumes during November 2022 through April 2023 using satellite data.
Discolored plumes continued during the reporting period and were observed in true color satellite images on clear weather days. Satellite images show light green-yellow discolored water extending W on 8 and 28 November 2022 (figure 31), and SW on 18 November. Light green-yellow plumes extended W on 3 December, S on 13 December, SW on 18 December, and W and S on 23 December (figure 31). On 12 January 2023 discolored green-yellow plumes extended to the NE, E, SE, and N. The plume moved SE on 17 January and NW on 22 January. Faint discolored water in February was visible moving NE on 1 February. A discolored plume extended NW on 8 and 28 March and NW on 13 March (figure 31). During April, clear weather showed green-blue discolored plumes moving S on 2 April, W on 7 April, and NE and S on 12 April. A strong green-yellow discolored plume extended E and NE on 22 April for several kilometers (figure 31).
Geologic Background. Home Reef, a submarine volcano midway between Metis Shoal and Late Island in the central Tonga islands, was first reported active in the mid-19th century, when an ephemeral island formed. An eruption in 1984 produced a 12-km-high eruption plume, large amounts of floating pumice, and an ephemeral 500 x 1,500 m island, with cliffs 30-50 m high that enclosed a water-filled crater. In 2006 an island-forming eruption produced widespread dacitic pumice rafts that drifted as far as Australia. Another island was built during a September-October 2022 eruption.
Information Contacts: Copernicus Browser, Copernicus Data Space Ecosystem, European Space Agency (URL: https://dataspace.copernicus.eu/browser/).
Semisopochnoi (United States) — June 2023 Cite this Report
Semisopochnoi
United States
51.93°N, 179.58°E; summit elev. 1221 m
All times are local (unless otherwise noted)
Occasional explosions, ash deposits, and gas-and-steam plumes during December 2022-May 2023
Semisopochnoi is located in the western Aleutians, is 20-km-wide at sea level, and contains an 8-km-wide caldera. The three-peaked Mount Young (formerly Cerberus) was constructed within the caldera during the Holocene. Each of these peaks contains a summit crater; the lava flows on the N flank appear younger than those on the S side. The current eruption period began in early February 2021 and has more recently consisted of intermittent explosions and ash emissions (BGVN 47:12). This report updates activity during December 2022 through May 2023 using daily, weekly, and special reports from the Alaska Volcano Observatory (AVO). AVO monitors the volcano using local seismic and infrasound sensors, satellite data, web cameras, and remote infrasound and lightning networks.
Activity during most of December 2022 was relatively quiet; according to AVO no eruptive or explosive activity was observed since 7 November 2022. Intermittent tremor and occasional small earthquakes were observed in geophysical data. Continuous gas-and-steam emissions were observed from the N crater of Mount Young in webcam images on clear weather days (figure 25). On 24 December, there was a slight increase in earthquake activity and several small possible explosion signals were detected in infrasound data. Eruptive activity resumed on 27 December at the N crater of Mount Young; AVO issued a Volcano Activity Notice (VAN) that reported minor ash deposits on the flanks of Mount Young that extended as far as 1 km from the vent, according to webcam images taken during 27-28 December (figure 26). No ash plumes were observed in webcam or satellite imagery, but a persistent gas-and-steam plume that might have contained some ash rose to 1.5 km altitude. As a result, AVO raised the Aviation Color Code (ACC) to Orange (the second highest level on a four-color scale) and the Volcano Alert Level (VAL) to Watch (the second highest level on a four-level scale). Possible explosions were detected during 21 December 2022 through 1 January 2023 and seismic tremor was recorded during 30-31 December.
During January 2023 eruptive activity continued at the active N crater of Mount Young. Minor ash deposits were observed on the flanks, extending about 2 km SSW, based on webcam images from 1 and 3 January. A possible explosion occurred during 1-2 January based on elevated seismicity recorded on local seismometers and an infrasound signal recorded minutes later by an array at Adak. Though no ash plumes were observed in webcam or satellite imagery, a persistent gas-and-steam plume rose to 1.5 km altitude that might have carried minor traces of ash. Ash deposits were accompanied by periods of elevated seismicity and infrasound signals from the local geophysical network, which AVO reported were likely due to weak explosive activity. Low-level explosive activity was also detected during 2-3 January, with minor gas-and-steam emissions and a new ash deposit that was visible in webcam images. Low-level explosive activity was detected in geophysical data during 4-5 January, with elevated seismicity and infrasound signals observed on local stations. Volcanic tremor was detected during 7-9 January and very weak explosive activity was detected in seismic and infrasound data on 9 January. Weak seismic and infrasound signals were recorded on 17 January, which indicated minor explosive activity, but no ash emissions were observed in clear webcam images; a gas-and-steam plume continued to rise to 1.5 km altitude. During 29-30 January, ash deposits near the summit were observed on fresh snow, according to webcam images.
The active N cone at Mount Young continued to produce a gas-and-steam plume during February, but no ash emissions or explosive events were detected. Seismicity remained elevated with faint tremor during early February. Gas-and-steam emissions from the N crater were observed in clear webcam images on 11-13 and 16 February; no explosive activity was detected in seismic, infrasound, or satellite data. Seismicity has also decreased, with no significant seismic tremor observed since 25 January. Therefore, the ACC was lowered to Yellow (the second lowest level on a four-color scale) and the VAL was lowered to Advisory (the second lowest level on a four-color scale) on 22 February.
Gas-and-steam emissions persisted during March from the N cone of Mount Young, based on clear webcam images. A few brief episodes of weak tremor were detected in seismic data, although seismicity decreased over the month. A gas-and-steam plume detected in satellite data extended 150 km on 18 March. Low-level ash emissions from the N cone at Mount Young were observed in several webcam images during 18-19 March, in addition to small explosions and volcanic tremor. The ACC was raised to Orange and the VAL increased to Watch on 19 March. A small explosion was detected in seismic and infrasound data on 21 March.
Low-level unrest continued during April, although cloudy weather often obscured views of the summit; periods of seismic tremor and local earthquakes were recorded. During 3-4 April a gas-and-steam plume was visible traveling more than 200 km overnight; no ash was evident in the plume, according to AVO. A gas-and-steam plume was observed during 4-6 April that extended 400 km but did not seem to contain ash. Small explosions were detected in seismic and infrasound data on 5 April. Occasional clear webcam images showed continuing gas-and-steam emissions rose from Mount Young, but no ash deposits were observed on the snow. On 19 April small explosions and tremor were detected in seismic and infrasound data. A period of seismic tremor was detected during 22-25 April, with possible weak explosions on 25 April. Ash deposits were visible near the crater rim, but it was unclear if these deposits were recent or due to older deposits.
Occasional small earthquakes were recorded during May, but there were no signs of explosive activity seen in geophysical data. Gas-and-steam emissions continued from the N crater of Mount Young, based on webcam images, and seismicity remained slightly elevated. A new, light ash deposit was visible during the morning of 5 May on fresh snow on the NW flank of Mount Young. During 10 May periods of volcanic tremor were observed. The ACC was lowered to Yellow and the VAL to Advisory on 17 May due to no additional evidence of activity.
Geologic Background. Semisopochnoi, the largest subaerial volcano of the western Aleutians, is 20 km wide at sea level and contains an 8-km-wide caldera. It formed as a result of collapse of a low-angle, dominantly basaltic volcano following the eruption of a large volume of dacitic pumice. The high point of the island is Anvil Peak, a double-peaked late-Pleistocene cone that forms much of the island's northern part. The three-peaked Mount Cerberus (renamed Mount Young in 2023) was constructed within the caldera during the Holocene. Each of the peaks contains a summit crater; lava flows on the N flank appear younger than those on the south side. Other post-caldera volcanoes include the symmetrical Sugarloaf Peak SSE of the caldera and Lakeshore Cone, a small cinder cone at the edge of Fenner Lake in the NE part of the caldera. Most documented eruptions have originated from Young, although Coats (1950) considered that both Sugarloaf and Lakeshore Cone could have been recently active.
Information Contacts: Alaska Volcano Observatory (AVO), a cooperative program of a) U.S. Geological Survey, 4200 University Drive, Anchorage, AK 99508-4667 USA (URL: https://avo.alaska.edu/), b) Geophysical Institute, University of Alaska, PO Box 757320, Fairbanks, AK 99775-7320, USA, and c) Alaska Division of Geological & Geophysical Surveys, 794 University Ave., Suite 200, Fairbanks, AK 99709, USA (URL: http://dggs.alaska.gov/).
Ambae
Vanuatu
15.389°S, 167.835°E; summit elev. 1496 m
All times are local (unless otherwise noted)
New lava flow, ash plumes, and sulfur dioxide plumes during February-May 2023
Ambae, also known as Aoba, is a large basaltic shield volcano in Vanuatu. A broad pyroclastic cone containing three crater lakes (Manaro Ngoru, Voui, and Manaro Lakua) is located at the summit within the youngest of at least two nested calderas. Periodic phreatic and pyroclastic explosions have been reported since the 16th century. A large eruption more than 400 years ago resulted in a volcanic cone within the summit crater that is now filled by Lake Voui; the similarly sized Lake Manaro fills the western third of the caldera. The previous eruption ended in August 2022 that was characterized by gas-and-steam and ash emissions and explosions of wet tephra (BGVN 47:10). This report covers a new eruption during February through May 2023 that consisted of a new lava flow, ash plumes, and sulfur dioxide emissions, using information from the Vanuatu Meteorology and Geo-Hazards Department (VMGD) and satellite data.
During the reporting period, the Alert Level remained at a 2 (on a scale of 0-5), which has been in place since December 2021. Activity during October 2022 through March 2023 remained relatively low and mostly consisted of gas-and-steam emissions in Lake Voui. VMGD reported that at 1300 on 15 November a satellite image captured a strong amount of sulfur dioxide rising above the volcano (figure 99), and that seismicity slightly increased. The southern and northern part of the island reported a strong sulfur dioxide smell and heard explosions. On 20 February 2023 a gas-and-ash plume rose 1.3 km above the summit and drifted SSW, according to a webcam image (figure 100). Gas-and-steam and possibly ash emissions continued on 23 February and volcanic earthquakes were recorded by the seismic network.
During April, volcanic earthquakes and gas-and-steam and ash emissions were reported from the cone in Lake Voui. VMGD reported that activity increased during 5-7 April; high gas-and-steam and ash plumes were visible, accompanied by nighttime incandescence. According to a Wellington VAAC report, a low-level ash plume rose as high as 2.5 km above the summit and drifted W and SW on 5 April, based on satellite imagery. Reports in Saratamata stated that a dark ash plume drifted to the WSW, but no loud explosion was heard. Webcam images from 2100 showed incandescence above the crater and reflected in the clouds. According to an aerial survey, field observations, and satellite data, water was no longer present in the lake. A lava flow was reported effusing from the vent and traveling N into the dry Lake Voui, which lasted three days. The next morning at 0745 on 6 April a gas-and-steam and ash plume rose 5.4 km above the summit and drifted ESE, based on information from VMGD (figure 101). The Wellington VAAC also reported that light ashfall was observed on the island. Intermittent gas-and-steam and ash emissions were visible on 7 April, some of which rose to an estimated 3 km above the summit and drifted E. Webcam images during 0107-0730 on 7 April showed continuing ash emissions. A gas-and-steam and ash plume rose 695 m above the summit crater at 0730 on 19 April and drifted ESE, based on a webcam image (figure 102).
According to visual and infrared satellite data, water was visible in Lake Voui as late as 24 March 2023 (figure 103). The vent in the caldera showed a gas-and-steam plume drifted SE. On 3 April thermal activity was first detected, accompanied by a gas-and-ash plume that drifted W (figure 103). The lava flow moved N within the dry lake and was shown cooling by 8 April. By 23 April much of the water in the lake had returned. Occasional sulfur dioxide plumes were detected by the TROPOMI instrument on the Sentinel-5P satellite that exceeded 2 Dobson Units (DU) and drifted in different directions (figure 104).
Geologic Background. The island of Ambae, also known as Aoba, is a massive 2,500 km3 basaltic shield that is the most voluminous volcano of the New Hebrides archipelago. A pronounced NE-SW-trending rift zone with numerous scoria cones gives the 16 x 38 km island an elongated form. A broad pyroclastic cone containing three crater lakes (Manaro Ngoru, Voui, and Manaro Lakua) is located at the summit within the youngest of at least two nested calderas, the largest of which is 6 km in diameter. That large central edifice is also called Manaro Voui or Lombenben volcano. Post-caldera explosive eruptions formed the summit craters about 360 years ago. A tuff cone was constructed within Lake Voui (or Vui) about 60 years later. The latest known flank eruption, about 300 years ago, destroyed the population of the Nduindui area near the western coast.
Information Contacts: Geo-Hazards Division, Vanuatu Meteorology and Geo-Hazards Department (VMGD), Ministry of Climate Change Adaptation, Meteorology, Geo-Hazards, Energy, Environment and Disaster Management, Private Mail Bag 9054, Lini Highway, Port Vila, Vanuatu (URL: http://www.vmgd.gov.vu/, https://www.facebook.com/VanuatuGeohazardsObservatory/); Wellington Volcanic Ash Advisory Centre (VAAC), Meteorological Service of New Zealand Ltd (MetService), PO Box 722, Wellington, New Zealand (URL: http://www.metservice.com/vaac/, http://www.ssd.noaa.gov/VAAC/OTH/NZ/messages.html); MIROVA (Middle InfraRed Observation of Volcanic Activity), a collaborative project between the Universities of Turin and Florence (Italy) supported by the Centre for Volcanic Risk of the Italian Civil Protection Department (URL: http://www.mirovaweb.it/); Global Sulfur Dioxide Monitoring Page, Atmospheric Chemistry and Dynamics Laboratory, NASA Goddard Space Flight Center (NASA/GSFC), 8800 Greenbelt Road, Goddard, Maryland, USA (URL: https://so2.gsfc.nasa.gov/); Copernicus Browser, Copernicus Data Space Ecosystem, European Space Agency (URL: https://dataspace.copernicus.eu/browser/).
Ibu
Indonesia
1.488°N, 127.63°E; summit elev. 1325 m
All times are local (unless otherwise noted)
Daily ash explosions continue, along with thermal anomalies in the crater, October 2022-May 2023
Persistent eruptive activity since April 2008 at Ibu, a stratovolcano on Indonesian’s Halmahera Island, has consisted of daily explosive ash emissions and plumes, along with observations of thermal anomalies (BGVN 47:04). The current eruption continued during October 2022-May 2023, described below, based on advisories issued by the Pusat Vulkanologi dan Mitigasi Bencana Geologi (PVMBG, also known as Indonesian Center for Volcanology and Geological Hazard Mitigation, CVGHM), daily reports by MAGMA Indonesia (a PVMBG platform), and the Darwin Volcanic Ash Advisory Centre (VAAC), and various satellite data. The Alert Level during the reporting period remained at 2 (on a scale of 1-4), except raised briefly to 3 on 27 May, and the public was warned to stay at least 2 km away from the active crater and 3.5 km away on the N side of the volcano.
According to MAGMA Indonesia, during October 2022-May 2023, daily gray-and-white ash plumes of variable densities rose 200-1,000 m above the summit and drifted in multiple directions. On 30 October and 11 November, plumes rose a maximum of 2 km and 1.5 km above the summit, respectively (figures 42 and 43). According to the Darwin VAAC, discrete ash emissions on 13 November rose to 2.1 km altitude, or 800 m above the summit, and drifted W, and multiple ash emissions on 15 November rose 1.4 km above the summit and drifted NE. Occasional larger ash explosions through May 2023 prompted PVMBG to issue Volcano Observatory Notice for Aviation (VONA) alerts (table 6); the Aviation Color Code remained at Orange throughout this period.
Table 6. Volcano Observatory Notice for Aviation (VONA) ash plume alerts for Ibu issued by PVMBG during October 2022-May 2023. Maximum height above the summit was estimated by a ground observer. VONAs in January-May 2023 all described the ash plumes as dense.
| Date |
Time (local) |
Max height above summit |
Direction |
| 17 Oct 2022 |
0858 |
800 m |
SW |
| 18 Oct 2022 |
1425 |
800 m |
S |
| 19 Oct 2022 |
2017 |
600 m |
SW |
| 21 Oct 2022 |
0916 |
800 m |
NW |
| 16 Jan 2023 |
1959 |
600 m |
NE |
| 22 Jan 2023 |
0942 |
1,000 m |
E |
| 29 Jan 2023 |
2138 |
1,000 m |
E |
| 10 May 2023 |
0940 |
800 m |
NW |
| 10 May 2023 |
2035 |
600 m |
E |
| 21 May 2023 |
2021 |
600 m |
W |
| 21 May 2023 |
2140 |
1,000 m |
W |
| 29 May 2023 |
1342 |
800 m |
N |
| 31 May 2023 |
1011 |
1,000 m |
SW |
Sentinel-2 L1C satellite images throughout the reporting period show two, sometimes three persistent thermal anomalies in the summit crater, with the most prominent hotspot from the top of a cone within the crater. Clear views were more common during March-April 2023, when a vent and lava flows on the NE flank of the intra-crater cone could be distinguished (figure 44). White-to-grayish emissions were also observed during brief periods when weather clouds allowed clear views.
The MIROVA space-based volcano hotspot detection system recorded almost daily thermal anomalies throughout the reporting period, though cloud cover often interfered with detections. Data from imaging spectroradiometers aboard NASA’s Aqua and Terra satellites and processed using the MODVOLC algorithm (MODIS-MODVOLC) recorded hotspots on one day during October 2022 and December 2022, two days in April 2023, three days in November 2022 and May 2023, and four days in March 2023.
Geologic Background. The truncated summit of Gunung Ibu stratovolcano along the NW coast of Halmahera Island has large nested summit craters. The inner crater, 1 km wide and 400 m deep, has contained several small crater lakes. The 1.2-km-wide outer crater is breached on the N, creating a steep-walled valley. A large cone grew ENE of the summit, and a smaller one to the WSW has fed a lava flow down the W flank. A group of maars is located below the N and W flanks. The first observed and recorded eruption was a small explosion from the summit crater in 1911. Eruptive activity began again in December 1998, producing a lava dome that eventually covered much of the floor of the inner summit crater along with ongoing explosive ash emissions.
Information Contacts: Pusat Vulkanologi dan Mitigasi Bencana Geologi (PVMBG, also known as Indonesian Center for Volcanology and Geological Hazard Mitigation, CVGHM), Jalan Diponegoro 57, Bandung 40122, Indonesia (URL: http://www.vsi.esdm.go.id/); MAGMA Indonesia (Multiplatform Application for Geohazard Mitigation and Assessment in Indonesia), Kementerian Energi dan Sumber Daya Mineral (URL: https://magma.esdm.go.id/v1); Copernicus Browser, Copernicus Data Space Ecosystem, European Space Agency (URL: https://dataspace.copernicus.eu/browser/); MIROVA (Middle InfraRed Observation of Volcanic Activity), a collaborative project between the Universities of Turin and Florence (Italy) supported by the Centre for Volcanic Risk of the Italian Civil Protection Department (URL: http://www.mirovaweb.it/); Hawai'i Institute of Geophysics and Planetology (HIGP) - MODVOLC Thermal Alerts System, School of Ocean and Earth Science and Technology (SOEST), Univ. of Hawai'i, 2525 Correa Road, Honolulu, HI 96822, USA (URL: http://modis.higp.hawaii.edu/).
Dukono
Indonesia
1.6992°N, 127.8783°E; summit elev. 1273 m
All times are local (unless otherwise noted)
Continuing ash emissions, SO2 plumes, and thermal signals during October 2022-May 2023
Dukono, a remote volcano on Indonesia’s Halmahera Island, has been erupting continuously since 1933, with frequent ash explosions and sulfur dioxide plumes (BGVN 46:11, 47:10). This activity continued during October 2022 through May 2023, based on reports from the Pusat Vulkanologi dan Mitigasi Bencana Geologi (PVMBG; also known as Indonesian Center for Volcanology and Geological Hazard Mitigation, CVGHM), the Darwin Volcanic Ash Advisory Centre (VAAC), and satellite data. During this period, the Alert Level remained at 2 (on a scale of 1-4) and the public was warned to remain outside of the 2-km exclusion zone. The highest reported plume of the period reached 9.4 km above the summit on 14 November 2022.
According to MAGMA Indonesia (a platform developed by PVMBG), white, gray, or dark plumes of variable densities were observed almost every day during the reporting period, except when fog obscured the volcano (figure 33). Plumes generally rose 25-450 m above the summit, but rose as high as 700-800 m on several days, somewhat lower than the maximum heights reached earlier in 2022 when plumes reached as high as 1 km. However, the Darwin VAAC reported that on 14 November 2022, a discrete ash plume rose 9.4 km above the summit (10.7 km altitude), accompanied by a strong hotspot and a sulfur dioxide signal observed in satellite imagery; a continuous ash plume that day and through the 15th rose to 2.1-2.4 km altitude and drifted NE.
Sentinel-2 images were obscured by weather clouds almost every viewing day during the reporting period. However, the few reasonably clear images showed a hotspot and white or gray emissions and plumes. Strong SO2 plumes from Dukono were present on many days during October 2022-May 2023, as detected using the TROPOMI instrument on the Sentinel-5P satellite (figure 34).
Geologic Background. Reports from this remote volcano in northernmost Halmahera are rare, but Dukono has been one of Indonesia's most active volcanoes. More-or-less continuous explosive eruptions, sometimes accompanied by lava flows, have occurred since 1933. During a major eruption in 1550 CE, a lava flow filled in the strait between Halmahera and the N-flank Gunung Mamuya cone. This complex volcano presents a broad, low profile with multiple summit peaks and overlapping craters. Malupang Wariang, 1 km SW of the summit crater complex, contains a 700 x 570 m crater that has also been active during historical time.
Information Contacts: Pusat Vulkanologi dan Mitigasi Bencana Geologi (PVMBG, also known as Indonesian Center for Volcanology and Geological Hazard Mitigation, CVGHM), Jalan Diponegoro 57, Bandung 40122, Indonesia (URL: http://www.vsi.esdm.go.id/); MAGMA Indonesia (Multiplatform Application for Geohazard Mitigation and Assessment in Indonesia), Kementerian Energi dan Sumber Daya Mineral (URL: https://magma.esdm.go.id/v1); Darwin Volcanic Ash Advisory Centre (VAAC), Bureau of Meteorology, Northern Territory Regional Office, PO Box 40050, Casuarina, NT 0811, Australia (URL: http://www.bom.gov.au/info/vaac/); NASA Global Sulfur Dioxide Monitoring Page, Atmospheric Chemistry and Dynamics Laboratory, NASA Goddard Space Flight Center (NASA/GSFC), 8800 Greenbelt Road, Goddard, Maryland, USA (URL: https://so2.gsfc.nasa.gov/); Sentinel Hub Playground (URL: https://www.sentinel-hub.com/explore/sentinel-playground).
Sabancaya
Peru
15.787°S, 71.857°W; summit elev. 5960 m
All times are local (unless otherwise noted)
Explosions, gas-and-ash plumes, and thermal activity persist during November 2022-April 2023
Sabancaya is located in Peru, NE of Ampato and SE of Hualca Hualca. Eruptions date back to 1750 and have been characterized by explosions, phreatic activity, ash plumes, and ashfall. The current eruption period began in November 2016 and has more recently consisted of daily explosions, gas-and-ash plumes, and thermal activity (BGVN 47:11). This report updates activity during November 2022 through April 2023 using information from Instituto Geophysico del Peru (IGP) that use weekly activity reports and various satellite data.
Intermittent low-to-moderate power thermal anomalies were reported by the MIROVA project during November 2022 through April 2023 (figure 119). There were few short gaps in thermal activity during mid-December 2022, late December-to-early January 2023, late January to mid-February, and late February. According to data recorded by the MODVOLC thermal algorithm, there were a total of eight thermal hotspots: three in November 2022, three in February 2023, one in March, and one in April. On clear weather days, some of this thermal anomaly was visible in infrared satellite imagery showing the active lava dome in the summit crater (figure 120). Almost daily moderate-to-strong sulfur dioxide plumes were recorded during the reporting period by the TROPOMI instrument on the Sentinel-5P satellite (figure 121). Many of these plumes exceeded 2 Dobson Units (DU) and drifted in multiple directions.
IGP reported that moderate activity during November and December 2022 continued; during November, an average number of explosions were reported each week: 30, 33, 36, and 35, and during December, it was 32, 40, 47, 52, and 67. Gas-and-ash plumes in November rose 3-3.5 km above the summit and drifted E, NE, SE, S, N, W, and SW. During December the gas-and-ash plumes rose 2-4 km above the summit and drifted in different directions. There were 1,259 volcanic earthquakes recorded during November and 1,693 during December. Seismicity also included volcano-tectonic-type events that indicate rock fracturing events. Slight inflation was observed in the N part of the volcano near Hualca Hualca (4 km N). Thermal activity was frequently reported in the crater at the active lava dome (figure 120).
Explosive activity continued during January and February 2023. The average number of explosions were reported each week during January (51, 50, 60, and 59) and February (43, 54, 51, and 50). Gas-and-ash plumes rose 1.6-2.9 km above the summit and drifted NW, SW, and W during January and rose 1.4-2.8 above the summit and drifted W, SW, E, SE, N, S, NW, and NE during February. IGP also detected 1,881 volcanic earthquakes during January and 1,661 during February. VT-type earthquakes were also reported. Minor inflation persisted near Hualca Hualca. Satellite imagery showed continuous thermal activity in the crater at the lava dome (figure 120).
During March, the average number of explosions each week was 46, 48, 31, 35, and 22 and during April, it was 29, 41, 31, and 27. Accompanying gas-and-ash plumes rose 1.7-2.6 km above the summit crater and drifted W, SW, NW, S, and SE during March. According to a Buenos Aires Volcano Ash Advisory Center (VAAC) notice, on 22 March at 1800 through 23 March an ash plume rose to 7 km altitude and drifted NW. By 0430 an ash plume rose to 7.6 km altitude and drifted W. On 24 and 26 March continuous ash emissions rose to 7.3 km altitude and drifted SW and on 28 March ash emissions rose to 7.6 km altitude. During April, gas-and-ash plumes rose 1.6-2.5 km above the summit and drifted W, SW, S, NW, NE, and E. Frequent volcanic earthquakes were recorded, with 1,828 in March and 1,077 in April, in addition to VT-type events. Thermal activity continued to be reported in the summit crater at the lava dome (figure 120).
Geologic Background. Sabancaya, located in the saddle NE of Ampato and SE of Hualca Hualca volcanoes, is the youngest of these volcanic centers and the only one to have erupted in historical time. The oldest of the three, Nevado Hualca Hualca, is of probable late-Pliocene to early Pleistocene age. The name Sabancaya (meaning "tongue of fire" in the Quechua language) first appeared in records in 1595 CE, suggesting activity prior to that date. Holocene activity has consisted of Plinian eruptions followed by emission of voluminous andesitic and dacitic lava flows, which form an extensive apron around the volcano on all sides but the south. Records of historical eruptions date back to 1750.
Information Contacts: Instituto Geofisico del Peru (IGP), Centro Vulcanológico Nacional (CENVUL), Calle Badajoz N° 169 Urb. Mayorazgo IV Etapa, Ate, Lima 15012, Perú (URL: https://www.igp.gob.pe/servicios/centro-vulcanologico-nacional/inicio); Buenos Aires Volcanic Ash Advisory Center (VAAC), Servicio Meteorológico Nacional-Fuerza Aérea Argentina, 25 de mayo 658, Buenos Aires, Argentina (URL: http://www.smn.gov.ar/vaac/buenosaires/inicio.php); MIROVA (Middle InfraRed Observation of Volcanic Activity), a collaborative project between the Universities of Turin and Florence (Italy) supported by the Centre for Volcanic Risk of the Italian Civil Protection Department (URL: http://www.mirovaweb.it/); Hawai'i Institute of Geophysics and Planetology (HIGP) - MODVOLC Thermal Alerts System, School of Ocean and Earth Science and Technology (SOEST), Univ. of Hawai'i, 2525 Correa Road, Honolulu, HI 96822, USA (URL: http://modis.higp.hawaii.edu/); NASA Global Sulfur Dioxide Monitoring Page, Atmospheric Chemistry and Dynamics Laboratory, NASA Goddard Space Flight Center (NASA/GSFC), 8800 Greenbelt Road, Goddard MD 20771, USA (URL: https://so2.gsfc.nasa.gov/); Copernicus Browser, Copernicus Data Space Ecosystem, European Space Agency (URL: https://dataspace.copernicus.eu/browser/).
Sheveluch
Russia
56.653°N, 161.36°E; summit elev. 3283 m
All times are local (unless otherwise noted)
Significant explosions destroyed part of the lava-dome complex during April 2023
Sheveluch (also spelled Shiveluch) in Kamchatka, has had at least 60 large eruptions during the last 10,000 years. The summit is truncated by a broad 9-km-wide caldera that is breached to the S, and many lava domes occur on the outer flanks. The lava dome complex was constructed within the large open caldera. Frequent collapses of the dome complex have produced debris avalanches; the resulting deposits cover much of the caldera floor. A major south-flank collapse during a 1964 Plinian explosion produced a scarp in which a “Young Sheveluch” dome began to form in 1980. Repeated episodes of dome formation and destruction since then have produced major and minor ash plumes, pyroclastic flows, block-and-ash flows, and “whaleback domes” of spine-like extrusions in 1993 and 2020 (BGVN 45:11). The current eruption period began in August 1999 and has more recently consisted of lava dome growth, explosions, ash plumes, and avalanches (BGVN 48:01). This report covers a significant explosive eruption during early-to-mid-April 2023 that generated a 20 km altitude ash plume, produced a strong sulfur dioxide plume, and destroyed part of the lava-dome complex; activity described during January through April 2023 use information primarily from the Kamchatka Volcanic Eruptions Response Team (KVERT) and various satellite data.
Satellite data. Activity during the majority of this reporting period was characterized by continued lava dome growth, strong fumarole activity, explosions, and hot avalanches. According to the MODVOLC Thermal Alerts System, 140 hotspots were detected through the reporting period, with 33 recorded in January 2023, 29 in February, 44 in March, and 34 in April. Frequent strong thermal activity was recorded during January 2023 through April, according to the MIROVA (Middle InfraRed Observation of Volcanic Activity) graph and resulted from the continuously growing lava dome (figure 94). A slightly stronger pulse in thermal activity was detected in early-to-mid-April, which represented the significant eruption that destroyed part of the lava-dome complex. Thermal anomalies were also visible in infrared satellite imagery at the summit crater (figure 95).
During January 2023 KVERT reported continued growth of the lava dome, accompanied by strong fumarolic activity, incandescence from the lava dome, explosions, ash plumes, and avalanches. Satellite data showed a daily thermal anomaly over the volcano. Video data showed ash plumes associated with collapses at the dome that generated avalanches that in turn produced ash plumes rising to 3.5 km altitude and drifting 40 km W on 4 January and rising to 7-7.5 km altitude and drifting 15 km SW on 5 January. A gas-and-steam plume containing some ash that was associated with avalanches rose to 5-6 km altitude and extended 52-92 km W on 7 January. Explosions that same day produced ash plumes that rose to 7-7.5 km altitude and drifted 10 km W. According to a Volcano Observatory Notice for Aviation (VONA) issued at 1344 on 19 January, explosions produced an ash cloud that was 15 x 25 km in size and rose to 9.6-10 km altitude, drifting 21-25 km W; as a result, the Aviation Color Code (ACC) was raised to Red (the highest level on a four-color scale). Another VONA issued at 1635 reported that no more ash plumes were observed, and the ACC was lowered to Orange (the second highest level on a four-color scale). On 22 January an ash plume from collapses and avalanches rose to 5 km altitude and drifted 25 km NE and SW; ash plumes associated with collapses extended 70 km NE on 27 and 31 January.
Lava dome growth, fumarolic activity, dome incandescence, and occasional explosions and avalanches continued during February and March. A daily thermal anomaly was visible in satellite data. Explosions on 1 February generated ash plumes that rose to 6.3-6.5 km altitude and extended 15 km NE. Video data showed an ash cloud from avalanches rising to 5.5 km altitude and drifting 5 km SE on 2 February. Satellite data showed gas-and-steam plumes containing some ash rose to 5-5.5 km altitude and drifted 68-110 km ENE and NE on 6 February, to 4.5-5 km altitude and drifted 35 km WNW on 22 February, and to 3.7-4 km altitude and drifted 47 km NE on 28 February. Scientists from the Kamchatka Volcanological Station (KVS) went on a field excursion on 25 February to document the growing lava dome, and although it was cloudy most of the day, nighttime incandescence was visible. Satellite data showed an ash plume extending up to 118 km E during 4-5 March. Video data from 1150 showed an ash cloud from avalanches rose to 3.7-5.5 km altitude and drifted 5-10 km ENE and E on 5 March. On 11 March an ash plume drifted 62 km E. On 27 March ash plumes rose to 3.5 km altitude and drifted 100 km E. Avalanches and constant incandescence at the lava dome was focused on the E and NE slopes on 28 March. A gas-and-steam plume containing some ash rose to 3.5 km altitude and moved 40 km E on 29 March. Ash plumes on 30 March rose to 3.5-3.7 km altitude and drifted 70 km NE.
Similar activity continued during April, with lava dome growth, strong fumarolic activity, incandescence in the dome, occasional explosions, and avalanches. A thermal anomaly persisted throughout the month. During 1-4 April weak ash plumes rose to 2.5-3 km altitude and extended 13-65 km SE and E.
Activity during 11 April 2023. The Institute of Volcanology and Seismology, Far Eastern Branch, Russian Academy of Sciences (IVS FEB RAS) reported a significant increase in seismicity around 0054 on 11 April, as reported by strong explosions detected on 11 April beginning at 0110 that sent ash plumes up to 7-10 km altitude and extended 100-435 km W, WNW, NNW, WSW, and SW. According to a Tokyo VAAC report the ash plume rose to 15.8 km altitude. By 0158 the plume extended over a 75 x 100 km area. According to an IVS FEB RAS report, the eruptive column was not vertical: the initial plume at 0120 on 11 April deviated to the NNE, at 0000 on 12 April, it drifted NW, and by 1900 it drifted SW. KVS reported that significant pulses of activity occurred at around 0200, 0320, and then a stronger phase around 0600. Levin Dmitry took a video from near Békés (3 km away) at around 0600 showing a rising plume; he also reported that a pyroclastic flow traveled across the road behind him as he left the area. According to IVS FEB RAS, the pyroclastic flow traveled several kilometers SSE, stopping a few hundred meters from a bridge on the road between Klyuchi and Petropavlovsk-Kamchatsky.
Ashfall was first observed in Klyuchi (45 km SW) at 0630, and a large, black ash plume blocked light by 0700. At 0729 KVERT issued a Volcano Observatory Notice for Aviation (VONA) raising the Aviation Color Code to Red (the highest level on a four-color scale). It also stated that a large ash plume had risen to 10 km altitude and drifted 100 km W. Near-constant lightning strikes were reported in the plume and sounds like thunderclaps were heard until about 1000. According to IVS FEB RAS the cloud was 200 km long and 76 km wide by 0830, and was spreading W at altitudes of 6-12 km. In the Klyuchi Village, the layer of both ash and snow reached 8.5 cm (figure 96); ashfall was also reported in Kozyrevsk (112 km SW) at 0930, Mayskoye, Anavgay, Atlasovo, Lazo, and Esso. Residents in Klyuchi reported continued darkness and ashfall at 1100. In some areas, ashfall was 6 cm deep and some residents reported dirty water coming from their plumbing. According to IVS FEB RAS, an ash cloud at 1150 rose to 5-20 km altitude and was 400 km long and 250 km wide, extending W. A VONA issued at 1155 reported that ash had risen to 10 km and drifted 340 km NNW and 240 km WSW. According to Simon Carn (Michigan Technological University), about 0.2 Tg of sulfur dioxide in the plume was measured in a satellite image from the TROPOMI instrument on the Sentinel-5P satellite acquired at 1343 that covered an area of about 189,000 km2 (figure 97). Satellite data at 1748 showed an ash plume that rose to 8 km altitude and drifted 430 km WSW and S, according to a VONA.
Activity during 12-15 April 2023. On 12 April at 0730 satellite images showed ash plumes rose to 7-8 km altitude and extended 600 km SW, 1,050 km ESE, and 1,300-3,000 km E. By 1710 that day, the explosions weakened. According to news sources, the ash-and-gas plumes drifted E toward the Aleutian Islands and reached the Gulf of Alaska by 13 April, causing flight disruptions. More than 100 flights involving Alaska airspace were cancelled due to the plume. Satellite data showed ash plumes rising to 4-5.5 km altitude and drifted 400-415 km SE and ESE on 13 April. KVS volcanologists observed the pyroclastic flow deposits and noted that steam rose from downed, smoldering trees. They also noted that the deposits were thin with very few large fragments, which differed from previous flows. The ash clouds traveled across the Pacific Ocean. Flight cancellations were also reported in NW Canada (British Columbia) during 13-14 April. During 14-15 April ash plumes rose to 6 km altitude and drifted 700 km NW.
Alaskan flight schedules were mostly back to normal by 15 April, with only minor delays and far less cancellations; a few cancellations continued to be reported in Canada. Clear weather on 15 April showed that most of the previous lava-dome complex was gone and a new crater roughly 1 km in diameter was observed (figure 98); gas-and-steam emissions were rising from this crater. Evidence suggested that there had been a directed blast to the SE, and pyroclastic flows traveled more than 20 km. An ash plume rose to 4.5-5.2 km altitude and drifted 93-870 km NW on 15 April.
Activity during 16-30 April 2023. Resuspended ash was lifted by the wind from the slopes and rose to 4 km altitude and drifted 224 km NW on 17 April. KVERT reported a plume of resuspended ash from the activity during 10-13 April on 19 April that rose to 3.5-4 km altitude and drifted 146-204 km WNW. During 21-22 April a plume stretched over the Scandinavian Peninsula. A gas-and-steam plume containing some ash rose to 3-3.5 km altitude and drifted 60 km SE on 30 April. A possible new lava dome was visible on the W slope of the volcano on 29-30 April (figure 99); satellite data showed two thermal anomalies, a bright one over the existing lava dome and a weaker one over the possible new one.
References. Girina, O., Loupian, E., Horvath, A., Melnikov, D., Manevich, A., Nuzhdaev, A., Bril, A., Ozerov, A., Kramareva, L., Sorokin, A., 2023, Analysis of the development of the paroxysmal eruption of Sheveluch volcano on April 10–13, 2023, based on data from various satellite systems, ??????????? ???????? ??? ?? ???????, 20(2).
Geologic Background. The high, isolated massif of Sheveluch volcano (also spelled Shiveluch) rises above the lowlands NNE of the Kliuchevskaya volcano group. The 1,300 km3 andesitic volcano is one of Kamchatka's largest and most active volcanic structures, with at least 60 large eruptions during the Holocene. The summit of roughly 65,000-year-old Stary Shiveluch is truncated by a broad 9-km-wide late-Pleistocene caldera breached to the south. Many lava domes occur on its outer flanks. The Molodoy Shiveluch lava dome complex was constructed during the Holocene within the large open caldera; Holocene lava dome extrusion also took place on the flanks of Stary Shiveluch. Widespread tephra layers from these eruptions have provided valuable time markers for dating volcanic events in Kamchatka. Frequent collapses of dome complexes, most recently in 1964, have produced debris avalanches whose deposits cover much of the floor of the breached caldera.
Information Contacts: Kamchatka Volcanic Eruptions Response Team (KVERT), Far Eastern Branch, Russian Academy of Sciences, 9 Piip Blvd., Petropavlovsk-Kamchatsky, 683006, Russia (URL: http://www.kscnet.ru/ivs/kvert/); Institute of Volcanology and Seismology, Far Eastern Branch, Russian Academy of Sciences (IVS FEB RAS), 9 Piip Blvd., Petropavlovsk-Kamchatsky 683006, Russia (URL: http://www.kscnet.ru/ivs/eng/); Kamchatka Volcanological Station, Kamchatka Branch of Geophysical Survey, (KB GS RAS), Klyuchi, Kamchatka Krai, Russia (URL: http://volkstat.ru/); Hawai'i Institute of Geophysics and Planetology (HIGP) - MODVOLC Thermal Alerts System, School of Ocean and Earth Science and Technology (SOEST), Univ. of Hawai'i, 2525 Correa Road, Honolulu, HI 96822, USA (URL: http://modis.higp.hawaii.edu/); MIROVA (Middle InfraRed Observation of Volcanic Activity), a collaborative project between the Universities of Turin and Florence (Italy) supported by the Centre for Volcanic Risk of the Italian Civil Protection Department (URL: http://www.mirovaweb.it/); Copernicus Browser, Copernicus Data Space Ecosystem, European Space Agency (URL: https://dataspace.copernicus.eu/browser/); Kam 24 News Agency, 683032, Kamchatka Territory, Petropavlovsk-Kamchatsky, Vysotnaya St., 2A (URL: https://kam24.ru/news/main/20230411/96657.html#.Cj5Jrky6.dpuf); Simon Carn, Geological and Mining Engineering and Sciences, Michigan Technological University, 1400 Townsend Drive, Houghton, MI 49931, USA (URL: http://www.volcarno.com/, Twitter: @simoncarn).
Bezymianny
Russia
55.972°N, 160.595°E; summit elev. 2882 m
All times are local (unless otherwise noted)
Explosions, ash plumes, lava flows, and avalanches during November 2022-April 2023
Bezymianny is located on the Kamchatka Peninsula of Russia as part of the Klyuchevskoy volcano group. Historic eruptions began in 1955 and have been characterized by dome growth, explosions, pyroclastic flows, ash plumes, and ashfall. During the 1955-56 eruption a large open crater was formed by collapse of the summit and an associated lateral blast. Subsequent episodic but ongoing lava-dome growth, accompanied by intermittent explosive activity and pyroclastic flows, has largely filled the 1956 crater. The current eruption period began in December 2016 and more recent activity has consisted of strong explosions, ash plumes, and thermal activity (BGVN 47:11). This report covers activity during November 2022 through April 2023, based on weekly and daily reports from the Kamchatka Volcano Eruptions Response Team (KVERT) and satellite data.
Activity during November and March 2023 was relatively low and mostly consisted of gas-and-steam emissions, occasional small collapses that generated avalanches along the lava dome slopes, and a persistent thermal anomaly over the volcano that was observed in satellite data on clear weather days. According to the Tokyo VAAC and KVERT, an explosion produced an ash plume that rose to 6 km altitude and drifted 25 km NE at 1825 on 29 March.
Gas-and-steam emissions, collapses generating avalanches, and thermal activity continued during April. According to two Volcano Observatory Notice for Aviation (VONA) issued on 2 and 6 April (local time) ash plumes rose to 3 km and 3.5-3.8 km altitude and drifted 35 km E and 140 km E, respectively. Satellite data from KVERT showed weak ash plumes extending up to 550 km E on 2 and 5-6 April.
A VONA issued at 0843 on 7 April described an ash plume that rose to 4.5-5 km altitude and drifted 250 km ESE. Later that day at 1326 satellite data showed an ash plume that rose to 5.5-6 km altitude and drifted 150 km ESE. A satellite image from 1600 showed an ash plume extending as far as 230 km ESE; KVERT noted that ash emissions were intensifying, likely due to avalanches from the growing lava dome. The Aviation Color Code (ACC) was raised to Red (the highest level on a four-color scale). At 1520 satellite data showed an ash plume rising to 5-5.5 km altitude and drifting 230 km ESE. That same day, Kamchatka Volcanological Station (KVS) volcanologists traveled to Ambon to collect ash; they reported that a notable eruption began at 1730, and within 20 minutes a large ash plume rose to 10 km altitude and drifted NW. KVERT reported that the strong explosive phase began at 1738. Video and satellite data taken at 1738 showed an ash plume that rose to 10-12 km altitude and drifted up to 2,800 km SE and E. Explosions were clearly audible 20 km away for 90 minutes, according to KVS. Significant amounts of ash fell at the Apakhonchich station, which turned the snow gray; ash continued to fall until the morning of 8 April. In a VONA issued at 0906 on 8 April, KVERT stated that the explosive eruption had ended; ash plumes had drifted 2,000 km E. The ACC was lowered to Orange (the third highest level on a four-color scale). The KVS team saw a lava flow on the active dome once the conditions were clear that same day (figure 53). On 20 April lava dome extrusion was reported; lava flows were noted on the flanks of the dome, and according to KVERT satellite data, a thermal anomaly was observed in the area. The ACC was lowered to Yellow (the second lowest on a four-color scale).
Satellite data showed an increase in thermal activity beginning in early April 2023. A total of 31 thermal hotspots were detected by the MODVOLC thermal algorithm on 4, 5, 7, and 12 April 2023. The elevated thermal activity resulted from an increase in explosive activity and the start of an active lava flow. The MIROVA (Middle InfraRed Observation of Volcanic Activity) volcano hotspot detection system based on the analysis of MODIS data also showed a pulse in thermal activity during the same time (figure 54). Infrared satellite imagery captured a continuous thermal anomaly at the summit crater, often accompanied by white gas-and-steam emissions (figure 55). On 4 April 2023 an active lava flow was observed descending the SE flank.
Geologic Background. The modern Bezymianny, much smaller than its massive neighbors Kamen and Kliuchevskoi on the Kamchatka Peninsula, was formed about 4,700 years ago over a late-Pleistocene lava-dome complex and an edifice built about 11,000-7,000 years ago. Three periods of intensified activity have occurred during the past 3,000 years. The latest period, which was preceded by a 1,000-year quiescence, began with the dramatic 1955-56 eruption. This eruption, similar to that of St. Helens in 1980, produced a large open crater that was formed by collapse of the summit and an associated lateral blast. Subsequent episodic but ongoing lava-dome growth, accompanied by intermittent explosive activity and pyroclastic flows, has largely filled the 1956 crater.
Information Contacts: Kamchatka Volcanic Eruptions Response Team (KVERT), Far Eastern Branch, Russian Academy of Sciences, 9 Piip Blvd., Petropavlovsk-Kamchatsky, 683006, Russia (URL: http://www.kscnet.ru/ivs/kvert/); Kamchatka Volcanological Station, Kamchatka Branch of Geophysical Survey, (KB GS RAS), Klyuchi, Kamchatka Krai, Russia (URL: http://volkstat.ru/); Hawai'i Institute of Geophysics and Planetology (HIGP) - MODVOLC Thermal Alerts System, School of Ocean and Earth Science and Technology (SOEST), Univ. of Hawai'i, 2525 Correa Road, Honolulu, HI 96822, USA (URL: http://modis.higp.hawaii.edu/); MIROVA (Middle InfraRed Observation of Volcanic Activity), a collaborative project between the Universities of Turin and Florence (Italy) supported by the Centre for Volcanic Risk of the Italian Civil Protection Department (URL: http://www.mirovaweb.it/); Copernicus Browser, Copernicus Data Space Ecosystem, European Space Agency (URL: https://dataspace.copernicus.eu/browser/).
Chikurachki
Russia
50.324°N, 155.461°E; summit elev. 1781 m
All times are local (unless otherwise noted)
New explosive eruption during late January-early February 2023
Chikurachki, located on Paramushir Island in the northern Kuriles, has had Plinian eruptions during the Holocene. Lava flows have reached the sea and formed capes on the NW coast; several young lava flows are also present on the E flank beneath a scoria deposit. Reported eruptions date back to 1690, with the most recent eruption period occurring during January through October 2022, characterized by occasional explosions, ash plumes, and thermal activity (BGVN 47:11). This report covers a new eruptive period during January through February 2023 that consisted of ash explosions and ash plumes, based on information from the Kamchatka Volcanic Eruptions Response Team (KVERT) and satellite data.
According to reports from KVERT, an explosive eruption began around 0630 on 29 January. Explosions generated ash plumes that rose to 3-3.5 km altitude and drifted 6-75 km SE and E, based on satellite data. As a result, the Aviation Color Code (ACC) was raised to Orange (the second highest level on a four-color scale). At 1406 and 1720 ash plumes were identified in satellite images that rose to 4.3 km altitude and extended 70 km E. By 2320 the ash plume had dissipated. A thermal anomaly was visible at the volcano on 31 January, according to a satellite image, and an ash plume was observed drifting 66 km NE.
Occasional explosions and ash plumes continued during early February. At 0850 on 1 February an ash plume rose to 3.5 km altitude and drifted 35 km NE. Satellite data showed an ash plume that rose to 3.2-3.5 km altitude and drifted 50 km NE at 1222 later that day (figure 22). A thermal anomaly was detected over the volcano during 5-6 February and ash plumes drifted as far as 125 km SE, E, and NE. Explosive events were reported at 0330 on 6 February that produced ash plumes rising to 4-4.5 km altitude and drifting 72-90 km N, NE, and ENE. KVERT noted that the last gas-and steam plume that contained some ash was observed on 8 February and drifted 55 km NE before the explosive eruption ended. The ACC was lowered to Yellow and then Green (the lowest level on a four-color scale) on 18 February.
Geologic Background. Chikurachki, the highest volcano on Paramushir Island in the northern Kuriles, is a relatively small cone constructed on a high Pleistocene edifice. Oxidized basaltic-to-andesitic scoria deposits covering the upper part of the young cone give it a distinctive red color. Frequent basaltic Plinian eruptions have occurred during the Holocene. Lava flows have reached the sea and formed capes on the NW coast; several young lava flows are also present on the E flank beneath a scoria deposit. The Tatarinov group of six volcanic centers is located immediately to the south, and the Lomonosov cinder cone group, the source of an early Holocene lava flow that reached the saddle between it and Fuss Peak to the west, lies at the southern end of the N-S-trending Chikurachki-Tatarinov complex. In contrast to the frequently active Chikurachki, the Tatarinov centers are extensively modified by erosion and have a more complex structure. Tephrochronology gives evidence of an eruption around 1690 CE from Tatarinov, although its southern cone contains a sulfur-encrusted crater with fumaroles that were active along the margin of a crater lake until 1959.
Information Contacts: Kamchatka Volcanic Eruptions Response Team (KVERT), Far East Division, Russian Academy of Sciences, 9 Piip Blvd., Petropavlovsk-Kamchatsky, 683006, Russia (URL: http://www.kscnet.ru/ivs/); Copernicus Browser, Copernicus Data Space Ecosystem, European Space Agency (URL: https://dataspace.copernicus.eu/browser/).
Search Bulletin Archive by Publication Date
Select a month and year from the drop-downs and click "Show Issue" to have that issue displayed in this tab.
The default month and year is the latest issue available.
Bulletin of the Global Volcanism Network - Volume 25, Number 10 (October 2000)
Managing Editor: Richard Wunderman
Aira (Japan)
Explosion, lapilli and ash fall; pilot encounters ash cloud on 7 October
Altar (Ecuador)
A summit block crashing into the caldera lake on 13 October triggers a deadly debris flow
Batur (Indonesia)
Frequent ash emissions and explosions since August 1999
Bezymianny (Russia)
Large ash explosions in late October; hazard status reaches orange
Ijen (Indonesia)
Low-medium density ash emission; elevated seismicity with continuous tremor
Karthala (Comoros)
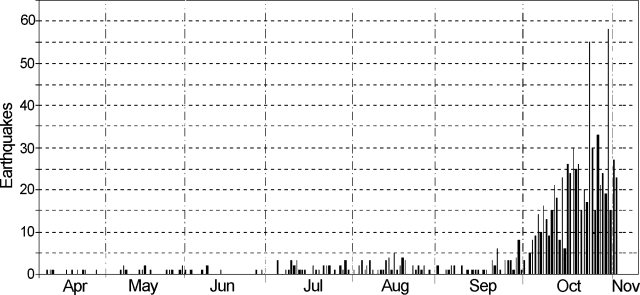
Increased seismicity during July-September; dramatic increase in October
Kilauea (United States)
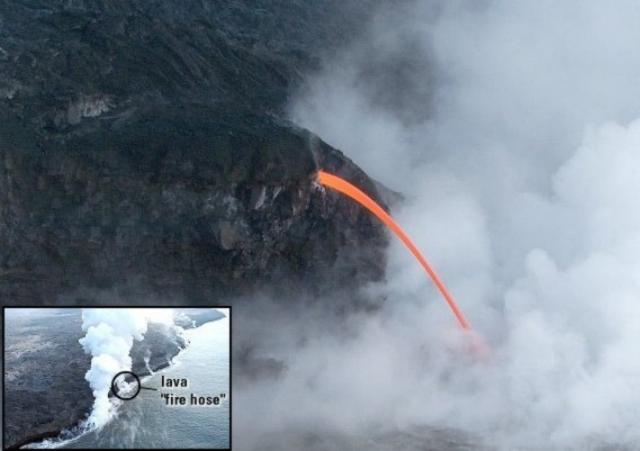
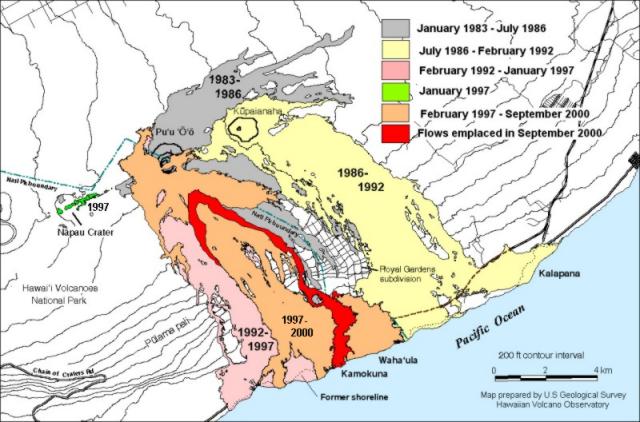
Continued lava production during late-July to mid-November; two hikers dead
Lokon-Empung (Indonesia)
May-October seismic unrest, modest ash clouds, and lava fountains
Popocatepetl (Mexico)
Increased gas-and-ash emissions in early November elevates hazard status
Raung (Indonesia)
9 July ash plume ends 3-year interval without reported eruptions
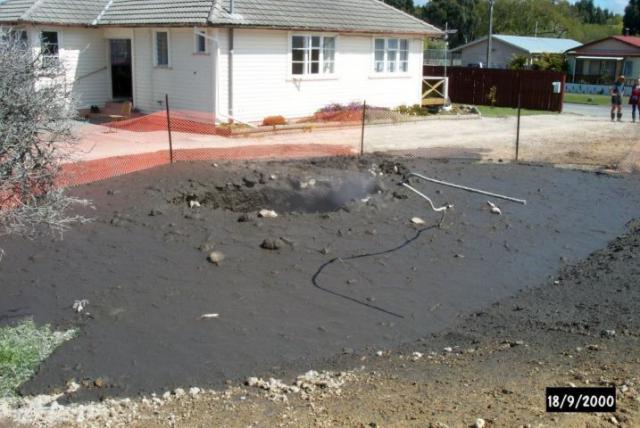
Rotorua (New Zealand)
Additional details about the 18 September 2000 hydrothermal eruption
Soputan (Indonesia)
Lava dome growth continues; Strombolian and ash eruptions from summit crater
Villarrica (Chile)
During 2000 a still-active lava lake, occasional outbursts, and increased lahar risks
Aira
Japan
31.5772°N, 130.6589°E; summit elev. 1117 m
All times are local (unless otherwise noted)
Explosion, lapilli and ash fall; pilot encounters ash cloud on 7 October
According to observation reports by the Japan Meteorological Agency (JMA), Minami-dake, the southernmost crater of Sakura-jima, erupted at 1642 on 7 October, marking the 132nd explosion this year. The eruption column reached 5 km above the crater, and was accompanied by volcanic lightning 18 times. The maximum amplitude of the earthquake associated with the explosion was 4 µm at the JMA observation point 4.6 km WNW of Minami-dake. Abundant ash fell over the central and northern sections of Kagoshima. Lapilli with a maximum size of 3 cm fell on the NW portion of the island, breaking 35 car windshields.
A pilot en route from Guam to Fukuoka received a dispatch warning of a major ash cloud in the flight path. The pilot saw the cloud clearly at a distance of 80 km from Sakura-jima and noted a small white plume over the summit. The pilot also observed a brown-red cloud downwind and SE of the volcano at an altitude of 2.5 km. As the aircraft approached, the plume grew suddenly larger and became dark gray during an eruption of ~30-45 seconds duration. The pilot deviated 19 km to the W while descending and flew past the cloud at an altitude of 5.5 km. After passing safely, the pilot observed the ash cloud diffusing ~100 km downwind at an altitude level with the summit. This incident highlights the importance of efficient information relay from field observers through a dispatch to pilots in order to avoid potentially hazardous in-flight ash encounters. As of 17 October no distinct changes in activity at Sakura-jima have been observed, although a small number of volcanic earthquakes have occurred.
Reference. Casadevall, T.J., 1994, Volcanic ash and aviation safety: Proceedings of the First International Symposium on Volcanic Ash and Aviation Safety: U.S. Geological Survey Bulletin 2047.
Geologic Background. The Aira caldera in the northern half of Kagoshima Bay contains the post-caldera Sakurajima volcano, one of Japan's most active. Eruption of the voluminous Ito pyroclastic flow accompanied formation of the 17 x 23 km caldera about 22,000 years ago. The smaller Wakamiko caldera was formed during the early Holocene in the NE corner of the caldera, along with several post-caldera cones. The construction of Sakurajima began about 13,000 years ago on the southern rim and built an island that was joined to the Osumi Peninsula during the major explosive and effusive eruption of 1914. Activity at the Kitadake summit cone ended about 4,850 years ago, after which eruptions took place at Minamidake. Frequent eruptions since the 8th century have deposited ash on the city of Kagoshima, located across Kagoshima Bay only 8 km from the summit. The largest recorded eruption took place during 1471-76.
Information Contacts: JMA-Fukuoka, Japan Meteorological Agency (JMA), 1-3-4 Ote-machi, Chiyoda-ku, Tokyo 100, Japan; Setsuya Nakada, Volcano Research Center, ERI, University of Tokyo, Yayoi 1-1-1, Bunkyo-ku, Tokyo 113, Japan (URL: http://www.eri.u-tokyo.ac.jp/VRC/index_E.html).
Altar
Ecuador
1.67°S, 78.42°W; summit elev. 5321 m
All times are local (unless otherwise noted)
A summit block crashing into the caldera lake on 13 October triggers a deadly debris flow
This report is based on field work conducted at Altar during 23-25 October. At 0558 on 13 October a large block of andesitic breccia with a volume of ~1.5 x 10⁶ m3 broke from the N wall of La Monja Grande (The Great Nun), a snow- and ice-covered peak near the summit of the Plio-Pleistocene stratovolcano Altar. The catastrophic fall was likely facilitated by frost wedging that slowly developed and enlarged fractures throughout the rock. The block fell 900 m and landed in the E end of Laguna Amarilla (Yellow Lagoon) within the summit caldera. The impact to the lake generated an initial wave 50 m in height and smaller successive waves that ejected 1.5-3.0 x 10⁶ m3 of water and sent it hurtling down the W side of the mountain.
The water eroded the slope along its path and picked up glacial moraine material, mud, and large blocks, becoming a debris flow. The flow advanced swiftly into the valley of Collanes, collecting more sediment as it progressed. Blocks up to 7 m in diameter were deposited 300 m from the caldera, and 1-m-diameter blocks dropped out at a distance of 1,500 m. The bottom of the valley, at an elevation of 3,950 m, was coated with mud to a height of 20 m. In less than 2 minutes, the flow reached a narrow section near the end of the valley, causing an increase in velocity. The flow destroyed three of four houses located in the Able Urco community, and swept away livestock, including 80 cows and 23 horses. The flow reached the Blanco River and eroded the banks of this section up to 30 m in height. Thirteen people were killed by the oncoming flow before it reached the Chambo River, where the valley widens. This caused a decrease in flow velocity and deposition of material in an alluvial fan. The fan managed to partially dam the river, temporarily creating a lagoon of 1.5 km in length.
Geologic Background. Altar is a large stratovolcano of Plio-Pleistocene age with a caldera breached to the west (Hall 1987, pers. comm.). Indian legends report that the top of Altar collapsed after seven years of activity in about 1460, but the caldera is considered to be older than this (Catalog of Active Volcanoes of the World, Hall, 1977).
Information Contacts: Minard Hall (IG-EPN); Bernardo Beate (IG-EPN); Jean-Philippe Eissen (IG-EPN, IRD); Bernard Francou (IRD, INAMHI), and Bolivar Cáceres (INAMHI): Instituto Geofísico, Escuela Politécnica Nacional (IG-EPN), Apartado 17-01-2759, Quito, Ecuador (URL: http://www.igepn.edu.ec/); Instituto Nacional Meteorología e Hidrología (INAMHI), Iñaquito 700 y Corea, Quito-Ecuador 16-310 (URL: http://www.inamhi.gov.ec/); Institut de Recherche pour le Développement (IRD) (URL: http://www.ird.fr/fr/).
Batur (Indonesia) — October 2000 Cite this Report
Batur
Indonesia
8.2403°S, 115.3775°E; summit elev. 1711 m
All times are local (unless otherwise noted)
Frequent ash emissions and explosions since August 1999
Intermittent explosive activity has continued since July 1999 (BGVN 24:06). The following report covers the periods of August-September 1999, February-June 2000, and August-September 2000. Reports were not available for the interim periods. However, there was no activity on 20 July 2000 (figure 2) when participants attending the IAVCEI General Assembly visited the caldera (see Sutawidjaja, 2000).
In August 1999, Batur Post Observatory (BPO) observed frequent ash emissions and small explosions. Ash eruptions varied in height from 5 to 150 m above the volcano's crater rim. Some explosive events were accompanied by ejection of lava; the material rose 10-25 m, and incandescence could be observed at night. Explosion earthquakes dominated seismicity, which increased relative to the previous month. Frequent rumbling of varying intensity could be heard in the vicinity of Batur. During September, ash ejection increased in height, ranging from 25 to 250 m. Incandescent material continued to erupt from the crater. Seismicity continued to increase; seismographs recorded explosion earthquakes with amplitudes of 2-28 mm.
Ash emission, lava ejection, and mild explosions occurred during February 2000. Ash rose 25-250 m above the summit. Ejection of molten material accompanied some explosions. Rumbling could be heard frequently around the volcano. Overall seismicity was lower than in September 1999; fewer explosion earthquakes and slightly more shallow volcanic (B-type) earthquakes occurred. In the middle of the month, a gray ash plume rose up to 300 m above the summit. Ejected material fell up to 50 m from the center of the crater. By the end of February, ash emissions rose 10-50 m above the summit. Explosion frequency and intensity decreased. Low-density, white ash-and-gas emissions rose up to 75 m in early March. In mid-March the ash plume rose 10-25 m. Audible rumbling ceased, and seismicity decreased substantially.
On 22-23 March, a large explosion issued from the crater; ejecta were sent 200 m above the rim and rained back down within the crater. Seismicity increased along with the frequency of explosion earthquakes. Explosions and ash emissions continued into April, when ash and explosion debris reached up to 300 m in height, and rumbling resumed. Seismicity decreased by the end of the month. By early May, emission had decreased to a low-density, white ash-and-gas plume and rose 5-25 m above the crater rim. Rumbling ceased. Similar emissions and seismicity remained through the end of June. During August-September, a low-density, white plume rose up to 10 m above the crater rim, and seismicity maintained relatively low levels.
Reference. Sutawidjaja, Igan S., 2000, A guide to the geological phenomena of Batur Caldera, Bali, Indonesia: Fieldtrip guide prepared for the IAVCEI General Assembly, Bali, Indonesia, 33 p.
Geologic Background. The historically active Batur is located at the center of two concentric calderas NW of Agung volcano. The outer 10 x 13.5 km caldera was formed during eruption of the Bali (or Ubud) Ignimbrite about 29,300 years ago and now contains a caldera lake on its SE side, opposite the Gunung Abang cone, the topographic high of the complex. The inner 6.4 x 9.4 km caldera was formed about 20,150 years ago during eruption of the Gunungkawi Ignimbrite. The SE wall of the inner caldera lies beneath Lake Batur; Batur cone has been constructed within the inner caldera to a height above the outer caldera rim. The Batur stratovolcano has produced vents over much of the inner caldera, but a NE-SW fissure system has localized the Batur I, II, and III craters along the summit ridge. Recorded eruptions have been characterized by mild-to-moderate explosive activity sometimes accompanied by lava emission. Basaltic lava flows from both summit and flank vents have reached the caldera floor and the shores of Lake Batur in historical time.
Information Contacts: Dali Ahmad, Volcanological Survey of Indonesia (VSI), Jalan Diponegoro No. 57, Bandung 40122, Indonesia (URL: http://www.vsi.esdm.go.id/).
Bezymianny (Russia) — October 2000 Cite this Report
Bezymianny
Russia
55.972°N, 160.595°E; summit elev. 2882 m
All times are local (unless otherwise noted)
Large ash explosions in late October; hazard status reaches orange
A 4-pixel thermal anomaly, initially detected in satellite images by the Alaska Volcano Observatory (AVO) on 21 September (BGVN 25:09), continued to be observed on 20 October. Each pixel in the center of an AVHRR satellite image is a 1.1-km square, but the pixel dimensions are significantly larger toward the image edge. In the case at hand, the pixel locations within the image were toward the edge, and could have a maximum dimension of 2.3 km x 5.5 km. On 21 October, a fumarolic plume rose 50 m above the volcano and extended E. On 25 October, a fumarolic plume rose to a height of 50 m and drifted 20 km S. Since then, seismic data indicated that hot rock avalanches may have descended from Bezymianny's dome. A few small shallow earthquakes per day occurred beneath the volcano during 20-26 October. Spasmodic seismic tremor was registered during 2040-2100 on 26 October, but was difficult to analyze because of a malfunctioning seismic station. The volcano's hazard status remained at Yellow.
Energy from B-type earthquakes increased beginning at 0115 on 28 October. The thermal anomaly grew to 8 pixels in size with 4 pixels at a saturation temperature of 50°C according to satellite imagery at 0632 on 30 October, and the hazard status was increased to Orange. At 0810 a gas-and-steam plume rose 1,000 m above the volcano and extended NE. Seismic activity increased after 2300 with the most intense seismicity recorded on 31 October during 0146-0215. A distinct explosive event, however, was not detected in the seismic data. AVHRR satellite data from an image at 0600 on 31 October showed an ash plume extending ~80 km SE. It was not possible to estimate the height of the plume. According to a visual report from Koziyrevsk at 0730 on 31 October, a gas-and-steam plume rose 1.5 km above the summit and extended to the SE. At 1210 an ash-poor plume rose 3 km above the volcano. A gas-and-steam plume rose 1 km at 1330, and another plume reached 2 km at 1515.
An image from 1506 on 31 October showed an ash-poor plume extending ~40 km NE of Bezymianny. A larger diffuse cloud was seen off the east coast of Kamchatka and seemed to be continuous with the more distinct plume emanating from the volcano. It extended ~250 km SE, but did not appear to contain an ash component. Intense seismicity was registered during 0320-0400 and at 0626 on 2 November. A satellite image from 0626 showed an ash plume with an estimated altitude of ~3,600 m that extended 50 km W, then 130 km SW of the volcano. A visual report from Koziyrevsk at 0800 indicated that a gas-and-steam plume rose 1 km above the summit and extended SW. At 0842, a gas-and-ash plume reached 1.5 km above the volcano and also extended SW. Seismicity began to decrease beginning at 1200. A satellite image from 1650 revealed a 250-km-long ash plume that drifted ~300 km SW of Bezymianny, centered over the lower third of the Kamchatkan Peninsula. An image from 0618 on 3 November showed that by then the plume reached only ~30 km SW. According to a Koziyrevsk visual report at 1355, a gas-and-steam plume rose 1 km above the volcano. Volcanic ash advisory statements were issued to aviators during 2-3 November, and indicated that aircraft needed to ascend above 6,000 m altitude or divert around the ash plume. Satellite imagery indicated that the ash cloud was moving at up to 37 km/hour SW to WSW. The hazard status for Bezymianny decreased from Orange to Yellow as of 3 November.
Seismicity decreased to background levels by the week of 3-9 November. From 3-6 November, a gas-and-steam plume rose 1-2 km above the summit and extended 20-60 km to the SE. A gas-and-steam plume rose 500 m on 7 November. The hazard status for the volcano was decreased from Yellow to Green on 10 November. AVHRR satellite data from AVO at 0634 on 12 November showed that the thermal anomaly was now only one pixel in size. A gas-and-steam plume rose 100 m above the volcano and extended SE on 16 November. The hazard status for Bezymianny remained at Green on 17 November.
Geologic Background. The modern Bezymianny, much smaller than its massive neighbors Kamen and Kliuchevskoi on the Kamchatka Peninsula, was formed about 4,700 years ago over a late-Pleistocene lava-dome complex and an edifice built about 11,000-7,000 years ago. Three periods of intensified activity have occurred during the past 3,000 years. The latest period, which was preceded by a 1,000-year quiescence, began with the dramatic 1955-56 eruption. This eruption, similar to that of St. Helens in 1980, produced a large open crater that was formed by collapse of the summit and an associated lateral blast. Subsequent episodic but ongoing lava-dome growth, accompanied by intermittent explosive activity and pyroclastic flows, has largely filled the 1956 crater.
Information Contacts: Olga Chubarova, Kamchatka Volcanic Eruptions Response Team (KVERT), Institute of Volcanic Geology and Geochemistry, Piip Ave. 9, Petropavlovsk-Kamchatsky, 683006, Russia; Tom Miller, Alaska Volcano Observatory (AVO), a cooperative program of a) U.S. Geological Survey, 4200 University Drive, Anchorage, AK 99508-4667, USA (URL: http://www.avo.alaska.edu/), b) Geophysical Institute, University of Alaska, PO Box 757320, Fairbanks, AK 99775-7320, USA, and c) Alaska Division of Geological & Geophysical Surveys, 794 University Ave., Suite 200, Fairbanks, AK 99709, USA; Tokyo VAAC, Tokyo, Japan (URL: https://ds.data.jma.go.jp/svd/vaac/data/).
Ijen
Indonesia
8.058°S, 114.242°E; summit elev. 2769 m
All times are local (unless otherwise noted)
Low-medium density ash emission; elevated seismicity with continuous tremor
This report covers the period June-October 2000. During mid-June, seismographs recorded an increasing number of earthquakes. A white, variable-density ash plume rose 25 m above Ijen's summit. Volcanic and tremor earthquakes occurred with amplitudes of ~0.5-4 mm. In late July, the number of volcanic and tremor earthquakes increased.
Ash erupted once during late August-early September. A medium-density ash cloud rose up to 50 m above the crater during the second week in September. The following week, the ash emission changed to a low-density plume and rose 25 m.
In late September, seismographs registered an increase in shallow volcanic (B-type) earthquakes and the initiation of continuous tremor. Visual observations were not available for late September and parts of October because of inclement weather. Tremor became discontinuous by the end of October, and elevated seismicity continued.
Geologic Background. The Ijen volcano complex at the eastern end of Java consists of a group of small stratovolcanoes constructed within the 20-km-wide Ijen (Kendeng) caldera. The north caldera wall forms a prominent arcuate ridge, but elsewhere the rim was buried by post-caldera volcanoes, including Gunung Merapi, which forms the high point of the complex. Immediately west of the Gunung Merapi stratovolcano is the historically active Kawah Ijen crater, which contains a nearly 1-km-wide, turquoise-colored, acid lake. Kawah Ijen is the site of a labor-intensive mining operation in which baskets of sulfur are hand-carried from the crater floor. Many other post-caldera cones and craters are located within the caldera or along its rim. The largest concentration of cones forms an E-W zone across the southern side of the caldera. Coffee plantations cover much of the caldera floor; nearby waterfalls and hot springs are tourist destinations.
Information Contacts: Dali Ahmad, Volcanological Survey of Indonesia (VSI), Jalan Diponegoro No. 57, Bandung 40122, Indonesia (URL: http://www.vsi.esdm.go.id/).
Karthala (Comoros) — October 2000 Cite this Report
Karthala
Comoros
11.75°S, 43.38°E; summit elev. 2361 m
All times are local (unless otherwise noted)
Increased seismicity during July-September; dramatic increase in October
During July, August, and September 2000, seismic activity at Karthala increased from a background level of less than 10 events/month to almost 40 events/month (figure 5). This increase accelerated at the beginning of October, gradually reaching 20 events/day by 15 October. The seismicity, characterized by events located at shallow depths (2-3 km) under the summit caldera, continued at the same rate through the beginning of November. These events were generally minor. However, more significant seismicity was recorded during the night of 22-23 October. This seismic activity showed significant daily variations; a swarm of 17 earthquakes was recorded on 30 October within a period of 15 minutes. Observations by A. Lemarchand (Karthala Volcanological Observatory) allowed the documentation of a very clear increase in the level of the lake that formed in the Chougou Chahalé crater since the July 1991 phreatic eruption.
Reuters reported that the inhabitants of Grande Comore, the main island of the Comoros group, were warned on 29 October 2000 that their island's volcano could soon erupt. In messages read on state radio, the Comoros government warned islanders to be vigilant and to avoid the area around the volcano.
Geologic Background. The southernmost and largest of the two shield volcanoes forming Grand Comore Island (also known as Ngazidja Island), Karthala contains a 3 x 4 km summit caldera generated by repeated collapse. Elongated rift zones extend to the NNW and SE from the summit of the Hawaiian-style basaltic shield, which has an asymmetrical profile that is steeper to the S. The lower SE rift zone forms the Massif du Badjini, a peninsula at the SE tip of the island. Historical eruptions have modified the morphology of the compound, irregular summit caldera. More than twenty eruptions have been recorded since the 19th century from the summit caldera and vents on the N and S flanks. Many lava flows have reached the sea on both sides of the island. An 1860 lava flow from the summit caldera traveled ~13 km to the NW, reaching the W coast to the N of the capital city of Moroni.
Information Contacts: A. Lemarchand, Observatoire Volcanologique du Karthala, Centre National de Documentation et de la Recherche Scientifique des Comores (CNDRS), BP 169, Moroni, République Fédérale Islamique des Comores (URL: http://volcano.ipgp.jussieu.fr/karthala/stationkar.html); P. Bachélery, Département des Sciences de la Terre, Université de la Réunion, BP 7151, 15 Avenue Rene Cassin, 97715 Saint Denis Cedex 9, La Réunion, France; Reuters news service.
Kilauea (United States) — October 2000 Cite this Report
Kilauea
United States
19.421°N, 155.287°W; summit elev. 1222 m
All times are local (unless otherwise noted)
Continued lava production during late-July to mid-November; two hikers dead
The entry of lava into the ocean and the frequent surface flows that occurred from May until mid-July 2000 (BGVN 25:06) continued during late-July to November, the interval discussed in this report. In overview, this interval included several key events. First, during 24-26 August, lava entry along the coast paused. Second, after renewed lava breakout from the tube, the point of lava entry into the sea shifted from the Waha`ula to the Kamokuna area. Third, during 24-25 September, a surge of magma caused a brief period of summit inflation and subsequent deflation. Finally, on 5 November, the bodies of two hikers were found near the sea.
During the end of July lava flowed into the sea mainly at the Waha`ula, Kamokuna, and E coastal entries. Surface flows and inflating pahoehoe flows were abundant, especially on the E edge of the flow field. During 29-31 July a swarm of small (M 2-3), shallow (0-5 km depth) earthquakes occurred just NW of the Hawaiian Volcano Observatory (HVO) in the area of Namakani Paio and the lower Ka`oiki fault system. On 31 July two new vents were observed in the E half of Pu`u `O`o crater, marking the first notable change in the crater in several months. Lava was observed streaming into the sea from atop the narrow bench below the sea cliff in the form of a "fire hose," with the lava stream entering the water ~10 m from the base of the 12- to 15-m-tall cliff (figure 149).
Volcanic activity during most of August was similar to activity in July, i.e. lava flowing into the ocean and several surface flows. Seismicity on the lower SW rift zone, which had begun with a swarm of earthquakes on 19-20 July, increased again during 1-3 August. The swarm consisted of small earthquakes at moderate depths (typically 10-20 km), accompanied by occasional bursts of deep tremor. On 12 August the volcanic tremor near Pu`u `O`o, which had been weak-to-moderate in early August, increased slightly, but returned to weak-to-moderate amplitude the next day. By mid-August the most active coastal entry site was Waha`ula, with little observable activity at the other recently active entry areas.
Pause in activity 24-26 August. A significant change in activity took place on the morning of 21 August when the flow of lava at the Waha'ula entry waned and then stopped. By 24 August all coastal activity, surface flows, and pahoehoe inflation ceased as well. This was the first pause in the delivery of lava to the surface since 11-14 November 1999. During the pause, Kīlauea's summit inflated slightly more than 4 µrad on 26 August as measured by two tiltmeters, one located across Crater Rim Drive from HVO and the other just N of Kīlauea Iki. At Pu`u `O`o cone, a tiltmeter measured an inflation of 3.5 µrad, which started ~5 hours after Kīlauea's summit began to rise. The Pu`u `O`o tiltmeter continued to detect inflation after the rate of summit tilting had drastically declined.
The pause in activity ended sometime on 26 August. Based upon tiltmeter measurements, the pause ended at 2145 that day. By then, tilting associated with inflation at Kīlauea's summit and Pu`u `O`o cone had stopped and may have reversed. Presumably at this time lava broke through to the surface, removing pressure on the plumbing system. In the past an increase in summit tilt has generally accompanied the onset of a pause, but in this case field observations suggested that the pause started about two days before the tilt began to change. Thus, HVO staff concluded that the observational pause lasted about 3 days, while the pause measured by the tiltmeters lasted ~20 hours. After the pause ended (27 August), lava extruded at ~700 m elevation (2,300-ft-elevation). This was the same spot below Pu`u `O`o where lava extruded prior to the pause.
During September lava flowed down Pulama pali and E across the coastal flat. During the afternoon of 23 September, lava reached the ocean for the first time since the August pause. It entered the ocean at the Kamokuna entry, located ~1.5 km WSW of Waha`ula, the previous main area of entry. Initially lava entered the sea sporadically and in very small amounts, but by the morning of 24 September a steady, small steam plume was being produced.
Surge of magma causes brief period of inflation. On the night of 24 September a surge of magma traveled down Kīlauea's E rift zone from the summit reservoir to Pu`u `O`o cone. At 2100 tiltmeters at the summit began to record steep inflation, and about 20 minutes later the tiltmeter on Pu`u `O`o also showed inflation. After 48 minutes the summit abruptly began to deflate and at about 0200 on 25 September the Pu`u `O`o cone started to deflate, which is probably when the surge reached the eruption site.
There were reports of a bright glow over Pu`u `O`o cone in the early morning hours of 25 September. The main source of the glow was from the large collapse pit in the West Gap of the cone where the lava had ponded. About the same time, fresh breakouts probably occurred from the overloaded tube system. Throughout the surge, lava entry at Kamokuna was unaffected and continued to produce a small steam plume. By 0830 lava escaped from a point at the 700 m elevation. Venting occurred in an area ~1km long and a few small breakouts also occurred along the tube at the top and bottom of the fault scarp (pali). By mid-morning, the activity diminished and, at about 1000, the pond inside the West Gap pit drained and did not refill. By 1300 the breakouts from the ~700-m-elevation point had greatly diminished and by 26 September the eruption returned to normal with the Kamokuna ocean entry persisting as an outlet and with additional scattered breakouts of lava on the costal plain (figure 150).
During October there were numerous surface flows and lava continued to enter the sea mainly at the Kamokuna entry. The state of the entry benches changed often, with several collapses accompanied by small littoral explosions. Volcanic tremor gradually increased beginning on 21 October, but returned to a moderate level by 23 October.
Volcanic activity during November was similar to that of the previous months, with lava entering the sea mainly at the Kamokuna entry. No major changes in seismicity occurred at the volcano, but for several hours on the night of 15 November a giant earthquake (M 8.0) in New Ireland, Papua New Guinea caused slow oscillations at Kīlauea's summit amounting to more than 12 µrad (peak-to-peak). Alarms at two tiltmeters were set off by the oscillation's large and comparatively rapid tilts.
At 1408 on 16 November tour pilots reported a large collapse of the bench at Kamokuna. About 30% of the bench disappeared in ~6 seconds as ~1 hectare separated from the rest of the bench along a crack that opened parallel to the shore and then the whole chunk calved off at once. A large explosion followed, with a significant amount of spatter and a big, billowing, mostly white plume that rose an estimated 600-1,800 m into the air. The interior of the bench, exposed by the collapse, was brightly incandescent.
Two deaths on 3 November. At about 1330 on 5 November the bodies of two hikers who died on 3 November were found ~6.4 km W of the end of Chain of Craters road. According to a press release from the National Park Service, the hikers' bodies were located above the sea cliff ~200 m from where lava was entering the ocean. A Park Service press release "ruled out death by [homicidal] violence or trauma" but officials were awaiting autopsy results before concluding the cause of death.
Geologic Background. Kilauea overlaps the E flank of the massive Mauna Loa shield volcano in the island of Hawaii. Eruptions are prominent in Polynesian legends; written documentation since 1820 records frequent summit and flank lava flow eruptions interspersed with periods of long-term lava lake activity at Halemaumau crater in the summit caldera until 1924. The 3 x 5 km caldera was formed in several stages about 1,500 years ago and during the 18th century; eruptions have also originated from the lengthy East and Southwest rift zones, which extend to the ocean in both directions. About 90% of the surface of the basaltic shield volcano is formed of lava flows less than about 1,100 years old; 70% of the surface is younger than 600 years. The long-term eruption from the East rift zone between 1983 and 2018 produced lava flows covering more than 100 km2, destroyed hundreds of houses, and added new coastline.
Information Contacts: Hawaiian Volcano Observatory (HVO), U.S. Geological Survey, PO Box 51, Hawaii National Park, HI 96718, USA (URL: https://volcanoes.usgs.gov/observatories/hvo/).
Lokon-Empung (Indonesia) — October 2000 Cite this Report
Lokon-Empung
Indonesia
1.358°N, 124.792°E; summit elev. 1580 m
All times are local (unless otherwise noted)
May-October seismic unrest, modest ash clouds, and lava fountains
This report covers activity during March-October 2000. Visual and seismic activity increased notably in mid-March, and the alert level for Lokon-Empung was set at 2 on a scale of 1-4. A very dense gas emission caused vegetation on the eastern slope to wither. During this period, 45 deep volcanic (A-type) earthquakes, 210 shallow volcanic (B-type) earthquakes, and 12 tectonic earthquakes occurred. Tompaluan crater emitted white medium-dense gas that rose 50-150 m above the crater rim in late March. Seismicity changed, with fewer volcanic and more tectonic earthquakes than in the previous weeks. At the beginning of April, the number of A-type earthquakes increased, but visual activity remained similar to the previous week.
The white medium-dense gas emission from Tompaluan crater increased in height to 50-200 m above the rim in the second week of April. B-type earthquakes still dominated seismicity. Seismic intensity of B-type earthquakes increased toward the end of April. Gas emission remained similar, but decreased in height to 50-150 m above the crater rim. During the second week in May, an ash plume rose 100 m above the rim of Tompaluan crater. A volcanic ash advisory was issued on 15 May to warn aviators of the ash cloud emanating from Lokon-Empung. The advisory indicated ash at an altitude of 3,000 m with the potential to rise to 5,600 m and drift to the W. In mid-May, ash explosions increased, sending a white medium-thick plume to 50-200 m above the crater rim. Seismicity peaked with 228 A-type events, 247 B-type events, and 46 tectonic events.
Activity reports did not resume until mid-June, when little visual change took place and seismicity decreased. By the end of June, the white ash plume reached up to 250 m in height, and volcanic earthquakes still dominated the seismicity. White, thin ash explosions reached up to 300 m above the crater rim in late July. Kakaskasen Post Observatory reported a red illumination at the summit, and subsequent observations suggested the operative phenomenon was lava fountaining. The number of volcanic earthquakes decreased, but continuous tremor initiated with amplitudes ranging from 0.5 to 26 mm. The alert level for Lokon-Empung was raised from 2 to 3.
Activity remained similar during 31 July-7 August. White variably dense ash clouds continued to rise to heights of up to 300 m, and lava fountaining up to 25 m above Tompaluan crater was visible during the first week of August. Tectonic earthquakes became dominant, and the amplitude of volcanic tremor reached 0.5 mm. Ash plumes rose to 500 m above the crater rim, and lava fountaining persisted in mid-August. Continuous tremor had amplitudes of 0.5-1 mm. The ash plumes decreased in height to 300 m above the crater the following week. A volcanic ash advisory was issued on 15 August for aviators in the vicinity of Lokon. The number of volcanic earthquakes increased slightly, and tremor decreased in amplitude to 0.5 mm.
Activity increased slightly in September. The ash plume reached progressively higher, ranging from 50 m to 350 m and eventually up to 400 m. Continuous tremor amplitude increased to 0.5-1 mm. Few volcanic earthquakes occurred, so tectonic earthquakes were dominant. The alert level for Lokon-Empung was decreased from 3 to 2 in early October, and activity decreased during the month. The white variably dense ash plume decreased in height to 250 m, although lava fountaining remained visible at a consistent height of 25 m. Seismicity also decreased, and tremor ceased by the end of October.
Geologic Background. The Lokong-Empung volcanic complex, rising above the plain of Tondano in North Sulawesi, includes four peaks and an active crater. Lokon, the highest peak, has a flat craterless top. The morphologically younger Empung cone 2 km NE has a 400-m-wide, 150-m-deep crater that erupted last in the 18th century. A ridge extending 3 km WNW from Lokon includes the Tatawiran and Tetempangan peaks. All eruptions since 1829 have originated from Tompaluan, a 150 x 250 m crater in the saddle between Lokon and Empung. These eruptions have primarily produced small-to-moderate ash plumes that sometimes damaged croplands and houses, but lava-dome growth and pyroclastic flows have also occurred.
Information Contacts: Dali Ahmad, Volcanological Survey of Indonesia (VSI), Jalan Diponegoro No. 57, Bandung 40122, Indonesia (URL: http://www.vsi.esdm.go.id/); Darwin Volcanic Ash Advisory Centre (VAAC), Bureau of Meteorology, Northern Territory Regional Office, PO Box 40050, Casuarina, NT 0811, Australia (URL: http://www.bom.gov.au/info/vaac/).
Popocatepetl (Mexico) — October 2000 Cite this Report
Popocatepetl
Mexico
19.023°N, 98.622°W; summit elev. 5393 m
All times are local (unless otherwise noted)
Increased gas-and-ash emissions in early November elevates hazard status
This report covers the period from 22 August to 4 November 2000 (table 13). Volcanic activity during this period generally was similar to that for the preceding summer months (BGVN 25:07). Steam-and-gas exhalations occurred frequently, with daily variations in intensity and duration. The reported number of daily exhalations varied from only a few to as many at 140 (12 September). Some exhalations included ash, several of the larger ones generated ash plumes 5 or 6 km above the crater and caused ash falls on towns downwind, including NW-flank towns. On 4 September ashfall reached the S limit of the capital. Seismic tremor was also common, both harmonic and high frequency, some of low amplitude and duration and others lasting from 30 minutes to several hours.
Table 13. Summary of Popocatépetl's activity during 22 August to 4 November 2000. Exhalations were seismically detected. The symbol x means tremors were reported (for stated duration). Courtesy of CENAPRED.
| Date |
Exhalations |
Description of other activity |
| 22-23 Aug 2000 |
increasing |
-- |
| 24 Aug 2000 |
steady |
-- |
| 25 Aug 2000 |
increasing |
-- |
| 26-27 Aug 2000 |
steady |
-- |
| 28 Aug 2000 |
increasing |
-- |
| 29 Aug 2000 |
decreasing |
One VT event; harmonic tremor |
| 30-31 Aug 2000 |
decreasing |
-- |
| 01 Sep 2000 |
decreasing |
-- |
| 02 Sep 2000 |
increasing |
3-km-high plume; harmonic tremor |
| 03 Sep 2000 |
decreasing |
-- |
| 04 Sep 2000 |
increasing |
One (M 1.8) VT event; plume; 25 minutes of harmonic tremor |
| 05 Sep 2000 |
-- |
Harmonic tremor |
| 06 Sep 2000 |
steady |
Two (M less than 2) VT events; harmonic tremor |
| 07 Sep 2000 |
steady |
One (M 2.1) VT event |
| 08-09 Sep 2000 |
steady |
Harmonic tremor |
| 10-12 Sep 2000 |
increasing |
Harmonic tremor |
| 13 Sep 2000 |
decreasing |
Harmonic tremor |
| 14 Sep 2000 |
steady |
Harmonic tremor |
| 15 Sep 2000 |
increasing |
-- |
| 17 Sep 2000 |
decreasing |
One (M 2.5) VT event; harmonic tremor |
| 18 Sep 2000 |
decreasing |
Harmonic tremor; 12.7 t/d SO2 |
| 19-21 Sep 2000 |
steady |
-- |
| 22 Sep 2000 |
steady |
One (M 2.8) VT event; 2-km-high plume |
| 23 Sep 2000 |
decreasing |
Two (M ~ 2) VT events |
| 03 Oct 2000 |
increasing |
6-km-high plume; harmonic tremor |
| 04 Oct 2000 |
steady |
1-km-high plume |
| 05 Oct 2000 |
decreasing |
-- |
| 06 Oct 2000 |
steady |
Harmonic tremor |
| 09-10 Oct 2000 |
steady |
Harmonic tremor; high-frequency tremor |
| 15 Oct 2000 |
steady |
-- |
| 16 Oct 2000 |
increasing |
Four (M 2.4) VT events; 2-km-high plume; explosive exhalation |
| 17 Oct 2000 |
decreasing |
High-frequency tremor |
| 18 Oct 2000 |
increasing |
3 hours of high-frequency tremor |
| 19 Oct 2000 |
steady |
High-frequency tremor |
| 20 Oct 2000 |
increasing |
-- |
| 21 Oct 2000 |
steady |
Harmonic tremor; high-frequency tremor |
| 22 Oct 2000 |
steady |
Two VT events |
| 23 Oct 2000 |
increasing |
SO2 emission |
| 24 Oct 2000 |
steady |
Harmonic tremor; high-frequency tremor |
| 25 Oct 2000 |
steady |
High-frequency tremor |
| 26 Oct 2000 |
increasing |
-- |
| 27 Oct 2000 |
increasing |
High-frequency tremor |
| 28 Oct 2000 |
steady |
2-km-high plume; 90 minutes of high-frequency tremor; decreased SO2 emission |
| 29 Oct 2000 |
increasing |
3-km-high plume |
| 30 Oct 2000 |
steady |
-- |
| 31 Oct 2000 |
decreasing |
-- |
| 01 Nov 2000 |
steady |
Harmonic tremor; high-frequency tremor |
| 02 Nov 2000 |
-- |
One (M 3.1) VT event; 3-km-high plume; 30 minutes of high-frequency tremor |
| 03 Nov 2000 |
-- |
Four (M 2.2-3.0) VT events; plume; Alert level raised |
Volcano-tectonic (VT) earthquakes registered on 29 August; 4, 6, 7, 17, 22, 23, September; 16, 22, 27 October; and 2, 3 November. Most of these were M <=2.0 but those occurring on 22 September, 16 October, and in early November were M 2.4-3.1. The latter two periods also coincided with explosive exhalations as described below.
On 16 September, a small dome (very small compared to the one that grew in 1997) was observed during a flight over the crater. On 18 September, an SO2 level of 12,700 tons/day was registered. The VT event on 22 September was registered 20 km SE of the volcano. An explosive exhalation at 0520 on 16 October sent incandescent fragments ~1 km to the NE. As noted above, four VT earthquakes preceded this exhalation, one (the largest) was M 2.4. A second explosive exhalation occurred later that day at 1142 although no incandescent fragments were confirmed.
On 29 October, 102 exhalations registered and, at 1710, a moderately large exhalation produced an ash plume that rose to 3 km above the crater and moved ~25 km WNW. On 2 November, the volcano had an increase in activity and at 1717 there was a moderate exhalation followed by 30 minutes of high-frequency tremor. The event sent an ash plume 3 km above the crater; ash fell on several towns. At 1827 a VT event of M 3.1 was registered SE of the volcano. Then, between 1300 and 1630 on 3 November, four VT events occurred; these M 2.2-3.0 events were located below the crater. Later that day, the Scientific Committee discussed the increased activity over the previous few days and, in conjunction with the Civil Protection Authorities, decided to change the hazard status to Yellow III, recommending further that the security radius around the volcano be increased to 10 km (from the radius of 7 km that had prevailed for many months).
Geologic Background. Volcán Popocatépetl, whose name is the Aztec word for smoking mountain, rises 70 km SE of Mexico City to form North America's 2nd-highest volcano. The glacier-clad stratovolcano contains a steep-walled, 400 x 600 m wide crater. The generally symmetrical volcano is modified by the sharp-peaked Ventorrillo on the NW, a remnant of an earlier volcano. At least three previous major cones were destroyed by gravitational failure during the Pleistocene, producing massive debris-avalanche deposits covering broad areas to the south. The modern volcano was constructed south of the late-Pleistocene to Holocene El Fraile cone. Three major Plinian eruptions, the most recent of which took place about 800 CE, have occurred since the mid-Holocene, accompanied by pyroclastic flows and voluminous lahars that swept basins below the volcano. Frequent historical eruptions, first recorded in Aztec codices, have occurred since Pre-Columbian time.
Information Contacts: Centro Nacional de Prevencion de Desastres (CENAPRED), Delfin Madrigal 665, Col. Pedregal de Santo Domingo, Coyoacán, 04360, México D.F. (URL: https://www.gob.mx/cenapred/); Washington VAAC, Satellite Analysis Branch (SAB), NOAA/NESDIS E/SP23, NOAA Science Center Room 401, 5200 Auth Road, Camp Springs, MD 20746, USA (URL: http://www.ssd.noaa.gov/).
Raung (Indonesia) — October 2000 Cite this Report
Raung
Indonesia
8.119°S, 114.056°E; summit elev. 3260 m
All times are local (unless otherwise noted)
9 July ash plume ends 3-year interval without reported eruptions
At 1720 on 9 July 2000 an air report to the Darwin VAAC noted an ash cloud near Raung with a growing plume at an unknown height. The plume discharged from Raung. Visible satellite imagery taken at 1630, hours before the air report was made, disclosed Raung surrounded by scattered low clouds, with a possible low-level ash plume extending 25 km to the NW. There was no evidence of ash in subsequent satellite imagery. No signs of activity were observed at Raung by Lee Siebert when passing nearby on commercial aircraft at about noon on 10 July and mid-morning on 11 July.
Geologic Background. Raung, one of Java's most active volcanoes, is a massive stratovolcano in easternmost Java that was constructed SW of the rim of Ijen caldera. The unvegetated summit is truncated by a dramatic steep-walled, 2-km-wide caldera that has been the site of frequent historical eruptions. A prehistoric collapse of Gunung Gadung on the W flank produced a large debris avalanche that traveled 79 km, reaching nearly to the Indian Ocean. Raung contains several centers constructed along a NE-SW line, with Gunung Suket and Gunung Gadung stratovolcanoes being located to the NE and W, respectively.
Information Contacts: Darwin VAAC, Bureau of Meteorology, Northern Territory Regional Office, PO Box 40050, Casuarina Northern Territory 0811 Australia (URL: http://www.bom.gov.au/info/vaac/); Lee Siebert, Global Volcanism Program, Smithsonian Institution, Washington, DC 20560-0119 USA.
Rotorua (New Zealand) — October 2000 Cite this Report
Rotorua
New Zealand
38.08°S, 176.27°E; summit elev. 757 m
All times are local (unless otherwise noted)
Additional details about the 18 September 2000 hydrothermal eruption
This report provides more details on the previously reported, small-scale hydrothermal eruption on private property that occurred on 18 September 2000 (BGVN 25:08). That report contained an ambiguous statement. Brad Scott refined the statement that several small-scale hydrothermal eruptions "were reported" in the past year; the passage should have read that such eruptions "have occurred" in the past year. Scott noted further: "The increase in activity is related to the closure of many geothermal wells within Rotorua City as part of a management scheme designed to preserve the surface geothermal features." For further details see Scott and Cody (2000).
Surface features resulting from the eruption can be seen in figure 1. The twisted metal pipes are related to an old bath house, which used to stand near the clothes line mentioned in BGVN 25:08. The pipes fed water to the bath house and were excavated by the eruption. The original clothes line was completely removed off site before the eruption occurred.
Ron Keam contributed the following hazards assessment to the GOSA electronic list (geysers@wwc.edu). "If the area of an average house at Tarewa Road were one tenth of the average section area, the probability that the focus of one of these revived activities would occur beneath a dwelling is roughly 10%. So far, with three or four incidents having occurred, I think that the houses themselves were spared from direct participation in the initial events. With the average craterlet enlarging itself somewhat, there must be a comparable probability that an average sized house would in due course find itself partially overhanging the craterlet. So, in all, there appears to be something like a 20% probability that an outbreak on an average property would make a dwelling there uninhabitable.
A search of an index to the Geyser Observation and Study Association (GOSA) newsletter revealed two articles referring to Rotorua breakouts due to hydrothermal activity (see References below). Ashley Cody also discussed Rotorua hydrothermal features (Cody, 1998). Note that the elevation of Rotorua city is about 320 m; the 575 m stated in the header above refers to the highest point on one of the young domes within the caldera. All of New Zealand's recognized Holocene volcanoes lie on North Island or just to its N. Rotorua sits in the northern part of the Taupo volcanic zone between Lake Taupo and the Bay of Plenty. The Okataina lava domes lie ~20 km E of Rotorua.
In related hydrothermal activity on Rotorua, the Pohutu Geyser at the active geyser area Whakarewarewa has been in continuous eruption for 251 days, a new and continuing record for New Zealand.
References. Cody, A., 1998, GOSA Transactions, The Rotorua Geothermal Field, New Zealand: Geysers in New Zealand, v. VI, p. 34-49.
Geyser Observation and Study Association (GOSA) newsletter, 1998, "The Geyser Gazer Sput." (v. 12, no. 3, p. 23; v. 12, no. 4, p. 11) (December 1998).
Monteith, David, 2000, Index of "The Geyser Gazer Sput," December 1987 - December 1998 (http://www.geocities.com/Yosemite/1407/Sputind.htm).
Scott, B.J., and Cody, A.D., 2000, Response of the Rotorua geothermal system to exploitation and varying management regimes: Geothermics, v. 29, p. 573-592.
Geologic Background. The 22-km-wide Rotorua caldera is the NW-most caldera of the Taupo volcanic zone. It is the only single-event caldera in the Taupo Volcanic Zone and was formed about 220,000 years ago following eruption of the more than 340 km3 rhyolitic Mamaku Ignimbrite. Although caldera collapse occurred in a single event, the process was complex and involved multiple collapse blocks. The major city of Rotorua lies at the south end of the lake that fills much of the caldera. Post-collapse eruptive activity, which ceased during the Pleistocene, was restricted to lava dome extrusion without major explosive activity. The youngest activity consisted of the eruption of three lava domes less than 25,000 years ago. The major thermal areas of Takeke, Tikitere, Lake Rotokawa, and Rotorua-Whakarewarewa are located within the caldera or outside its rim, and the city of Rotorua lies within and adjacent to active geothermal fields.
Information Contacts: Brad Scott, Wairakei Research Center, Institute of Geological and Nuclear Sciences (IGNS), Private Bag 2000, Wairakei, New Zealand (URL: http://www.gns.cri.nz/); Ron Keam, The Physics Department, The University of Auckland, Private Bag 92-019, Auckland, New Zealand.
Soputan (Indonesia) — October 2000 Cite this Report
Soputan
Indonesia
1.112°N, 124.737°E; summit elev. 1785 m
All times are local (unless otherwise noted)
Lava dome growth continues; Strombolian and ash eruptions from summit crater
This report covers the period of 1 July-31 October 2000. Activity increased and lava dome growth continued after the 13 May explosion (BGVN 25:06). By the end of June, an average of 100 earthquakes occurred per day, but the number of avalanche earthquakes decreased and fluctuated between 20 and 60 per day.
Soputan Post Observatory (SPO) at Maliku and Lokon Post Observatory (LPO) at Tomohon noted anomalous activity on 1 July. At 1200 strong tremor signals sent seismographs off-scale, but had estimated amplitudes of 20-50 mm. Visual observations at that time were hindered by haze. Workers at LPO heard a thundering sound twice at 2232, and during 2255-2303 more thundering occurred, this time accompanied by lava ejection. Lava flowed 200 m down the W flank of the volcano, and covered flows from the 13-14 May eruption.
A Strombolian eruption was observed at 0200 on 2 July with the lava fountain reaching 10-50 m above the summit. A thick white-gray ash emission reached 100 m above the summit crater and later changed to a brown color on the morning of 2 July. Further tremor earthquakes occurred with amplitudes of 30-50 mm. A dark-brown ash explosion, accompanied by a thundering sound, rose 200 m. The hazard status was set to 3 (on a scale of 1-4) on 3 July.
Reports resumed on 25-26 July, when a dense brown ash cloud rising ~1,500-3,500 m above the summit was observed along with lava fountaining to a height of 50 m. Observatory workers frequently heard rumblings from the volcano. At the end of July lava flows and lava avalanches moved down the sides of Soputan toward the SW to a distance of 400 m. Avalanche earthquakes and volcanic tremor dominated the seismic record, and an increase in deep volcanic (A-type) earthquakes took place.
Explosions issuing from the summit crater continued to be observed through the beginning of August. Ash emissions were brown-black in color, rose ~2,500 m, and were accompanied by rumbling. Lava avalanches reached distances of up to 2,000 m from the volcano, and pyroclastic flows traveled 700 m, both trending W. Seismicity remained similar to the previous week and maintained a high level. Soputan's hazard status was raised to 4 on 7 August.
Similar activity continued, and on 15 August at 2105 a dark-gray ash explosion occurred from the summit crater and rose 2,500 m. Ash from the explosion drifted SW. A Strombolian explosion followed and reached 150 m above the crater rim. The outburst was accompanied by a lava avalanche that flowed 200 m down the volcano's SW flank. Thundering that rattled windows in Maliku village 7 km away occurred coeval with the explosions. Volcanic ash advisories stated that the ash cloud from this event was carried to an altitude of 4,300 m.
Visual activity diminished until late September, but seismicity continued at similar levels until dropping in mid-September. A white, variable-density ash plume rose 25-200 m above the summit. Continuous volcanic tremor persisted until early September, and avalanche earthquakes also decreased significantly. During this period a white, variable-density ash cloud rose 50-200 m above Soputan's summit. Similar ash emissions continued until late September although cloud thickness decreased. Seismicity continued to decrease with avalanche earthquakes occurring nearly half as frequently and other earthquake types remaining similar in number.
In early October the hazard level for Soputan was decreased from 4 to 2. An ash plume continued to rise up to 200 m; in mid-October it decreased in height to 20 m above the summit crater. No further volcanic earthquakes occurred, and seismographs registered only avalanche and tectonic earthquakes for the rest of the month.
Geologic Background. The Soputan stratovolcano on the southern rim of the Quaternary Tondano caldera on the northern arm of Sulawesi Island is one of Sulawesi's most active volcanoes. The youthful, largely unvegetated volcano is the only active cone in the Sempu-Soputan volcanic complex, which includes the Soputan caldera, Rindengan, and Manimporok (3.5 km ESE). Kawah Masem maar was formed in the W part of the caldera and contains a crater lake; sulfur has been extracted from fumarolic areas in the maar since 1938. Recent eruptions have originated at both the summit crater and Aeseput, a prominent NE-flank vent that formed in 1906 and was the source of intermittent major lava flows until 1924.
Information Contacts: Dali Ahmad, Volcanological Survey of Indonesia (VSI), Jalan Diponegoro No. 57, Bandung 40122, Indonesia (URL: http://www.vsi.esdm.go.id/); Darwin Volcanic Ash Advisory Centre (VAAC), Bureau of Meteorology, Northern Territory Regional Office, PO Box 40050, Casuarina, NT 0811, Australia (URL: http://www.bom.gov.au/info/vaac/).
Villarrica (Chile) — October 2000 Cite this Report
Villarrica
Chile
39.42°S, 71.93°W; summit elev. 2847 m
All times are local (unless otherwise noted)
During 2000 a still-active lava lake, occasional outbursts, and increased lahar risks
This report reviews activity during January-May 2000 and September-October 2000. Observations from January through May 2000 were provided by the Proyecto de Observacion Villarrica (POVI). Information about increased seismicity in September and explosions in October were provided by the Observatorio Volcanologico de Los Andes del Sur (OVDAS). Reports for the period June-August 2000 were not available.
Activity during January-May 2000. In January activity was at normal levels. Explosive energy of gas bubbles and incandescence from the lava lake decreased with respect to late 1999. Strombolian activity was observed on 20 January. During February incandescence could be observed on 14 clear nights, indicating weak magmatic activity. Stronger glow was observed on the nights of 19-20 February.
During 1400-1500 on 1 March a series of phreatic events was marked by gas-and-ash emissions. Magmatic activity within the crater decreased with respect to February to more typical levels, causing less incandescence. Activity continued to diminish in April and illumination at the summit also decreased. Incandescence at Villarrica's summit ceased during 5-29 May for the first time since 21 August 1999. At 1430 on 30 May, however, gas-and-ash emissions were observed. Overall, the level of activity was average.
Activity during September-October 2000. As of 20 September, an increase in seismicity occurred at stations VNVI and CVVI while gas and steam emissions ceased, and the usually persistent fumarole disappeared. During 25-28 September, seismic stations VNVI, 4 km from the crater, and CVVI, 19 km from the volcano, recorded anomalous seismicity characterized by clusters of low-frequency earthquakes, harmonic tremor, and tremor bands (periods of tremor separated by seismic silence).
OVDAS raised the hazard status to Green Level 2 on 3 October, indicating that the zone near the crater was dangerous. A flyover of the summit was performed on 4 October to observe any changes in activity. Fumarolic emissions remained absent, and the crater floor was obstructed by black rock. The crater bottom and walls were covered with patches of snow, indicating relatively low temperature. OVDAS prohibited ascents to the top of the volcano because of possible explosions or eruptions. Seismicity that day again showed tremor bands.
On 5 October, an observer of the Centro Volcanológico Villarrica (CVV) reported a short ash eruption with ashfall S towards Coñaripe. At the same time, researchers at the University of Hawaii detected a thermal increase at the summit crater by analysis of GOES 8/10 satellite imagery. Snow fell at the summit on the night of 5 October. An overflight on 6 October revealed a tenuous ash deposit under the recent snow. A small vent opened in the crater, and was subsequently closed by fresh lava. Seismicity included harmonic tremor.
Even a small explosion or eruption would be dangerous because of the potential dislodgement and melting of rock, ice, and snow capping the summit, which could generate a debris flow. Critical locations where lahar risk was highest were determined on the morning of 7 October to prepare for a possible eruption. Crews worked to clear and deepen river channels on or near Villarrica to help reduce damage from a potential lahar. A parapet was also constructed to protect the city and airport of Pucón from debris, ash, or lava flows. Seismicity in the morning showed harmonic tremor, while in the afternoon tremor bands were recorded.
At 1745 on 8 October, a traveler to Coñaripe observed black material rising rhythmically to ~30-50 m above the crater rim and falling back inside. At 1810 there was a small 45-minute-long ash eruption, and wind carried the ash SE. Seismographs indicated harmonic tremor at base levels and at 1400 on 9 October, tremor bands were recorded. An aerial view of the summit on 15 October showed a solid and fractured lava crust on the bottom of the crater and very low gas emission that was mainly water vapor caused by the melting and evaporation of small blocks of ice and snow that fell into the crater. Seismicity remained at a low level as of 15 October.
Geologic Background. The glacier-covered Villarrica stratovolcano, in the northern Lakes District of central Chile, is ~15 km south of the city of Pucon. A 2-km-wide caldera that formed about 3,500 years ago is located at the base of the presently active, dominantly basaltic to basaltic-andesite cone at the NW margin of a 6-km-wide Pleistocene caldera. More than 30 scoria cones and fissure vents are present on the flanks. Plinian eruptions and pyroclastic flows that have extended up to 20 km from the volcano were produced during the Holocene. Lava flows up to 18 km long have issued from summit and flank vents. Eruptions documented since 1558 CE have consisted largely of mild-to-moderate explosive activity with occasional lava effusion. Glaciers cover 40 km2 of the volcano, and lahars have damaged towns on its flanks.
Information Contacts: Hugo Moreno, Observatorio Volcanologico de Los Andes del Sur (OVDAS), Casilla 23D, Temuco, Chile (URL: http://www.sernageomin.cl/); Werner Keller U., Proyecto de Observacion Villarrica (POVI), Wiesenstrasse 8, 86438 Kissing, Germany (URL: https://www.povi.cl/).