Recently Published Bulletin Reports
Manam (Papua New Guinea) Few ash plumes during November-December 2022
Krakatau (Indonesia) Strombolian activity and ash plumes during November 2022-April 2023
Stromboli (Italy) Strombolian explosions and lava flows continue during January-April 2023
Nishinoshima (Japan) Small ash plumes and fumarolic activity during November 2022 through April 2023
Karangetang (Indonesia) Lava flows, incandescent avalanches, and ash plumes during January-June 2023
Ahyi (United States) Intermittent hydroacoustic signals and discolored plumes during November 2022-June 2023
Kadovar (Papua New Guinea) An ash plume and weak thermal anomaly during May 2023
San Miguel (El Salvador) Small gas-and-ash explosions during March and May 2023
Semisopochnoi (United States) Occasional explosions, ash deposits, and gas-and-steam plumes during December 2022-May 2023
Ebeko (Russia) Continued explosions, ash plumes, and ashfall during October 2022-May 2023
Home Reef (Tonga) Discolored plumes continued during November 2022-April 2023
Ambae (Vanuatu) New lava flow, ash plumes, and sulfur dioxide plumes during February-May 2023
Manam (Papua New Guinea) — July 2023  Cite this Report
Manam
Papua New Guinea
4.08°S, 145.037°E; summit elev. 1807 m
All times are local (unless otherwise noted)
Few ash plumes during November-December 2022
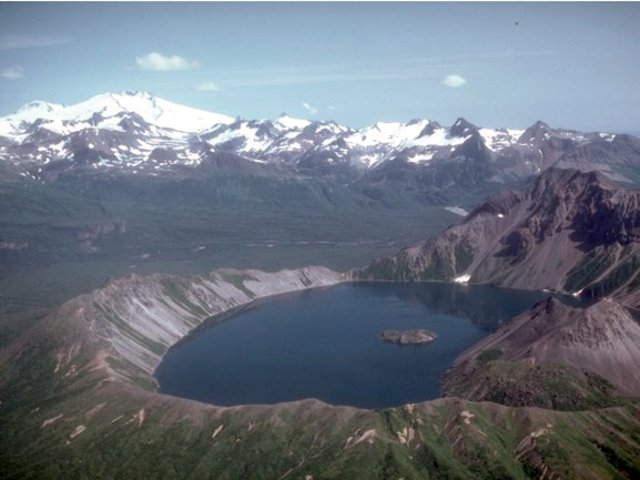
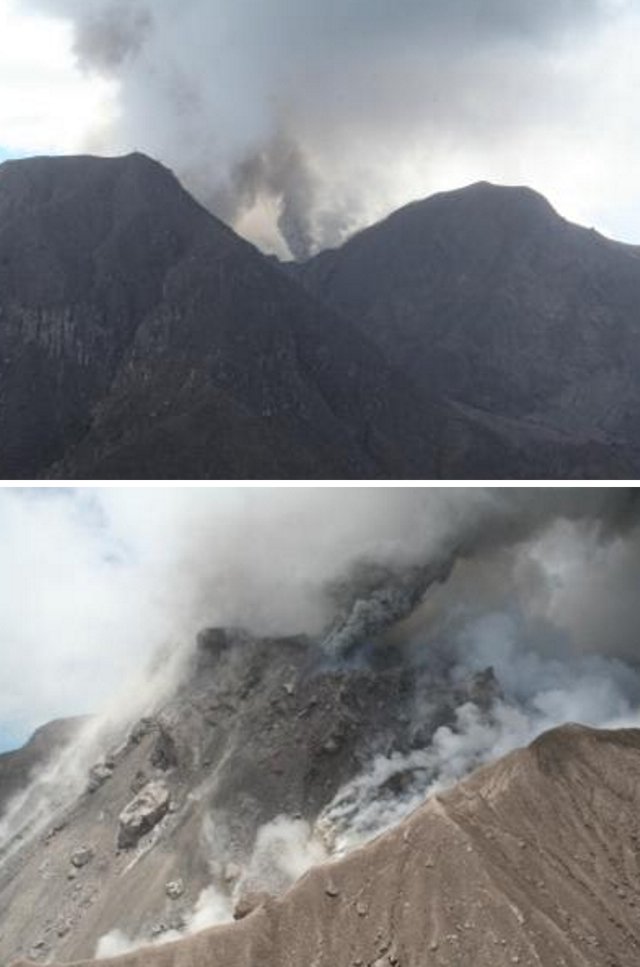
Manam is a 10-km-wide island that consists of two active summit craters: the Main summit crater and the South summit crater and is located 13 km off the northern coast of mainland Papua New Guinea. Frequent mild-to-moderate eruptions have been recorded since 1616. The current eruption period began during June 2014 and has more recently been characterized by intermittent ash plumes and thermal activity (BGVN 47:11). This report updates activity that occurred from November 2022 through May 2023 based on information from the Darwin Volcanic Ash Advisory Center (VAAC) and various satellite data.
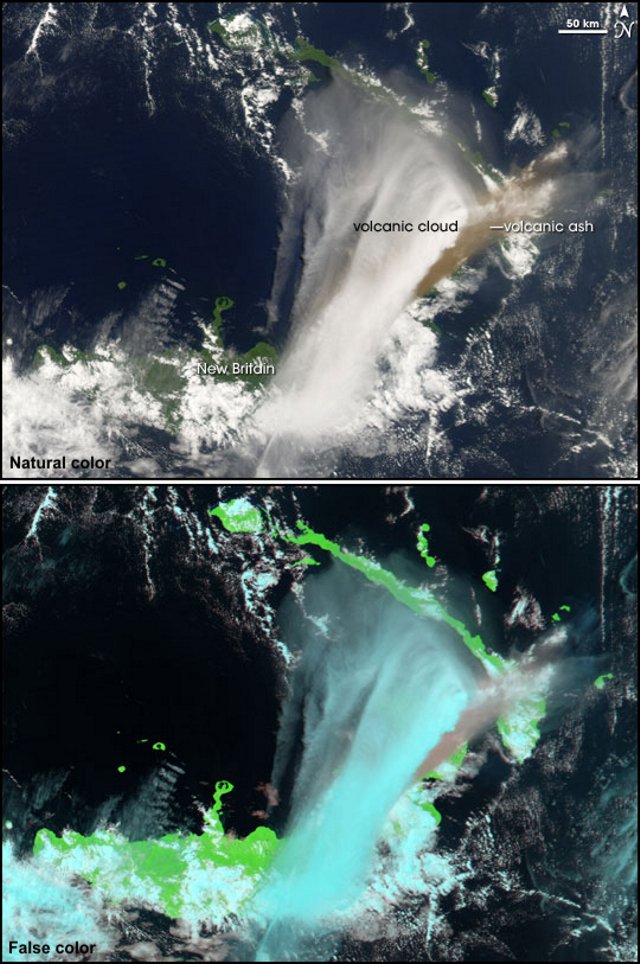
Ash plumes were reported during November and December 2022 by the Darwin VAAC. On 7 November an ash plume rose to 2.1 km altitude and drifted NE based on satellite images and weather models. On 14 November an ash plume rose to 2.1 km altitude and drifted W based on RVO webcam images. On 20 November ash plumes rose to 1.8 km altitude and drifted NW. On 26 December an ash plume rose to 3 km altitude and drifted S and SSE.
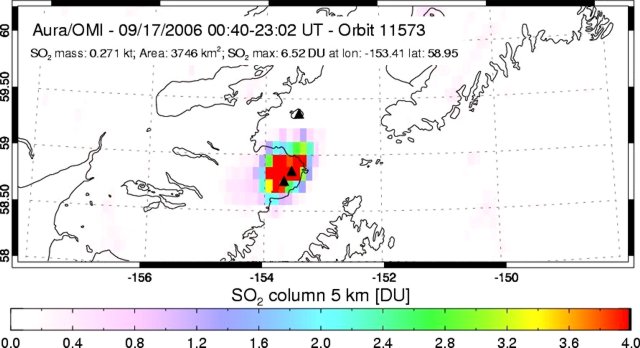
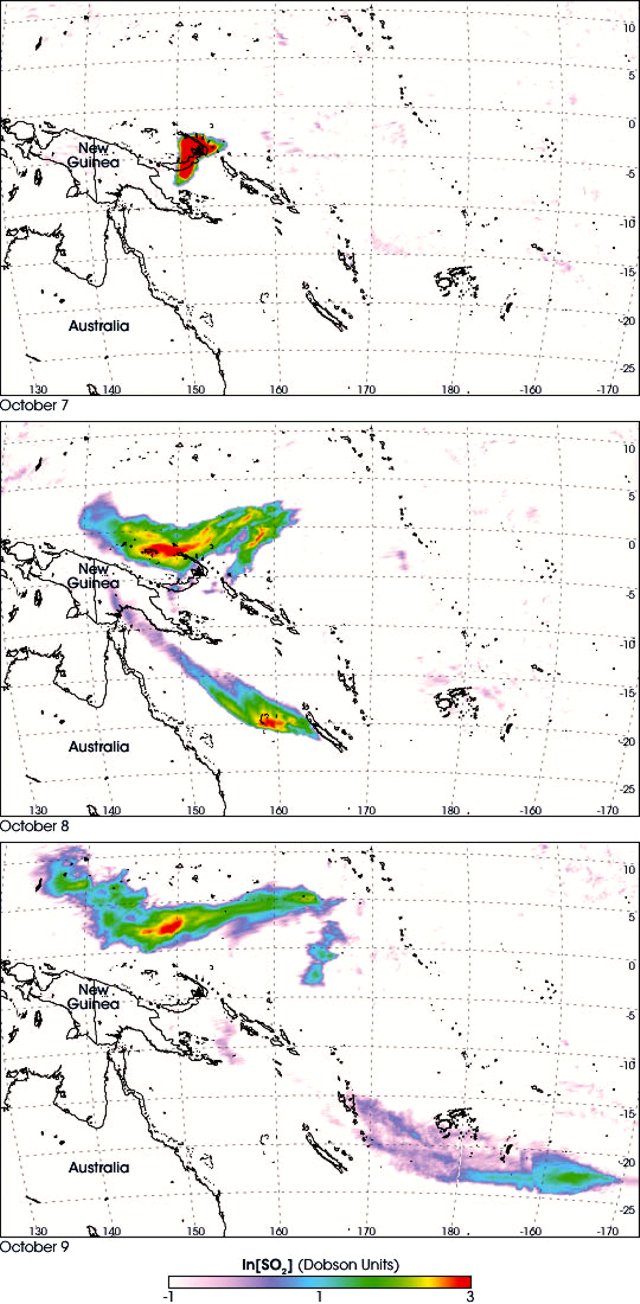
Intermittent sulfur dioxide plumes were detected using the TROPOMI instrument on the Sentinel-5P satellite, some of which exceeded at least two Dobson Units (DU) and drifted in different directions (figure 93). Occasional low-to-moderate power thermal anomalies were recorded by the MIROVA (Middle InfraRed Observation of Volcanic Activity) system; less than five anomalies were recorded each month during November 2022 through May 2023 (figure 94). Two thermal hotspots were detected by the MODVOLC thermal alerts system on 10 December 2022. On clear weather days, thermal activity was also captured in infrared satellite imagery in both the Main and South summit craters, accompanied by gas-and-steam emissions (figure 95).
Geologic Background. The 10-km-wide island of Manam, lying 13 km off the northern coast of mainland Papua New Guinea, is one of the country's most active volcanoes. Four large radial valleys extend from the unvegetated summit of the conical basaltic-andesitic stratovolcano to its lower flanks. These valleys channel lava flows and pyroclastic avalanches that have sometimes reached the coast. Five small satellitic centers are located near the island's shoreline on the northern, southern, and western sides. Two summit craters are present; both are active, although most observed eruptions have originated from the southern crater, concentrating eruptive products during much of the past century into the SE valley. Frequent eruptions, typically of mild-to-moderate scale, have been recorded since 1616. Occasional larger eruptions have produced pyroclastic flows and lava flows that reached flat-lying coastal areas and entered the sea, sometimes impacting populated areas.
Information Contacts: Rabaul Volcano Observatory (RVO), Geohazards Management Division, Department of Mineral Policy and Geohazards Management (DMPGM), PO Box 3386, Kokopo, East New Britain Province, Papua New Guinea; Darwin Volcanic Ash Advisory Centre (VAAC), Bureau of Meteorology, Northern Territory Regional Office, PO Box 40050, Casuarina, NT 0811, Australia (URL: http://www.bom.gov.au/info/vaac/); MIROVA (Middle InfraRed Observation of Volcanic Activity), a collaborative project between the Universities of Turin and Florence (Italy) supported by the Centre for Volcanic Risk of the Italian Civil Protection Department (URL: http://www.mirovaweb.it/); Hawai'i Institute of Geophysics and Planetology (HIGP) - MODVOLC Thermal Alerts System, School of Ocean and Earth Science and Technology (SOEST), Univ. of Hawai'i, 2525 Correa Road, Honolulu, HI 96822, USA (URL: http://modis.higp.hawaii.edu/); NASA Global Sulfur Dioxide Monitoring Page, Atmospheric Chemistry and Dynamics Laboratory, NASA Goddard Space Flight Center (NASA/GSFC), 8800 Greenbelt Road, Goddard, Maryland, USA (URL: https://so2.gsfc.nasa.gov/); Copernicus Browser, Copernicus Data Space Ecosystem, European Space Agency (URL: https://dataspace.copernicus.eu/browser/).
Krakatau (Indonesia) — July 2023 Cite this Report
Krakatau
Indonesia
6.1009°S, 105.4233°E; summit elev. 285 m
All times are local (unless otherwise noted)
Strombolian activity and ash plumes during November 2022-April 2023
Krakatau is located in the Sunda Strait between Java and Sumatra, Indonesia. Caldera collapse during the catastrophic 1883 eruption destroyed Danan and Perbuwatan cones and left only a remnant of Rakata. The post-collapse cone of Anak Krakatau (Child of Krakatau) was constructed within the 1883 caldera at a point between the former Danan and Perbuwatan cones; it has been the site of frequent eruptions since 1927. The current eruption period began in May 2021 and has recently consisted of explosions, ash plumes, and thermal activity (BGVN 47:11). This report covers activity during November 2022 through April 2023 based on information provided by the Indonesian Center for Volcanology and Geological Hazard Mitigation, referred to as Pusat Vulkanologi dan Mitigasi Bencana Geologi (PVMBG), MAGMA Indonesia, the Darwin Volcanic Ash Advisory Center (VAAC), and several sources of satellite data.
Activity was relatively low during November and December 2022. Daily white gas-and-steam plumes rose 25-100 m above the summit and drifted in different directions. Gray ash plumes rose 200 m above the summit and drifted NE at 1047 and at 2343 on 11 November. On 14 November at 0933 ash plumes rose 300 m above the summit and drifted E. An ash plume was reported at 0935 on 15 December that rose 100 m above the summit and drifted NE. An eruptive event at 1031 later that day generated an ash plume that rose 700 m above the summit and drifted NE. A gray ash plume at 1910 rose 100 m above the summit and drifted E. Incandescent material was ejected above the vent based on an image taken at 1936.
During January 2023 daily white gas-and-steam plumes rose 25-300 m above the summit and drifted in multiple directions. Gray-to-brown ash plumes were reported at 1638 on 3 January, at 1410 and 1509 on 4 January, and at 0013 on 5 January that rose 100-750 m above the summit and drifted NE and E; the gray-to-black ash plume at 1509 on 4 January rose as high as 3 km above the summit and drifted E. Gray ash plumes were recorded at 1754, 2241, and 2325 on 11 January and at 0046 on 12 January and rose 200-300 m above the summit and drifted NE. Toward the end of January, PVMBG reported that activity had intensified; Strombolian activity was visible in webcam images taken at 0041, 0043, and 0450 on 23 January. Multiple gray ash plumes throughout the day rose 200-500 m above the summit and drifted E and SE (figure 135). Webcam images showed progressively intensifying Strombolian activity at 1919, 1958, and 2113 on 24 January; a gray ash plume at 1957 rose 300 m above the summit and drifted E (figure 135). Eruptive events at 0231 and 2256 on 25 January and at 0003 on 26 January ejected incandescent material from the vent, based on webcam images. Gray ash plumes observed during 26-27 January rose 300-500 m above the summit and drifted NE, E, and SE.
Low levels of activity were reported during February and March. Daily white gas-and-steam plumes rose 25-300 m above the summit and drifted in different directions. The Darwin VAAC reported that continuous ash emissions rose to 1.5-1.8 km altitude and drifted W and NW during 1240-1300 on 10 March, based on satellite images, weather models, and PVMBG webcams. White-and-gray ash plumes rose 500 m and 300 m above the summit and drifted SW at 1446 and 1846 on 18 March, respectively. An eruptive event was recorded at 2143, though it was not visible due to darkness. Multiple ash plumes were reported during 27-29 March that rose as high as 2.5 km above the summit and drifted NE, W, and SW (figure 136). Webcam images captured incandescent ejecta above the vent at 0415 and around the summit area at 2003 on 28 March and at 0047 above the vent on 29 March.
Daily white gas-and-steam plumes rose 25-300 m above the summit and drifted in multiple directions during April and May. White-and-gray and black plumes rose 50-300 m above the summit on 2 and 9 April. On 11 May at 1241 a gray ash plume rose 1-3 km above the summit and drifted SW. On 12 May at 0920 a gray ash plume rose 2.5 km above the summit and drifted SW and at 2320 an ash plume rose 1.5 km above the summit and drifted SW. An accompanying webcam image showed incandescent ejecta. On 13 May at 0710 a gray ash plume rose 2 km above the summit and drifted SW (figure 137).
The MIROVA (Middle InfraRed Observation of Volcanic Activity) graph of MODIS thermal anomaly data showed intermittent low-to-moderate power thermal anomalies during November 2022 through April 2023 (figure 138). Some of this thermal activity was also visible in infrared satellite imagery at the crater, accompanied by gas-and-steam and ash plumes that drifted in different directions (figure 139).
Geologic Background. The renowned Krakatau (frequently mis-named as Krakatoa) volcano lies in the Sunda Strait between Java and Sumatra. Collapse of an older edifice, perhaps in 416 or 535 CE, formed a 7-km-wide caldera. Remnants of that volcano are preserved in Verlaten and Lang Islands; subsequently the Rakata, Danan, and Perbuwatan cones were formed, coalescing to create the pre-1883 Krakatau Island. Caldera collapse during the catastrophic 1883 eruption destroyed Danan and Perbuwatan, and left only a remnant of Rakata. This eruption caused more than 36,000 fatalities, most as a result of tsunamis that swept the adjacent coastlines of Sumatra and Java. Pyroclastic surges traveled 40 km across the Sunda Strait and reached the Sumatra coast. After a quiescence of less than a half century, the post-collapse cone of Anak Krakatau (Child of Krakatau) was constructed within the 1883 caldera at a point between the former Danan and Perbuwatan cones. Anak Krakatau has been the site of frequent eruptions since 1927.
Information Contacts: Pusat Vulkanologi dan Mitigasi Bencana Geologi (PVMBG, also known as Indonesian Center for Volcanology and Geological Hazard Mitigation, CVGHM), Jalan Diponegoro 57, Bandung 40122, Indonesia (URL: http://www.vsi.esdm.go.id/); MAGMA Indonesia, Kementerian Energi dan Sumber Daya Mineral (URL: https://magma.esdm.go.id/v1); Darwin Volcanic Ash Advisory Centre (VAAC), Bureau of Meteorology, Northern Territory Regional Office, PO Box 40050, Casuarina, NT 0811, Australia (URL: http://www.bom.gov.au/info/vaac/); MIROVA (Middle InfraRed Observation of Volcanic Activity), a collaborative project between the Universities of Turin and Florence (Italy) supported by the Centre for Volcanic Risk of the Italian Civil Protection Department (URL: http://www.mirovaweb.it/); Copernicus Browser, Copernicus Data Space Ecosystem, European Space Agency (URL: https://dataspace.copernicus.eu/browser/).
Stromboli
Italy
38.789°N, 15.213°E; summit elev. 924 m
All times are local (unless otherwise noted)
Strombolian explosions and lava flows continue during January-April 2023
Stromboli, located in Italy, has exhibited nearly constant lava fountains for the past 2,000 years; recorded eruptions date back to 350 BCE. Eruptive activity occurs at the summit from multiple vents, which include a north crater area (N area) and a central-southern crater (CS area) on a terrace known as the ‘terrazza craterica’ at the head of the Sciara del Fuoco, a large scarp that runs from the summit down the NW side of the volcano-island. Activity typically consists of Strombolian explosions, incandescent ejecta, lava flows, and pyroclastic flows. Thermal and visual monitoring cameras are located on the nearby Pizzo Sopra La Fossa, above the terrazza craterica, and at multiple flank locations. The current eruption period has been ongoing since 1934 and recent activity has consisted of frequent Strombolian explosions and lava flows (BGVN 48:02). This report updates activity during January through April 2023 primarily characterized by Strombolian explosions and lava flows based on reports from Italy's Istituto Nazionale di Geofisica e Vulcanologia (INGV) and various satellite data.
Frequent explosive activity continued throughout the reporting period, generally in the low-to-medium range, based on the number of hourly explosions in the summit crater (figure 253, table 16). Intermittent thermal activity was recorded by the MIROVA (Middle InfraRed Observation of Volcanic Activity) analysis of MODIS satellite data (figure 254). According to data collected by the MODVOLC thermal algorithm, a total of 9 thermal alerts were detected: one on 2 January 2023, one on 1 February, five on 24 March, and two on 26 March. The stronger pulses of thermal activity likely reflected lava flow events. Infrared satellite imagery captured relatively strong thermal hotspots at the two active summit craters on clear weather days, showing an especially strong event on 8 March (figure 255).
Table 16. Summary of type, frequency, and intensity of explosive activity at Stromboli by month during January-April 2023; information from webcam observations. Courtesy of INGV weekly reports.
| Month |
Explosive Activity |
| Jan 2023 |
Typical Strombolian activity with spattering and lava overflows in the N crater area. Explosions were reported from 4 vents in the N area and 1-2 vents in the CS area. The average hourly frequency of explosions was low-to-medium (1-12 events/hour). The intensity of the explosions varied from low (less than 80 m high) to medium (less than 150 m high) in the N crater area and up to high (greater than 150 m high) in the CS crater area. |
| Feb 2023 |
Typical Strombolian activity with spattering in the N crater area. Explosions were reported from 2-3 vents in the N area and 1-4 vents in the CS area. The average hourly frequency of explosions was low-to-medium (1-14 events/hour). The intensity of the explosions varied from low (less than 80 m high) to medium (less than 150 m high) in the N crater area and up to high (greater than 150 m high) in the CS crater area. |
| Mar 2023 |
Typical Strombolian activity with spattering and lava overflows in the N crater area. Explosions were reported from 2-3 vents in the N area and 2-4 vents in the CS area. The average hourly frequency of explosions was low-to-medium (1-18 events/hour). The intensity of the explosions varied from low (less than 80 m high) to medium (less than 150 m high) in the N crater area and up to high (greater than 150 m high) in the CS crater area. |
| Apr 2023 |
Typical Strombolian activity. Explosions were reported from 2 vents in the N area and 2-3 vents in the CS area. The average hourly frequency of explosions was low-to-high (1-16 events/hour). The intensity of the explosions varied from low (less than 80 m high) to medium (less than 150 m high) in both the N and CS crater areas. |
Activity during January-February 2023. Strombolian explosions were reported in the N crater area, as well as lava effusion. Explosive activity in the N crater area ejected coarse material (bombs and lapilli). Intense spattering was observed in both the N1 and N2 craters. In the CS crater area, explosions generally ejected fine material (ash), sometimes to heights greater than 250 m. The intensity of the explosions was characterized as low-to-medium in the N crater and medium-to-high in the CS crater. After intense spattering activity from the N crater area, a lava overflow began at 2136 on 2 January that flowed part way down the Sciara del Fuoco, possibly moving down the drainage that formed in October, out of view from webcams. The flow remained active for a couple of hours before stopping and beginning to cool. A second lava flow was reported at 0224 on 4 January that similarly remained active for a few hours before stopping and cooling. Intense spattering was observed on 11 and 13 January from the N1 crater. After intense spattering activity at the N2 crater at 1052 on 17 January another lava flow started to flow into the upper part of the Sciara del Fuoco (figure 256), dividing into two: one that traveled in the direction of the drainage formed in October, and the other one moving parallel to the point of emission. By the afternoon, the rate of the flow began to decrease, and at 1900 it started to cool. A lava flow was reported at 1519 on 24 January following intense spattering in the N2 area, which began to flow into the upper part of the Sciara del Fuoco. By the morning of 25 January, the lava flow had begun to cool. During 27 January the frequency of eruption in the CS crater area increased to 6-7 events/hour compared to the typical 1-7 events/hour; the following two days showed a decrease in frequency to less than 1 event/hour. Starting at 1007 on 30 January a high-energy explosive sequence was produced by vents in the CS crater area. The sequence began with an initial energetic pulse that lasted 45 seconds, ejecting predominantly coarse products 300 m above the crater that fell in an ESE direction. Subsequent and less intense explosions ejected material 100 m above the crater. The total duration of this event lasted approximately two minutes. During 31 January through 6, 13, and 24 February spattering activity was particularly intense for short periods in the N2 crater.
An explosive sequence was reported on 16 February that was characterized by a major explosion in the CS crater area (figure 257). The sequence began at 1817 near the S2 crater that ejected material radially. A few seconds later, lava fountains were observed in the central part of the crater. Three explosions of medium intensity (material was ejected less than 150 m high) were recorded at the S2 crater. The first part of this sequence lasted approximately one minute, according to INGV, and material rose 300 m above the crater and then was deposited along the Sciara del Fuoco. The second phase began at 1818 at the S1 crater; it lasted seven seconds and material was ejected 150 m above the crater. Another event 20 seconds later lasted 12 seconds, also ejecting material 150 m above the crater. The sequence ended with at least three explosions of mostly fine material from the S1 crater. The total duration of this sequence was about two minutes.
Short, intense spattering activity was noted above the N1 crater on 27 and 28 February. A lava overflow was first reported at 0657 from the N2 crater on 27 February that flowed into the October 2022 drainage. By 1900 the flow had stopped. A second lava overflow also in the N crater area occurred at 2149, which overlapped the first flow and then stopped by 0150 on 28 February. Material detached from both the lava overflows rolled down the Sciara del Fuoco, some of which was visible in webcam images.
Activity during March-April 2023. Strombolian activity continued with spattering activity and lava overflows in the N crater area during March. Explosive activity at the N crater area varied from low (less than 80 m high) to medium (less than 150 m high) and ejected coarse material, such as bombs and lapilli. Spattering was observed above the N1 crater, while explosive activity at the CS crater area varied from medium to high (greater than 150 m high) and ejected coarse material. Intense spattering activity was observed for short periods on 6 March above the N1 crater. At approximately 0610 a lava overflow was reported around the N2 crater on 8 March, which then flowed into the October 2022 drainage. By 1700 the flow started to cool. A second overflow began at 1712 on 9 March and overlapped the previous flow. It had stopped by 2100. Material from both flows was deposited along the Sciara del Fuoco, though much of the activity was not visible in webcam images. On 11 March a lava overflow was observed at 0215 that overlapped the two previous flows in the October 2022 drainage. By late afternoon on 12 March, it had stopped.
During a field excursion on 16 March, scientists noted that a vent in the central crater area was degassing. Another vent showed occasional Strombolian activity that emitted ash and lapilli. During 1200-1430 low-to-medium intense activity was reported; the N1 crater emitted ash emissions and the N2 crater emitted both ash and coarse material. Some explosions also occurred in the CS crater area that ejected coarse material. The C crater in the CS crater area occasionally showed gas jetting and low intensity explosions on 17 and 22 March; no activity was observed at the S1 crater. Intense, longer periods of spattering were reported in the N1 crater on 19, 24, and 25 March. Around 2242 on 23 March a lava overflow began from the N1 crater that, after about an hour, began moving down the October 2022 drainage and flow along the Sciara del Fuoco (figure 258). Between 0200 and 0400 on 26 March the flow rate increased, which generated avalanches of material from collapses at the advancing flow front. By early afternoon, the flow began to cool. On 25 March at 1548 an explosive sequence began from one of the vents at S2 in the CS crater area (figure 258). Fine ash mixed with coarse material was ejected 300 m above the crater rim and drifted SSE. Some modest explosions around Vent C were detected at 1549 on 25 March, which included an explosion at 1551 that ejected coarse material. The entire explosive sequence lasted approximately three minutes.
During April explosions persisted in both the N and CS crater areas. Fine material was ejected less than 80 m above the N crater rim until 6 April, followed by ejection of coarser material. Fine material was also ejected less than 80 m above the CS crater rim. The C and S2 crater did not show significant eruptive activity. On 7 April an explosive sequence was detected in the CS crater area at 1203 (figure 259). The first explosion lasted approximately 18 seconds and ejected material 400 m above the crater rim, depositing pyroclastic material in the upper part of the Sciara del Fuoco. At 1204 a second, less intense explosion lasted approximately four seconds and deposited pyroclastic products outside the crater area and near Pizzo Sopra La Fossa. A third explosion at 1205 was mainly composed of ash that rose about 150 m above the crater and lasted roughly 20 seconds. A fourth explosion occurred at 1205 about 28 seconds after the third explosion and ejected a mixture of coarse and fine material about 200 m above the crater; the explosion lasted roughly seven seconds. Overall, the entire explosive sequence lasted about two minutes and 20 seconds. After the explosive sequence on 7 April, explosions in both the N and CS crater areas ejected material as high as 150 m above the crater.
On 21 April research scientists from INGV made field observations in the summit area of Stromboli, and some lapilli samples were collected. In the N crater area near the N1 crater, a small cone was observed with at least two active vents, one of which was characterized by Strombolian explosions. The other vent produced explosions that ejected ash and chunks of cooled lava. At the N2 crater at least one vent was active and frequently emitted ash. In the CS crater area, a small cone contained 2-3 degassing vents and a smaller, possible fissure area also showed signs of degassing close to the Pizzo Sopra La Fossa. In the S part of the crater, three vents were active: a small hornito was characterized by modest and rare explosions, a vent that intermittently produced weak Strombolian explosions, and a vent at the end of the terrace that produced frequent ash emissions. Near the S1 crater there was a hornito that generally emitted weak gas-and-steam emissions, sometimes associated with “gas rings”. On 22 April another field inspection was carried out that reported two large sliding surfaces on the Sciara del Fuoco that showed where blocks frequently descended toward the sea. A thermal anomaly was detected at 0150 on 29 April.
Geologic Background. Spectacular incandescent nighttime explosions at Stromboli have long attracted visitors to the "Lighthouse of the Mediterranean" in the NE Aeolian Islands. This volcano has lent its name to the frequent mild explosive activity that has characterized its eruptions throughout much of historical time. The small island is the emergent summit of a volcano that grew in two main eruptive cycles, the last of which formed the western portion of the island. The Neostromboli eruptive period took place between about 13,000 and 5,000 years ago. The active summit vents are located at the head of the Sciara del Fuoco, a prominent scarp that formed about 5,000 years ago due to a series of slope failures which extends to below sea level. The modern volcano has been constructed within this scarp, which funnels pyroclastic ejecta and lava flows to the NW. Essentially continuous mild Strombolian explosions, sometimes accompanied by lava flows, have been recorded for more than a millennium.
Information Contacts: Istituto Nazionale di Geofisica e Vulcanologia (INGV), Sezione di Catania, Piazza Roma 2, 95123 Catania, Italy, (URL: http://www.ct.ingv.it/en/); MIROVA (Middle InfraRed Observation of Volcanic Activity), a collaborative project between the Universities of Turin and Florence (Italy) supported by the Centre for Volcanic Risk of the Italian Civil Protection Department (URL: http://www.mirovaweb.it/); Hawai'i Institute of Geophysics and Planetology (HIGP) - MODVOLC Thermal Alerts System, School of Ocean and Earth Science and Technology (SOEST), Univ. of Hawai'i, 2525 Correa Road, Honolulu, HI 96822, USA (URL: http://modis.higp.hawaii.edu/); Copernicus Browser, Copernicus Data Space Ecosystem, European Space Agency (URL: https://dataspace.copernicus.eu/browser/).
Nishinoshima (Japan) — July 2023 Cite this Report
Nishinoshima
Japan
27.247°N, 140.874°E; summit elev. 100 m
All times are local (unless otherwise noted)
Small ash plumes and fumarolic activity during November 2022 through April 2023
Nishinoshima is a small island located about 1,000 km S of Tokyo in the Ogasawara Arc in Japan. The island is the summit of a massive submarine volcano that has prominent peaks to the S, W, and NE. Eruptions date back to 1973; the most recent eruption period began in October 2022 and was characterized by ash plumes and fumarolic activity (BGVN 47:12). This report describes ash plumes and fumarolic activity during November 2022 through April 2023 based on monthly reports from the Japan Meteorological Agency (JMA) monthly reports and satellite data.
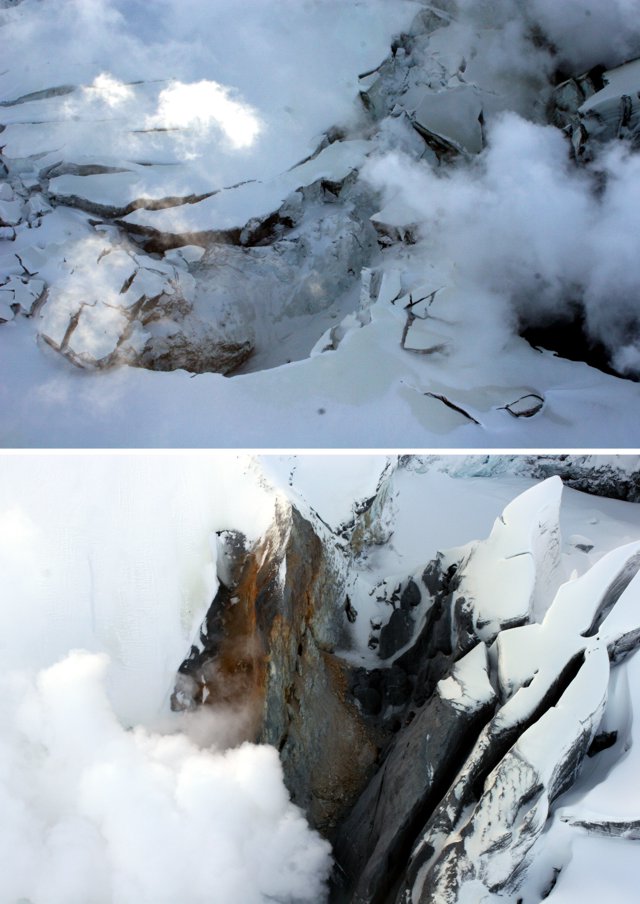
The most recent eruptive activity prior to the reporting internal occurred on 12 October 2022, when an ash plume rose 3.5 km above the crater rim. An aerial observation conducted by the Japan Coast Guard (JCG) on 25 November reported that white fumaroles rose approximately 200 m above the central crater of a pyroclastic cone (figure 119), and multiple plumes were observed on the ESE flank of the cone. Discolored water ranging from reddish-brown to brown and yellowish-green were visible around the perimeter of the island (figure 119). No significant activity was reported in December.
During an overflight conducted by JCG on 25 January 2023 intermittent activity and small, blackish-gray plumes rose 900 m above the central part of the crater were observed (figure 120). The fumarolic zone of the E flank and base of the cone had expanded and emissions had intensified. Dark brown discolored water was visible around the perimeter of the island.
No significant activity was reported during February through March. Ash plumes at 1050 and 1420 on 11 April rose 1.9 km above the crater rim and drifted NW and N. These were the first ash plumes observed since 12 October 2022. On 14 April JCG carried out an overflight and reported that no further eruptive activity was visible, although white gas-and-steam plumes were visible from the central crater and rose 900 m high (figure 121). Brownish and yellow-green discolored water surrounded the island.
Intermittent low-to-moderate power thermal anomalies were recorded in the MIROVA graph (Middle InfraRed Observation of Volcanic Activity) during November 2022 through April 2023 (figure 123). A cluster of six to eight anomalies were detected during November while a smaller number were detected during the following months: two to three during December, one during mid-January 2023, one during February, five during March, and two during April. Thermal activity was also reflected in infrared satellite data at the summit crater, accompanied by occasional gas-and-steam plumes (figure 124).
Geologic Background. The small island of Nishinoshima was enlarged when several new islands coalesced during an eruption in 1973-74. Multiple eruptions that began in 2013 completely covered the previous exposed surface and continued to enlarge the island. The island is the summit of a massive submarine volcano that has prominent peaks to the S, W, and NE. The summit of the southern cone rises to within 214 m of the ocean surface 9 km SSE.
Information Contacts: Japan Meteorological Agency (JMA), 1-3-4 Otemachi, Chiyoda-ku, Tokyo 100-8122, Japan (URL: http://www.jma.go.jp/jma/indexe.html); MIROVA (Middle InfraRed Observation of Volcanic Activity), a collaborative project between the Universities of Turin and Florence (Italy) supported by the Centre for Volcanic Risk of the Italian Civil Protection Department (URL: http://www.mirovaweb.it/); Copernicus Browser, Copernicus Data Space Ecosystem, European Space Agency (URL: https://dataspace.copernicus.eu/browser/).
Karangetang (Indonesia) — July 2023 Cite this Report
Karangetang
Indonesia
2.781°N, 125.407°E; summit elev. 1797 m
All times are local (unless otherwise noted)
Lava flows, incandescent avalanches, and ash plumes during January-June 2023
Karangetang (also known as Api Siau), at the northern end of the island of Siau, Indonesia, contains five summit craters along a N-S line. More than 40 eruptions have been recorded since 1675; recent eruptions have included frequent explosive activity, sometimes accompanied by pyroclastic flows and lahars. Lava dome growth has occurred in the summit craters and collapses of lava flow fronts have produced pyroclastic flows. The two active summit craters are Kawah Dua (the N crater) and Kawah Utama (the S crater, also referred to as the “Main Crater”). The most recent eruption began in late November 2018 and has more recently consisted of weak thermal activity and gas-and-steam emissions (BGVN 48:01). This report updates activity characterized by lava flows, incandescent avalanches, and ash plumes during January through June 2023 using reports from Pusat Vulkanologi dan Mitigasi Bencana Geologi (PVMBG, also known as CVGHM, or the Center of Volcanology and Geological Hazard Mitigation), MAGMA Indonesia, the Darwin VAAC (Volcano Ash Advisory Center), and satellite data.
Activity during January was relatively low and mainly consisted of white gas-and-steam emissions that rose 25-150 m above Main Crater (S crater) and drifted in different directions. Incandescence was visible from the lava dome in Kawah Dua (the N crater). Weather conditions often prevented clear views of the summit. On 18 January the number of seismic signals that indicated avalanches of material began to increase. In addition, there were a total of 71 earthquakes detected during the month.
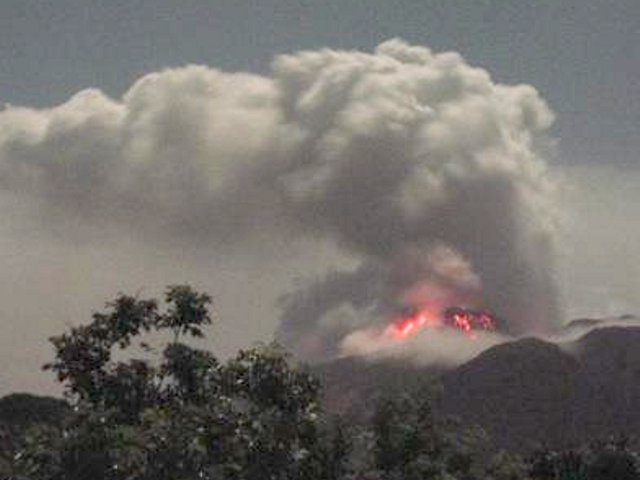
Activity continued to increase during the first week of February. Material from Main Crater traveled as far as 800 m down the Batuawang (S) and Batang (W) drainages and as far as 1 km W down the Beha (W) drainage on 4 February. On 6 February 43 earthquake events were recorded, and on 7 February, 62 events were recorded. White gas-and-steam emissions rose 25-250 m above both summit craters throughout the month. PVMBG reported an eruption began during the evening of 8 February around 1700. Photos showed incandescent material at Main Crater. Incandescent material had also descended the flank in at least two unconfirmed directions as far as 2 km from Main Crater, accompanied by ash plumes (figure 60). As a result, PVMBG increased the Volcano Alert Level (VAL) to 3 (the second highest level on a 1-4 scale).
Occasional nighttime webcam images showed three main incandescent lava flows of differing lengths traveling down the S, SW, and W flanks (figure 61). Incandescent rocks were visible on the upper flanks, possibly from ejected or collapsed material from the crater, and incandescence was the most intense at the summit. Based on analyses of satellite imagery and weather models, the Darwin VAAC reported that daily ash plumes during 16-20 February rose to 2.1-3 km altitude and drifted NNE, E, and SE. BNPB reported on 16 February that as many as 77 people were evacuated and relocated to the East Siau Museum. A webcam image taken at 2156 on 17 February possibly showed incandescent material descending the SE flank. Ash plumes rose to 2.1 km altitude and drifted SE during 22-23 February, according to the Darwin VAAC.
Incandescent avalanches of material and summit incandescence at Main Crater continued during March. White gas-and-steam emissions during March generally rose 25-150 m above the summit crater; on 31 March gas-and-steam emissions rose 200-400 m high. An ash plume rose to 2.4 km altitude and drifted S at 1710 on 9 March and a large thermal anomaly was visible in images taken at 0550 and 0930 on 10 March. Incandescent material was visible at the summit and on the flanks based on webcam images taken at 0007 and 2345 on 16 March, at 1828 on 17 March, at 1940 on 18 March, at 2311 on 19 March, and at 2351 on 20 March. Incandescence was most intense on 18 and 20 March and webcam images showed possible Strombolian explosions (figure 62). An ash plume rose to 2.4 km altitude and drifted SW on 18 March, accompanied by a thermal anomaly.
Summit crater incandescence at Main Crater and on the flanks persisted during April. Incandescent material at the S crater and on the flanks was reported at 0016 on 1 April. The lava flows had stopped by 1 April according to PVMBG, although incandescence was still visible up to 10 m high. Seismic signals indicating effusion decreased and by 6 April they were no longer detected. Incandescence was visible from both summit craters. On 26 April the VAL was lowered to 2 (the second lowest level on a 1-4 scale). White gas-and-steam emissions rose 25-200 m above the summit crater.
During May white gas-and-steam emissions generally rose 50-250 m above the summit, though it was often cloudy, which prevented clear views; on 21 May gas-and-steam emissions rose 50-400 m high. Nighttime N summit crater incandescence rose 10-25 m above the lava dome, and less intense incandescence was noted above Main Crater, which reached about 10 m above the dome. Sounds of falling rocks at Main Crater were heard on 15 May and the seismic network recorded 32 rockfall events in the crater on 17 May. Avalanches traveled as far as 1.5 km down the SW and S flanks, accompanied by rumbling sounds on 18 May. Incandescent material descending the flanks was captured in a webcam image at 2025 on 19 May (figure 63) and on 29 May; summit crater incandescence was observed in webcam images at 2332 on 26 May and at 2304 on 29 May. On 19 May the VAL was again raised to 3.
Occasional Main Crater incandescence was reported during June, as well as incandescent material on the flanks. White gas-and-steam emissions rose 10-200 m above the summit crater. Ash plumes rose to 2.1 km altitude and drifted SE and E during 2-4 June, according to the Darwin VAAC. Material on the flanks of Main Crater were observed at 2225 on 7 June, at 2051 on 9 June, at 0007 on 17 June, and at 0440 on 18 June. Webcam images taken on 21, 25, and 27 June showed incandescence at Main Crater and from material on the flanks.
MIROVA (Middle InfraRed Observation of Volcanic Activity) analysis of MODIS satellite data showed strong thermal activity during mid-February through March and mid-May through June, which represented incandescent avalanches and lava flows (figure 64). During April through mid-May the power of the anomalies decreased but frequent anomalies were still detected. Brief gaps in activity occurred during late March through early April and during mid-June. Infrared satellite images showed strong lava flows mainly affecting the SW and S flanks, accompanied by gas-and-steam emissions (figure 65). According to data recorded by the MODVOLC thermal algorithm, there were a total of 79 thermal hotspots detected: 28 during February, 24 during March, one during April, five during May, and 21 during June.
Geologic Background. Karangetang (Api Siau) volcano lies at the northern end of the island of Siau, about 125 km NNE of the NE-most point of Sulawesi. The stratovolcano contains five summit craters along a N-S line. It is one of Indonesia's most active volcanoes, with more than 40 eruptions recorded since 1675 and many additional small eruptions that were not documented (Neumann van Padang, 1951). Twentieth-century eruptions have included frequent explosive activity sometimes accompanied by pyroclastic flows and lahars. Lava dome growth has occurred in the summit craters; collapse of lava flow fronts have produced pyroclastic flows.
Information Contacts: Pusat Vulkanologi dan Mitigasi Bencana Geologi (PVMBG, also known as Indonesian Center for Volcanology and Geological Hazard Mitigation, CVGHM), Jalan Diponegoro 57, Bandung 40122, Indonesia (URL: http://www.vsi.esdm.go.id/); MAGMA Indonesia, Kementerian Energi dan Sumber Daya Mineral (URL: https://magma.esdm.go.id/v1); Badan Nasional Penanggulangan Bencana (BNPB), National Disaster Management Agency, Graha BNPB - Jl. Scout Kav.38, East Jakarta 13120, Indonesia (URL: http://www.bnpb.go.id/); Darwin Volcanic Ash Advisory Centre (VAAC), Bureau of Meteorology, Northern Territory Regional Office, PO Box 40050, Casuarina, NT 0811, Australia (URL: http://www.bom.gov.au/info/vaac/); MIROVA (Middle InfraRed Observation of Volcanic Activity), a collaborative project between the Universities of Turin and Florence (Italy) supported by the Centre for Volcanic Risk of the Italian Civil Protection Department (URL: http://www.mirovaweb.it/); Hawai'i Institute of Geophysics and Planetology (HIGP) - MODVOLC Thermal Alerts System, School of Ocean and Earth Science and Technology (SOEST), Univ. of Hawai'i, 2525 Correa Road, Honolulu, HI 96822, USA (URL: http://modis.higp.hawaii.edu/); Copernicus Browser, Copernicus Data Space Ecosystem, European Space Agency (URL: https://dataspace.copernicus.eu/browser/); IDN Times, Jl. Jend. Gatot Subroto Kav. 27 3rd Floor Kuningan, Jakarta, Indonesia 12950, Status of Karangetang Volcano in Sitaro Islands Increases (URL: https://sulsel.idntimes.com/news/indonesia/savi/status-gunung-api-karangetang-di-kepulauan-sitaro-meningkat?page=all).
Ahyi (United States) — July 2023 Cite this Report
Ahyi
United States
20.42°N, 145.03°E; summit elev. -75 m
All times are local (unless otherwise noted)
Intermittent hydroacoustic signals and discolored plumes during November 2022-June 2023
Ahyi seamount is a large, conical submarine volcano that rises to within 75 m of the ocean surface about 18 km SE of the island of Farallon de Pajaros in the Northern Marianas. The remote location of the seamount has made eruptions difficult to document, but seismic stations installed in the region confirmed an eruption in the vicinity in 2001. No new activity was detected until April-May 2014 when an eruption was detected by NOAA (National Oceanic and Atmospheric Administration) divers, hydroacoustic sensors, and seismic stations (BGVN 42:04). New activity was first detected on 15 November by hydroacoustic sensors that were consistent with submarine volcanic activity. This report covers activity during November 2022 through June 2023 based on daily and weekly reports from the US Geological Survey.
Starting in mid-October, hydroacoustic sensors at Wake Island (2.2 km E) recorded signals consistent with submarine volcanic activity, according to a report from the USGS issued on 15 November 2022. A combined analysis of the hydroacoustic signals and seismic stations located at Guam and Chichijima Island, Japan, suggested that the source of this activity was at or near the Ahyi seamount. After a re-analysis of a satellite image of the area that was captured on 6 November, USGS confirmed that there was no evidence of discoloration at the ocean surface. Few hydroacoustic and seismic signals continued through November, including on 18 November, which USGS suggested signified a decline or pause in unrest. A VONA (Volcano Observatory Notice for Aviation) reported that a discolored water plume was persistently visible in satellite data starting on 18 November (figure 6). Though clouds often obscured clear views of the volcano, another discolored water plume was captured in a satellite image on 26 November. The Aviation Color Code (ACC) was raised to Yellow (the second lowest level on a four-color scale) and the Volcano Alert Level (VAL) was raised to Advisory (the second lowest level on a four-level scale) on 29 November.
During December, occasional detections were recorded on the Wake Island hydrophone sensors and discolored water over the seamount remained visible. During 2-7, 10-12, and 16-31 December possible explosion signals were detected. A small area of discolored water was observed in high-resolution Sentinel-2 satellite images during 1-6 December (figure 7). High-resolution satellite images recorded discolored water plumes on 13 December that originated from the summit region; no observations indicated that activity breached the ocean surface. A possible underwater plume was visible in satellite images on 18 December, and during 19-20 December a definite but diffuse underwater plume located SSE from the main vent was reported. An underwater plume was visible in a satellite image taken on 26 December (figure 7).
Hydrophone sensors continued to detect signals consistent with possible explosions during 1-8 January 2023. USGS reported that the number of detections decreased during 4-5 January. The hydrophone sensors experienced a data outage that started at 0118 on 8 January and continued through 10 January, though according to USGS, possible explosions were recorded prior to the data outage and likely continued during the outage. A discolored water plume originating from the summit region was detected in a partly cloudy satellite image on 8 January. On 11-12 and 15-17 January possible explosion signals were recorded again. One small signal was detected during 22-23 January and several signals were recorded on 25 and 31 January. During 27-31 January a plume of discolored water was observed above the seamount in satellite imagery (figure 8).
Low levels of activity continued during February and March, based on data from pressure sensors on Wake Island. During 1 and 4-6 February activity was reported, and a submarine plume was observed on 4 February (figure 8). Possible explosion signals were detected during 7-8, 10, 13-14, and 24 February. During 1-2 and 3-5 March a plume of discolored water was observed in satellite imagery (figure 8). Almost continuous hydroacoustic signals were detected in remote pressure sensor data on Wake Island 2,270 km E from the volcano during 7-13 March. During 12-13 March water discoloration around the seamount was observed in satellite imagery, despite cloudy weather. By 14 March discolored water extended about 35 km, but no direction was noted. USGS reported that the continuous hydroacoustic signals detected during 13-14 March stopped abruptly on 14 March and no new detections were observed. Three 30 second hydroacoustic detections were reported during 17-19 March, but no activity was visible due to cloudy weather. A data outage was reported during 21-22 March, making pressure sensor data unavailable; a discolored water plume was, however, visible in satellite data. A possible underwater explosion signal was detected by pressure sensors at Wake Island on 26, 29, and 31 March, though the cause and origin of these events were unclear.
Similar low activity continued during April, May, and June. Several signals were detected during 1-3 April in pressure sensors at Wake Island. USGS suggested that these may be related to underwater explosions or earthquakes at the volcano, but no underwater plumes were visible in clear satellite images. The pressure sensors had data outages during 12-13 April and no data were recorded; no underwater plumes were visible in satellite images, although cloudy weather obscured most clear views. Eruptive activity was reported starting at 2210 on 21 May. On 22 May a discolored water plume that extended 4 km was visible in satellite images, though no direction was recorded. During 23-24 May some signals were detected by the underwater pressure sensors. Possible hydroacoustic signals were detected during 2-3 and 6-8 June. Multiple hydroacoustic signals were detected during 9-11 and 16-17 June, although no activity was visible in satellite images. One hydroacoustic signal was detected during 23-24 June, but there was some uncertainty about its association with volcanic activity. A single possible hydroacoustic signal was detected during 30 June to 1 July.
Geologic Background. Ahyi seamount is a large conical submarine volcano that rises to within 75 m of the ocean surface ~18 km SE of the island of Farallon de Pajaros in the northern Marianas. Water discoloration has been observed there, and in 1979 the crew of a fishing boat felt shocks over the summit area, followed by upwelling of sulfur-bearing water. On 24-25 April 2001 an explosive eruption was detected seismically by a station on Rangiroa Atoll, Tuamotu Archipelago. The event was well constrained (+/- 15 km) at a location near the southern base of Ahyi. An eruption in April-May 2014 was detected by NOAA divers, hydroacoustic sensors, and seismic stations.
Information Contacts: US Geological Survey, Volcano Hazards Program (USGS-VHP), 12201 Sunrise Valley Drive, Reston, VA, USA, https://volcanoes.usgs.gov/index.html; Copernicus Browser, Copernicus Data Space Ecosystem, European Space Agency (URL: https://dataspace.copernicus.eu/browser/).
Kadovar (Papua New Guinea) — June 2023 Cite this Report
Kadovar
Papua New Guinea
3.608°S, 144.588°E; summit elev. 365 m
All times are local (unless otherwise noted)
An ash plume and weak thermal anomaly during May 2023
Kadovar is a 2-km-wide island that is the emergent summit of a Bismarck Sea stratovolcano. It lies off the coast of New Guinea, about 25 km N of the mouth of the Sepik River. Prior to an eruption that began in 2018, a lava dome formed the high point of the volcano, filling an arcuate landslide scarp open to the S. Submarine debris-avalanche deposits occur to the S of the island. The current eruption began in January 2018 and has comprised lava effusion from vents at the summit and at the E coast; more recent activity has consisted of ash plumes, weak thermal activity, and gas-and-steam plumes (BGVN 48:02). This report covers activity during February through May 2023 using information from the Darwin Volcanic Ash Advisory Center (VAAC) and satellite data.
Activity during the reporting period was relatively low and mainly consisted of white gas-and-steam plumes that were visible in natural color satellite images on clear weather days (figure 67). According to a Darwin VAAC report, at 2040 on 6 May an ash plume rose to 4.6 km altitude and drifted W; by 2300 the plume had dissipated. MODIS satellite instruments using the MODVOLC thermal algorithm detected a single thermal hotspot on the SE side of the island on 7 May. Weak thermal activity was also detected in a satellite image on the E side of the island on 14 May, accompanied by a white gas-and-steam plume that drifted SE (figure 68).
Geologic Background. The 2-km-wide island of Kadovar is the emergent summit of a Bismarck Sea stratovolcano of Holocene age. It is part of the Schouten Islands, and lies off the coast of New Guinea, about 25 km N of the mouth of the Sepik River. Prior to an eruption that began in 2018, a lava dome formed the high point of the andesitic volcano, filling an arcuate landslide scarp open to the south; submarine debris-avalanche deposits occur in that direction. Thick lava flows with columnar jointing forms low cliffs along the coast. The youthful island lacks fringing or offshore reefs. A period of heightened thermal phenomena took place in 1976. An eruption began in January 2018 that included lava effusion from vents at the summit and at the E coast.
Information Contacts: Darwin Volcanic Ash Advisory Centre (VAAC), Bureau of Meteorology, Northern Territory Regional Office, PO Box 40050, Casuarina, NT 0811, Australia (URL: http://www.bom.gov.au/info/vaac/); Hawai'i Institute of Geophysics and Planetology (HIGP) - MODVOLC Thermal Alerts System, School of Ocean and Earth Science and Technology (SOEST), Univ. of Hawai'i, 2525 Correa Road, Honolulu, HI 96822, USA (URL: http://modis.higp.hawaii.edu/); Copernicus Browser, Copernicus Data Space Ecosystem, European Space Agency (URL: https://dataspace.copernicus.eu/browser/).
San Miguel (El Salvador) — June 2023 Cite this Report
San Miguel
El Salvador
13.434°N, 88.269°W; summit elev. 2130 m
All times are local (unless otherwise noted)
Small gas-and-ash explosions during March and May 2023
San Miguel in El Salvador is a broad, deep crater complex that has been frequently modified by eruptions recorded since the early 16th century and consists of the summit known locally as Chaparrastique. Flank eruptions have produced lava flows that extended to the N, NE, and SE during the 17-19th centuries. The most recent activity has consisted of minor ash eruptions from the summit crater. The current eruption period began in November 2022 and has been characterized by frequent phreatic explosions, gas-and-ash emissions, and sulfur dioxide plumes (BGVN 47:12). This report describes small gas-and-ash explosions during December 2022 through May 2023 based on special reports from the Ministero de Medio Ambiente y Recursos Naturales (MARN).
Activity has been relatively low since the last recorded explosions on 29 November 2022. Seismicity recorded by the San Miguel Volcano Station (VSM) located on the N flank at 1.7 km elevation had decreased by 7 December. Sulfur dioxide gas measurements taken with DOAS (Differential Optical Absorption Spectroscopy) mobile equipment were below typical previously recorded values: 300 tons per day (t/d). During December, small explosions were recorded by the seismic network and manifested as gas-and-steam emissions.
Gas-and-ash explosions in the crater occurred during January 2023, which were recorded by the seismic network. Sulfur dioxide values remained low, between 300-400 t/d through 10 March. At 0817 on 14 January a gas-and-ash emission was visible in webcam images, rising just above the crater rim. Some mornings during February, small gas-and-steam plumes were visible in the crater. On 7 March at 2252 MARN noted an increase in degassing from the central crater; gas emissions were constantly observed through the early morning hours on 8 March. During the early morning of 8 March through the afternoon on 9 March, 12 emissions were registered, some accompanied by ash. The last gas-and-ash emission was recorded at 1210 on 9 March; very fine ashfall was reported in El Tránsito (10 km S), La Morita (6 km W), and La Piedrita (3 km W). The smell of sulfur was reported in Piedra Azul (5 km SW). On 16 March MARN reported that gas-and-steam emissions decreased.
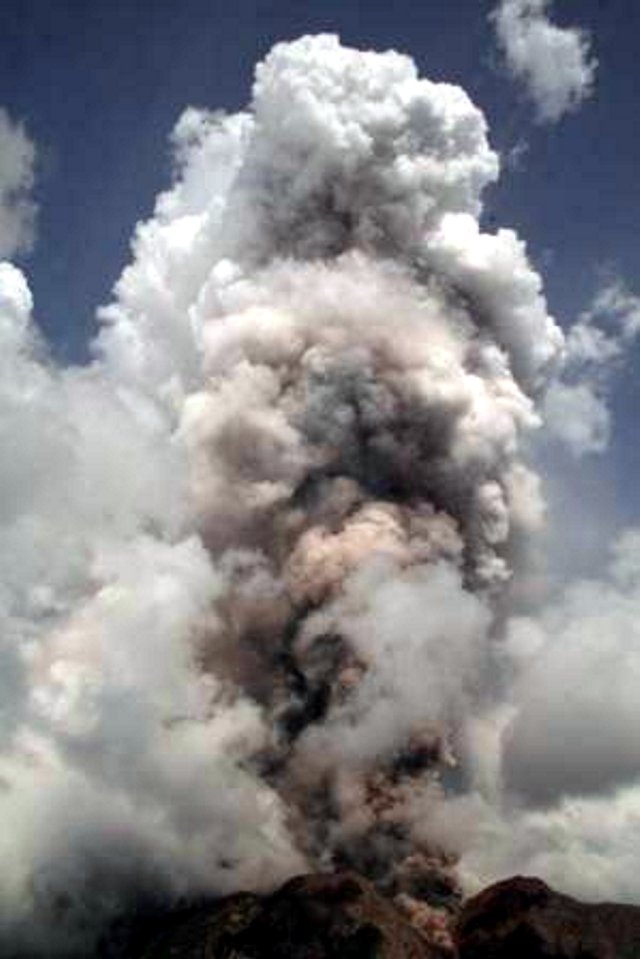
Low degassing and very low seismicity were reported during April; no explosions have been detected between 9 March and 27 May. The sulfur dioxide emissions remained between 350-400 t/d; during 13-20 April sulfur dioxide values fluctuated between 30-300 t/d. Activity remained low through most of May; on 23 May seismicity increased. An explosion was detected at 1647 on 27 May generated a gas-and-ash plume that rose 700 m high (figure 32); a decrease in seismicity and gas emissions followed. The DOAS station installed on the W flank recorded sulfur dioxide values that reached 400 t/d on 27 May; subsequent measurements showed a decrease to 268 t/d on 28 May and 100 t/d on 29 May.
Geologic Background. The symmetrical cone of San Miguel, one of the most active volcanoes in El Salvador, rises from near sea level to form one of the country's most prominent landmarks. A broad, deep, crater complex that has been frequently modified by eruptions recorded since the early 16th century caps the truncated unvegetated summit, also known locally as Chaparrastique. Flanks eruptions of the basaltic-andesitic volcano have produced many lava flows, including several during the 17th-19th centuries that extended to the N, NE, and SE. The SE-flank flows are the largest and form broad, sparsely vegetated lava fields crossed by highways and a railroad skirting the base of the volcano. Flank vent locations have migrated higher on the edifice during historical time, and the most recent activity has consisted of minor ash eruptions from the summit crater.
Information Contacts: Ministero de Medio Ambiente y Recursos Naturales (MARN), Km. 5½ Carretera a Nueva San Salvador, Avenida las Mercedes, San Salvador, El Salvador (URL: http://www.snet.gob.sv/ver/vulcanologia).
Semisopochnoi (United States) — June 2023 Cite this Report
Semisopochnoi
United States
51.93°N, 179.58°E; summit elev. 1221 m
All times are local (unless otherwise noted)
Occasional explosions, ash deposits, and gas-and-steam plumes during December 2022-May 2023
Semisopochnoi is located in the western Aleutians, is 20-km-wide at sea level, and contains an 8-km-wide caldera. The three-peaked Mount Young (formerly Cerberus) was constructed within the caldera during the Holocene. Each of these peaks contains a summit crater; the lava flows on the N flank appear younger than those on the S side. The current eruption period began in early February 2021 and has more recently consisted of intermittent explosions and ash emissions (BGVN 47:12). This report updates activity during December 2022 through May 2023 using daily, weekly, and special reports from the Alaska Volcano Observatory (AVO). AVO monitors the volcano using local seismic and infrasound sensors, satellite data, web cameras, and remote infrasound and lightning networks.
Activity during most of December 2022 was relatively quiet; according to AVO no eruptive or explosive activity was observed since 7 November 2022. Intermittent tremor and occasional small earthquakes were observed in geophysical data. Continuous gas-and-steam emissions were observed from the N crater of Mount Young in webcam images on clear weather days (figure 25). On 24 December, there was a slight increase in earthquake activity and several small possible explosion signals were detected in infrasound data. Eruptive activity resumed on 27 December at the N crater of Mount Young; AVO issued a Volcano Activity Notice (VAN) that reported minor ash deposits on the flanks of Mount Young that extended as far as 1 km from the vent, according to webcam images taken during 27-28 December (figure 26). No ash plumes were observed in webcam or satellite imagery, but a persistent gas-and-steam plume that might have contained some ash rose to 1.5 km altitude. As a result, AVO raised the Aviation Color Code (ACC) to Orange (the second highest level on a four-color scale) and the Volcano Alert Level (VAL) to Watch (the second highest level on a four-level scale). Possible explosions were detected during 21 December 2022 through 1 January 2023 and seismic tremor was recorded during 30-31 December.
During January 2023 eruptive activity continued at the active N crater of Mount Young. Minor ash deposits were observed on the flanks, extending about 2 km SSW, based on webcam images from 1 and 3 January. A possible explosion occurred during 1-2 January based on elevated seismicity recorded on local seismometers and an infrasound signal recorded minutes later by an array at Adak. Though no ash plumes were observed in webcam or satellite imagery, a persistent gas-and-steam plume rose to 1.5 km altitude that might have carried minor traces of ash. Ash deposits were accompanied by periods of elevated seismicity and infrasound signals from the local geophysical network, which AVO reported were likely due to weak explosive activity. Low-level explosive activity was also detected during 2-3 January, with minor gas-and-steam emissions and a new ash deposit that was visible in webcam images. Low-level explosive activity was detected in geophysical data during 4-5 January, with elevated seismicity and infrasound signals observed on local stations. Volcanic tremor was detected during 7-9 January and very weak explosive activity was detected in seismic and infrasound data on 9 January. Weak seismic and infrasound signals were recorded on 17 January, which indicated minor explosive activity, but no ash emissions were observed in clear webcam images; a gas-and-steam plume continued to rise to 1.5 km altitude. During 29-30 January, ash deposits near the summit were observed on fresh snow, according to webcam images.
The active N cone at Mount Young continued to produce a gas-and-steam plume during February, but no ash emissions or explosive events were detected. Seismicity remained elevated with faint tremor during early February. Gas-and-steam emissions from the N crater were observed in clear webcam images on 11-13 and 16 February; no explosive activity was detected in seismic, infrasound, or satellite data. Seismicity has also decreased, with no significant seismic tremor observed since 25 January. Therefore, the ACC was lowered to Yellow (the second lowest level on a four-color scale) and the VAL was lowered to Advisory (the second lowest level on a four-color scale) on 22 February.
Gas-and-steam emissions persisted during March from the N cone of Mount Young, based on clear webcam images. A few brief episodes of weak tremor were detected in seismic data, although seismicity decreased over the month. A gas-and-steam plume detected in satellite data extended 150 km on 18 March. Low-level ash emissions from the N cone at Mount Young were observed in several webcam images during 18-19 March, in addition to small explosions and volcanic tremor. The ACC was raised to Orange and the VAL increased to Watch on 19 March. A small explosion was detected in seismic and infrasound data on 21 March.
Low-level unrest continued during April, although cloudy weather often obscured views of the summit; periods of seismic tremor and local earthquakes were recorded. During 3-4 April a gas-and-steam plume was visible traveling more than 200 km overnight; no ash was evident in the plume, according to AVO. A gas-and-steam plume was observed during 4-6 April that extended 400 km but did not seem to contain ash. Small explosions were detected in seismic and infrasound data on 5 April. Occasional clear webcam images showed continuing gas-and-steam emissions rose from Mount Young, but no ash deposits were observed on the snow. On 19 April small explosions and tremor were detected in seismic and infrasound data. A period of seismic tremor was detected during 22-25 April, with possible weak explosions on 25 April. Ash deposits were visible near the crater rim, but it was unclear if these deposits were recent or due to older deposits.
Occasional small earthquakes were recorded during May, but there were no signs of explosive activity seen in geophysical data. Gas-and-steam emissions continued from the N crater of Mount Young, based on webcam images, and seismicity remained slightly elevated. A new, light ash deposit was visible during the morning of 5 May on fresh snow on the NW flank of Mount Young. During 10 May periods of volcanic tremor were observed. The ACC was lowered to Yellow and the VAL to Advisory on 17 May due to no additional evidence of activity.
Geologic Background. Semisopochnoi, the largest subaerial volcano of the western Aleutians, is 20 km wide at sea level and contains an 8-km-wide caldera. It formed as a result of collapse of a low-angle, dominantly basaltic volcano following the eruption of a large volume of dacitic pumice. The high point of the island is Anvil Peak, a double-peaked late-Pleistocene cone that forms much of the island's northern part. The three-peaked Mount Cerberus (renamed Mount Young in 2023) was constructed within the caldera during the Holocene. Each of the peaks contains a summit crater; lava flows on the N flank appear younger than those on the south side. Other post-caldera volcanoes include the symmetrical Sugarloaf Peak SSE of the caldera and Lakeshore Cone, a small cinder cone at the edge of Fenner Lake in the NE part of the caldera. Most documented eruptions have originated from Young, although Coats (1950) considered that both Sugarloaf and Lakeshore Cone could have been recently active.
Information Contacts: Alaska Volcano Observatory (AVO), a cooperative program of a) U.S. Geological Survey, 4200 University Drive, Anchorage, AK 99508-4667 USA (URL: https://avo.alaska.edu/), b) Geophysical Institute, University of Alaska, PO Box 757320, Fairbanks, AK 99775-7320, USA, and c) Alaska Division of Geological & Geophysical Surveys, 794 University Ave., Suite 200, Fairbanks, AK 99709, USA (URL: http://dggs.alaska.gov/).
Ebeko
Russia
50.686°N, 156.014°E; summit elev. 1103 m
All times are local (unless otherwise noted)
Continued explosions, ash plumes, and ashfall during October 2022-May 2023
Ebeko, located on the N end of Paramushir Island in the Kuril Islands, consists of three summit craters along a SSW-NNE line at the northern end of a complex of five volcanic cones. Eruptions date back to the late 18th century and have been characterized as small-to-moderate explosions from the summit crater, accompanied by intense fumarolic activity. The current eruption period began in June 2022 and has recently consisted of frequent explosions, ash plumes, and thermal activity (BGVN 47:10). This report covers similar activity during October 2022 through May 2023, based on information from the Kamchatka Volcanic Eruptions Response Team (KVERT) and satellite data.
Activity during October consisted of explosive activity, ash plumes, and occasional thermal anomalies. Visual data by volcanologists from Severo-Kurilsk showed explosions producing ash clouds up to 2.1-3 km altitude which drifted E, N, NE, and SE during 1-8, 10, 16, and 18 October. KVERT issued several Volcano Observatory Notices for Aviation (VONA) on 7, 13-15, and 27 October 2022, stating that explosions generated ash plumes that rose to 2.3-4 km altitude and drifted 5 km E, NE, and SE. Ashfall was reported in Severo-Kurilsk (Paramushir Island, about 7 km E) on 7 and 13 October. Satellite data showed a thermal anomaly over the volcano on 15-16 October. Visual data showed ash plumes rising to 2.5-3.6 km altitude on 22, 25-29, and 31 October and moving NE due to constant explosions.
Similar activity continued during November, with explosions, ash plumes, and ashfall occurring. KVERT issued VONAs on 1-2, 4, 6-7, 9, 13, and 16 November that reported explosions and resulting ash plumes that rose to 1.7-3.6 km altitude and drifted 3-5 km SE, ESE, E, and NE. On 1 November ash plumes extended as far as 110 km SE. On 5, 8, 12, and 24-25 November explosions and ash plumes rose to 2-3.1 km altitude and drifted N and E. Ashfall was observed in Severo-Kurilsk on 7 and 16 November. A thermal anomaly was visible during 1-4, 16, and 20 November. Explosions during 26 November rose as high as 2.7 km altitude and drifted NE (figure 45).
Explosions and ash plumes continued to occur in December. During 1-2 and 4 December volcanologists from Severo-Kurilsk observed explosions that sent ash to 1.9-2.5 km altitude and drifted NE and SE (figure 46). VONAs were issued on 5, 9, and 16 December reporting that explosions generated ash plumes rising to 1.9 km, 2.6 km, and 2.4 km altitude and drifted 5 km SE, E, and NE, respectively. A thermal anomaly was visible in satellite imagery on 16 December. On 18 and 27-28 December explosions produced ash plumes that rose to 2.5 km altitude and drifted NE and SE. On 31 December an ash plume rose to 2 km altitude and drifted NE.
Explosions continued during January 2023, based on visual observations by volcanologists from Severo-Kurilsk. During 1-7 January explosions generated ash plumes that rose to 4 km altitude and drifted NE, E, W, and SE. According to VONAs issued by KVERT on 2, 4, 10, and 23 January, explosions produced ash plumes that rose to 2-4 km altitude and drifted 5 km N, NE, E, and ENE; the ash plume that rose to 4 km altitude occurred on 10 January (figure 47). Satellite data showed a thermal anomaly during 3-4, 10, 13, 16, 21, 22, and 31 January. KVERT reported that an ash cloud on 4 January moved 12 km NE. On 6 and 9-11 January explosions sent ash plumes to 4.5 km altitude and drifted W and ESE. On 13 January an ash plume rose to 3 km altitude and drifted SE. During 20-24 January ash plumes from explosions rose to 3.7 km altitude and drifted SE, N, and NE. On 21 January the ash plume drifted as far as 40 km NE. During 28-29 and 31 January and 1 February ash plumes rose to 4 km altitude and drifted NE.
During February, explosions, ash plumes, and ashfall were reported. During 1, 4-5 and 7-8 February explosions generated ash plumes that rose to 4.5 km altitude and drifted E and NE; ashfall was observed on 5 and 8 February. On 6 February an explosion produced an ash plume that rose to 3 km altitude and drifted 7 km E, causing ashfall in Severo-Kurilsk. A thermal anomaly was visible in satellite data on 8, 9, 13, and 21 February. Explosions on 9 and 12-13 February produced ash plumes that rose to 4 km altitude and drifted E and NE; the ash cloud on 12 February extended as far as 45 km E. On 22 February explosions sent ash to 3 km altitude that drifted E. During 24 and 26-27 February ash plumes rose to 4 km altitude and drifted E. On 28 February an explosion sent ash to 2.5-3 km altitude and drifted 5 km E; ashfall was observed in Severo-Kurilsk.
Activity continued during March; visual observations showed that explosions generated ash plumes that rose to 3.6 km altitude on 3, 5-7, and 9-12 March and drifted E, NE, and NW. Thermal anomalies were visible on 10, 13, and 29-30 March in satellite imagery. On 18, 21-23, 26, and 29-30 March explosions produced ash plumes that rose to 2.8 km altitude and drifted NE and E; the ash plumes during 22-23 March extended up to 76 km E. A VONA issued on 21 March reported an explosion that produced an ash plume that rose to 2.8 km altitude and drifted 5 km E. Another VONA issued on 23 March reported that satellite data showed an ash plume rising to 3 km altitude and drifted 14 km E.
Explosions during April continued to generate ash plumes. On 1 and 4 April an ash plume rose to 2.8-3.5 km altitude and drifted SE and NE. A thermal anomaly was visible in satellite imagery during 1-6 April. Satellite data showed ash plumes and clouds rising to 2-3 km altitude and drifting up to 12 km SW and E on 3 and 6 April (figure 48). KVERT issued VONAs on 3, 5, 14, 16 April describing explosions that produced ash plumes rising to 3 km, 3.5 km, 3.5 km, and 3 km altitude and drifting 5 km S, 5 km NE and SE, 72 km NNE, and 5 km NE, respectively. According to satellite data, the resulting ash cloud from the explosion on 14 April was 25 x 7 km in size and drifted 72-104 km NNE during 14-15 April. According to visual data by volcanologists from Severo-Kurilsk explosions sent ash up to 3.5 km altitude that drifted NE and E during 15-16, 22, 25-26, and 29 April.
The explosive eruption continued during May. Explosions during 3-4, 6-7, and 9-10 May generated ash plumes that rose to 4 km altitude and drifted SW and E. Satellite data showed a thermal anomaly on 3, 9, 13-14, and 24 May. During 12-16, 23-25, and 27-28 May ash plumes rose to 3.5 km altitude and drifted in different directions due to explosions. Two VONA notices were issued on 16 and 25 May, describing explosions that generated ash plumes rising to 3 km and 3.5 km altitude, respectively and extending 5 km E. The ash cloud on 25 May drifted 75 km SE.
Thermal activity in the summit crater, occasionally accompanied by ash plumes and ash deposits on the SE and E flanks due to frequent explosions, were visible in infrared and true color satellite images (figure 49).
Geologic Background. The flat-topped summit of the central cone of Ebeko volcano, one of the most active in the Kuril Islands, occupies the northern end of Paramushir Island. Three summit craters located along a SSW-NNE line form Ebeko volcano proper, at the northern end of a complex of five volcanic cones. Blocky lava flows extend west from Ebeko and SE from the neighboring Nezametnyi cone. The eastern part of the southern crater contains strong solfataras and a large boiling spring. The central crater is filled by a lake about 20 m deep whose shores are lined with steaming solfataras; the northern crater lies across a narrow, low barrier from the central crater and contains a small, cold crescentic lake. Historical activity, recorded since the late-18th century, has been restricted to small-to-moderate explosive eruptions from the summit craters. Intense fumarolic activity occurs in the summit craters, on the outer flanks of the cone, and in lateral explosion craters.
Information Contacts: Kamchatka Volcanic Eruptions Response Team (KVERT), Far Eastern Branch, Russian Academy of Sciences, 9 Piip Blvd., Petropavlovsk-Kamchatsky, 683006, Russia (URL: http://www.kscnet.ru/ivs/kvert/); MIROVA (Middle InfraRed Observation of Volcanic Activity), a collaborative project between the Universities of Turin and Florence (Italy) supported by the Centre for Volcanic Risk of the Italian Civil Protection Department (URL: http://www.mirovaweb.it/); Copernicus Browser, Copernicus Data Space Ecosystem, European Space Agency (URL: https://dataspace.copernicus.eu/browser/).
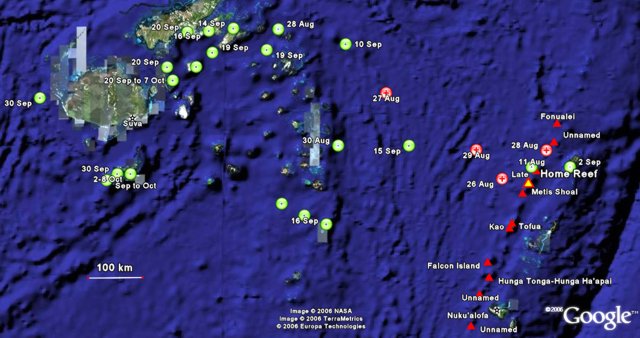
Home Reef
Tonga
18.992°S, 174.775°W; summit elev. -10 m
All times are local (unless otherwise noted)
Discolored plumes continued during November 2022-April 2023
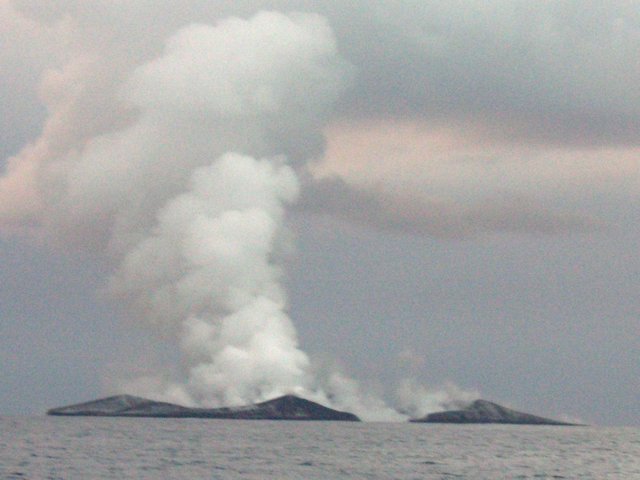
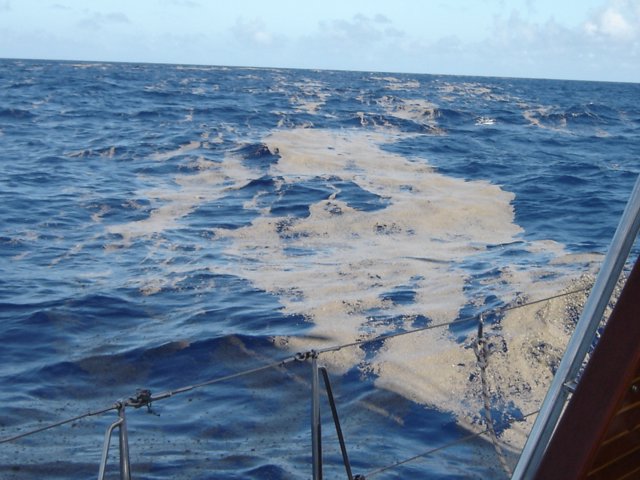
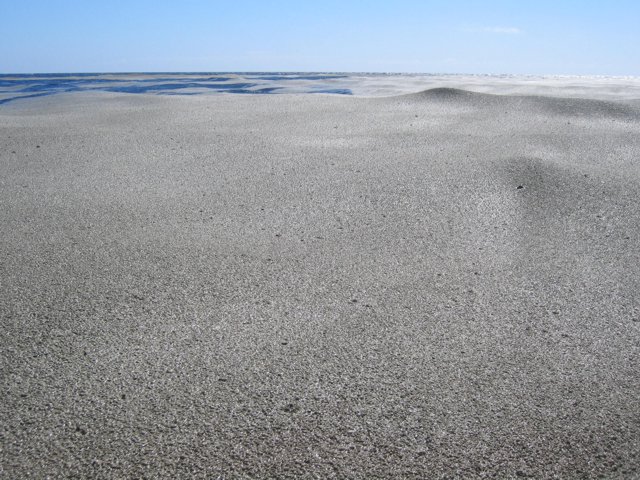
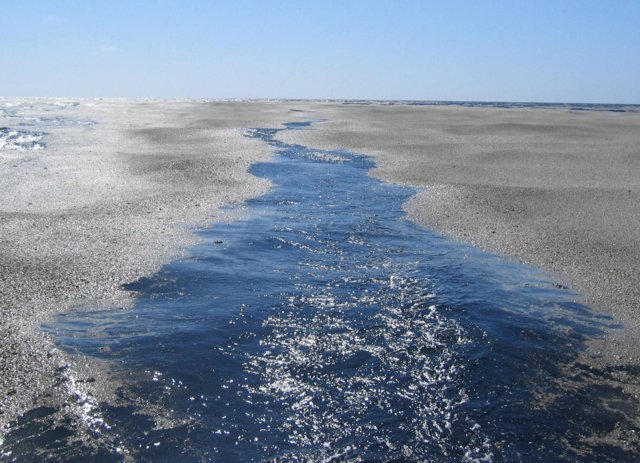
Home Reef is a submarine volcano located in the central Tonga islands between Lateiki (Metis Shoal) and Late Island. The first recorded eruption occurred in the mid-19th century, when an ephemeral island formed. An eruption in 1984 produced a 12-km-high eruption plume, a large volume of floating pumice, and an ephemeral island 500 x 1,500 m wide, with cliffs 30-50 m high that enclosed a water-filled crater. Another island-forming eruption in 2006 produced widespread pumice rafts that drifted as far as Australia; by 2008 the island had eroded below sea level. The previous eruption occurred during October 2022 and was characterized by a new island-forming eruption, lava effusion, ash plumes, discolored water, and gas-and-steam plumes (BGVN 47:11). This report covers discolored water plumes during November 2022 through April 2023 using satellite data.
Discolored plumes continued during the reporting period and were observed in true color satellite images on clear weather days. Satellite images show light green-yellow discolored water extending W on 8 and 28 November 2022 (figure 31), and SW on 18 November. Light green-yellow plumes extended W on 3 December, S on 13 December, SW on 18 December, and W and S on 23 December (figure 31). On 12 January 2023 discolored green-yellow plumes extended to the NE, E, SE, and N. The plume moved SE on 17 January and NW on 22 January. Faint discolored water in February was visible moving NE on 1 February. A discolored plume extended NW on 8 and 28 March and NW on 13 March (figure 31). During April, clear weather showed green-blue discolored plumes moving S on 2 April, W on 7 April, and NE and S on 12 April. A strong green-yellow discolored plume extended E and NE on 22 April for several kilometers (figure 31).
Geologic Background. Home Reef, a submarine volcano midway between Metis Shoal and Late Island in the central Tonga islands, was first reported active in the mid-19th century, when an ephemeral island formed. An eruption in 1984 produced a 12-km-high eruption plume, large amounts of floating pumice, and an ephemeral 500 x 1,500 m island, with cliffs 30-50 m high that enclosed a water-filled crater. In 2006 an island-forming eruption produced widespread dacitic pumice rafts that drifted as far as Australia. Another island was built during a September-October 2022 eruption.
Information Contacts: Copernicus Browser, Copernicus Data Space Ecosystem, European Space Agency (URL: https://dataspace.copernicus.eu/browser/).
Ambae
Vanuatu
15.389°S, 167.835°E; summit elev. 1496 m
All times are local (unless otherwise noted)
New lava flow, ash plumes, and sulfur dioxide plumes during February-May 2023
Ambae, also known as Aoba, is a large basaltic shield volcano in Vanuatu. A broad pyroclastic cone containing three crater lakes (Manaro Ngoru, Voui, and Manaro Lakua) is located at the summit within the youngest of at least two nested calderas. Periodic phreatic and pyroclastic explosions have been reported since the 16th century. A large eruption more than 400 years ago resulted in a volcanic cone within the summit crater that is now filled by Lake Voui; the similarly sized Lake Manaro fills the western third of the caldera. The previous eruption ended in August 2022 that was characterized by gas-and-steam and ash emissions and explosions of wet tephra (BGVN 47:10). This report covers a new eruption during February through May 2023 that consisted of a new lava flow, ash plumes, and sulfur dioxide emissions, using information from the Vanuatu Meteorology and Geo-Hazards Department (VMGD) and satellite data.
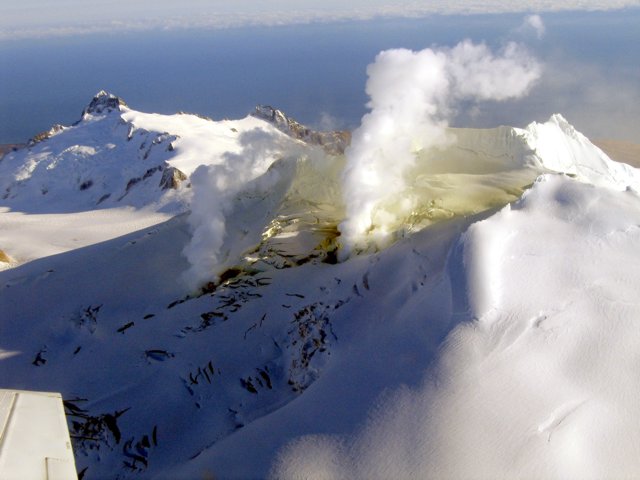
During the reporting period, the Alert Level remained at a 2 (on a scale of 0-5), which has been in place since December 2021. Activity during October 2022 through March 2023 remained relatively low and mostly consisted of gas-and-steam emissions in Lake Voui. VMGD reported that at 1300 on 15 November a satellite image captured a strong amount of sulfur dioxide rising above the volcano (figure 99), and that seismicity slightly increased. The southern and northern part of the island reported a strong sulfur dioxide smell and heard explosions. On 20 February 2023 a gas-and-ash plume rose 1.3 km above the summit and drifted SSW, according to a webcam image (figure 100). Gas-and-steam and possibly ash emissions continued on 23 February and volcanic earthquakes were recorded by the seismic network.
During April, volcanic earthquakes and gas-and-steam and ash emissions were reported from the cone in Lake Voui. VMGD reported that activity increased during 5-7 April; high gas-and-steam and ash plumes were visible, accompanied by nighttime incandescence. According to a Wellington VAAC report, a low-level ash plume rose as high as 2.5 km above the summit and drifted W and SW on 5 April, based on satellite imagery. Reports in Saratamata stated that a dark ash plume drifted to the WSW, but no loud explosion was heard. Webcam images from 2100 showed incandescence above the crater and reflected in the clouds. According to an aerial survey, field observations, and satellite data, water was no longer present in the lake. A lava flow was reported effusing from the vent and traveling N into the dry Lake Voui, which lasted three days. The next morning at 0745 on 6 April a gas-and-steam and ash plume rose 5.4 km above the summit and drifted ESE, based on information from VMGD (figure 101). The Wellington VAAC also reported that light ashfall was observed on the island. Intermittent gas-and-steam and ash emissions were visible on 7 April, some of which rose to an estimated 3 km above the summit and drifted E. Webcam images during 0107-0730 on 7 April showed continuing ash emissions. A gas-and-steam and ash plume rose 695 m above the summit crater at 0730 on 19 April and drifted ESE, based on a webcam image (figure 102).
According to visual and infrared satellite data, water was visible in Lake Voui as late as 24 March 2023 (figure 103). The vent in the caldera showed a gas-and-steam plume drifted SE. On 3 April thermal activity was first detected, accompanied by a gas-and-ash plume that drifted W (figure 103). The lava flow moved N within the dry lake and was shown cooling by 8 April. By 23 April much of the water in the lake had returned. Occasional sulfur dioxide plumes were detected by the TROPOMI instrument on the Sentinel-5P satellite that exceeded 2 Dobson Units (DU) and drifted in different directions (figure 104).
Geologic Background. The island of Ambae, also known as Aoba, is a massive 2,500 km3 basaltic shield that is the most voluminous volcano of the New Hebrides archipelago. A pronounced NE-SW-trending rift zone with numerous scoria cones gives the 16 x 38 km island an elongated form. A broad pyroclastic cone containing three crater lakes (Manaro Ngoru, Voui, and Manaro Lakua) is located at the summit within the youngest of at least two nested calderas, the largest of which is 6 km in diameter. That large central edifice is also called Manaro Voui or Lombenben volcano. Post-caldera explosive eruptions formed the summit craters about 360 years ago. A tuff cone was constructed within Lake Voui (or Vui) about 60 years later. The latest known flank eruption, about 300 years ago, destroyed the population of the Nduindui area near the western coast.
Information Contacts: Geo-Hazards Division, Vanuatu Meteorology and Geo-Hazards Department (VMGD), Ministry of Climate Change Adaptation, Meteorology, Geo-Hazards, Energy, Environment and Disaster Management, Private Mail Bag 9054, Lini Highway, Port Vila, Vanuatu (URL: http://www.vmgd.gov.vu/, https://www.facebook.com/VanuatuGeohazardsObservatory/); Wellington Volcanic Ash Advisory Centre (VAAC), Meteorological Service of New Zealand Ltd (MetService), PO Box 722, Wellington, New Zealand (URL: http://www.metservice.com/vaac/, http://www.ssd.noaa.gov/VAAC/OTH/NZ/messages.html); MIROVA (Middle InfraRed Observation of Volcanic Activity), a collaborative project between the Universities of Turin and Florence (Italy) supported by the Centre for Volcanic Risk of the Italian Civil Protection Department (URL: http://www.mirovaweb.it/); Global Sulfur Dioxide Monitoring Page, Atmospheric Chemistry and Dynamics Laboratory, NASA Goddard Space Flight Center (NASA/GSFC), 8800 Greenbelt Road, Goddard, Maryland, USA (URL: https://so2.gsfc.nasa.gov/); Copernicus Browser, Copernicus Data Space Ecosystem, European Space Agency (URL: https://dataspace.copernicus.eu/browser/).
Search Bulletin Archive by Publication Date
Select a month and year from the drop-downs and click "Show Issue" to have that issue displayed in this tab.
The default month and year is the latest issue available.
Bulletin of the Global Volcanism Network - Volume 31, Number 09 (September 2006)
Managing Editor: Richard Wunderman
Bamus (Papua New Guinea)
Forceful vapor emission seen on 12 July 2006
Barren Island (India)
Ongoing emissions, including lava, but late-September news reports of slowing pace
Bulusan (Philippines)
Ten explosions recorded seismically between 21 March and 28 June 2006
Cleveland (United States)
Short duration explosions during August-October 2006
Fourpeaked (United States)
Eruption on 17 September, followed by emissions until at least early November
Home Reef (Tonga)
Extensive pumice rafts between Tonga and Fiji during August-October
Montagu Island (United Kingdom)
Five years of nearly persistent eruptive activity
Rabaul (Papua New Guinea)
Strong eruption at Tavurvur ejected ash and large plumes to the troposphere
San Cristobal (Nicaragua)
Multi-year update: 13 June 2004, local ash fall; early 2006, small eruptions
Soufriere Hills (United Kingdom)
Extrusive dome dynamics during May-September 2006
Sulu Range (Papua New Guinea)
Volcano seismicity declines in September and October 2006
Bamus (Papua New Guinea) — September 2006 Cite this Report
Bamus
Papua New Guinea
5.2°S, 151.23°E; summit elev. 2248 m
All times are local (unless otherwise noted)
Forceful vapor emission seen on 12 July 2006
According to the Papua New Guinea Department of Mining (DOM), reports coming from Bialla Local Level Government (LLG) indicated that Bamus showed signs of unusual activity. At 1010 on 12 July 2006 observers saw white vapor coming out at the summit. The emission was forceful at about 1110 that day, with a tint of gray color in the emission. The vapor-rich plume blew inland to the SSE. No ashfall was reported.
Officials from Bialla LLG together with a DOM observer witnessed the activity, as did Max Benjamin from Walindi Resort (~ 40-50 km away). Benjamin called the Rabaul Volcano Observatory to report the activity. No satellite-detected thermal anomalies at the volcano were reported by the MODIS website for this time frame.
Geologic Background. Symmetrical Bamus volcano, also referred to locally as the South Son, is located SW of Ulawun volcano, known as the Father. The andesitic stratovolcano is covered in rainforest and contains a breached summit crater filled with a lava dome. There is a cone on the southern flank, and a prominent 1.5-km-wide crater with two small adjacent cones halfway up the SE flank. Young pyroclastic-flow deposits are found on the flanks, and residents describe an eruption that took place during the late 19th century.
Information Contacts: Steve Saunders and Herman Patia, Rabaul Volcanological Observatory (RVO), Department of Mining, Private Mail Bag, Port Moresby Post Office, National Capitol District, Papua, New Guinea.
Barren Island (India) — September 2006 Cite this Report
Barren Island
India
12.278°N, 93.858°E; summit elev. 354 m
All times are local (unless otherwise noted)
Ongoing emissions, including lava, but late-September news reports of slowing pace
Our last report on Barren Island discussed events through much of January 2006 (BGVN 31:01); since that time we have only found sporadic reports of activity.
According to a news article by The Indo-Asian News Service, a team of scientists that visited Barren Island around 12 March 2006 found that the volcano was still very active. The height of the volcanic cone had increased by 50 m since eruptive activity began in May 2005. In addition, lava flows covered the NW side of the island.
Since March 2006 there have been only a few satellite images and pilot reports of continued activity. Based on a pilot report and satellite imagery, the Darwin VAAC reported that an ash plume was emitted during 5-6 April that did not rise higher than 4.6 km altitude. On 19 April a low-level plume extending W was visible on satellite imagery.
On 2 May satellite imagery detected a plume from Barren Island near 3.7 km altitude. The following day low-level ash plumes extended N. Based on a pilot report, the Darwin VAAC reported an ash plume at 1230 on 26 May that remained below 3 km altitude and drifted N.
On 23 September a news report in The Hindu stated that Indian Coast Guard officials indicated that the continuing eruption at Barren Island was decreasing in intensity. The news piece cited a surveillance report statement that there was less lava but more "smoke" from the volcano.
Geologic Background. Barren Island, a possession of India in the Andaman Sea about 135 km NE of Port Blair in the Andaman Islands, is the only historically active volcano along the N-S volcanic arc extending between Sumatra and Burma (Myanmar). It is the emergent summit of a volcano that rises from a depth of about 2250 m. The small, uninhabited 3-km-wide island contains a roughly 2-km-wide caldera with walls 250-350 m high. The caldera, which is open to the sea on the west, was created during a major explosive eruption in the late Pleistocene that produced pyroclastic-flow and -surge deposits. Historical eruptions have changed the morphology of the pyroclastic cone in the center of the caldera, and lava flows that fill much of the caldera floor have reached the sea along the western coast.
Information Contacts: The Hindu (URL: http://www.hinduonline.com); Indo-Asian News Service (IANS) (URL: http://www.eians.com/); Geological Survey of India, 27 Jawaharlal Nehru road, Kolkata 700 016, India (URL: https://www.gsi.gov.in/); Indian Coast Guard, National Stadium Complex, New Delhi 110 001, India (URL: http://indiancoastguard.nic.in/indiancoastguard/); Darwin Volcanic Ash Advisory Center, Bureau of Meteorology, Northern Territory Regional Office, PO Box 40050, Casuarina, Northern Territory 0811, Australia (URL: http://www.bom.gov.au/info/vaac/).
Bulusan (Philippines) — September 2006 Cite this Report
Bulusan
Philippines
12.769°N, 124.056°E; summit elev. 1535 m
All times are local (unless otherwise noted)
Ten explosions recorded seismically between 21 March and 28 June 2006
On 19 March 2006, the Philippine Institute of Volcanology and Seismology (PHIVOLCS) raised the status of Bulusan from Zero Alert (no alert) to Alert Level 1 to reflect elevated seismic, fumarolic, and other unrest (BGVN 31:05). From that date until an ash explosion on 28 June 2006, 10 explosions were recorded (see table 3).
Table 3. Summary of significant events through late July 2006 at Bulusan . Numbering of explosion-type (E-type) quakes began 21 March 2006. Courtesy of Philippine Institute of Volcanology and Seismology (PHIVOLCS).
| Date |
Local Time |
Plume Altitude |
Drift Direction |
Comments |
| 19 Mar 2006 |
-- |
-- |
-- |
Seismic swarm which lasted until 21 Mar; Alert Level raised to 1. |
| 21 Mar 2006 |
2258 |
1.5 km |
N, W, SW |
1st explosion-type (E-type) earthquake lasted 20 min; total of 4 E-type earthquakes recorded. |
| 08 Apr 2006 |
2000 |
-- |
-- |
Lahar at Cogon spillway. |
| 09 Apr 2006 |
1036-1058 |
-- |
-- |
Lahar at Cogon spillway. |
| 29 Apr 2006 |
1044 |
1.5 km |
WSW, NW |
2nd E-type earthquake; total of three E-type earthquakes recorded. |
| 25 May 2006 |
2117-2130 |
-- |
-- |
3rd E-type earthquake; ash deposits, trace to 2 mm thick in Juban, Irosin. Cloud-covered summit. |
| 31 May 2006 |
1617 |
1.5 |
W, WNW |
4th E-type earthquake. |
| 07 Jun 2006 |
2017-2030 |
2.0 |
N, W, SW |
5th E-type earthquake; smaller E-type earthquake at 0225 on 8 Jun; Alert Level raised to 2. |
| 10 Jun 2006 |
1218 |
1.0 |
NE, E |
6th E-type earthquake, lasting 25 min. |
| 13 Jun 2006 |
1904 |
1.5 |
NW |
7th E-type earthquake, lasting 13 min. |
| 18 Jun 2006 |
1556 |
1.5 |
W |
8th E-type earthquake. |
| 20 Jun 2006 |
2013 |
-- |
-- |
9th E-type earthquake ? mild; event not observed; seismic signal recorded for 17 min; rains generated some lahars. Cloud-covered summit. |
| 24 Jun 2006 |
2300 |
-- |
-- |
Lahar at Cogon spillway. |
| 28 Jun 2006 |
0206 |
-- |
-- |
10th E-type earthquake; the associated volcanic event was not observed but seismic signal recorded as E-type earthquake lasted 4 min. Cloud-covered summit. |
| 29 Jun 2006 |
0800 |
-- |
-- |
Continuous decline in activity; Alert Level lowered to 1. |
After the ash explosion of 28 June 2006, Bulusan's monitored parameters gradually decreased to near baseline levels. The daily count of volcanic earthquakes was very low, and SO2 emission rates and ground-deformation data revealed the volcano's deflated condition, indicating the absence of active magma ascent. Ash emission stopped and steaming from the active vents and fissures gradually returned to normal levels. Due to the decline in activity, on 29 July PHIVOLCS lowered the status of Bulusan from Alert Level 2 to 1.
On 10 October 2006 at 1256 UTC, the Tokyo Volcanic Ash Advisory Center announced that an eruption plume from Bulusan was visible on satellite imagery reaching altitudes of 3 km and drifting SW and SSE.
Unlike nearby Mayon volcano (~ 70 km NW) (see BGVN 31:08), no thermal anomalies were detected at Bulusan by satellite or recorded by the Hawai'i Institute of Geophysics and Planetology (HIGP) MODIS/ MODVOLC web site from the beginning of 2006 to 10 October 2006.
Geologic Background. Luzon's southernmost volcano, Bulusan, was constructed along the rim of the 11-km-diameter dacitic-to-rhyolitic Irosin caldera, which was formed about 36,000 years ago. It lies at the SE end of the Bicol volcanic arc occupying the peninsula of the same name that forms the elongated SE tip of Luzon. A broad, flat moat is located below the topographically prominent SW rim of Irosin caldera; the NE rim is buried by the andesitic complex. Bulusan is flanked by several other large intracaldera lava domes and cones, including the prominent Mount Jormajan lava dome on the SW flank and Sharp Peak to the NE. The summit is unvegetated and contains a 300-m-wide, 50-m-deep crater. Three small craters are located on the SE flank. Many moderate explosive eruptions have been recorded since the mid-19th century.
Information Contacts: Philippine Institute of Volcanology and Seismology (PHIVOLCS), University of the Philippines Campus, Diliman, Quezon City, Philippines (URL: http://www.phivolcs.dost.gov.ph); Tokyo Volcanic Ash Advisory Center (VAAC) (URL: http://www.jma.go.jp/jma/jma-eng/jma-center/vaac/index/html); HIGP MODIS Thermal Alert System, Hawai'i Institute of Geophysics and Planetology (HIGP), University of Hawaii at Manoa, 168 East-West Road, Post 602, Honolulu, HI 96822, USA (URL: http://modis.higp.hawaii.edu/).
Cleveland (United States) — September 2006 Cite this Report
Cleveland
United States
52.825°N, 169.944°W; summit elev. 1730 m
All times are local (unless otherwise noted)
Short duration explosions during August-October 2006
Cleveland's commonly observed activity consisting of short duration explosions, such as those seen earlier in the year on 6 February 2006 (BGVN 31:01) and on 23 May 2006 (BGVN 31:07), continued during August and October 2006. This report will cover the 24 August and 28 October eruptions.
At 1955 on 24 August a brief eruption was seen by mariners on a passing ship. The eruption was unconfirmed by satellite data. Video footage sent to the Alaska Volcano Observatory (AVO) on 28 August showed that an ash cloud rose to an approximate altitude of 3 km and produced minor ashfall. Shortly after the eruption, minor steaming was observed from the vent on additional footage. In response to the eruption, the AVO raised the level of Concern Color Code from 'unassigned' to 'Yellow' on 7 September. A weak thermal anomaly in the summit crater was present in subsequent satellite images.
Clouds obstructed visibility through most of September and October.
A pilot reported that a minor eruption started at 1345 on 28 October. Satellite data confirmed the presence of an ash cloud drifting ENE of the volcano. The height of the cloud was estimated at an altitude of 6 km using the satellite imagery. One pilot reported the plume top at an altitude of 9 km. The AVO raised the alert level to 'Orange' during 28-29 October. On 30 October the AVO lowered the level to 'Yellow' because of no further evidence of activity.
Geologic Background. The beautifully symmetrical Mount Cleveland stratovolcano is situated at the western end of the uninhabited Chuginadak Island. It lies SE across Carlisle Pass strait from Carlisle volcano and NE across Chuginadak Pass strait from Herbert volcano. Joined to the rest of Chuginadak Island by a low isthmus, Cleveland is the highest of the Islands of the Four Mountains group and is one of the most active of the Aleutian Islands. The native name, Chuginadak, refers to the Aleut goddess of fire, who was thought to reside on the volcano. Numerous large lava flows descend the steep-sided flanks. It is possible that some 18th-to-19th century eruptions attributed to Carlisle should be ascribed to Cleveland (Miller et al., 1998). In 1944 it produced the only known fatality from an Aleutian eruption. Recent eruptions have been characterized by short-lived explosive ash emissions, at times accompanied by lava fountaining and lava flows down the flanks.
Information Contacts: Alaska Volcano Observatory (AVO), a cooperative program of the U.S. Geological Survey, 4200 University Drive, Anchorage, AK 99508-4667, USA; Geophysical Institute, University of Alaska, PO Box 757320, Fairbanks, AK 99775-7320, USA; and Alaska Division of Geological & Geophysical Surveys, 794 University Ave., Suite 200, Fairbanks, AK 99709, USA (URL: http://www.avo.alaska.edu/).
Fourpeaked (United States) — September 2006 Cite this Report
Fourpeaked
United States
58.77°N, 153.672°W; summit elev. 2105 m
All times are local (unless otherwise noted)
Eruption on 17 September, followed by emissions until at least early November
Until the eruption of Fourpeaked on 17 September, evidence for eruptive activity in the past 10,000 years was uncertain. The volcano is largely glacier covered with only isolated outcrops (figure 1). This report discusses the initial observation of plumes and subsequent activity until the end of October 2006. Fourpeaked is in S Alaska ~ 320 km SW of Anchorage. It is SW of the mouth of Cook Inlet and within NE Katmai National Park (figure 2).
On the evening of 17 September, AVO received several reports of two discrete plumes rising from the Cape Douglas area. The plumes were photographed at an unstated time on 17 September from the town of Homer (figure 3). At this stage, neither Douglas nor Fourpeaked had devoted seismic instruments.
Retrospective analysis of data from the NEXRAD Doppler radar in King Salmon showed an unusual cloud starting at 1200 on 17 September. The maximum cloud height determined by radar during the first hour of the event was 6 km altitude. The radar return from the cloud continued until at least 2145 (figure 4).
A cloud of sulfur dioxide gas was observed by colleagues at the Volcanic Emissions Group at the University of Maryland Baltimore. They used data collected at 1500 by the Ozone Monitoring Instrument (OMI) on NASA's Aura satellite (figure 5).
On the basis of the suite of visual, radar, and satellite observations, all the 17 September clouds were inferred volcanic in origin. Although satellite data did not detect ash during this event, AVO received reports of a trace of ashfall at Nonvianuk Lake outlet (110 km WNW) and near Homer (150 km NE). Field observers saw deep scouring of a glacier flowing W from the summit, indicating flooding, probably from the 17 September event.In the caption to a 20 September AVO photo by K.L. Wallace there was noted a "continuous layer of discolored snow and ice above [~1 km elevation,]~3,000 feet asl on the NE flank of Fourpeaked volcano (S of Douglas volcano). Could possibly be ash from the 9/17/06 event."
Both fixed-wing and helicopter overflights in the Cape Douglas area on 20 September confirmed the source of volcanic activity to be Fourpeaked volcano. AVO raised the Level of Concern Color Code from "Not Assigned" to YELLOW on 20 September.
A 23 September observation flight conducted in relatively good weather permitted the first look at the summit since the event of 17 September. Observers saw a linear series of vents running N from the summit for about 1 km. Most of these vents vigorously emitted steam and other volcanic gases. Gas measurements indicated abundant quantities of sulfur dioxide, hydrogen sulfide, and carbon dioxide. Thermal measurements of up to 75°C were recorded at the vents, although steam was likely obscuring hotter areas. Adjacent glacial ice had been disrupted and showed signs of subsidence. Airborne gas measurements taken on 23, 24, and 30 September again documented high emission rates of sulfur dioxide, hydrogen sulfide, and carbon dioxide, and a distinct sulfur smell was evident up to 50 km from the summit. An AVO status report on 3 October noted that cloudy conditions had prevented visual or satellite observations, but limited seismic data being received did not indicate significant volcanic activity.
The AVO reported that volcanic unrest continued at Fourpeaked during 30 September-24 October. A seismometer installed on 25 September indicated ongoing low-level seismicity. Due to the limited number of seismometers, earthquake epicenters were not located. Emission rates of sulfur dioxide were high during 4-10 October and on 27 October. Observations were hindered due to cloud cover, but on 12 October AVO staff reported that two prominent vents were emitting steam and gas. Figure 6 shows several shots illustrating the enlarged opening in the ice on 15 October.
On 20 October, field crews installed a web camera located 16 km (10 miles) N of Fourpeaked. Steam plumes originating from vents along the summit were visible via the web camera on 27 and 30 October. Steaming continued through at least 4 November (figure 7).
Geologic Background. Poorly known Fourpeaked volcano in NE Katmai National Park consists of isolated outcrops surrounded by the Fourpeaked Glacier, which descends eastward almost to the Shelikof Strait. The orientation of andesitic lava flows and extensive hydrothermal alteration of rocks near the present summit suggest that it probably marks the vent area. Eruptive activity during the Holocene had not been confirmed prior to the first historical eruption in September 2006. A N-trending fissure extending 1 km from the summit produced minor ashfall.
Information Contacts: Alaska Volcano Observatory (AVO), a cooperative program of the U.S. Geological Survey, 4200 University Drive, Anchorage, AK 99508-4667, USA; Geophysical Institute, University of Alaska, PO Box 757320, Fairbanks, AK 99775-7320, USA; and Alaska Division of Geological & Geophysical Surveys, 794 University Ave., Suite 200, Fairbanks, AK 99709, USA (URL: http://www.avo.alaska.edu/); S.A. Carn, N.A. Krotkov, A.J. Krueger, and K. Yang, Joint Center for Earth Systems Technology (JCET), University of Maryland Baltimore County (UMBC), 1000 Hilltop Circle, Baltimore, MD 21250, USA.
Home Reef (Tonga) — September 2006 Cite this Report
Home Reef
Tonga
18.992°S, 174.775°W; summit elev. -10 m
All times are local (unless otherwise noted)
Extensive pumice rafts between Tonga and Fiji during August-October
Pumice rafts drifting from Tonga to Fiji occurred during August-October 2006. The source of these pumice rafts was Home Reef, which was first observed to be in eruption on 9 August and was clearly building an island by 12 August (figure 2). A compilation of report sightings through mid-October 2006, plotted using Google Earth, shows the timing and distribution of the pumice rafts that are discussed in this report (figure 3). As is our convention, and as available, a list of contributors (and their vessels) is noted in last section of this report.
Pumice traveled both N and S around Fiji's Lau Group. To the N, pumice reached Taveuni through the Nanuku passage and entered the Koro sea, washing onto southern Vanua Levu, before moving into the Bligh Waters N of Viti Levu by 20 September. To the S, extensive pumice was seen N of Vatoa Island on 16 September, and on Kadavu Island by the end of the month. Pumice was also encountered by the Encore II W of Viti Levu on 30 September while enroute to New Caledonia.
Early observations of the eruption. The news service Matangi Tonga Online quoted Allan Bowe, the owner of the Mounu Island Resort in southern Vava'u, regarding volcanic activity in the direction of Home Reef during 9-11 August. Bowe heard ". . . what sounded like continuous thunder rumbling to the S and there was a huge plume of smoke and cloud rising up into the sky." In another Matangi news article, Siaosi Fenukitau, a captain of one of the fishing boats of the Maritime Projects Co. (Tonga) Ltd., reported that around mid-September they sighted a new volcanic island near Home Reef that was larger than Fotuha'a, a small island in Ha'apai with a population of about 134 people.
The yacht Maiken left Neiafu on 11 August, passing the N side of Late Island. After about 9 km the crew noticed brown, somewhat grainy streaks in the water. The streaks became larger and more frequent as they continued SW "until the whole horizon was a solid line to what looked like a desert." The brownish pumice fragments the size of a fist were floating in water that was strangely green. They motored into the vast (many miles wide) belt of densely packed pumice, and within seconds Maiken slowed down from seven to one knot. Initially the thin layer on the surface was pushed away by the bow wave, but when they entered the solid field it started to pile up and "behaved like wet concrete" and "looked like rolling sand dunes as far as the eye could see." After retreating from the pumice with only minor paint abrasion along the waterline, and then cleaning their intake filters, they decided to anchor in Vaiutukakau bay outside Vava'u for the night. The next morning, 12 August, they received radio confirmation of an eruption, but the vent and extent were uncertain. They decided to go S to avoid the pumice rafts floating NW, heading SSW until they encountered the pumice, then sailing alongside until the rafts were broken up enough to safely travel through.
As they approached Home Reef it became clear that one of the clouds on the horizon was a volcanic plume. Observations from a closer vantage point revealed that an intermittent "massive black pillar shot upwards toward the sky" and particles were raining down. Since the wind was pushing the plume NW, the Maiken motored up to within 2.8 km of the island (to 18°59.5'S, 174°46.3'W) while the sun was going down. Multiple peaks forming a crater open to the sea on one side were visible, and it looked like it was "made of black coal." Not wanting to encounter more pumice rafts after dark, they continued SSW towards the southern part of the Lau Group.
Pumice sightings between Tonga and Fiji. Boats that later noted seeing pumice in Fiji did not report any activity or rafts near Tonga during 27-29 August. The Soren Larsen sailed through "a sea of floating pumice" one evening that "sounded like we were sailing through ice" just before reaching Fiji. This encounter was probably on 30 August when their online tracker located the ship just W of the central Lau islands after departing Neiafu on the 28th. No eruptive activity or pumice was noted in the online log of the Soren Larsen for 14-15 and 23-24 August when they transited to northern Tonga to the E of Home Reef.
While the Encore II crew was visiting the Mounu Island Resort on 2 September there were "grapefruit-sized" pumice pieces on the beach. A few days later, while listening to the "Rag of the Air" net broadcast out of Fiji, the Encore II crew learned of pumice rafts along their expected route. The operator of this broadcast, Jim Bandy, provides weather reports for boats going between Tonga and Fiji. One report was of a mass of pumice about 11 km long and at least a meter ("many feet") deep. The Encore II departed from Neiafu on 8 September on a course around a set of Fijian islands and reefs called the Lau Group. The crew believed that this route, going NW around the Lau Group, helped them avoid most of the pumice.
As the Encore II approached their turning point about two thirds of the way to Fiji, on 10 September, they encountered "rivers of pumice" floating roughly parallel to their NW course due to the SE winds (figure 4). Some pumice fragments that they collected were about 5-10 cm in diameter, although most were about the size of pea gravel. The parallel streams of pumice, only a single layer in depth, were sometimes up to 90 m wide and 400 m long. The crew later heard reports from several boats that had taken a more westerly route through the Lau Group to Fiji and encountered much larger areas of pumice. The crew on the Norwegian sailboat Stormsvalen went through larger and thicker areas of pumice, leaving a track in the pumice as they went through (figures 5 and 6). They noted that boats traveling through the pumice during higher winds and seas encountered a problem of airborne pumice pelting the crews and their boats. One crew reported pumice covering their deck.
A sailboat blog entry by Sara Berman and Jean Philippe Chabot noted a "strong sulfur odor" in the direction of the volcano upon leaving Tongan waters around 20 September. As they progressed SW towards Fiji they passed through streams of pumice containing pieces ranging from very small pebbles to larger pieces the size of a baseball. Every time a wave crashed on deck they heard the pumice making its way onto the boat and into the cockpit.On 30 September the Windbird log noted that ". . . cruisers are still having to avoid the huge pumice field that is floating about between Tonga and Fiji."
Bob McDavitt's "Weathergram" for 15 October noted that reports from yachts sailing between Tonga and Fiji indicated an absence of pumice. These observations suggest that the bulk of material produced by the eruption, or series of eruptions, had crossed to Fiji by mid-October.
Pumice rafts in northern Fiji. The earliest known direct observations of the floating pumice in Fiji come from a boat with callsign KB1LSY, the crew of which noted that "thick pumice" slowed them to 2 knots for 30 minutes during the early morning hours of 28 August. This occurred as they approached the northern islands of the Lau Group in Fiji, about 500 km NW of Home Reef.
According to Roberta Davis, the pumice arrived at Taveuni, Fiji, on 14 September. There were several rafts ~300 m from shore with other rafts scattered farther out. Local mariners noted that pieces in the top layer were approximately the size of pea gravel. Suspended below the surface were pieces almost as large as footballs. The beaches on the northern shores of Taveuni were covered in what appeared to be black popcorn. The pumice was present at Taveuni for up to 6 days.
On 19 September David Forsythe reported that large rafts of pumice were passing through the northern Lau group in Fiji (figure 7). He noted gooseneck barnacles up to 10 mm long on the largest pieces. Bulletin editors found compiled growth rates for various stalked barnacles ( Thiel and Gutow, 2005), which indicated 17-29 days of growth.
The Encore II crew observed pumice along the S side of Vanua Levu, W of the Lau Group, around 16 September. They noted pumice at Fawn Harbour that obscured the channel into the harbor and it made a boat at anchor appear to be aground on an island. They also observed streams of pumice near the Makogai Channel on 20 September. The Fiji Times Online reported on 20 September that villagers living along the coastal areas of Saqani in Cakaudrove (Vanua Levu) were battling to clear their pumice-covered seashores and rivers. Villagers saw the pumice floating in the sea near their homes on 18 September, and by the next day the pumice covered the river and villagers could not fish or travel by boats and bamboo rafts to their plantations.
While diving at the "Bligh Triangle" of Fiji at sites NW of Viti Levu, the crew aboard the Nai'a encountered floating pumice during 20 September-7 October. The pumice was "surrounding the Nai'a and the skiffs with occasional big carpets of floating rock." Roman Leslie, an Australian volcanologist who was fishing in Koro (Lomaiviti Group), also observed the pumice in late September.Scientists aboard the research vessel Yokosuka observed pumice settling to the shore of Viti Levu on 6 October. The rafts were in bands up to 70-80 m wide and several hundred meters long. The pumice fragments were fully abraded, and dominantly less than 1 cm in diameter with occasional large blocks up to 15-20 cm in diameter. The pumice seemed to be quite phenocryst-rich. The sound of the moving, abrading rafts was described as "sizzling."
Pumice rafts in southern Fiji. A biologist aboard the National Geographic motor vessel Endeavour reported that on the morning of 16 September they observed an extensive region of floating pumice "... in long, wind-driven rows, approximately 1-5 m wide and up to several hundred meters long." Pieces of pumice averaged 0.5-8 cm in longest dimension. The largest piece observed was approximately 15 cm in longest dimension. The observations continued over the next 90 km, for 3.5 hours, with little interruption, until they made landfall at Vatoa Island in the Lau Group. Moderate windrows of pumice, up to several inches deep, were observed on the beaches of Vatoa.
Roger Matthews arrived in Kadavu, Fiji, on 30 September and reported that pumice had been coming ashore for about a week. On the southern coast of the island near the airport, the layer of pumice on 30 September was 10-15 cm thick floating on top of ~1 m of water (figure 8). Farther NE, pumice that began coming ashore at the Matava Resort on 3 October carried goose barnacle shells that measured about 2-3 mm on the bigger clasts. By 7 October barnacle size on arriving pumice had increased to around 4-6 mm. While scuba diving, Matthews noted neutrally buoyant bits of pumice, generally in the 3-10 mm size range, down to at least 40 m water depth. The pumice did not appear to have an even size distribution (figure 9). There were a number of big clasts, 2-3 cm, with a large amount of material in the 8-15 mm range. In the shore deposits there appeared to be a large volume of fines in the sub-2 mm size. The material was clean with no algae, just the occasional barnacles. The clasts contained phenocrysts up to 2 mm long. The raft drifted in and out depending on wind conditions, at times extending 75-100 m from shore, and invaded streams at high tide. On shore there were 20-cm-thick deposits, some of which was used as fill behind the sea walls (figure 10).
A 31 October story in the Fiji Times described transportation difficulties between Daviqele Village, on the W end of Kadavu, and other parts of the island due to pumice that a resident said had "covered [Naluvea Bay] for over two months now." Similar problems were reported by Adrian Watt at Matava Resort on the S shore of Kadavu. In an email relayed by Roberta Davis, Watt noted that by 2 November the pumice had mostly stopped coming in, with "... just a few strands of small pieces being blown along wind lines here and there." The pieces were generally 5-10 mm in diameter, but several were bigger, and one was larger than 30 cm across. Large bays on Kadavu's SE side were pumice choked, hampering boat travel, and clogged cooling systems damaged or destroyed many outboard engines.
Reference. Thiel, M., and Gutow, L., 2005, The ecology of rafting in the marine environment. II. The rafting organisms and community: Oceanography and Marine Biology: An Annual Review, 2005, v. 43, p. 279-418.
Geologic Background. Home Reef, a submarine volcano midway between Metis Shoal and Late Island in the central Tonga islands, was first reported active in the mid-19th century, when an ephemeral island formed. An eruption in 1984 produced a 12-km-high eruption plume, large amounts of floating pumice, and an ephemeral 500 x 1,500 m island, with cliffs 30-50 m high that enclosed a water-filled crater. In 2006 an island-forming eruption produced widespread dacitic pumice rafts that drifted as far as Australia. Another island was built during a September-October 2022 eruption.
Information Contacts: Fredrik Fransson and Håkan Larsson, Yacht Maiken, 32 Macrossan St., Unit 70, Brisbane 4000, Australia (URL: http://yacht-maiken.blogspot.com/); Paul and Nancy Horst, Encore II (URL: http://www.encorevoyages.com/); KB1LSY Crew (URL: http://www.pangolin.co.nz/yotreps/tracker.php?ident=KB1LSY); Matangi Tonga Online, Vava'u Press Ltd., PO Box 958, Nuku'alofa, Tonga (URL: http://www.matangitonga.to/); Roger Matthews, Private Bag 93500, Takapuna, North Shore City 1332, New Zealand; Ken Tani, R/V Yokosuka; David Forsythe, Naitauba Island, Fiji; David Cothran, 1211 Colestin Rd., Ashland, OR 97520, USA; Bob McDavitt's Weathergram (URL: http://www.pangolin.co.nz/yotreps/list_manager.php##Bob McDavitt's Pacific Weathergrams); Nick Sambrook, Tall Ship Soren Larsen, P.O.Box 60-660 Titirangi Auckland 0642, New Zealand (URL: http://www.sorenlarsen.co.nz/2006/V237_Tonga-Fiji/V237_Tonga-Fiji_Nick.htm, http://www.sorenlarsen.co.nz/Voylog_Track.htm); Windbird Crew (URL: http://handleysail.com/logs/?cat=1&paged=2); NAI'A Liveaboard Scuba Diving, Lautoka, Fiji (URL: http://www.naia.com.fj/); Roberta Davis, Makaira by the Sea, Taveuni, Fiji (URL: http://www.fijibeachfrontatmakaira.com/); Adrian Watt, Matava Resort, Kadavu, Fiji (URL: http://www.matava.com/); Sara Berman and Jean Philippe Chabot (URL: http://zayasail.blogspot.com/2006/09/east.html).
Montagu Island (United Kingdom) — September 2006 Cite this Report
Montagu Island
United Kingdom
58.445°S, 26.374°W; summit elev. 1370 m
All times are local (unless otherwise noted)
Five years of nearly persistent eruptive activity
Matthew Patrick reported that the month of October represents the 5-year anniversary of the start of the still-ongoing eruption at Mount Belinda on Montagu Island. The first satellite thermal alert for the volcano occurred on 20 October 2001, and was the first definitive record of historical volcanic activity on the island (BGVN 28:02) (Patrick and others, 2005). The MODVOLC monitoring system uses MODIS (Moderate Resolution Imaging Spectroradiometer) satellite data processed at the University of Hawai'i-Manoa. Current MODVOLC results, shown in figure 16A, indicate more-or-less persistent activity throughout the 5-year period, with radiant heat flux apparently peaking in late 2005 and early 2006.
Landsat and ASTER (Advanced Spaceborne Thermal Emission and Reflection Radiometer) imagery has shown that the eruption consisted of central vent activity producing lava flows. Small-scale explosive activity has also commonly blanketed the E side of the island. Three effusive events have been observed in ASTER/Landsat imagery, with the most recent (September-October 2005) producing a lava flow that traveled 3.5 km and reached the sea to build a 500-m-wide delta of lava (BGVN 30:09 and 30:11).
Figure 16B shows relative location (distance from the vent) comparing Mount Belinda's vent with the locations of MODVOLC alert pixels. This plot clearly shows longer flows during the September 2005 effusive event. Following this period, there were several other long-distance events. It is unclear if these reflect additional effusive events.
In addition, the first two effusive events observed in the ASTER/Landsat images do not appear on the MODVOLC plot (figure 16B), due either to cloud cover or their short flow lengths. Since the beginning of 2006, no cloud-free ASTER images have been available.
Geographic terminology. The nomenclature of volcanic features on Montagu Island, particularly in regard to Mount Belinda, has been quite variable. Although the name Montagu has been applied to the major volcanic edifice forming the island (LeMasurier and Thomson, 1990), the name Mount Belinda has been variously applied to the entire volcano, the currently active young cone on the northern side of the island, the 6-km-wide summit caldera, and a peak on the southern caldera rim that is the island's high point. In consultation with John Smellie of the British Antarctic Survey, we have used Montagu to refer to the volcano forming the island and Mount Belinda for the currently active cone.
References. LeMasurier, W.E., and Thomson, J.W. (eds.), 1990, Volcanoes of the Antarctic Plate and Southern Oceans: Washington, D C: American Geophysical Union, 487 p.
Patrick, M.R., Smellie, J.L., Harris, A.J.L., Wright, R., Dean, K., Izbekov, P., Garbeil, H., and Pilger, E., 2005, First recorded eruption of Mount Belinda volcano (Montagu Island), South Sandwich Islands, Bulletin of Volcanology, v. 67, no. 5, p. 415-422.
Geologic Background. The largest of the South Sandwich Islands, Montagu consists of a massive shield volcano cut by a 6-km-wide ice-filled summit caldera. The summit of the 11 x 15 km island rises about 3,000 m from the sea floor between Bristol and Saunders Islands. Around 90% of the island is ice-covered; glaciers extending to the sea typically form vertical ice cliffs. The name Mount Belinda has been applied both to the high point at the southern end of the summit caldera and to the young central cone. Mount Oceanite, an isolated peak at the SE tip of the island, was the source of lava flows exposed at Mathias Point and Allen Point. There was no record of Holocene activity until MODIS satellite data, beginning in late 2001, revealed thermal anomalies consistent with lava lake activity. Apparent plumes and single anomalous pixels were observed intermittently on AVHRR images from March 1995 to February 1998, possibly indicating earlier volcanic activity.
Information Contacts: Matthew Patrick, Dept. of Geological and Mining Engineering and Sciences, Michigan Technological University, 1400 Townsend Drive, Houghton, MI 49931, USA; HIGP MODIS Thermal Alert System, Hawai'i Institute of Geophysics and Planetology (HIGP), University of Hawaii at Manoa, 168 East-West Road, Post 602, Honolulu, HI 96822, USA (URL: http://modis.higp.hawaii.edu/); John Smellie, British Antarctic Survey, Natural Environment Research Council, High Cross, Madingly Road, Cambridge CB3 0ET, United Kingdom (URL: https://www.bas.ac.uk/).
Rabaul (Papua New Guinea) — September 2006 Cite this Report
Rabaul
Papua New Guinea
4.2459°S, 152.1937°E; summit elev. 688 m
All times are local (unless otherwise noted)
Strong eruption at Tavurvur ejected ash and large plumes to the troposphere
A 7 October Rabaul eruption obscured visibility in and around the caldera, which sits at the NE end of New Britain Island (figure 42). The eruption took place at the intra-caldera cone Tavurvur, and emissions included lava flows. Intermittent eruptions had occurred at Tavurvur since 1994, the last of which took place on 15 January 2006 (BGVN 31:02). Photos by pilots shortly after the eruption documented a dramatic umbrella-shaped plume, which rose to the tropopause and created an SO2 cloud that later divided into two parts, one moving NW, the other SE.
Rabaul Volcano Observatory (RVO) observations. The RVO announced that a sustained eruption from Tavurvur did not appear to have been any immediate precursors apart from a small deflation. The sub-Plinian eruption began at about 0845 on 7 October 2006 and continued into the early afternoon. Semi-continuous to rhythmic air blasts were obvious in Rabaul town, with doors slamming and windows rattling. Rabaul received moderately heavy ashfall; heavy lapilli of ~1 mm diameter fell, and a few lithics up to 3 cm across fell around the S and SW parts of the caldera. According to Herman Patia at RVO, a small pumice raft accumulated in Greet Harbor and pumice was still drifting about several weeks later.
Ashfall affected the whole of the Gazelle peninsula (the name given to the bulbous, 50-km-diameter NE end of New Britain island). About 1 cm of ash was deposited on the SW side of the caldera in the Blue Lagoon-Vulcan sector. Ashfall occurred ~ 7 km SE of Rabaul caldera's center point in Kokopo and -20 km S of the center point in Warangoi. The density of ashfall was such that Tavurvur was obscured from all directions. In the town of Rabaul the experience was very similar to the October 1996 and January 1997 Strombolian eruptions.
At 1200 on 7 October 2006 the RSAM was about 1900 units and its rate appeared to be decreasing. (The Real-time Seismic Amplitude is an often-used tool to summarize seismic activity during volcanic crises by presenting a measure of the average amplitude of ground shaking over successive 10-min intervals.) Thick ash clouds rose to a height of about 18 km. The cloud subsequently dispersed over a broad western swath (N to W to S). The nature of the eruption changed to Strombolian at 1415 hours, with activity characterized by frequent explosions accompanied by shock waves. At 1730 hours, the Strombolian activity began to subside. A moderate to bright glow was visible during the evening of 7 October on Tavurvur's N rim, accompanied by occasional explosions and loud roaring noises throughout the night.
In the morning of 8 October, thick white and blue vapor accompanied occasional ash explosions drifted N and NW of Tavurvur. Inspection from Rapindik (2 km NNW from Tavurvur) revealed lava flows emplaced down the cone's W and N flanks. The W flank flow went into the harbor and caused small secondary explosions; visibility of the N flank was poor due to the white vapor emission. The RSAM level decreased to the background value of ~70 units.
Herman Patia reported that by 28 October 2006 the eruption had quieted down with only occasional ash emission accompanied by rare explosions. Seismic activity was at a low level and ground deformation was at a low rate. On 30 October mild eruptive activity continued at Tavurvur. The activity consisted of continuous emission of thick pale to dark gray ash clouds that drifted N to NW of the volcano. Fine ash fall occurred in the NE caldera at Namanula, and also in surrounding areas downwind and on the E side of Rabaul Town. There were no audible noises and no glow visible. The low-level eruptive activity consisted of occasional ash emissions similar to those that have occurred regularly since 1994.
Pilot observations. Figures 43 and 44 are pilot's photographs provided by Tony Gridley, Air Niugini, indicating the well-developed ash clouds visible 1-2 hours after the eruption. The photos are reminiscent of the 20 September 1994 photo of the eruption cloud taken from the orbiting Space Shuttle, an oblique, downward-looking perspective from the NE about 24 hours after the start of that eruption (BGVN 19:08).
Satellite observations. According to Andrew Tupper, the 7 October eruption was clearly visible on infrared and visible imagery (to around tropopause altitudes). Figure 45 shows the ash cloud imaged from the MODIS satellite on 7 October 2006. Figure 46 depicts the sulfur dioxide (SO2) in Dobson Units (DU) from the Ozone Monitoring Instrument (OMI) for 7-9 October 2006. Further details appear in the figure caption. The SO2 concentration-pathlengths on the figure are shown using the logarithmic scale of Dobson Units. (As one explanation of this unit, if all SO2 in the air column the satellite observed was flattened into a thin layer at the surface of the Earth at a temperature of 0°C, then 1 Dobson Unit would make a layer of pure SO2 0.01 mm thick.)
Based on information from the RVO, the Darwin VAAC reported that a brief eruption of Rabaul on 11 October produced a plume that reached an altitude of 7.6 km altitude and dissipated NW. Continuous low-level emissions and vulcanian eruptions produced plumes to 1 km altitude during 12-17 October.
Moderate Resolution Infrared Spectroradiometry (MODIS) thermal anomalies. Table 4 shows the thermal anomalies as measured from the MODIS satellite during the eruption period. Note that there were no anomalies for several months before this period. The anomalies are in harmony with the observed lava flows.
Table 4. MODIS thermal anomalies for Rabaul volcano for 7-17 October 2006. Courtesy of Hawai'i Institute of Geophysics and Planetology.
| Date |
Time (UTC) |
Pixels |
Satellite |
| 07 Oct 2006 |
1140 |
4 |
Terra |
| 08 Oct 2006 |
0000 |
2 |
Terra |
| 08 Oct 2006 |
1220 |
6 |
Terra |
| 08 Oct 2006 |
1520 |
4 |
Aqua |
| 10 Oct 2006 |
1210 |
2 |
Terra |
| 11 Oct 2006 |
0035 |
1 |
Terra |
| 11 Oct 2006 |
1250 |
1 |
Terra |
| 15 Oct 2006 |
1230 |
1 |
Terra |
| 15 Oct 2006 |
1525 |
3 |
Aqua |
| 17 Oct 2006 |
1215 |
1 |
Terra |
| 22 Oct 2006 |
0015 |
2 |
Terra |
| 22 Oct 2006 |
1535 |
1 |
Aqua |
| 24 Oct 2006 |
1220 |
2 |
Terra |
News releases. According to Reuters news service the 7 October blast shattered windows up to 12 km from the caldera. In 1994, a large eruption at Tavurvur and the nearby Vulcan peak destroyed much of Rabaul, covering the airport and much of the town with ash, and forcing the construction of a new capital, Kokopo, 20 km away. Ash was falling on Kokopo, causing power and phone cuts. There were no reports of death or injuries. In addition Reuters noted that "Rabaul Chamber of Commerce President and hotelier Bruce Alexander told Australian Associated Press that around 2,000 people?or 90 percent of the local population?had fled the town as Mt. Tavurvur erupted. All flights into Tokua airport across the harbor from Rabaul had been canceled due to ash falls."
According to The Sydney Morning Herald, with 90% of the residents absent and only essential personnel in Rabaul, local officials feared looters. Accordingly, extra police were called in, and armed police patrols were stepped up.
Geologic Background. The low-lying Rabaul caldera on the tip of the Gazelle Peninsula at the NE end of New Britain forms a broad sheltered harbor utilized by what was the island's largest city prior to a major eruption in 1994. The outer flanks of the asymmetrical shield volcano are formed by thick pyroclastic-flow deposits. The 8 x 14 km caldera is widely breached on the east, where its floor is flooded by Blanche Bay and was formed about 1,400 years ago. An earlier caldera-forming eruption about 7,100 years ago is thought to have originated from Tavui caldera, offshore to the north. Three small stratovolcanoes lie outside the N and NE caldera rims. Post-caldera eruptions built basaltic-to-dacitic pyroclastic cones on the caldera floor near the NE and W caldera walls. Several of these, including Vulcan cone, which was formed during a large eruption in 1878, have produced major explosive activity during historical time. A powerful explosive eruption in 1994 occurred simultaneously from Vulcan and Tavurvur volcanoes and forced the temporary abandonment of Rabaul city.
Information Contacts: Steve Saunders and Herman Patia, Rabaul Volcanological Observatory (RVO), Department of Mining, Private Mail Bag, Port Moresby Post Office, National Capitol District, Papua, New Guinea; Andrews Tupper, Darwin Volcanic Ash Advisory Centre (VAAC), Bureau of Meteorology, Darwin, Australia; Peter Webley, ARSC/UAF, 909 Koyukuk Drive, Fairbanks, Alaska; Simon Carn, Joint Center for Earth Systems Technology (JCET), University of Maryland Baltimore County (UMBC), 1000 Hilltop Circle, Baltimore, MD 21250, USA; National Aeronautics and Space Administration Earth Observatory (URL: http://earthobservatory.nasa.gov/NaturalHazards); HIGP MODIS Thermal Alert System, Hawai'i Institute of Geophysics and Planetology (HIGP), University of Hawaii at Manoa, 168 East-West Road, Post 602, Honolulu, HI 96822, USA (URL: http://modis.higp.hawaii.edu/).
San Cristobal (Nicaragua) — September 2006 Cite this Report
San Cristobal
Nicaragua
12.702°N, 87.004°W; summit elev. 1745 m
All times are local (unless otherwise noted)
Multi-year update: 13 June 2004, local ash fall; early 2006, small eruptions
San Cristóbal was last reported on in BGVN 28:10, covering intermittent gas and ash emissions between August 2002 and September 2003. The Instituto Nicarag?ense de Estudios Territoriales (INETER) noted that low seismicity and minor gas and ash emissions characterized the period from October 2003 to June 2004.
On 7 June 2004 a lahar flowed more than 600 m. On 13 June 2004, an eruption caused ash to fall in the communities of Las Rojas, El Chonco, and El Viejo.
On 20 July 2004 at 1430, an M 4.3 earthquake occurred to the N of the volcano at a depth of less than four km. The earthquake was felt in the regions of Carlos Fonseca, Villa 15 de Julio, La Suiza, Las Rojas, Mocorón, San Jose del Obraje, Santa Carlota, San Antonio, Ranchería, and bordering regions. Some houses were damaged and the population was alarmed. The earthquake was felt in Matagalpa and Ocotal, and San Cristóbal emitted abundant gases for the following two days. During the rest of July, 95 aftershocks were registered; residents felt two more earthquakes, which occurred on 23 and 30 July.
During August to early December 2004, minor seismicity and ash and gas emissions were the norm. Ash explosions occurred on 3, 4, and 7 December. According to local people, ash fell in Chinandega and El Viejo.
The next available report discussed 16-22 November 2005. INETER detected an increase in seismicity beginning on 19 November. Increased tremor was interpreted as being related to gas and ash emissions. Ash fell W of the volcano and near the town of Chinandega, ~ 15 km SW of the volcano. The amount of tremor decreased later.
According to an Associated Press news report, explosions on 6 March 2006 produced columns of ash and gas that rose above the volcano. The activity ceased by 8 March and there were no evacuations.
INETER noted that phreatomagmatic eruptions began at San Cristóbal on 21 April 2006. Seismic tremor increased the same day around 1300. Small explosions produced gas-and-ash plumes during 21-23 April that deposited small amounts of ash in nearby towns.
Geologic Background. The San Cristóbal volcanic complex, consisting of five principal volcanic edifices, forms the NW end of the Marrabios Range. The symmetrical 1745-m-high youngest cone, named San Cristóbal (also known as El Viejo), is Nicaragua's highest volcano and is capped by a 500 x 600 m wide crater. El Chonco, with several flank lava domes, is located 4 km W of San Cristóbal; it and the eroded Moyotepe volcano, 4 km NE of San Cristóbal, are of Pleistocene age. Volcán Casita, containing an elongated summit crater, lies immediately east of San Cristóbal and was the site of a catastrophic landslide and lahar in 1998. The Plio-Pleistocene La Pelona caldera is located at the eastern end of the complex. Historical eruptions from San Cristóbal, consisting of small-to-moderate explosive activity, have been reported since the 16th century. Some other 16th-century eruptions attributed to Casita volcano are uncertain and may pertain to other Marrabios Range volcanoes.
Information Contacts: Virginia Tenorio, Emilio Talavera, and Martha Navarro, Instituto Nicaraguense de Estudios Territoriales (INETER), Apartado Postal 2110, Managua, Nicaragua (URL: http://www.ineter.gob.ni/); Associated Press (URL: http://www.ap.org/).
Soufriere Hills (United Kingdom) — September 2006 Cite this Report
Soufriere Hills
United Kingdom
16.72°N, 62.18°W; summit elev. 915 m
All times are local (unless otherwise noted)
Extrusive dome dynamics during May-September 2006
Since the 20 May 2006 dome collapse, the lava dome at Soufrière Hills has continued to grow. Only weeks after the collapse, the alert level was raised to 4 as a result of increased seismic activity. At approximately 1300 on 30 June, the lava dome partially collapsed again, producing pyroclastic flows that traveled E. According to the Washington VAAC, a pilot reported an ash plume that reached ~ 3 km altitude and drifted NW. At 1830 on 30 June, Montserrat Volcano Observatory (MVO) indicated a second dome collapse that also generated ash plumes to an altitude of 3.0-3.5 km (figure 70). According to MVO, on 27 June (prior to the collapse on 30 June) the lava dome had an estimated volume of 27 million cubic meters.
On 7 July, the alert level was lowered from 4 to 3. Increased rockfall activity and dome growth to the NE were observed on 21 July, and the post-collapse dome developed an asymmetric profile owing to a blocky spine on the NE. On 18 July the spine's summit stood at ~ 895 m elevation. As the dome continued to grow during July (figure 71), visual observations revealed that the still intact blocky spine began leaning E.
During August the dome lost spines from its crest, giving it a more symmetrical profile as it continued to grow E. Heightened activity during the last week of August included an increase in seismicity and pyroclastic flows. On 29 August, pyroclastic flows reached the Tar River valley and generated a steam-and-ash cloud that reached an altitude of ~ 9 km. Heavy rainfall produced mudflows around the base of the volcano.
At 0300 on 31 August, two vigorous ash-and-steam vents opened on the W and N flanks of the dome (figure 72). The venting episode was audible at times from the town of Salem and the surrounding areas. MVO noted the continued dome growth and the opening of these vents when on 31 August they raised the alert level to 4.
Heightened activity continued in September. The dome continued to develop substantially with a majority of growth on the W side. The vents that opened on 31 August remained active, with the vent above Gage's wall emitting a plume of hot gases and the N vent on the dome producing mainly ash-and-steam (figure 73). The opening of these vents coincided with high lava extrusion rates and consequent dome growth.
At 0100 on 10 September, the vent above Gage's wall became more vigorous throughout the day, broadening the vent and generating a wide vertical ash column. By 1300 the venting there became violent and explosive with black jets of ash rising ~ 100 m. Pyroclastic flows traveled down the Gages valley for ~ 1 km (figure 74). The vent formed a crater in the Gages wall, reducing its height compared to that of Chances Peak by 30-50 m. By 11 September, pyroclastic flows from vent emissions had ceased, but vigorous ash venting continued. At 0830 an overhanging lava lobe that developed on the NE collapsed sending a pyroclastic flow almost to the sea at the end of the Tar River valley.
Although volcanic tremor ended early on 16 September, an intense episode of volcanic tremor lasting just half an hour started at 1400 on 19 September. It was accompanied by intense rockfall activity giving rise to minor pyroclastic flows down the N and NE flanks of the lava dome. On 21 September the alert level was reduced to 3.
Geologic Background. The complex, dominantly andesitic Soufrière Hills volcano occupies the southern half of the island of Montserrat. The summit area consists primarily of a series of lava domes emplaced along an ESE-trending zone. The volcano is flanked by Pleistocene complexes to the north and south. English's Crater, a 1-km-wide crater breached widely to the east by edifice collapse, was formed about 2000 years ago as a result of the youngest of several collapse events producing submarine debris-avalanche deposits. Block-and-ash flow and surge deposits associated with dome growth predominate in flank deposits, including those from an eruption that likely preceded the 1632 CE settlement of the island, allowing cultivation on recently devegetated land to near the summit. Non-eruptive seismic swarms occurred at 30-year intervals in the 20th century, but no historical eruptions were recorded until 1995. Long-term small-to-moderate ash eruptions beginning in that year were later accompanied by lava-dome growth and pyroclastic flows that forced evacuation of the southern half of the island and ultimately destroyed the capital city of Plymouth, causing major social and economic disruption.
Information Contacts: Montserrat Volcano Observatory (MVO), Fleming, Montserrat, West Indies (URL: http://www.mvo.ms/).
Sulu Range (Papua New Guinea) — September 2006 Cite this Report
Sulu Range
Papua New Guinea
5.5°S, 150.942°E; summit elev. 610 m
All times are local (unless otherwise noted)
Volcano seismicity declines in September and October 2006
On 31 October 2006 the Rabaul Volcanological Observatory (RVO) issued a followup report to the eruptive activity in the Sulu Range through much of October. Sulu Range was previously discussed in BGVN 31:07, but that report was ambiguous on the nature of the activity that had taken place during July 2006. This report and personal communications establishes that RVO staff are doubtful that the most energetic events were magmatic in character. Furthermore, RVO reported that in the weeks that followed, seismicity continued to decline.
The seismic unrest that began on 6 July declined from over 2,000 daily volcano-tectonic (VT) events to below 50 daily VT events during October (figure 2). The number fluctuated between 35 and 50 from late September to early October and between 5 and 25 during the third week of October.
RVO noted that about two to three felt earthquakes with intensity 2 continued to be felt daily at irregular intervals within the Bialla area and that white steam emissions from the Silanga Hot Springs were still visible from Bialla. In addition, a moderately strong sulfur smell from the Silanga and Talopu hot springs continued to be reported.
An analysis by RVO scientists concluded that at no point did magma reach the surface. The declining trend in seismic activity from early to late October may indicate that the new magma that apparently intruded to shallow levels in July is beginning to stall.
A permanent seismic station will be installed at Kaiamu in December 2006 to provide continuous monitoring of activity from the Sulu Range and surrounding areas.
In an extension of elevated regional tectonic seismicity, a strong earthquake, M ~ 6.5, struck the S side of central New Britain on 17 October. The USGS computed the focal depth as ~ 60 km, with epicenter ~ 50 km S of the Sulu Range. According to a USGS machine-generated shaking and intensity map, the Sulu Range lies within the zone of highest computed intensity (VI).
Geologic Background. The Sulu Range consists of a cluster of partially overlapping small stratovolcanoes and lava domes in north-central New Britain off Bangula Bay. The 610-m Mount Malopu at the southern end forms the high point of the basaltic-to-rhyolitic complex. Kaiamu maar forms a peninsula with a small lake extending about 1 km into Bangula Bay at the NW side of the Sulu Range. The Walo hydrothermal area, consisting of solfataras and mud pots, lies on the coastal plain west of the SW base of the Sulu Range. No historical eruptions are known from the Sulu Range, although some of the cones display a relatively undissected morphology. A vigorous new fumarolic vent opened in 2006, preceded by vegetation die-off, seismicity, and dust-producing landslides.
Information Contacts: Steve Saunders and Herman Patia, Rabaul Volcanological Observatory (RVO), Department of Mining, Private Mail Bag, Port Moresby Post Office, National Capitol District, Papua, New Guinea; USGS Earthquakes Hazard Program (URL: http://earthquakes.usgs.gov/)