Recently Published Bulletin Reports
Manam (Papua New Guinea) Few ash plumes during November-December 2022
Krakatau (Indonesia) Strombolian activity and ash plumes during November 2022-April 2023
Stromboli (Italy) Strombolian explosions and lava flows continue during January-April 2023
Nishinoshima (Japan) Small ash plumes and fumarolic activity during November 2022 through April 2023
Karangetang (Indonesia) Lava flows, incandescent avalanches, and ash plumes during January-June 2023
Ahyi (United States) Intermittent hydroacoustic signals and discolored plumes during November 2022-June 2023
Kadovar (Papua New Guinea) An ash plume and weak thermal anomaly during May 2023
San Miguel (El Salvador) Small gas-and-ash explosions during March and May 2023
Semisopochnoi (United States) Occasional explosions, ash deposits, and gas-and-steam plumes during December 2022-May 2023
Ebeko (Russia) Continued explosions, ash plumes, and ashfall during October 2022-May 2023
Home Reef (Tonga) Discolored plumes continued during November 2022-April 2023
Ambae (Vanuatu) New lava flow, ash plumes, and sulfur dioxide plumes during February-May 2023
Manam (Papua New Guinea) — July 2023  Cite this Report
Manam
Papua New Guinea
4.08°S, 145.037°E; summit elev. 1807 m
All times are local (unless otherwise noted)
Few ash plumes during November-December 2022
Manam is a 10-km-wide island that consists of two active summit craters: the Main summit crater and the South summit crater and is located 13 km off the northern coast of mainland Papua New Guinea. Frequent mild-to-moderate eruptions have been recorded since 1616. The current eruption period began during June 2014 and has more recently been characterized by intermittent ash plumes and thermal activity (BGVN 47:11). This report updates activity that occurred from November 2022 through May 2023 based on information from the Darwin Volcanic Ash Advisory Center (VAAC) and various satellite data.
Ash plumes were reported during November and December 2022 by the Darwin VAAC. On 7 November an ash plume rose to 2.1 km altitude and drifted NE based on satellite images and weather models. On 14 November an ash plume rose to 2.1 km altitude and drifted W based on RVO webcam images. On 20 November ash plumes rose to 1.8 km altitude and drifted NW. On 26 December an ash plume rose to 3 km altitude and drifted S and SSE.
Intermittent sulfur dioxide plumes were detected using the TROPOMI instrument on the Sentinel-5P satellite, some of which exceeded at least two Dobson Units (DU) and drifted in different directions (figure 93). Occasional low-to-moderate power thermal anomalies were recorded by the MIROVA (Middle InfraRed Observation of Volcanic Activity) system; less than five anomalies were recorded each month during November 2022 through May 2023 (figure 94). Two thermal hotspots were detected by the MODVOLC thermal alerts system on 10 December 2022. On clear weather days, thermal activity was also captured in infrared satellite imagery in both the Main and South summit craters, accompanied by gas-and-steam emissions (figure 95).
Geologic Background. The 10-km-wide island of Manam, lying 13 km off the northern coast of mainland Papua New Guinea, is one of the country's most active volcanoes. Four large radial valleys extend from the unvegetated summit of the conical basaltic-andesitic stratovolcano to its lower flanks. These valleys channel lava flows and pyroclastic avalanches that have sometimes reached the coast. Five small satellitic centers are located near the island's shoreline on the northern, southern, and western sides. Two summit craters are present; both are active, although most observed eruptions have originated from the southern crater, concentrating eruptive products during much of the past century into the SE valley. Frequent eruptions, typically of mild-to-moderate scale, have been recorded since 1616. Occasional larger eruptions have produced pyroclastic flows and lava flows that reached flat-lying coastal areas and entered the sea, sometimes impacting populated areas.
Information Contacts: Rabaul Volcano Observatory (RVO), Geohazards Management Division, Department of Mineral Policy and Geohazards Management (DMPGM), PO Box 3386, Kokopo, East New Britain Province, Papua New Guinea; Darwin Volcanic Ash Advisory Centre (VAAC), Bureau of Meteorology, Northern Territory Regional Office, PO Box 40050, Casuarina, NT 0811, Australia (URL: http://www.bom.gov.au/info/vaac/); MIROVA (Middle InfraRed Observation of Volcanic Activity), a collaborative project between the Universities of Turin and Florence (Italy) supported by the Centre for Volcanic Risk of the Italian Civil Protection Department (URL: http://www.mirovaweb.it/); Hawai'i Institute of Geophysics and Planetology (HIGP) - MODVOLC Thermal Alerts System, School of Ocean and Earth Science and Technology (SOEST), Univ. of Hawai'i, 2525 Correa Road, Honolulu, HI 96822, USA (URL: http://modis.higp.hawaii.edu/); NASA Global Sulfur Dioxide Monitoring Page, Atmospheric Chemistry and Dynamics Laboratory, NASA Goddard Space Flight Center (NASA/GSFC), 8800 Greenbelt Road, Goddard, Maryland, USA (URL: https://so2.gsfc.nasa.gov/); Copernicus Browser, Copernicus Data Space Ecosystem, European Space Agency (URL: https://dataspace.copernicus.eu/browser/).
Krakatau (Indonesia) — July 2023 Cite this Report
Krakatau
Indonesia
6.1009°S, 105.4233°E; summit elev. 285 m
All times are local (unless otherwise noted)
Strombolian activity and ash plumes during November 2022-April 2023
Krakatau is located in the Sunda Strait between Java and Sumatra, Indonesia. Caldera collapse during the catastrophic 1883 eruption destroyed Danan and Perbuwatan cones and left only a remnant of Rakata. The post-collapse cone of Anak Krakatau (Child of Krakatau) was constructed within the 1883 caldera at a point between the former Danan and Perbuwatan cones; it has been the site of frequent eruptions since 1927. The current eruption period began in May 2021 and has recently consisted of explosions, ash plumes, and thermal activity (BGVN 47:11). This report covers activity during November 2022 through April 2023 based on information provided by the Indonesian Center for Volcanology and Geological Hazard Mitigation, referred to as Pusat Vulkanologi dan Mitigasi Bencana Geologi (PVMBG), MAGMA Indonesia, the Darwin Volcanic Ash Advisory Center (VAAC), and several sources of satellite data.
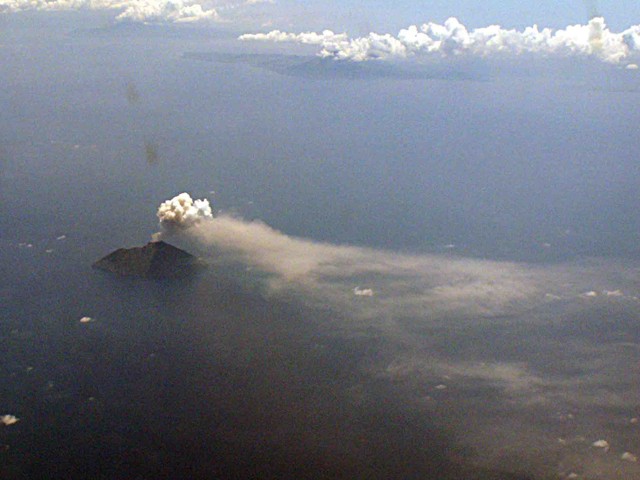
Activity was relatively low during November and December 2022. Daily white gas-and-steam plumes rose 25-100 m above the summit and drifted in different directions. Gray ash plumes rose 200 m above the summit and drifted NE at 1047 and at 2343 on 11 November. On 14 November at 0933 ash plumes rose 300 m above the summit and drifted E. An ash plume was reported at 0935 on 15 December that rose 100 m above the summit and drifted NE. An eruptive event at 1031 later that day generated an ash plume that rose 700 m above the summit and drifted NE. A gray ash plume at 1910 rose 100 m above the summit and drifted E. Incandescent material was ejected above the vent based on an image taken at 1936.
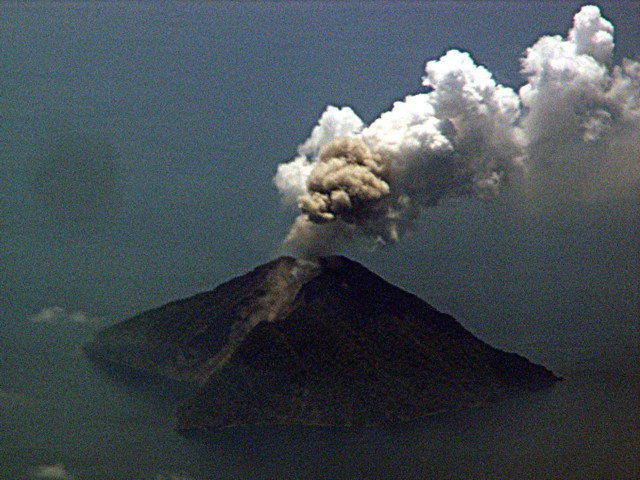
During January 2023 daily white gas-and-steam plumes rose 25-300 m above the summit and drifted in multiple directions. Gray-to-brown ash plumes were reported at 1638 on 3 January, at 1410 and 1509 on 4 January, and at 0013 on 5 January that rose 100-750 m above the summit and drifted NE and E; the gray-to-black ash plume at 1509 on 4 January rose as high as 3 km above the summit and drifted E. Gray ash plumes were recorded at 1754, 2241, and 2325 on 11 January and at 0046 on 12 January and rose 200-300 m above the summit and drifted NE. Toward the end of January, PVMBG reported that activity had intensified; Strombolian activity was visible in webcam images taken at 0041, 0043, and 0450 on 23 January. Multiple gray ash plumes throughout the day rose 200-500 m above the summit and drifted E and SE (figure 135). Webcam images showed progressively intensifying Strombolian activity at 1919, 1958, and 2113 on 24 January; a gray ash plume at 1957 rose 300 m above the summit and drifted E (figure 135). Eruptive events at 0231 and 2256 on 25 January and at 0003 on 26 January ejected incandescent material from the vent, based on webcam images. Gray ash plumes observed during 26-27 January rose 300-500 m above the summit and drifted NE, E, and SE.
Low levels of activity were reported during February and March. Daily white gas-and-steam plumes rose 25-300 m above the summit and drifted in different directions. The Darwin VAAC reported that continuous ash emissions rose to 1.5-1.8 km altitude and drifted W and NW during 1240-1300 on 10 March, based on satellite images, weather models, and PVMBG webcams. White-and-gray ash plumes rose 500 m and 300 m above the summit and drifted SW at 1446 and 1846 on 18 March, respectively. An eruptive event was recorded at 2143, though it was not visible due to darkness. Multiple ash plumes were reported during 27-29 March that rose as high as 2.5 km above the summit and drifted NE, W, and SW (figure 136). Webcam images captured incandescent ejecta above the vent at 0415 and around the summit area at 2003 on 28 March and at 0047 above the vent on 29 March.
Daily white gas-and-steam plumes rose 25-300 m above the summit and drifted in multiple directions during April and May. White-and-gray and black plumes rose 50-300 m above the summit on 2 and 9 April. On 11 May at 1241 a gray ash plume rose 1-3 km above the summit and drifted SW. On 12 May at 0920 a gray ash plume rose 2.5 km above the summit and drifted SW and at 2320 an ash plume rose 1.5 km above the summit and drifted SW. An accompanying webcam image showed incandescent ejecta. On 13 May at 0710 a gray ash plume rose 2 km above the summit and drifted SW (figure 137).
The MIROVA (Middle InfraRed Observation of Volcanic Activity) graph of MODIS thermal anomaly data showed intermittent low-to-moderate power thermal anomalies during November 2022 through April 2023 (figure 138). Some of this thermal activity was also visible in infrared satellite imagery at the crater, accompanied by gas-and-steam and ash plumes that drifted in different directions (figure 139).
Geologic Background. The renowned Krakatau (frequently mis-named as Krakatoa) volcano lies in the Sunda Strait between Java and Sumatra. Collapse of an older edifice, perhaps in 416 or 535 CE, formed a 7-km-wide caldera. Remnants of that volcano are preserved in Verlaten and Lang Islands; subsequently the Rakata, Danan, and Perbuwatan cones were formed, coalescing to create the pre-1883 Krakatau Island. Caldera collapse during the catastrophic 1883 eruption destroyed Danan and Perbuwatan, and left only a remnant of Rakata. This eruption caused more than 36,000 fatalities, most as a result of tsunamis that swept the adjacent coastlines of Sumatra and Java. Pyroclastic surges traveled 40 km across the Sunda Strait and reached the Sumatra coast. After a quiescence of less than a half century, the post-collapse cone of Anak Krakatau (Child of Krakatau) was constructed within the 1883 caldera at a point between the former Danan and Perbuwatan cones. Anak Krakatau has been the site of frequent eruptions since 1927.
Information Contacts: Pusat Vulkanologi dan Mitigasi Bencana Geologi (PVMBG, also known as Indonesian Center for Volcanology and Geological Hazard Mitigation, CVGHM), Jalan Diponegoro 57, Bandung 40122, Indonesia (URL: http://www.vsi.esdm.go.id/); MAGMA Indonesia, Kementerian Energi dan Sumber Daya Mineral (URL: https://magma.esdm.go.id/v1); Darwin Volcanic Ash Advisory Centre (VAAC), Bureau of Meteorology, Northern Territory Regional Office, PO Box 40050, Casuarina, NT 0811, Australia (URL: http://www.bom.gov.au/info/vaac/); MIROVA (Middle InfraRed Observation of Volcanic Activity), a collaborative project between the Universities of Turin and Florence (Italy) supported by the Centre for Volcanic Risk of the Italian Civil Protection Department (URL: http://www.mirovaweb.it/); Copernicus Browser, Copernicus Data Space Ecosystem, European Space Agency (URL: https://dataspace.copernicus.eu/browser/).
Stromboli
Italy
38.789°N, 15.213°E; summit elev. 924 m
All times are local (unless otherwise noted)
Strombolian explosions and lava flows continue during January-April 2023
Stromboli, located in Italy, has exhibited nearly constant lava fountains for the past 2,000 years; recorded eruptions date back to 350 BCE. Eruptive activity occurs at the summit from multiple vents, which include a north crater area (N area) and a central-southern crater (CS area) on a terrace known as the ‘terrazza craterica’ at the head of the Sciara del Fuoco, a large scarp that runs from the summit down the NW side of the volcano-island. Activity typically consists of Strombolian explosions, incandescent ejecta, lava flows, and pyroclastic flows. Thermal and visual monitoring cameras are located on the nearby Pizzo Sopra La Fossa, above the terrazza craterica, and at multiple flank locations. The current eruption period has been ongoing since 1934 and recent activity has consisted of frequent Strombolian explosions and lava flows (BGVN 48:02). This report updates activity during January through April 2023 primarily characterized by Strombolian explosions and lava flows based on reports from Italy's Istituto Nazionale di Geofisica e Vulcanologia (INGV) and various satellite data.
Frequent explosive activity continued throughout the reporting period, generally in the low-to-medium range, based on the number of hourly explosions in the summit crater (figure 253, table 16). Intermittent thermal activity was recorded by the MIROVA (Middle InfraRed Observation of Volcanic Activity) analysis of MODIS satellite data (figure 254). According to data collected by the MODVOLC thermal algorithm, a total of 9 thermal alerts were detected: one on 2 January 2023, one on 1 February, five on 24 March, and two on 26 March. The stronger pulses of thermal activity likely reflected lava flow events. Infrared satellite imagery captured relatively strong thermal hotspots at the two active summit craters on clear weather days, showing an especially strong event on 8 March (figure 255).
Table 16. Summary of type, frequency, and intensity of explosive activity at Stromboli by month during January-April 2023; information from webcam observations. Courtesy of INGV weekly reports.
| Month |
Explosive Activity |
| Jan 2023 |
Typical Strombolian activity with spattering and lava overflows in the N crater area. Explosions were reported from 4 vents in the N area and 1-2 vents in the CS area. The average hourly frequency of explosions was low-to-medium (1-12 events/hour). The intensity of the explosions varied from low (less than 80 m high) to medium (less than 150 m high) in the N crater area and up to high (greater than 150 m high) in the CS crater area. |
| Feb 2023 |
Typical Strombolian activity with spattering in the N crater area. Explosions were reported from 2-3 vents in the N area and 1-4 vents in the CS area. The average hourly frequency of explosions was low-to-medium (1-14 events/hour). The intensity of the explosions varied from low (less than 80 m high) to medium (less than 150 m high) in the N crater area and up to high (greater than 150 m high) in the CS crater area. |
| Mar 2023 |
Typical Strombolian activity with spattering and lava overflows in the N crater area. Explosions were reported from 2-3 vents in the N area and 2-4 vents in the CS area. The average hourly frequency of explosions was low-to-medium (1-18 events/hour). The intensity of the explosions varied from low (less than 80 m high) to medium (less than 150 m high) in the N crater area and up to high (greater than 150 m high) in the CS crater area. |
| Apr 2023 |
Typical Strombolian activity. Explosions were reported from 2 vents in the N area and 2-3 vents in the CS area. The average hourly frequency of explosions was low-to-high (1-16 events/hour). The intensity of the explosions varied from low (less than 80 m high) to medium (less than 150 m high) in both the N and CS crater areas. |
Activity during January-February 2023. Strombolian explosions were reported in the N crater area, as well as lava effusion. Explosive activity in the N crater area ejected coarse material (bombs and lapilli). Intense spattering was observed in both the N1 and N2 craters. In the CS crater area, explosions generally ejected fine material (ash), sometimes to heights greater than 250 m. The intensity of the explosions was characterized as low-to-medium in the N crater and medium-to-high in the CS crater. After intense spattering activity from the N crater area, a lava overflow began at 2136 on 2 January that flowed part way down the Sciara del Fuoco, possibly moving down the drainage that formed in October, out of view from webcams. The flow remained active for a couple of hours before stopping and beginning to cool. A second lava flow was reported at 0224 on 4 January that similarly remained active for a few hours before stopping and cooling. Intense spattering was observed on 11 and 13 January from the N1 crater. After intense spattering activity at the N2 crater at 1052 on 17 January another lava flow started to flow into the upper part of the Sciara del Fuoco (figure 256), dividing into two: one that traveled in the direction of the drainage formed in October, and the other one moving parallel to the point of emission. By the afternoon, the rate of the flow began to decrease, and at 1900 it started to cool. A lava flow was reported at 1519 on 24 January following intense spattering in the N2 area, which began to flow into the upper part of the Sciara del Fuoco. By the morning of 25 January, the lava flow had begun to cool. During 27 January the frequency of eruption in the CS crater area increased to 6-7 events/hour compared to the typical 1-7 events/hour; the following two days showed a decrease in frequency to less than 1 event/hour. Starting at 1007 on 30 January a high-energy explosive sequence was produced by vents in the CS crater area. The sequence began with an initial energetic pulse that lasted 45 seconds, ejecting predominantly coarse products 300 m above the crater that fell in an ESE direction. Subsequent and less intense explosions ejected material 100 m above the crater. The total duration of this event lasted approximately two minutes. During 31 January through 6, 13, and 24 February spattering activity was particularly intense for short periods in the N2 crater.
An explosive sequence was reported on 16 February that was characterized by a major explosion in the CS crater area (figure 257). The sequence began at 1817 near the S2 crater that ejected material radially. A few seconds later, lava fountains were observed in the central part of the crater. Three explosions of medium intensity (material was ejected less than 150 m high) were recorded at the S2 crater. The first part of this sequence lasted approximately one minute, according to INGV, and material rose 300 m above the crater and then was deposited along the Sciara del Fuoco. The second phase began at 1818 at the S1 crater; it lasted seven seconds and material was ejected 150 m above the crater. Another event 20 seconds later lasted 12 seconds, also ejecting material 150 m above the crater. The sequence ended with at least three explosions of mostly fine material from the S1 crater. The total duration of this sequence was about two minutes.
Short, intense spattering activity was noted above the N1 crater on 27 and 28 February. A lava overflow was first reported at 0657 from the N2 crater on 27 February that flowed into the October 2022 drainage. By 1900 the flow had stopped. A second lava overflow also in the N crater area occurred at 2149, which overlapped the first flow and then stopped by 0150 on 28 February. Material detached from both the lava overflows rolled down the Sciara del Fuoco, some of which was visible in webcam images.
Activity during March-April 2023. Strombolian activity continued with spattering activity and lava overflows in the N crater area during March. Explosive activity at the N crater area varied from low (less than 80 m high) to medium (less than 150 m high) and ejected coarse material, such as bombs and lapilli. Spattering was observed above the N1 crater, while explosive activity at the CS crater area varied from medium to high (greater than 150 m high) and ejected coarse material. Intense spattering activity was observed for short periods on 6 March above the N1 crater. At approximately 0610 a lava overflow was reported around the N2 crater on 8 March, which then flowed into the October 2022 drainage. By 1700 the flow started to cool. A second overflow began at 1712 on 9 March and overlapped the previous flow. It had stopped by 2100. Material from both flows was deposited along the Sciara del Fuoco, though much of the activity was not visible in webcam images. On 11 March a lava overflow was observed at 0215 that overlapped the two previous flows in the October 2022 drainage. By late afternoon on 12 March, it had stopped.
During a field excursion on 16 March, scientists noted that a vent in the central crater area was degassing. Another vent showed occasional Strombolian activity that emitted ash and lapilli. During 1200-1430 low-to-medium intense activity was reported; the N1 crater emitted ash emissions and the N2 crater emitted both ash and coarse material. Some explosions also occurred in the CS crater area that ejected coarse material. The C crater in the CS crater area occasionally showed gas jetting and low intensity explosions on 17 and 22 March; no activity was observed at the S1 crater. Intense, longer periods of spattering were reported in the N1 crater on 19, 24, and 25 March. Around 2242 on 23 March a lava overflow began from the N1 crater that, after about an hour, began moving down the October 2022 drainage and flow along the Sciara del Fuoco (figure 258). Between 0200 and 0400 on 26 March the flow rate increased, which generated avalanches of material from collapses at the advancing flow front. By early afternoon, the flow began to cool. On 25 March at 1548 an explosive sequence began from one of the vents at S2 in the CS crater area (figure 258). Fine ash mixed with coarse material was ejected 300 m above the crater rim and drifted SSE. Some modest explosions around Vent C were detected at 1549 on 25 March, which included an explosion at 1551 that ejected coarse material. The entire explosive sequence lasted approximately three minutes.
During April explosions persisted in both the N and CS crater areas. Fine material was ejected less than 80 m above the N crater rim until 6 April, followed by ejection of coarser material. Fine material was also ejected less than 80 m above the CS crater rim. The C and S2 crater did not show significant eruptive activity. On 7 April an explosive sequence was detected in the CS crater area at 1203 (figure 259). The first explosion lasted approximately 18 seconds and ejected material 400 m above the crater rim, depositing pyroclastic material in the upper part of the Sciara del Fuoco. At 1204 a second, less intense explosion lasted approximately four seconds and deposited pyroclastic products outside the crater area and near Pizzo Sopra La Fossa. A third explosion at 1205 was mainly composed of ash that rose about 150 m above the crater and lasted roughly 20 seconds. A fourth explosion occurred at 1205 about 28 seconds after the third explosion and ejected a mixture of coarse and fine material about 200 m above the crater; the explosion lasted roughly seven seconds. Overall, the entire explosive sequence lasted about two minutes and 20 seconds. After the explosive sequence on 7 April, explosions in both the N and CS crater areas ejected material as high as 150 m above the crater.
On 21 April research scientists from INGV made field observations in the summit area of Stromboli, and some lapilli samples were collected. In the N crater area near the N1 crater, a small cone was observed with at least two active vents, one of which was characterized by Strombolian explosions. The other vent produced explosions that ejected ash and chunks of cooled lava. At the N2 crater at least one vent was active and frequently emitted ash. In the CS crater area, a small cone contained 2-3 degassing vents and a smaller, possible fissure area also showed signs of degassing close to the Pizzo Sopra La Fossa. In the S part of the crater, three vents were active: a small hornito was characterized by modest and rare explosions, a vent that intermittently produced weak Strombolian explosions, and a vent at the end of the terrace that produced frequent ash emissions. Near the S1 crater there was a hornito that generally emitted weak gas-and-steam emissions, sometimes associated with “gas rings”. On 22 April another field inspection was carried out that reported two large sliding surfaces on the Sciara del Fuoco that showed where blocks frequently descended toward the sea. A thermal anomaly was detected at 0150 on 29 April.
Geologic Background. Spectacular incandescent nighttime explosions at Stromboli have long attracted visitors to the "Lighthouse of the Mediterranean" in the NE Aeolian Islands. This volcano has lent its name to the frequent mild explosive activity that has characterized its eruptions throughout much of historical time. The small island is the emergent summit of a volcano that grew in two main eruptive cycles, the last of which formed the western portion of the island. The Neostromboli eruptive period took place between about 13,000 and 5,000 years ago. The active summit vents are located at the head of the Sciara del Fuoco, a prominent scarp that formed about 5,000 years ago due to a series of slope failures which extends to below sea level. The modern volcano has been constructed within this scarp, which funnels pyroclastic ejecta and lava flows to the NW. Essentially continuous mild Strombolian explosions, sometimes accompanied by lava flows, have been recorded for more than a millennium.
Information Contacts: Istituto Nazionale di Geofisica e Vulcanologia (INGV), Sezione di Catania, Piazza Roma 2, 95123 Catania, Italy, (URL: http://www.ct.ingv.it/en/); MIROVA (Middle InfraRed Observation of Volcanic Activity), a collaborative project between the Universities of Turin and Florence (Italy) supported by the Centre for Volcanic Risk of the Italian Civil Protection Department (URL: http://www.mirovaweb.it/); Hawai'i Institute of Geophysics and Planetology (HIGP) - MODVOLC Thermal Alerts System, School of Ocean and Earth Science and Technology (SOEST), Univ. of Hawai'i, 2525 Correa Road, Honolulu, HI 96822, USA (URL: http://modis.higp.hawaii.edu/); Copernicus Browser, Copernicus Data Space Ecosystem, European Space Agency (URL: https://dataspace.copernicus.eu/browser/).
Nishinoshima (Japan) — July 2023 Cite this Report
Nishinoshima
Japan
27.247°N, 140.874°E; summit elev. 100 m
All times are local (unless otherwise noted)
Small ash plumes and fumarolic activity during November 2022 through April 2023
Nishinoshima is a small island located about 1,000 km S of Tokyo in the Ogasawara Arc in Japan. The island is the summit of a massive submarine volcano that has prominent peaks to the S, W, and NE. Eruptions date back to 1973; the most recent eruption period began in October 2022 and was characterized by ash plumes and fumarolic activity (BGVN 47:12). This report describes ash plumes and fumarolic activity during November 2022 through April 2023 based on monthly reports from the Japan Meteorological Agency (JMA) monthly reports and satellite data.
The most recent eruptive activity prior to the reporting internal occurred on 12 October 2022, when an ash plume rose 3.5 km above the crater rim. An aerial observation conducted by the Japan Coast Guard (JCG) on 25 November reported that white fumaroles rose approximately 200 m above the central crater of a pyroclastic cone (figure 119), and multiple plumes were observed on the ESE flank of the cone. Discolored water ranging from reddish-brown to brown and yellowish-green were visible around the perimeter of the island (figure 119). No significant activity was reported in December.
During an overflight conducted by JCG on 25 January 2023 intermittent activity and small, blackish-gray plumes rose 900 m above the central part of the crater were observed (figure 120). The fumarolic zone of the E flank and base of the cone had expanded and emissions had intensified. Dark brown discolored water was visible around the perimeter of the island.
No significant activity was reported during February through March. Ash plumes at 1050 and 1420 on 11 April rose 1.9 km above the crater rim and drifted NW and N. These were the first ash plumes observed since 12 October 2022. On 14 April JCG carried out an overflight and reported that no further eruptive activity was visible, although white gas-and-steam plumes were visible from the central crater and rose 900 m high (figure 121). Brownish and yellow-green discolored water surrounded the island.
Intermittent low-to-moderate power thermal anomalies were recorded in the MIROVA graph (Middle InfraRed Observation of Volcanic Activity) during November 2022 through April 2023 (figure 123). A cluster of six to eight anomalies were detected during November while a smaller number were detected during the following months: two to three during December, one during mid-January 2023, one during February, five during March, and two during April. Thermal activity was also reflected in infrared satellite data at the summit crater, accompanied by occasional gas-and-steam plumes (figure 124).
Geologic Background. The small island of Nishinoshima was enlarged when several new islands coalesced during an eruption in 1973-74. Multiple eruptions that began in 2013 completely covered the previous exposed surface and continued to enlarge the island. The island is the summit of a massive submarine volcano that has prominent peaks to the S, W, and NE. The summit of the southern cone rises to within 214 m of the ocean surface 9 km SSE.
Information Contacts: Japan Meteorological Agency (JMA), 1-3-4 Otemachi, Chiyoda-ku, Tokyo 100-8122, Japan (URL: http://www.jma.go.jp/jma/indexe.html); MIROVA (Middle InfraRed Observation of Volcanic Activity), a collaborative project between the Universities of Turin and Florence (Italy) supported by the Centre for Volcanic Risk of the Italian Civil Protection Department (URL: http://www.mirovaweb.it/); Copernicus Browser, Copernicus Data Space Ecosystem, European Space Agency (URL: https://dataspace.copernicus.eu/browser/).
Karangetang (Indonesia) — July 2023 Cite this Report
Karangetang
Indonesia
2.781°N, 125.407°E; summit elev. 1797 m
All times are local (unless otherwise noted)
Lava flows, incandescent avalanches, and ash plumes during January-June 2023
Karangetang (also known as Api Siau), at the northern end of the island of Siau, Indonesia, contains five summit craters along a N-S line. More than 40 eruptions have been recorded since 1675; recent eruptions have included frequent explosive activity, sometimes accompanied by pyroclastic flows and lahars. Lava dome growth has occurred in the summit craters and collapses of lava flow fronts have produced pyroclastic flows. The two active summit craters are Kawah Dua (the N crater) and Kawah Utama (the S crater, also referred to as the “Main Crater”). The most recent eruption began in late November 2018 and has more recently consisted of weak thermal activity and gas-and-steam emissions (BGVN 48:01). This report updates activity characterized by lava flows, incandescent avalanches, and ash plumes during January through June 2023 using reports from Pusat Vulkanologi dan Mitigasi Bencana Geologi (PVMBG, also known as CVGHM, or the Center of Volcanology and Geological Hazard Mitigation), MAGMA Indonesia, the Darwin VAAC (Volcano Ash Advisory Center), and satellite data.
Activity during January was relatively low and mainly consisted of white gas-and-steam emissions that rose 25-150 m above Main Crater (S crater) and drifted in different directions. Incandescence was visible from the lava dome in Kawah Dua (the N crater). Weather conditions often prevented clear views of the summit. On 18 January the number of seismic signals that indicated avalanches of material began to increase. In addition, there were a total of 71 earthquakes detected during the month.
Activity continued to increase during the first week of February. Material from Main Crater traveled as far as 800 m down the Batuawang (S) and Batang (W) drainages and as far as 1 km W down the Beha (W) drainage on 4 February. On 6 February 43 earthquake events were recorded, and on 7 February, 62 events were recorded. White gas-and-steam emissions rose 25-250 m above both summit craters throughout the month. PVMBG reported an eruption began during the evening of 8 February around 1700. Photos showed incandescent material at Main Crater. Incandescent material had also descended the flank in at least two unconfirmed directions as far as 2 km from Main Crater, accompanied by ash plumes (figure 60). As a result, PVMBG increased the Volcano Alert Level (VAL) to 3 (the second highest level on a 1-4 scale).
Occasional nighttime webcam images showed three main incandescent lava flows of differing lengths traveling down the S, SW, and W flanks (figure 61). Incandescent rocks were visible on the upper flanks, possibly from ejected or collapsed material from the crater, and incandescence was the most intense at the summit. Based on analyses of satellite imagery and weather models, the Darwin VAAC reported that daily ash plumes during 16-20 February rose to 2.1-3 km altitude and drifted NNE, E, and SE. BNPB reported on 16 February that as many as 77 people were evacuated and relocated to the East Siau Museum. A webcam image taken at 2156 on 17 February possibly showed incandescent material descending the SE flank. Ash plumes rose to 2.1 km altitude and drifted SE during 22-23 February, according to the Darwin VAAC.
Incandescent avalanches of material and summit incandescence at Main Crater continued during March. White gas-and-steam emissions during March generally rose 25-150 m above the summit crater; on 31 March gas-and-steam emissions rose 200-400 m high. An ash plume rose to 2.4 km altitude and drifted S at 1710 on 9 March and a large thermal anomaly was visible in images taken at 0550 and 0930 on 10 March. Incandescent material was visible at the summit and on the flanks based on webcam images taken at 0007 and 2345 on 16 March, at 1828 on 17 March, at 1940 on 18 March, at 2311 on 19 March, and at 2351 on 20 March. Incandescence was most intense on 18 and 20 March and webcam images showed possible Strombolian explosions (figure 62). An ash plume rose to 2.4 km altitude and drifted SW on 18 March, accompanied by a thermal anomaly.
Summit crater incandescence at Main Crater and on the flanks persisted during April. Incandescent material at the S crater and on the flanks was reported at 0016 on 1 April. The lava flows had stopped by 1 April according to PVMBG, although incandescence was still visible up to 10 m high. Seismic signals indicating effusion decreased and by 6 April they were no longer detected. Incandescence was visible from both summit craters. On 26 April the VAL was lowered to 2 (the second lowest level on a 1-4 scale). White gas-and-steam emissions rose 25-200 m above the summit crater.
During May white gas-and-steam emissions generally rose 50-250 m above the summit, though it was often cloudy, which prevented clear views; on 21 May gas-and-steam emissions rose 50-400 m high. Nighttime N summit crater incandescence rose 10-25 m above the lava dome, and less intense incandescence was noted above Main Crater, which reached about 10 m above the dome. Sounds of falling rocks at Main Crater were heard on 15 May and the seismic network recorded 32 rockfall events in the crater on 17 May. Avalanches traveled as far as 1.5 km down the SW and S flanks, accompanied by rumbling sounds on 18 May. Incandescent material descending the flanks was captured in a webcam image at 2025 on 19 May (figure 63) and on 29 May; summit crater incandescence was observed in webcam images at 2332 on 26 May and at 2304 on 29 May. On 19 May the VAL was again raised to 3.
Occasional Main Crater incandescence was reported during June, as well as incandescent material on the flanks. White gas-and-steam emissions rose 10-200 m above the summit crater. Ash plumes rose to 2.1 km altitude and drifted SE and E during 2-4 June, according to the Darwin VAAC. Material on the flanks of Main Crater were observed at 2225 on 7 June, at 2051 on 9 June, at 0007 on 17 June, and at 0440 on 18 June. Webcam images taken on 21, 25, and 27 June showed incandescence at Main Crater and from material on the flanks.
MIROVA (Middle InfraRed Observation of Volcanic Activity) analysis of MODIS satellite data showed strong thermal activity during mid-February through March and mid-May through June, which represented incandescent avalanches and lava flows (figure 64). During April through mid-May the power of the anomalies decreased but frequent anomalies were still detected. Brief gaps in activity occurred during late March through early April and during mid-June. Infrared satellite images showed strong lava flows mainly affecting the SW and S flanks, accompanied by gas-and-steam emissions (figure 65). According to data recorded by the MODVOLC thermal algorithm, there were a total of 79 thermal hotspots detected: 28 during February, 24 during March, one during April, five during May, and 21 during June.
Geologic Background. Karangetang (Api Siau) volcano lies at the northern end of the island of Siau, about 125 km NNE of the NE-most point of Sulawesi. The stratovolcano contains five summit craters along a N-S line. It is one of Indonesia's most active volcanoes, with more than 40 eruptions recorded since 1675 and many additional small eruptions that were not documented (Neumann van Padang, 1951). Twentieth-century eruptions have included frequent explosive activity sometimes accompanied by pyroclastic flows and lahars. Lava dome growth has occurred in the summit craters; collapse of lava flow fronts have produced pyroclastic flows.
Information Contacts: Pusat Vulkanologi dan Mitigasi Bencana Geologi (PVMBG, also known as Indonesian Center for Volcanology and Geological Hazard Mitigation, CVGHM), Jalan Diponegoro 57, Bandung 40122, Indonesia (URL: http://www.vsi.esdm.go.id/); MAGMA Indonesia, Kementerian Energi dan Sumber Daya Mineral (URL: https://magma.esdm.go.id/v1); Badan Nasional Penanggulangan Bencana (BNPB), National Disaster Management Agency, Graha BNPB - Jl. Scout Kav.38, East Jakarta 13120, Indonesia (URL: http://www.bnpb.go.id/); Darwin Volcanic Ash Advisory Centre (VAAC), Bureau of Meteorology, Northern Territory Regional Office, PO Box 40050, Casuarina, NT 0811, Australia (URL: http://www.bom.gov.au/info/vaac/); MIROVA (Middle InfraRed Observation of Volcanic Activity), a collaborative project between the Universities of Turin and Florence (Italy) supported by the Centre for Volcanic Risk of the Italian Civil Protection Department (URL: http://www.mirovaweb.it/); Hawai'i Institute of Geophysics and Planetology (HIGP) - MODVOLC Thermal Alerts System, School of Ocean and Earth Science and Technology (SOEST), Univ. of Hawai'i, 2525 Correa Road, Honolulu, HI 96822, USA (URL: http://modis.higp.hawaii.edu/); Copernicus Browser, Copernicus Data Space Ecosystem, European Space Agency (URL: https://dataspace.copernicus.eu/browser/); IDN Times, Jl. Jend. Gatot Subroto Kav. 27 3rd Floor Kuningan, Jakarta, Indonesia 12950, Status of Karangetang Volcano in Sitaro Islands Increases (URL: https://sulsel.idntimes.com/news/indonesia/savi/status-gunung-api-karangetang-di-kepulauan-sitaro-meningkat?page=all).
Ahyi (United States) — July 2023 Cite this Report
Ahyi
United States
20.42°N, 145.03°E; summit elev. -75 m
All times are local (unless otherwise noted)
Intermittent hydroacoustic signals and discolored plumes during November 2022-June 2023
Ahyi seamount is a large, conical submarine volcano that rises to within 75 m of the ocean surface about 18 km SE of the island of Farallon de Pajaros in the Northern Marianas. The remote location of the seamount has made eruptions difficult to document, but seismic stations installed in the region confirmed an eruption in the vicinity in 2001. No new activity was detected until April-May 2014 when an eruption was detected by NOAA (National Oceanic and Atmospheric Administration) divers, hydroacoustic sensors, and seismic stations (BGVN 42:04). New activity was first detected on 15 November by hydroacoustic sensors that were consistent with submarine volcanic activity. This report covers activity during November 2022 through June 2023 based on daily and weekly reports from the US Geological Survey.
Starting in mid-October, hydroacoustic sensors at Wake Island (2.2 km E) recorded signals consistent with submarine volcanic activity, according to a report from the USGS issued on 15 November 2022. A combined analysis of the hydroacoustic signals and seismic stations located at Guam and Chichijima Island, Japan, suggested that the source of this activity was at or near the Ahyi seamount. After a re-analysis of a satellite image of the area that was captured on 6 November, USGS confirmed that there was no evidence of discoloration at the ocean surface. Few hydroacoustic and seismic signals continued through November, including on 18 November, which USGS suggested signified a decline or pause in unrest. A VONA (Volcano Observatory Notice for Aviation) reported that a discolored water plume was persistently visible in satellite data starting on 18 November (figure 6). Though clouds often obscured clear views of the volcano, another discolored water plume was captured in a satellite image on 26 November. The Aviation Color Code (ACC) was raised to Yellow (the second lowest level on a four-color scale) and the Volcano Alert Level (VAL) was raised to Advisory (the second lowest level on a four-level scale) on 29 November.
During December, occasional detections were recorded on the Wake Island hydrophone sensors and discolored water over the seamount remained visible. During 2-7, 10-12, and 16-31 December possible explosion signals were detected. A small area of discolored water was observed in high-resolution Sentinel-2 satellite images during 1-6 December (figure 7). High-resolution satellite images recorded discolored water plumes on 13 December that originated from the summit region; no observations indicated that activity breached the ocean surface. A possible underwater plume was visible in satellite images on 18 December, and during 19-20 December a definite but diffuse underwater plume located SSE from the main vent was reported. An underwater plume was visible in a satellite image taken on 26 December (figure 7).
Hydrophone sensors continued to detect signals consistent with possible explosions during 1-8 January 2023. USGS reported that the number of detections decreased during 4-5 January. The hydrophone sensors experienced a data outage that started at 0118 on 8 January and continued through 10 January, though according to USGS, possible explosions were recorded prior to the data outage and likely continued during the outage. A discolored water plume originating from the summit region was detected in a partly cloudy satellite image on 8 January. On 11-12 and 15-17 January possible explosion signals were recorded again. One small signal was detected during 22-23 January and several signals were recorded on 25 and 31 January. During 27-31 January a plume of discolored water was observed above the seamount in satellite imagery (figure 8).
Low levels of activity continued during February and March, based on data from pressure sensors on Wake Island. During 1 and 4-6 February activity was reported, and a submarine plume was observed on 4 February (figure 8). Possible explosion signals were detected during 7-8, 10, 13-14, and 24 February. During 1-2 and 3-5 March a plume of discolored water was observed in satellite imagery (figure 8). Almost continuous hydroacoustic signals were detected in remote pressure sensor data on Wake Island 2,270 km E from the volcano during 7-13 March. During 12-13 March water discoloration around the seamount was observed in satellite imagery, despite cloudy weather. By 14 March discolored water extended about 35 km, but no direction was noted. USGS reported that the continuous hydroacoustic signals detected during 13-14 March stopped abruptly on 14 March and no new detections were observed. Three 30 second hydroacoustic detections were reported during 17-19 March, but no activity was visible due to cloudy weather. A data outage was reported during 21-22 March, making pressure sensor data unavailable; a discolored water plume was, however, visible in satellite data. A possible underwater explosion signal was detected by pressure sensors at Wake Island on 26, 29, and 31 March, though the cause and origin of these events were unclear.
Similar low activity continued during April, May, and June. Several signals were detected during 1-3 April in pressure sensors at Wake Island. USGS suggested that these may be related to underwater explosions or earthquakes at the volcano, but no underwater plumes were visible in clear satellite images. The pressure sensors had data outages during 12-13 April and no data were recorded; no underwater plumes were visible in satellite images, although cloudy weather obscured most clear views. Eruptive activity was reported starting at 2210 on 21 May. On 22 May a discolored water plume that extended 4 km was visible in satellite images, though no direction was recorded. During 23-24 May some signals were detected by the underwater pressure sensors. Possible hydroacoustic signals were detected during 2-3 and 6-8 June. Multiple hydroacoustic signals were detected during 9-11 and 16-17 June, although no activity was visible in satellite images. One hydroacoustic signal was detected during 23-24 June, but there was some uncertainty about its association with volcanic activity. A single possible hydroacoustic signal was detected during 30 June to 1 July.
Geologic Background. Ahyi seamount is a large conical submarine volcano that rises to within 75 m of the ocean surface ~18 km SE of the island of Farallon de Pajaros in the northern Marianas. Water discoloration has been observed there, and in 1979 the crew of a fishing boat felt shocks over the summit area, followed by upwelling of sulfur-bearing water. On 24-25 April 2001 an explosive eruption was detected seismically by a station on Rangiroa Atoll, Tuamotu Archipelago. The event was well constrained (+/- 15 km) at a location near the southern base of Ahyi. An eruption in April-May 2014 was detected by NOAA divers, hydroacoustic sensors, and seismic stations.
Information Contacts: US Geological Survey, Volcano Hazards Program (USGS-VHP), 12201 Sunrise Valley Drive, Reston, VA, USA, https://volcanoes.usgs.gov/index.html; Copernicus Browser, Copernicus Data Space Ecosystem, European Space Agency (URL: https://dataspace.copernicus.eu/browser/).
Kadovar (Papua New Guinea) — June 2023 Cite this Report
Kadovar
Papua New Guinea
3.608°S, 144.588°E; summit elev. 365 m
All times are local (unless otherwise noted)
An ash plume and weak thermal anomaly during May 2023
Kadovar is a 2-km-wide island that is the emergent summit of a Bismarck Sea stratovolcano. It lies off the coast of New Guinea, about 25 km N of the mouth of the Sepik River. Prior to an eruption that began in 2018, a lava dome formed the high point of the volcano, filling an arcuate landslide scarp open to the S. Submarine debris-avalanche deposits occur to the S of the island. The current eruption began in January 2018 and has comprised lava effusion from vents at the summit and at the E coast; more recent activity has consisted of ash plumes, weak thermal activity, and gas-and-steam plumes (BGVN 48:02). This report covers activity during February through May 2023 using information from the Darwin Volcanic Ash Advisory Center (VAAC) and satellite data.
Activity during the reporting period was relatively low and mainly consisted of white gas-and-steam plumes that were visible in natural color satellite images on clear weather days (figure 67). According to a Darwin VAAC report, at 2040 on 6 May an ash plume rose to 4.6 km altitude and drifted W; by 2300 the plume had dissipated. MODIS satellite instruments using the MODVOLC thermal algorithm detected a single thermal hotspot on the SE side of the island on 7 May. Weak thermal activity was also detected in a satellite image on the E side of the island on 14 May, accompanied by a white gas-and-steam plume that drifted SE (figure 68).
Geologic Background. The 2-km-wide island of Kadovar is the emergent summit of a Bismarck Sea stratovolcano of Holocene age. It is part of the Schouten Islands, and lies off the coast of New Guinea, about 25 km N of the mouth of the Sepik River. Prior to an eruption that began in 2018, a lava dome formed the high point of the andesitic volcano, filling an arcuate landslide scarp open to the south; submarine debris-avalanche deposits occur in that direction. Thick lava flows with columnar jointing forms low cliffs along the coast. The youthful island lacks fringing or offshore reefs. A period of heightened thermal phenomena took place in 1976. An eruption began in January 2018 that included lava effusion from vents at the summit and at the E coast.
Information Contacts: Darwin Volcanic Ash Advisory Centre (VAAC), Bureau of Meteorology, Northern Territory Regional Office, PO Box 40050, Casuarina, NT 0811, Australia (URL: http://www.bom.gov.au/info/vaac/); Hawai'i Institute of Geophysics and Planetology (HIGP) - MODVOLC Thermal Alerts System, School of Ocean and Earth Science and Technology (SOEST), Univ. of Hawai'i, 2525 Correa Road, Honolulu, HI 96822, USA (URL: http://modis.higp.hawaii.edu/); Copernicus Browser, Copernicus Data Space Ecosystem, European Space Agency (URL: https://dataspace.copernicus.eu/browser/).
San Miguel (El Salvador) — June 2023 Cite this Report
San Miguel
El Salvador
13.434°N, 88.269°W; summit elev. 2130 m
All times are local (unless otherwise noted)
Small gas-and-ash explosions during March and May 2023
San Miguel in El Salvador is a broad, deep crater complex that has been frequently modified by eruptions recorded since the early 16th century and consists of the summit known locally as Chaparrastique. Flank eruptions have produced lava flows that extended to the N, NE, and SE during the 17-19th centuries. The most recent activity has consisted of minor ash eruptions from the summit crater. The current eruption period began in November 2022 and has been characterized by frequent phreatic explosions, gas-and-ash emissions, and sulfur dioxide plumes (BGVN 47:12). This report describes small gas-and-ash explosions during December 2022 through May 2023 based on special reports from the Ministero de Medio Ambiente y Recursos Naturales (MARN).
Activity has been relatively low since the last recorded explosions on 29 November 2022. Seismicity recorded by the San Miguel Volcano Station (VSM) located on the N flank at 1.7 km elevation had decreased by 7 December. Sulfur dioxide gas measurements taken with DOAS (Differential Optical Absorption Spectroscopy) mobile equipment were below typical previously recorded values: 300 tons per day (t/d). During December, small explosions were recorded by the seismic network and manifested as gas-and-steam emissions.
Gas-and-ash explosions in the crater occurred during January 2023, which were recorded by the seismic network. Sulfur dioxide values remained low, between 300-400 t/d through 10 March. At 0817 on 14 January a gas-and-ash emission was visible in webcam images, rising just above the crater rim. Some mornings during February, small gas-and-steam plumes were visible in the crater. On 7 March at 2252 MARN noted an increase in degassing from the central crater; gas emissions were constantly observed through the early morning hours on 8 March. During the early morning of 8 March through the afternoon on 9 March, 12 emissions were registered, some accompanied by ash. The last gas-and-ash emission was recorded at 1210 on 9 March; very fine ashfall was reported in El Tránsito (10 km S), La Morita (6 km W), and La Piedrita (3 km W). The smell of sulfur was reported in Piedra Azul (5 km SW). On 16 March MARN reported that gas-and-steam emissions decreased.
Low degassing and very low seismicity were reported during April; no explosions have been detected between 9 March and 27 May. The sulfur dioxide emissions remained between 350-400 t/d; during 13-20 April sulfur dioxide values fluctuated between 30-300 t/d. Activity remained low through most of May; on 23 May seismicity increased. An explosion was detected at 1647 on 27 May generated a gas-and-ash plume that rose 700 m high (figure 32); a decrease in seismicity and gas emissions followed. The DOAS station installed on the W flank recorded sulfur dioxide values that reached 400 t/d on 27 May; subsequent measurements showed a decrease to 268 t/d on 28 May and 100 t/d on 29 May.
Geologic Background. The symmetrical cone of San Miguel, one of the most active volcanoes in El Salvador, rises from near sea level to form one of the country's most prominent landmarks. A broad, deep, crater complex that has been frequently modified by eruptions recorded since the early 16th century caps the truncated unvegetated summit, also known locally as Chaparrastique. Flanks eruptions of the basaltic-andesitic volcano have produced many lava flows, including several during the 17th-19th centuries that extended to the N, NE, and SE. The SE-flank flows are the largest and form broad, sparsely vegetated lava fields crossed by highways and a railroad skirting the base of the volcano. Flank vent locations have migrated higher on the edifice during historical time, and the most recent activity has consisted of minor ash eruptions from the summit crater.
Information Contacts: Ministero de Medio Ambiente y Recursos Naturales (MARN), Km. 5½ Carretera a Nueva San Salvador, Avenida las Mercedes, San Salvador, El Salvador (URL: http://www.snet.gob.sv/ver/vulcanologia).
Semisopochnoi (United States) — June 2023 Cite this Report
Semisopochnoi
United States
51.93°N, 179.58°E; summit elev. 1221 m
All times are local (unless otherwise noted)
Occasional explosions, ash deposits, and gas-and-steam plumes during December 2022-May 2023
Semisopochnoi is located in the western Aleutians, is 20-km-wide at sea level, and contains an 8-km-wide caldera. The three-peaked Mount Young (formerly Cerberus) was constructed within the caldera during the Holocene. Each of these peaks contains a summit crater; the lava flows on the N flank appear younger than those on the S side. The current eruption period began in early February 2021 and has more recently consisted of intermittent explosions and ash emissions (BGVN 47:12). This report updates activity during December 2022 through May 2023 using daily, weekly, and special reports from the Alaska Volcano Observatory (AVO). AVO monitors the volcano using local seismic and infrasound sensors, satellite data, web cameras, and remote infrasound and lightning networks.
Activity during most of December 2022 was relatively quiet; according to AVO no eruptive or explosive activity was observed since 7 November 2022. Intermittent tremor and occasional small earthquakes were observed in geophysical data. Continuous gas-and-steam emissions were observed from the N crater of Mount Young in webcam images on clear weather days (figure 25). On 24 December, there was a slight increase in earthquake activity and several small possible explosion signals were detected in infrasound data. Eruptive activity resumed on 27 December at the N crater of Mount Young; AVO issued a Volcano Activity Notice (VAN) that reported minor ash deposits on the flanks of Mount Young that extended as far as 1 km from the vent, according to webcam images taken during 27-28 December (figure 26). No ash plumes were observed in webcam or satellite imagery, but a persistent gas-and-steam plume that might have contained some ash rose to 1.5 km altitude. As a result, AVO raised the Aviation Color Code (ACC) to Orange (the second highest level on a four-color scale) and the Volcano Alert Level (VAL) to Watch (the second highest level on a four-level scale). Possible explosions were detected during 21 December 2022 through 1 January 2023 and seismic tremor was recorded during 30-31 December.
During January 2023 eruptive activity continued at the active N crater of Mount Young. Minor ash deposits were observed on the flanks, extending about 2 km SSW, based on webcam images from 1 and 3 January. A possible explosion occurred during 1-2 January based on elevated seismicity recorded on local seismometers and an infrasound signal recorded minutes later by an array at Adak. Though no ash plumes were observed in webcam or satellite imagery, a persistent gas-and-steam plume rose to 1.5 km altitude that might have carried minor traces of ash. Ash deposits were accompanied by periods of elevated seismicity and infrasound signals from the local geophysical network, which AVO reported were likely due to weak explosive activity. Low-level explosive activity was also detected during 2-3 January, with minor gas-and-steam emissions and a new ash deposit that was visible in webcam images. Low-level explosive activity was detected in geophysical data during 4-5 January, with elevated seismicity and infrasound signals observed on local stations. Volcanic tremor was detected during 7-9 January and very weak explosive activity was detected in seismic and infrasound data on 9 January. Weak seismic and infrasound signals were recorded on 17 January, which indicated minor explosive activity, but no ash emissions were observed in clear webcam images; a gas-and-steam plume continued to rise to 1.5 km altitude. During 29-30 January, ash deposits near the summit were observed on fresh snow, according to webcam images.
The active N cone at Mount Young continued to produce a gas-and-steam plume during February, but no ash emissions or explosive events were detected. Seismicity remained elevated with faint tremor during early February. Gas-and-steam emissions from the N crater were observed in clear webcam images on 11-13 and 16 February; no explosive activity was detected in seismic, infrasound, or satellite data. Seismicity has also decreased, with no significant seismic tremor observed since 25 January. Therefore, the ACC was lowered to Yellow (the second lowest level on a four-color scale) and the VAL was lowered to Advisory (the second lowest level on a four-color scale) on 22 February.
Gas-and-steam emissions persisted during March from the N cone of Mount Young, based on clear webcam images. A few brief episodes of weak tremor were detected in seismic data, although seismicity decreased over the month. A gas-and-steam plume detected in satellite data extended 150 km on 18 March. Low-level ash emissions from the N cone at Mount Young were observed in several webcam images during 18-19 March, in addition to small explosions and volcanic tremor. The ACC was raised to Orange and the VAL increased to Watch on 19 March. A small explosion was detected in seismic and infrasound data on 21 March.
Low-level unrest continued during April, although cloudy weather often obscured views of the summit; periods of seismic tremor and local earthquakes were recorded. During 3-4 April a gas-and-steam plume was visible traveling more than 200 km overnight; no ash was evident in the plume, according to AVO. A gas-and-steam plume was observed during 4-6 April that extended 400 km but did not seem to contain ash. Small explosions were detected in seismic and infrasound data on 5 April. Occasional clear webcam images showed continuing gas-and-steam emissions rose from Mount Young, but no ash deposits were observed on the snow. On 19 April small explosions and tremor were detected in seismic and infrasound data. A period of seismic tremor was detected during 22-25 April, with possible weak explosions on 25 April. Ash deposits were visible near the crater rim, but it was unclear if these deposits were recent or due to older deposits.
Occasional small earthquakes were recorded during May, but there were no signs of explosive activity seen in geophysical data. Gas-and-steam emissions continued from the N crater of Mount Young, based on webcam images, and seismicity remained slightly elevated. A new, light ash deposit was visible during the morning of 5 May on fresh snow on the NW flank of Mount Young. During 10 May periods of volcanic tremor were observed. The ACC was lowered to Yellow and the VAL to Advisory on 17 May due to no additional evidence of activity.
Geologic Background. Semisopochnoi, the largest subaerial volcano of the western Aleutians, is 20 km wide at sea level and contains an 8-km-wide caldera. It formed as a result of collapse of a low-angle, dominantly basaltic volcano following the eruption of a large volume of dacitic pumice. The high point of the island is Anvil Peak, a double-peaked late-Pleistocene cone that forms much of the island's northern part. The three-peaked Mount Cerberus (renamed Mount Young in 2023) was constructed within the caldera during the Holocene. Each of the peaks contains a summit crater; lava flows on the N flank appear younger than those on the south side. Other post-caldera volcanoes include the symmetrical Sugarloaf Peak SSE of the caldera and Lakeshore Cone, a small cinder cone at the edge of Fenner Lake in the NE part of the caldera. Most documented eruptions have originated from Young, although Coats (1950) considered that both Sugarloaf and Lakeshore Cone could have been recently active.
Information Contacts: Alaska Volcano Observatory (AVO), a cooperative program of a) U.S. Geological Survey, 4200 University Drive, Anchorage, AK 99508-4667 USA (URL: https://avo.alaska.edu/), b) Geophysical Institute, University of Alaska, PO Box 757320, Fairbanks, AK 99775-7320, USA, and c) Alaska Division of Geological & Geophysical Surveys, 794 University Ave., Suite 200, Fairbanks, AK 99709, USA (URL: http://dggs.alaska.gov/).
Ebeko
Russia
50.686°N, 156.014°E; summit elev. 1103 m
All times are local (unless otherwise noted)
Continued explosions, ash plumes, and ashfall during October 2022-May 2023
Ebeko, located on the N end of Paramushir Island in the Kuril Islands, consists of three summit craters along a SSW-NNE line at the northern end of a complex of five volcanic cones. Eruptions date back to the late 18th century and have been characterized as small-to-moderate explosions from the summit crater, accompanied by intense fumarolic activity. The current eruption period began in June 2022 and has recently consisted of frequent explosions, ash plumes, and thermal activity (BGVN 47:10). This report covers similar activity during October 2022 through May 2023, based on information from the Kamchatka Volcanic Eruptions Response Team (KVERT) and satellite data.
Activity during October consisted of explosive activity, ash plumes, and occasional thermal anomalies. Visual data by volcanologists from Severo-Kurilsk showed explosions producing ash clouds up to 2.1-3 km altitude which drifted E, N, NE, and SE during 1-8, 10, 16, and 18 October. KVERT issued several Volcano Observatory Notices for Aviation (VONA) on 7, 13-15, and 27 October 2022, stating that explosions generated ash plumes that rose to 2.3-4 km altitude and drifted 5 km E, NE, and SE. Ashfall was reported in Severo-Kurilsk (Paramushir Island, about 7 km E) on 7 and 13 October. Satellite data showed a thermal anomaly over the volcano on 15-16 October. Visual data showed ash plumes rising to 2.5-3.6 km altitude on 22, 25-29, and 31 October and moving NE due to constant explosions.
Similar activity continued during November, with explosions, ash plumes, and ashfall occurring. KVERT issued VONAs on 1-2, 4, 6-7, 9, 13, and 16 November that reported explosions and resulting ash plumes that rose to 1.7-3.6 km altitude and drifted 3-5 km SE, ESE, E, and NE. On 1 November ash plumes extended as far as 110 km SE. On 5, 8, 12, and 24-25 November explosions and ash plumes rose to 2-3.1 km altitude and drifted N and E. Ashfall was observed in Severo-Kurilsk on 7 and 16 November. A thermal anomaly was visible during 1-4, 16, and 20 November. Explosions during 26 November rose as high as 2.7 km altitude and drifted NE (figure 45).
Explosions and ash plumes continued to occur in December. During 1-2 and 4 December volcanologists from Severo-Kurilsk observed explosions that sent ash to 1.9-2.5 km altitude and drifted NE and SE (figure 46). VONAs were issued on 5, 9, and 16 December reporting that explosions generated ash plumes rising to 1.9 km, 2.6 km, and 2.4 km altitude and drifted 5 km SE, E, and NE, respectively. A thermal anomaly was visible in satellite imagery on 16 December. On 18 and 27-28 December explosions produced ash plumes that rose to 2.5 km altitude and drifted NE and SE. On 31 December an ash plume rose to 2 km altitude and drifted NE.
Explosions continued during January 2023, based on visual observations by volcanologists from Severo-Kurilsk. During 1-7 January explosions generated ash plumes that rose to 4 km altitude and drifted NE, E, W, and SE. According to VONAs issued by KVERT on 2, 4, 10, and 23 January, explosions produced ash plumes that rose to 2-4 km altitude and drifted 5 km N, NE, E, and ENE; the ash plume that rose to 4 km altitude occurred on 10 January (figure 47). Satellite data showed a thermal anomaly during 3-4, 10, 13, 16, 21, 22, and 31 January. KVERT reported that an ash cloud on 4 January moved 12 km NE. On 6 and 9-11 January explosions sent ash plumes to 4.5 km altitude and drifted W and ESE. On 13 January an ash plume rose to 3 km altitude and drifted SE. During 20-24 January ash plumes from explosions rose to 3.7 km altitude and drifted SE, N, and NE. On 21 January the ash plume drifted as far as 40 km NE. During 28-29 and 31 January and 1 February ash plumes rose to 4 km altitude and drifted NE.
During February, explosions, ash plumes, and ashfall were reported. During 1, 4-5 and 7-8 February explosions generated ash plumes that rose to 4.5 km altitude and drifted E and NE; ashfall was observed on 5 and 8 February. On 6 February an explosion produced an ash plume that rose to 3 km altitude and drifted 7 km E, causing ashfall in Severo-Kurilsk. A thermal anomaly was visible in satellite data on 8, 9, 13, and 21 February. Explosions on 9 and 12-13 February produced ash plumes that rose to 4 km altitude and drifted E and NE; the ash cloud on 12 February extended as far as 45 km E. On 22 February explosions sent ash to 3 km altitude that drifted E. During 24 and 26-27 February ash plumes rose to 4 km altitude and drifted E. On 28 February an explosion sent ash to 2.5-3 km altitude and drifted 5 km E; ashfall was observed in Severo-Kurilsk.
Activity continued during March; visual observations showed that explosions generated ash plumes that rose to 3.6 km altitude on 3, 5-7, and 9-12 March and drifted E, NE, and NW. Thermal anomalies were visible on 10, 13, and 29-30 March in satellite imagery. On 18, 21-23, 26, and 29-30 March explosions produced ash plumes that rose to 2.8 km altitude and drifted NE and E; the ash plumes during 22-23 March extended up to 76 km E. A VONA issued on 21 March reported an explosion that produced an ash plume that rose to 2.8 km altitude and drifted 5 km E. Another VONA issued on 23 March reported that satellite data showed an ash plume rising to 3 km altitude and drifted 14 km E.
Explosions during April continued to generate ash plumes. On 1 and 4 April an ash plume rose to 2.8-3.5 km altitude and drifted SE and NE. A thermal anomaly was visible in satellite imagery during 1-6 April. Satellite data showed ash plumes and clouds rising to 2-3 km altitude and drifting up to 12 km SW and E on 3 and 6 April (figure 48). KVERT issued VONAs on 3, 5, 14, 16 April describing explosions that produced ash plumes rising to 3 km, 3.5 km, 3.5 km, and 3 km altitude and drifting 5 km S, 5 km NE and SE, 72 km NNE, and 5 km NE, respectively. According to satellite data, the resulting ash cloud from the explosion on 14 April was 25 x 7 km in size and drifted 72-104 km NNE during 14-15 April. According to visual data by volcanologists from Severo-Kurilsk explosions sent ash up to 3.5 km altitude that drifted NE and E during 15-16, 22, 25-26, and 29 April.
The explosive eruption continued during May. Explosions during 3-4, 6-7, and 9-10 May generated ash plumes that rose to 4 km altitude and drifted SW and E. Satellite data showed a thermal anomaly on 3, 9, 13-14, and 24 May. During 12-16, 23-25, and 27-28 May ash plumes rose to 3.5 km altitude and drifted in different directions due to explosions. Two VONA notices were issued on 16 and 25 May, describing explosions that generated ash plumes rising to 3 km and 3.5 km altitude, respectively and extending 5 km E. The ash cloud on 25 May drifted 75 km SE.
Thermal activity in the summit crater, occasionally accompanied by ash plumes and ash deposits on the SE and E flanks due to frequent explosions, were visible in infrared and true color satellite images (figure 49).
Geologic Background. The flat-topped summit of the central cone of Ebeko volcano, one of the most active in the Kuril Islands, occupies the northern end of Paramushir Island. Three summit craters located along a SSW-NNE line form Ebeko volcano proper, at the northern end of a complex of five volcanic cones. Blocky lava flows extend west from Ebeko and SE from the neighboring Nezametnyi cone. The eastern part of the southern crater contains strong solfataras and a large boiling spring. The central crater is filled by a lake about 20 m deep whose shores are lined with steaming solfataras; the northern crater lies across a narrow, low barrier from the central crater and contains a small, cold crescentic lake. Historical activity, recorded since the late-18th century, has been restricted to small-to-moderate explosive eruptions from the summit craters. Intense fumarolic activity occurs in the summit craters, on the outer flanks of the cone, and in lateral explosion craters.
Information Contacts: Kamchatka Volcanic Eruptions Response Team (KVERT), Far Eastern Branch, Russian Academy of Sciences, 9 Piip Blvd., Petropavlovsk-Kamchatsky, 683006, Russia (URL: http://www.kscnet.ru/ivs/kvert/); MIROVA (Middle InfraRed Observation of Volcanic Activity), a collaborative project between the Universities of Turin and Florence (Italy) supported by the Centre for Volcanic Risk of the Italian Civil Protection Department (URL: http://www.mirovaweb.it/); Copernicus Browser, Copernicus Data Space Ecosystem, European Space Agency (URL: https://dataspace.copernicus.eu/browser/).
Home Reef
Tonga
18.992°S, 174.775°W; summit elev. -10 m
All times are local (unless otherwise noted)
Discolored plumes continued during November 2022-April 2023
Home Reef is a submarine volcano located in the central Tonga islands between Lateiki (Metis Shoal) and Late Island. The first recorded eruption occurred in the mid-19th century, when an ephemeral island formed. An eruption in 1984 produced a 12-km-high eruption plume, a large volume of floating pumice, and an ephemeral island 500 x 1,500 m wide, with cliffs 30-50 m high that enclosed a water-filled crater. Another island-forming eruption in 2006 produced widespread pumice rafts that drifted as far as Australia; by 2008 the island had eroded below sea level. The previous eruption occurred during October 2022 and was characterized by a new island-forming eruption, lava effusion, ash plumes, discolored water, and gas-and-steam plumes (BGVN 47:11). This report covers discolored water plumes during November 2022 through April 2023 using satellite data.
Discolored plumes continued during the reporting period and were observed in true color satellite images on clear weather days. Satellite images show light green-yellow discolored water extending W on 8 and 28 November 2022 (figure 31), and SW on 18 November. Light green-yellow plumes extended W on 3 December, S on 13 December, SW on 18 December, and W and S on 23 December (figure 31). On 12 January 2023 discolored green-yellow plumes extended to the NE, E, SE, and N. The plume moved SE on 17 January and NW on 22 January. Faint discolored water in February was visible moving NE on 1 February. A discolored plume extended NW on 8 and 28 March and NW on 13 March (figure 31). During April, clear weather showed green-blue discolored plumes moving S on 2 April, W on 7 April, and NE and S on 12 April. A strong green-yellow discolored plume extended E and NE on 22 April for several kilometers (figure 31).
Geologic Background. Home Reef, a submarine volcano midway between Metis Shoal and Late Island in the central Tonga islands, was first reported active in the mid-19th century, when an ephemeral island formed. An eruption in 1984 produced a 12-km-high eruption plume, large amounts of floating pumice, and an ephemeral 500 x 1,500 m island, with cliffs 30-50 m high that enclosed a water-filled crater. In 2006 an island-forming eruption produced widespread dacitic pumice rafts that drifted as far as Australia. Another island was built during a September-October 2022 eruption.
Information Contacts: Copernicus Browser, Copernicus Data Space Ecosystem, European Space Agency (URL: https://dataspace.copernicus.eu/browser/).
Ambae
Vanuatu
15.389°S, 167.835°E; summit elev. 1496 m
All times are local (unless otherwise noted)
New lava flow, ash plumes, and sulfur dioxide plumes during February-May 2023
Ambae, also known as Aoba, is a large basaltic shield volcano in Vanuatu. A broad pyroclastic cone containing three crater lakes (Manaro Ngoru, Voui, and Manaro Lakua) is located at the summit within the youngest of at least two nested calderas. Periodic phreatic and pyroclastic explosions have been reported since the 16th century. A large eruption more than 400 years ago resulted in a volcanic cone within the summit crater that is now filled by Lake Voui; the similarly sized Lake Manaro fills the western third of the caldera. The previous eruption ended in August 2022 that was characterized by gas-and-steam and ash emissions and explosions of wet tephra (BGVN 47:10). This report covers a new eruption during February through May 2023 that consisted of a new lava flow, ash plumes, and sulfur dioxide emissions, using information from the Vanuatu Meteorology and Geo-Hazards Department (VMGD) and satellite data.
During the reporting period, the Alert Level remained at a 2 (on a scale of 0-5), which has been in place since December 2021. Activity during October 2022 through March 2023 remained relatively low and mostly consisted of gas-and-steam emissions in Lake Voui. VMGD reported that at 1300 on 15 November a satellite image captured a strong amount of sulfur dioxide rising above the volcano (figure 99), and that seismicity slightly increased. The southern and northern part of the island reported a strong sulfur dioxide smell and heard explosions. On 20 February 2023 a gas-and-ash plume rose 1.3 km above the summit and drifted SSW, according to a webcam image (figure 100). Gas-and-steam and possibly ash emissions continued on 23 February and volcanic earthquakes were recorded by the seismic network.
During April, volcanic earthquakes and gas-and-steam and ash emissions were reported from the cone in Lake Voui. VMGD reported that activity increased during 5-7 April; high gas-and-steam and ash plumes were visible, accompanied by nighttime incandescence. According to a Wellington VAAC report, a low-level ash plume rose as high as 2.5 km above the summit and drifted W and SW on 5 April, based on satellite imagery. Reports in Saratamata stated that a dark ash plume drifted to the WSW, but no loud explosion was heard. Webcam images from 2100 showed incandescence above the crater and reflected in the clouds. According to an aerial survey, field observations, and satellite data, water was no longer present in the lake. A lava flow was reported effusing from the vent and traveling N into the dry Lake Voui, which lasted three days. The next morning at 0745 on 6 April a gas-and-steam and ash plume rose 5.4 km above the summit and drifted ESE, based on information from VMGD (figure 101). The Wellington VAAC also reported that light ashfall was observed on the island. Intermittent gas-and-steam and ash emissions were visible on 7 April, some of which rose to an estimated 3 km above the summit and drifted E. Webcam images during 0107-0730 on 7 April showed continuing ash emissions. A gas-and-steam and ash plume rose 695 m above the summit crater at 0730 on 19 April and drifted ESE, based on a webcam image (figure 102).
According to visual and infrared satellite data, water was visible in Lake Voui as late as 24 March 2023 (figure 103). The vent in the caldera showed a gas-and-steam plume drifted SE. On 3 April thermal activity was first detected, accompanied by a gas-and-ash plume that drifted W (figure 103). The lava flow moved N within the dry lake and was shown cooling by 8 April. By 23 April much of the water in the lake had returned. Occasional sulfur dioxide plumes were detected by the TROPOMI instrument on the Sentinel-5P satellite that exceeded 2 Dobson Units (DU) and drifted in different directions (figure 104).
Geologic Background. The island of Ambae, also known as Aoba, is a massive 2,500 km3 basaltic shield that is the most voluminous volcano of the New Hebrides archipelago. A pronounced NE-SW-trending rift zone with numerous scoria cones gives the 16 x 38 km island an elongated form. A broad pyroclastic cone containing three crater lakes (Manaro Ngoru, Voui, and Manaro Lakua) is located at the summit within the youngest of at least two nested calderas, the largest of which is 6 km in diameter. That large central edifice is also called Manaro Voui or Lombenben volcano. Post-caldera explosive eruptions formed the summit craters about 360 years ago. A tuff cone was constructed within Lake Voui (or Vui) about 60 years later. The latest known flank eruption, about 300 years ago, destroyed the population of the Nduindui area near the western coast.
Information Contacts: Geo-Hazards Division, Vanuatu Meteorology and Geo-Hazards Department (VMGD), Ministry of Climate Change Adaptation, Meteorology, Geo-Hazards, Energy, Environment and Disaster Management, Private Mail Bag 9054, Lini Highway, Port Vila, Vanuatu (URL: http://www.vmgd.gov.vu/, https://www.facebook.com/VanuatuGeohazardsObservatory/); Wellington Volcanic Ash Advisory Centre (VAAC), Meteorological Service of New Zealand Ltd (MetService), PO Box 722, Wellington, New Zealand (URL: http://www.metservice.com/vaac/, http://www.ssd.noaa.gov/VAAC/OTH/NZ/messages.html); MIROVA (Middle InfraRed Observation of Volcanic Activity), a collaborative project between the Universities of Turin and Florence (Italy) supported by the Centre for Volcanic Risk of the Italian Civil Protection Department (URL: http://www.mirovaweb.it/); Global Sulfur Dioxide Monitoring Page, Atmospheric Chemistry and Dynamics Laboratory, NASA Goddard Space Flight Center (NASA/GSFC), 8800 Greenbelt Road, Goddard, Maryland, USA (URL: https://so2.gsfc.nasa.gov/); Copernicus Browser, Copernicus Data Space Ecosystem, European Space Agency (URL: https://dataspace.copernicus.eu/browser/).
Search Bulletin Archive by Publication Date
Select a month and year from the drop-downs and click "Show Issue" to have that issue displayed in this tab.
The default month and year is the latest issue available.
Bulletin of the Global Volcanism Network - Volume 32, Number 12 (December 2007)
Managing Editor: Richard Wunderman
Anatahan (United States)
During 2007-8 the crater lake dries up, continuing ash clouds
Bezymianny (Russia)
Correction to plume description in November 2007
Chichon, El (Mexico)
Stable with tremor; hot spring; significant crater-lake-volume variations
Fournaise, Piton de la (France)
Caldera collapse in April 2007; large E-flank lava flows
Fuego (Guatemala)
Moderate Strombolian eruptions, including pyroclastic flows, continue into early 2008
Guagua Pichincha (Ecuador)
Seven moderate phreatic eruptions on 1 February 2008
Poas (Costa Rica)
Small phreatic eruption from crater lake on 13 January 2008
Tara, Batu (Indonesia)
Thermal anomalies beginning January 2007; ash plumes during March-October
Anatahan (United States) — December 2007 Cite this Report
Anatahan
United States
16.35°N, 145.67°E; summit elev. 790 m
All times are local (unless otherwise noted)
During 2007-8 the crater lake dries up, continuing ash clouds
During mid 2007 and into early February 2008, Anatahan (figure 30) discharged occasional significant plumes, as restless seismicity associated with intermittent eruptions continued. Key source data for this report came from the U.S. Geological Survey (USGS), the Emergency Management Office of the Commonwealth of the Northern Mariana Islands (EMO), NASA Earth Observatory, and the Washington Volcanic Ash Advisory Center (VAAC).
The same day MODIS acquired this image, the U.S. Air Force Weather Agency reported an odor of sulfur on the island of Guam, ~ 200 km SW of Saipan, which also suggests the presence of vog. USGS and EMO air quality instruments on Saipan recorded a maximum 5-minute average of 959 ppb sulfur dioxide (SO2) and 99 ppb hydrogen sulfide (H2S) on 18 March. Although such plumes can cause closure of the Saipan airport and result in health risks to Saipan residents, such problems were not mentioned in reports of this incident.
Crater lake disappears. Seismicity remained restless and intermittent plumes continued to discharge from Anatahan during late 2007 and into 2008. By 31 January 2008 the crater lake had disappeared.
Distinct increases in amplitude of seismic tremors occurred on 26 and 28 November 2007. Explosions were also observed, with rates peaking on 28 November at several per minute. This increase prompted raising the alert level to Yellow/Advisory on 29 November.
On 14 December 2007 the Washington Volcanic Ash Advisory Center (VAAC) reported a steam plume visible in satellite data, but no indication of ash. There was a small surge in seismic activity recorded on 16 December that decreased to previous levels by the following day. According to the U.S. Air Force Weather Agency, a plume on 30 December consisted primarily of steam and gas, with little ash content. Seismic tremor levels increased 16 January 2008 and persisted.
On 31 January 2008, satellite data showed that the lake in the E crater, a water body whose level had been dropping since September 2007, had disappeared. According to the USGS, the tremor indicated that the volcano may have entered a new phase within its current episode of unrest, and the disappearance of the lake suggested that the magmatic heat source may have moved closer to the surface.
Ash emissions occurred at Anatahan on 3 February 2008. Satellite images showed a diffuse ash plume extending W for ~ 100 km. It was not possible to determine precisely the altitude of this ash plume from the currently available data, but it was likely less than 1,500 m. On 5 February, the USGS reported persistent elevated seismic tremor and continued detection of SO2 in satellite data. The USGS changed the Aviation Color Code to Orange and the Alert Level to Watch as a result of the ash emissions.
A satellite image (figure 31) shows the volcanic island on 6 February 2008. Dwarfed by clouds overhead, the island released a faint plume (presumably bearing little if any ash) blowing WNW. Data from the satellite-based Ozone Monitoring Instrument (OMI) showed a low-level SO2 plume extending W to SW from the volcano.
No thermal anomalies have been measured by MODIS satellites over Anataham since June 2006. In a recent publication, Hilton and others (2007) reported on newly derived SO2 emission rates for Anatahan.
Reference. Hilton, D. R., Fischer, T. P., McGonigle, A. J. S., and de Moor, J. M., 2007, Variable SO2 emission rates for Anatahan volcano, the Commonwealth of the Northern Mariana Islands: Implications for deriving arc-wide volatile fluxes from erupting volcanoes: Geophysical Research Letters, v. 34, p. L14315, doi:10.1029/2007GL030405.
Geologic Background. The elongate, 9-km-long island of Anatahan in the central Mariana Islands consists of a large stratovolcano with a 2.3 x 5 km compound summit caldera. The larger western portion of the caldera is 2.3 x 3 km wide, and its western rim forms the island's high point. Ponded lava flows overlain by pyroclastic deposits fill the floor of the western caldera, whose SW side is cut by a fresh-looking smaller crater. The 2-km-wide eastern portion of the caldera contained a steep-walled inner crater whose floor prior to the 2003 eruption was only 68 m above sea level. A submarine cone, named NE Anatahan, rises to within 460 m of the sea surface on the NE flank, and numerous other submarine vents are found on the NE-to-SE flanks. Sparseness of vegetation on the most recent lava flows had indicated that they were of Holocene age, but the first historical eruption did not occur until May 2003, when a large explosive eruption took place forming a new crater inside the eastern caldera.
Information Contacts: Emergency Management Office of the Commonwealth of the Northern Mariana Islands (EMO-CNMI) and USGS Hawaii Volcano Observatory, PO Box 100007, Saipan, MP 96950, USA (URL: http://www.cnmihsem.gov.mp/ and https://volcanoes.usgs.gov/nmi/activity/); U.S. Air Force Weather Agency (AFWA)/XOGM, Offutt Air Force Base, NE 68113, USA; NASA Earth Observatory (URL: http://earthobservatory.nasa.gov/); Washington Volcanic Ash Advisory Center (VAAC), Satellite Analysis Branch (SAB), NOAA/NESDIS E/SP23, NOAA Science Center Room 401, 5200 Auth Road, Camp Springs, MD 20746, USA (URL: http://www.ospo.noaa.gov/Products/atmosphere/vaac/); Google Earth (URL: http://earth.google.com/).
Bezymianny (Russia) — December 2007 Cite this Report
Bezymianny
Russia
55.972°N, 160.595°E; summit elev. 2882 m
All times are local (unless otherwise noted)
Correction to plume description in November 2007
In BGVN 32:11, we erroneously reported a cloud height of 35 km from Bezymianny on 10 November 2007. The plume on that day was a steam plume that extended ~35 km downwind.
Reference. Cergey Ushakov, Kamchatkan and Northern Kuriles Volcanic Activity, KVERT INFORMATION RELEASE 57-07, Saturday, November 10, 2007, 03:30 UTC (15:30 KDT).
Geologic Background. The modern Bezymianny, much smaller than its massive neighbors Kamen and Kliuchevskoi on the Kamchatka Peninsula, was formed about 4,700 years ago over a late-Pleistocene lava-dome complex and an edifice built about 11,000-7,000 years ago. Three periods of intensified activity have occurred during the past 3,000 years. The latest period, which was preceded by a 1,000-year quiescence, began with the dramatic 1955-56 eruption. This eruption, similar to that of St. Helens in 1980, produced a large open crater that was formed by collapse of the summit and an associated lateral blast. Subsequent episodic but ongoing lava-dome growth, accompanied by intermittent explosive activity and pyroclastic flows, has largely filled the 1956 crater.
Information Contacts:
El Chichon (Mexico) — December 2007 Cite this Report
El Chichon
Mexico
17.3602°N, 93.2297°W; summit elev. 1150 m
All times are local (unless otherwise noted)
Stable with tremor; hot spring; significant crater-lake-volume variations
On 4 November 2007, at midnight, a landslide along the Grijalva river buried a settlement (Juan de Grijalva, Municipio de Ostuacán, Chiapas) located ~ 25 km WSW from the 1982 crater. The event, the subject of a report in the newspaper La Jornada, was reported to have buried 40-60 dwellings and killed at least 10, but more likely 200-300 residents.
Concern arose as to whether the event was triggered by El Chichón volcano. The scientists authoring this report, which included those from the Instituto de Geofísica of the Universidad Nacional Autónoma de México (UNAM), noted that low-frequency rumbling (presumably tremor) can clearly be felt inside the active crater. They associated these perturbations with the hydrothermal system.
The authors considered the perturbations too small to cause the distant landslide. According to the authors, the landslide at the Grijalva river was probably the result of morphological instability after heavy rainfall, rather than associated with El Chichón behavior.
However, in the aftermath of the 1982 eruption, El Chichón's nearby flanks still contain abundant unstable slopes, and the new vegetation fails to keep up with the erosion rate. Also, intracrater avalanches still occur, particularly after heavy rainfall. According to co-author Dmitri Rouwet, the rumbling beneath the crater often triggers small intracrater avalanches.
El Chichón was the scene of large Plinian eruptions in 1982, and the crater hosts a shallow crater lake that has drastically varied in size since January 2001. Figure 8 shows the lake in 2005, the smallest volume at this crater lake yet observed. In March 2007 (figure 9) the lake contained the largest volume yet observed (~ 6 x 10⁵ m3).
Boiling springs.The changes in lake volume stem largely from variable discharges at a boiling spring, rather than merely reflecting direct input from rainfall and evaporation.
During 2001, 2004 and 2007 a large-volume lake was associated with a high discharge (over 10 kg/s) into the lake. Saline, near-neutral pH water pours from a boiling geyser-like spring on the lake's N coast. This took place in months such as January, only a few months after the end of the June-October rainy season. The salinity was greater when the lake had higher volume. This observation implies that the direct input of rainwater is not a major contributor to lake volume. Instead, rainwater is thought to infiltrate into the crater floor and then discharge into the lake through the boiling springs.
These springs alternate between periods of high- and low-water discharge feeding the lake. The periods of high discharge at the springs correspond to periods when the lake grows. The periods of low discharge at the springs correspond to vapor discharge there, intervals when the lake shrinks.
In general, ongoing measurements suggest decreasing concentrations for the boiling spring and crater lake waters with time. This suggest an absence of new magmatic input since 1982. After the 2007 rainy season the lake volume decreased, coinciding with a change to pure vapor emission from the geyser-like spring since August 2007 (figure 10).
Tremor, gas fluxes, inferences, and ongoing monitoring.The authors of this report inferred that the low-frequency tremor and rumbling beneath the crater floor stemmed from fluid migrations inside the boiling aquifer, sometimes causing small intra-aquifer phreatic explosions. Nevertheless, crater floor inspection during December 2007 found it unbroken (without evidence of rupture or breaching). The crater morphology, notably the distribution of fumarolic fields, has on the whole remained stable since shortly after the 1982 eruptions.
The CO2 gas fluxes from the crater lake's surface and floor were recently sampled using a floating accumulation chamber to measure the output. The calculated mean emission rate at the lake's surface in March 2007 was 1,500 g/(m2/day), and in December 2007 a preliminary estimate was 860 g/(m2/day). A preliminary flux rate from the crater floor in October 2007 was 1,930 g/(m2/day).
In addition, infrared camera images proved useful to quantify the thermal output. A good correlation appeared between gas flux and ground temperature. This may offer potential for future monitoring.
The authors inferred that future El Chichón volcanism might take the form of intracrater dome growth. Such growth could follow changes in chemistry, temperature and dynamics of the crater lake, the degassing regime, seismicity, geomagnetism, crater morphology, or other unrest such as the onset of phreatic explosions. Such processes can occur very rapidly, as recently shown by the dome growth at Kelud, Indonesia, in November 2007. However, the authors' investigation found no evidence to support current dome growth.
Geologic Background. El Chichón is a small trachyandesitic tuff cone and lava dome complex in an isolated part of the Chiapas region in SE México. Prior to 1982, this relatively unknown volcano was heavily forested and of no greater height than adjacent non-volcanic peaks. The largest dome, the former summit of the volcano, was constructed within a 1.6 x 2 km summit crater created about 220,000 years ago. Two other large craters are located on the SW and SE flanks; a lava dome fills the SW crater, and an older dome is located on the NW flank. More than ten large explosive eruptions have occurred since the mid-Holocene. The powerful 1982 explosive eruptions of high-sulfur, anhydrite-bearing magma destroyed the summit lava dome and were accompanied by pyroclastic flows and surges that devastated an area extending about 8 km around the volcano. The eruptions created a new 1-km-wide, 300-m-deep crater that now contains an acidic crater lake.
Information Contacts: Dmitri Rouwet, Istituto Nazionale di Geofisica e Vulcanologia (INGV-Palermo), Sezione di Palermo, Via Ugo La Malfa 153, CAP 90146, Palermo, Italy (URL: http://www.pa.ingv.it/); Agnes Mazot, Loic Peiffer, and Yuri Taran, Instituto de Geofisica, Universidad Nacional Autonoma de Mexico, Ciudad Universitaria, Circuito Exterior s/n, Col. Copilco, Del. Coyoacan, CP 04510, Mexico DF, Mexico (URL: http://www.geofisica.unam.mx/vulcanologia/spanish/personal.html); Nick Varley, Centre of Exchange and Research in Volcanology, Faculty of Science, University of Colima, Av. 25 de Julio ##965, Col. Villas San Sebastián, C.P. 28045 Colima, Colima, México (URL: http://www.ucol.mx/ciiv/nick/personal_en.htm); Martin Jutzeler, Centre for Ore Deposit Research (CODES), University of Tasmania, Australia; Laura Rosales Lagarde, Earth and Environmental Science Department, New Mexico Tech, Socorro, NM, USA; La Jornada (URL: http://www.jornada.unam.mx/).
Piton de la Fournaise (France) — December 2007 Cite this Report
Piton de la Fournaise
France
21.244°S, 55.708°E; summit elev. 2632 m
All times are local (unless otherwise noted)
Caldera collapse in April 2007; large E-flank lava flows
A caldera collapse occurred at this massive, dynamic shield volcano during early April 2007, displacing the 0.8 x 1.1 km floor of the elliptical Dolomieu caldera downward by ~ 330 m (figure 76). This was both the largest collapse at this volcano since 1760, and one of the few large collapse events seen at this volcano. Worldwide, such events are rarely documented by eyewitness or instrumental observations, with best known examples of collapses including those in 1968 at Fernandina (Simkin and Howard, 1970) and in 2000 at Miyake-jima (Kaneko and others, 2005).
The collapse at this Piton de la Fournaise occurred in association with the early stages of one of the largest historical discharges of lava flows ever seen here. The resulting lavas traveled E to reach the sea where they built a delta. Concurrent with collapse, the seismicity and deformation were cyclic in nature, suggesting collapse proceeded in a step-by-step manner. These and other events are explained by in a recent paper by Michon and others (2007), the source used to compile this report. Our last report, BGVN32:01, discussed events through 22 February 2007.
Piton de la Fournaise has undergone intense eruptive activity since 1998, with two to four eruptions per year typically venting at the summit and proximal areas. Five distal eruptions occurred during 1998-2007, chiefly concentrated along the NE rift zone, and in particular, on the Plaine des Osmondes. Pahoehoe lava flows had completely filled Dolomieu's floor, accumulating during an August 2006-January 2007 eruption to a thickness of 20-30 m.
Prelude to collapse.On 26 February 2007 seismicity started below the summit zone. It progressively increased and over 100 events took place daily during 28-30 March. Seismicity reached anomalously high levels on 30 March at 2025 local time. About 2.4 hours later, a fissure began erupting at 1,900 m elevation SE of Dolomieu and Bory craters and the central cone (at the point labeled 1, figure 76). Discharges continued for 10 hours. Tremor ceased early the next day.
The 30-31 March eruption included lava fountains up to 50 m in height feeding voluminous lava flows. This event was the debut of a new phase of volcanism that presaged the Dolomieu caldera collapse seen in April.
Collapse.A new eruptive phase began 2 April, venting at ~ 600 m elevation ESE of the central cone (at point 2, figure 76). The venting took place along a NW-trending, 1-km-long fissure.
During the next few days, seismicity rates rose to ~ 3-fold larger than in the previous (26 February) episode. As seismicity grew on 5 April, the permanent GPS instrument SNEG situated just NE of Bory crater's rim (figure 76) started to displace inward. The vertical component of motion began with a jolt around noon and markedly progressed during 1900-2300. Next, at 0048 the next day, an Md 3.2 earthquake occurred below the summit (Bory) crater. After that earthquake, seismic station Takamaka (Tkr, figure 76) registered a signal increase of ~ 50%. Coincident with the earthquake, the GPS instrument displaced ~ 15 cm outward. What followed was a series of cyclic deformation events, episodes composed of displacements progressively inward followed by ones sharply outward.
The displacements linked closely to a series of cyclical seismic and tremor episodes. Each of those consisted of a sharp, post collapse tremor increase, followed by intervals of stable tremor. Many of these initial tremor cycles occurred on roughly two-hour intervals (through the first hours of 6 April), but gradually (with approach to dawn on 6 April) these cycles occurred at about half-hour intervals. On 6 April there occurred a paroxysmal phase during which 200 m high lava fountains vented.
Tremor descended to initial levels before the paroxysmal phase, but cyclical seismic signals remained until 0100 on 7 April. Venting continued until 1 May, accompanied then by fluctuating tremor.
Estimating the volume of lava emitted was complicated by abundant lava having entered the sea at the coast, where it built a large platform, but based on topography and bathymetry before and after the event, the authors' rough estimate, in millions of cubic meters, was ~ 100-140. This makes this one of the most voluminous eruptions at this volcano during the 20th and 21st centuries (figure 77).
Collapse morphology and structure.The first summit zone observations on the afternoon of the 6th (~ 16 hours after the beginning of the seismic cycles) revealed that the previous geophysical observations and intense eruptions coincided with caldera collapse (figure 78). The 6 April collapse affected the Dolomieu's N part, descending the zone shaded in figure 78b along sub-vertical scarps to the E, N, and W, with a net offset of 200-300 m. The pre-existing floor remained intact on the E and S, forming arc-shaped plateaus there.
On 10 April the caldera had enlarged to engulf most of the Dolomieu structure. It had deepened to a maximum offset (determined from triangulation and confirmed with ASTER stereo images) of 320 to 340 m. Perched plateaus were restricted to the indicated zones. Subsequent morphologic changes were minor. The post-collapse caldera had diameters of 800 x 1,100 m and encompassed 82 x 104 m2, an area 11% larger than it was prior to the April eruptions.
The authors estimated that the post-collapse caldera's downward movement displaced a volume of 100-120 million cubic meters. This displacement was comparable to their estimated volume of emitted lava (~ 100-140 million cubic meters). The initial stage of collapse (seen 6 April; figure 78b) accounted for ~ 80% of the total volume displaced in the offset.
The April collapse may have followed pre-existing arcuate faults. It may also have described a magma chamber, the size and location of which were recently determined from a GPS inversion (Peltier and others, 2007). That study suggested a shallow chamber with diameters of 1.4 km and 1.0 km in the respective E-W and N-S directions.
References.Kaneko, T., Yasuda, A., Shimano, T., Nakada, S., and Fujii, T., 2005, Submarine flank eruption preceding caldera subsidence during the 2000 eruption of Miyakejima Volcano, Japan: Bull. Volcanol., v. 67, p. 243-253, doi: 10.1007/s00445-004-0407-1.
Michon, L., Staudacher, T., Ferrazzini, V., Bachélery, P., and Marti, J., 2007, April 2007 collapse of Piton de la Fournaise: A new example of caldera formation: Geophysical Research Letters, v. 34, p. L21301, doi:10.1029/2007GL031248,2007.
Peltier, A., Staudacher, T., and Bachélery, P., 2007, Constraints on magma transfers and structures involved in the 2003 actity at Piton de La Fournaise from displacement data: J. Geophys. Res., v. 112, p. B03207, doi: 10.1029/2006JB004379.
Simkin, T., and Howard, K. A., 1970, Caldera collapse in Galapagos Islands, 1968: Science, v. 169, p. 429-437.
Geologic Background. Piton de la Fournaise is a massive basaltic shield volcano on the French island of Réunion in the western Indian Ocean. Much of its more than 530,000-year history overlapped with eruptions of the deeply dissected Piton des Neiges shield volcano to the NW. Three scarps formed at about 250,000, 65,000, and less than 5,000 years ago by progressive eastward slumping, leaving caldera-sized embayments open to the E and SE. Numerous pyroclastic cones are present on the floor of the scarps and their outer flanks. Most recorded eruptions have originated from the summit and flanks of Dolomieu, a 400-m-high lava shield that has grown within the youngest scarp, which is about 9 km wide and about 13 km from the western wall to the ocean on the E side. More than 150 eruptions, most of which have produced fluid basaltic lava flows, have occurred since the 17th century. Only six eruptions, in 1708, 1774, 1776, 1800, 1977, and 1986, have originated from fissures outside the scarps.
Information Contacts: Laurent Michon and Patrick Bachélery, Laboratoire GéoSciences Réunion, Institut de Physique du Globe de Paris, Université de La Réunion, CNRS, UMR 7154-Géologie des Systèmes Volcaniques, La Réunion, France; Thomas Staudacher and Valérie Ferrazzini, Observatoire Volcanologique du Piton de la Fournaise, Institut de Physique du Globe de Paris, 14 route nationale 3, 27 ème km, 97418 La Plaine des Cafres, La Réunion, France (URL: http://www.ipgp.fr/fr/ovpf/actualites-ovpf/); Joan Marti, Institute of Earth Sciences "Jaume Almera," Consejo Superior de Investigaciones Cientificas, Barcelona, Spain.
Fuego (Guatemala) — December 2007 Cite this Report
Fuego
Guatemala
14.473°N, 90.88°W; summit elev. 3763 m
All times are local (unless otherwise noted)
Moderate Strombolian eruptions, including pyroclastic flows, continue into early 2008
Eruptive activity has continued at Fuego between January 2007 and early February 2008. Typical activity during this interval consisted of explosions that generated ash plumes up to ~ 2 km above the summit (~ 6 km altitude) and caused local ashfall (reported up to ~ 15 km away, but from one eruption, ~ 25 km away). Strombolian eruptions, avalanches, and lava flows up to ~ 1.5 km long were also commonly reported. Pyroclastic flows traveled up to ~ 2 km. Blocks detaching from the front of the flows and bouncing downslope were often incandescent. Satellite imagery often detected hotspots. Shock waves and rumbling or loud noises, sometimes described as similar to a passing airplane, were commonly noticed. Out last report discussed events through December 2006 (BGVN32:11).
Details included in the text below were provided by the Instituto Nacional de Sismologia, Vulcanología, Meteorología e Hidrologia (INSIVUMEH), the Coordinadora Nacional para la Reducción de Desastres (CONRED), and the Washington Volcanic Ash Advisory Center (VAAC).
The photographs included in this report are by Richard Roscoe, who on his website (www.photovolcanica.com) features more Fuego photos than we can include here. He also includes a brief animation of a small Fuego eruption. His site also provides a beginner's guide to volcano photography as well as cautions about safety and trekking in the area. All of his photos are used with his permission. They were taken during 29-31 December 2007. A companion site by his colleagues M. Rietze and Th. Boeckel also describes their photo excursion. Figures 8-10 are broadly representative of the kinds of eruptions common at Fuego during the reporting interval, and they provide a feel for the regional setting and geography.
During 4-5 January 2007 gas-and-ash clouds rose to 4.2-4.8 km altitude and constant incandescent avalanches from the central crater and a lateral crater ~ 70 m from the S edge of the central crater descended SW towards Taniluyá ravine. Fine ashfall was noted in areas S and ~ 9-15 km SW of the summit. On 12 January there was explosive ejecta and ash plumes up to 4 km altitude. Incandescent material was propelled up to 75 m above the summit and incandescent blocks rolled W towards Taniluyá ravine and Santa Teresa ravine, and S towards Cenizas ravine. Explosive activity was reported again during 21-29 January when incandescent material and blocks were ejected 100 m above the summit; blocks rolled ~ 500 m S and SW. On 26 and 29 January glowing blocks from lava-flow fronts rolled S towards Cenizas ravine. During an overnight visit to a neighboring summit, Craig Chesner and Sid Halsor saw Strombolian eruptions at roughly half-hour intervals.
No activity was reported after late January until 9-13 March 2007, when lava flows were noted extending ~ 100-150 m W toward Taniluyá ravine and explosive ash plumes rose to 4-4.2 km altitude. On 12 March glowing material was ejected ~ 15-20 m above the central crater. Lava flows on 15 March and explosive incandescent ejecta thrown 200 m above crater rim were accompanied by an ash plume. The longest lava flows traveled ~ 1.5 km W toward Taniluya ravine. Similar activity continued the next day, with previous lava flows advancing and new flows seen in different ravines. Pyroclastic flows also occurred, ash plumes rose to 4-6 km altitude. Shockwaves were felt ~ 15 km away, and Strombolian eruptions propelled glowing tephra 300 m above the summit. Two pyroclastic flows traveled about 800 m; one NW, and another W and SW. During most days 21-27 March Fuego emitted explosive gas-and-ash plumes that rose to ~ 4.7-5.1 km altitude, causing ashfall in areas 5-8 km SSE and 9 km W. On 24 March explosions were followed by lava blocks rolling down the W flank toward Taniluyá ravine. Similar activity on 26 March caused ashfall in areas 10-25 km to the W and SE.
The next reports of activity, during 20-23 April, were of lava flows, pyroclastic flows, explosive incandescent ejecta 50-75 m above the vent, and a gas-and-ash plume up to 4 km altitude. Incandescent material descended 300 m down the S and W flanks. The Washington VAAC reported that an intense hotspot seen on satellite imagery on 21 April was likely caused by a lava flow to the SW. On 23 April a pyroclastic flow and incandescent avalanches traveled down SE and SW ravines; ash explosions caused light ashfall in areas S.
Observations during 17-19 May were of fumarolic emissions ~ 600 m high along with active lava flows extending ~ 100 m SW toward the Taniluyá ravine and ~ 500 m SW toward the Cenizas ravine. The lava flow from the edge of the central crater continued on the S flank (~ 150 m long); landslides of blocks of incandescent material spalled from the front of the flow into the Taniluya ravine. Activity the following week, 26-27 May, consisted of explosive ejecta ~ 100 m above vent, gray steam-and-ash plumes up to 4-4.6 km altitude, and block avalanches to the S and SW. On 28 May the lava flow on the S flank continued to advance and produce incandescent blocks that rolled W in Taniluya ravine. Explosive incandescent ejecta was seen on 29 May, along with lava flows that extended ~ 400 m SW toward Cenizas ravine and incandescent material rising tens of meters above the vent.
On 1-2 August, pyroclastic flows occurred and explosive ejecta was thrown 50-75 m above the crater rim; an ash plume rose to 5.3 km altitude. Incandescent avalanches traveled 500-700 m down the S and W flanks. On 2 August, a moderate eruption produced a pyroclastic flow that traveled ~ 2 km SSW down the Cenizas ravine. A resultant plume produced ashfall S, SW, and W for several minutes.
On 8-9 August, pyroclastic flows and explosive Strombolian activity occurred with a gas-and-ash cloud to 4.4-5.6 km altitude. This eruption was visible from the city of Antigua, even though the resulting lava flows primarily traveled down the S and W flanks, which were on the side opposite from Antigua. Clouds obscured the view of possible E-flank lava flows. Ashfall was reported in areas to the W. Lava flows and related detached blocks traveled 1.5 km down Cenizas ravine to the SW. Several pyroclastic flows descended the flanks. Ashfall was reported in villages to the W, SW, and S.
On 10-13 August, small explosions and ash plumes rose up to 4.3 km altitude. 11 August behavior was characterized by weak explosions that expelled gray ash to 500 m above the crater. On 27 August, lahars carried tree trunks, branches, and blocks down the Lajas drainage to the SE. On 28 August, explosive ash plumes rose to 4.1 km altitude. On 31 August, a lahar 8 m wide and 1.5 m thick descended W down the Santa Teresa ravine.
On 3-4 September, explosive ash plumes rose to 4.5 km altitude. On 3 September, fumarolic plumes rose to 4 km altitude and a 300 m lava flow traveled W down the Taniluya drainage. There were also avalanches in the Cenizas ravine. On 21 September explosions of gray ash rose to ~ 5.8 km altitude and incandescent pulses in the crater rose to 75 m with avalanches in the S and SW flank. On 24 September 2007, moderate and strong explosions occurred, accompanied by ash plumes extending up to 900 m above the crater, and constant degassing sounds for periods of up to 20 min. On 5 October, weak to moderate incandescent explosions occurred, accompanied by ash plumes up to 800 m above the crater, and degassing sounds. Block avalanches were noted in the Taniluyá and Santa Teresa ravines.
On 10 October, weak to moderate explosions occurred, the largest accompanied by ash plumes that rose to 4-5 km altitude. Avalanches from cone building in the inner crater went W into the Taniluyá and Santa Teresa ravines.
On 12 October, INSIVUMEH reported that explosions from Fuego produced ash plumes that rose to altitudes of 4.2-4.8 km and caused ashfall in areas to the W. The explosions were accompanied by rumbling, and degassing sounds; shock waves were detected up to15 km away. The Washington VAAC reported a thermal anomaly on satellite imagery along with ash plumes that drifted W and NW.
According to Washington VAAC, satellite imagery detected multiple ash "puffs" emitting from the volcano between 24-30 October. They also reported ash plumes on 20 November (4.6 km in altitude) and 29 November. Additional weak to moderate explosions occurred on 7 December and 12 December, expelling ash and causing degassing sounds. Shock waves were noticed up to 15 km away.
On 15 December, Fuego generated a significant ash-and-steam plume that was observed from Antigua and Guatemala. It also produced a considerable flow of ash (and possibly lava) down its E slopes. According to the Washington VAAC, satellite imagery detected a thermal anomaly on 15-16 December. Thereafter, Fuego's activity declined to normal levels, although a few moderate explosions continued, along with an occasional ash plume. An ash cloud from Fuego was observed on 21 December and 26 December 2007.
For 11 January and 24 January 2008, INSIVUMEH reported weak explosions from Fuego that produced ash plumes that rose to altitudes of 4-5 km. Small avalanches of blocks traveled W toward the Taniluyá ravine. Based on reports from INSIVUMEH, CONRED reported on 28 January that the Alert Level was lowered to Green. On 30 January, satellite imagery detected a narrow plumes of gas and possible ash. On 4 February, satellite imagery detected ash plumes that rose to an altitude of 5 km.
Geologic Background. Volcán Fuego, one of Central America's most active volcanoes, is also one of three large stratovolcanoes overlooking Guatemala's former capital, Antigua. The scarp of an older edifice, Meseta, lies between Fuego and Acatenango to the north. Construction of Meseta dates back to about 230,000 years and continued until the late Pleistocene or early Holocene. Collapse of Meseta may have produced the massive Escuintla debris-avalanche deposit, which extends about 50 km onto the Pacific coastal plain. Growth of the modern Fuego volcano followed, continuing the southward migration of volcanism that began at the mostly andesitic Acatenango. Eruptions at Fuego have become more mafic with time, and most historical activity has produced basaltic rocks. Frequent vigorous historical eruptions have been recorded since the onset of the Spanish era in 1524, and have produced major ashfalls, along with occasional pyroclastic flows and lava flows.
Information Contacts: Instituto Nacional de Sismologia, Vulcanología, Meteorología e Hidrologia (INSIVUMEH), Ministero de Communicaciones, Transporto, Obras Públicas y Vivienda, 7a. Av. 14-57, zona 13, Guatemala City 01013, Guatemala (URL: http://www.insivumeh.gob.gt/); Coordinadora Nacional para la Reducción de Desastres (CONRED), Av. Hincapié 21-72, Zona 13, Guatemala City, Guatemala; Washington Volcanic Ash Advisory Center (VAAC), Satellite Analysis Branch (NOAA/NESDIS), 4700 Silver Hill Road, Stop 9910, Washington, DC 20233-9910, USA (URL: http://www.ssd.noaa.gov/); Richard Roscoe (URL: http://www.photovolcanica.com/); M. Rietze, R. Roscoe, and Th. Boeckel, (website) Volcanoes of Central America, Volcan Fuego, Guatemala 29th-31st of Dec. 2007 (URL: http://www.tboeckel.de/EFSF/efsf_wv/fuego_07/fuego_07_e.htm); Craig Chesner, Eastern Illinois University, Charleston, Illinois, USA; Sid Halsor, Wilkes Barre University, Wilkes Barre, PA 18766, USA.
Guagua Pichincha (Ecuador) — December 2007 Cite this Report
Guagua Pichincha
Ecuador
0.171°S, 78.598°W; summit elev. 4784 m
All times are local (unless otherwise noted)
Seven moderate phreatic eruptions on 1 February 2008
Following December 2007 seismicity, Guagua Pichincha generated phreatic eruptions multiple times on 1 February 2008. The summit lies only ~ 8 km W of the limits of Ecuador's capital, Quito. Our last report summarized events through January 2004 (BGVN 29:06).
In lead-up to the phreatic eruptions, the Instituto Geofísico Escuela Politécnica Nacional (IG-EPN), reported that an M 4.1 earthquake occurred in the vicinity on 6 December 2007, followed a week later by an increase in fracture earthquakes. These events, continuing through 23 December, were below M 3 and occurred at shallow depths within the volcano. On 24-30 December 2007, IG-EPN indicated that the fumaroles were stable.
IG-EPN reported that a slight increase in activity had been observed over a few weeks at the end of January 2008. This activity culminated on 1 February with seven phreatic explosions of moderate size. IG-EPN went on to say that these phreatic eruptions generally occur during rainy periods, so these explosions are not necessarily indicative of any increase in activity. Since this type of event may occur again, however, IG-EPN recommended that visitors not descend into the caldera. This was mentioned in a 2 February news report in El Pais, which further mentioned that strong rains that had recently fallen in Quito and the crater.
As of 14 February, Ash Advisories cataloged by the Washington VAAC's lacked reports describing the 1 February, or any subsequent, phreatic eruptions.
Geologic Background. Guagua Pichincha and the older Pleistocene Rucu Pichincha stratovolcanoes form a broad volcanic massif that rises immediately W of Ecuador's capital city, Quito. A lava dome grew at the head of a 6-km-wide scarp formed during a late-Pleistocene slope failure ~50,000 years ago. Subsequent late-Pleistocene and Holocene eruptions from the central vent consisted of explosive activity with pyroclastic flows accompanied by periodic growth and destruction of the lava dome. Many minor eruptions have been recorded since the mid-1500's; the largest took place in 1660, when ash fell over a 1,000 km radius and accumulated to 30 cm depth in Quito. Pyroclastic flows and surges also occurred, primarily to then W, and affected agricultural activity.
Information Contacts: Instituto Geofísico Escuela Politécnica Nacional (IG-EPN), Apartado 17-01-2759, Quito, Ecuador (URL: http://www.igepn.edu.ec/).
Poas (Costa Rica) — December 2007 Cite this Report
Poas
Costa Rica
10.2°N, 84.233°W; summit elev. 2697 m
All times are local (unless otherwise noted)
Small phreatic eruption from crater lake on 13 January 2008
A small phreatic eruption took place from the crater lake at Poás (figure 83) on 13 January 2008. Various changes such as the loss of fumaroles and minor mass wasting have also occurred at the intracrater dome. The 13 January eruption was described in a report by Eliecer Duarte of the Observatorio Vulcanologico Sismologica de Costa Rica-Universidad Nacional (OVSICORI-UNA). Our previous report discussed September 2006-September 2007 and noted hydrothermal variations and a minor phreatic eruption (BGVN 32:09).
A small phreatic eruption occurred at 0900 on 13 January from the hot, acidic Laguna Caliente. Carlos Cordero, a park ranger who witnessed the event, indicated that the event ejected water and sediments from the lake's center to a height of ~ 200 m. This material mainly fell back into the lake, changing its color from a dark green to an intense white (figure 84). The event was also seen by a group of tourists who watched from the main viewpoint ~ 1 km S of the lake. The eye-witness report emphasized the calm conditions of the lake and dome before the eruption.
Post-eruption inspection of the crater by OVSICORI staff revealed that the explosion left a 1.5-m-wide band of sediment up to 10 cm thick along the entire rim of the lake (figure 85). Some sediment also extended about 8 m from the shore at the S rim, near the terrace of the dome. The deposits, clearly debris from the lake bottom, included many shining crystals; larger clasts were absent. After the expulsion, water flowing back into the lake seemingly scoured or removed some sediment.
During a visit of OVSICORI staff, the lake's color changed over about a 3-hour period as a result of gas expulsion. The rapid degassing of thick columns of toxic gases obscured visibility of the other side of the lake. Compared to measurements at the end of November 2007, the lake's temperature had dropped (to 45°C) and the water level had risen 1.5 m.
The OVSICORI's staff also found a small landslide (8 x 20 m) on the dome's N face (figure 86). They described the landslide as a chaotic deposit of heavily altered angular blocks in a gray matrix that had been altered by hydrothermal activity. A slurry of yellowish materials reached the edge of the lake. Based on field evidence, the team concluded that the small landslide took place immediately after the emission of sediments.
Figure 87 shows a photo of the dome's steep E cliff face. Fumaroles had recently ceased emerging. Cracks and crevices on top of that terrace were also rapidly widening as joint blocks detach.
Geologic Background. The broad vegetated edifice of Poás, one of the most active volcanoes of Costa Rica, contains three craters along a N-S line. The frequently visited multi-hued summit crater lakes of the basaltic-to-dacitic volcano are easily accessible by vehicle from the nearby capital city of San José. A N-S-trending fissure cutting the complex stratovolcano extends to the lower N flank, where it has produced the Congo stratovolcano and several lake-filled maars. The southernmost of the two summit crater lakes, Botos, last erupted about 7,500 years ago. The more prominent geothermally heated northern lake, Laguna Caliente, is one of the world's most acidic natural lakes, with a pH of near zero. It has been the site of frequent phreatic and phreatomagmatic eruptions since an eruption was reported in 1828. Eruptions often include geyser-like ejections of crater-lake water.
Information Contacts: E. Duarte and E. Fernández, Observatorio Vulcanologico Sismologica de Costa Rica-Universidad Nacional (OVSICORI-UNA), Apartado 86-3000, Heredia, Costa Rica (URL: http://www.ovsicori.una.ac.cr/).
Batu Tara (Indonesia) — December 2007 Cite this Report
Batu Tara
Indonesia
7.791°S, 123.585°E; summit elev. 633 m
All times are local (unless otherwise noted)
Thermal anomalies beginning January 2007; ash plumes during March-October
On 1 July 2006 a pilot reported an ash cloud from Batu Tara drifting NW at 1.5 km altitude, but the Darwin VAAC could not identify ash in MTSAT satellite imagery around the same time. No other evidence or reports could confirm a renewal of activity at this small uninhabited island volcano, which last erupted during 1847-1852. Starting in January 2007, there were satellite thermal anomalies suggesting an eruption. Two months later observers issued reports of ash plumes from explosive activity.
MODIS infrared satellite data, compiled and analyzed by the Hawai'i Institute of Geophysics and Planetology (HIGP) Thermal Alerts System, first showed anomalies at Batu Tara on 17 January 2007. For almost a year thermal signatures typically were detected every 1-3 days, sometimes every 4-5 days, with rare gaps of 6-7 days. After no anomalies during 9-17 January 2008, regular hotspots returned and were continuing at the end of the month.
The Darwin VAAC reported that an ash cloud seen in MTSAT and Terra MODIS imagery at 1633 on 13 March 2007 reached an altitude of 4.3 km and drifted N. By 0833 on 14 March the plume was seen extending about 90 km NE, after which it dissipated. Later that day the low-level plume was 55 km long towards the ENE.
A continuous low-level plume, at or below summit level, was observed on imagery on 15 March extending SE from the summit to a distance of 65 km. The plume later shifted around towards the E, to a distance of ~ 37 km, on 16 March. Imagery on 17 March showed another direction change, to the NE, extending a maximum of 74 km. Government officials, residents, and fishermen on Lembata Island (formerly known as Lomblen), ~ 50 km S, observed plumes rising from Batu Tara during 17-19 March, but there was no night glow. The plumes on 19 March were reportedly 500-1,500 m high and blowing E. Although meteorological clouds interfered with satellite observations, the Centre of Volcanology and Geological Hazard Mitigation (CVGHM) reported continuous eruptions with ash to 500 m above the summit on 20 March. A continuous thin plume was also seen on satellite imagery extending 37 km NE on 20 March. Similar activity continued through 21-22 March, with low-level plumes identified in imagery out to distances of 46-56 km towards the E and SE.
High waves on 22 March prevented a science team from landing on the island, where CVGHM had hoped to install instruments that could be monitored from the observation post at Lewotolo volcano, ~ 52 km SSW. Observations on 22 March described ash plumes from the summit crater rising as high as 2 km and ashfall killing trees within a 500-m radius of the summit on the southern and eastern slopes. White emissions with intermittent dense gray plumes also originated from a location on the E foot of the mountain, with the clouds rising up to 250 m. A small cone grew there with a crater diameter of ~ 10 m. From a vantage point on Lembata, other observers reported minor ashfall, smelled sulfur odors, heard explosion noises, and saw incandescent blocks ejected to heights of ~ 500 m that landed in the sea.
Meteorological clouds continued to intermittently obscure satellite observations during 23-30 March, but available clear imagery and CVGHM reports indicated continuing plumes at low altitudes extending as far as 90 km downwind (figures 1 and 2). Infrared anomalies also continued to be recorded during this time. On the morning of 31 March a plume was seen extending about 150 km NNW.
CVGHM reported observations from 30 March that indicated the E side of the volcano had been most impacted by recent activity. Plant life on the E side was affected by hot ashfall. White plumes rose from the summit to an altitude of ~ 1.7 km and drifted E. Incandescent rockslides and cooled lava flows were observed at the E foot of the volcano. Steam and occasional ash plumes rose from the area where hot material interacted with the sea.
Semi-continuous eruptions through 3 April produced low-level plumes, generally to altitudes of 1.5-3 km, reported by ground observers and seen in satellite imagery to distance of 37-56 km downwind in various directions. On 5 April, plumes rose to 3 km altitude. Based on satellite imagery the CVGHM reported that on 5 April a lava flow on the E slope created a central levee with debris fans on either side. The delta-like shape spanned about 450 m across. A lava flow also extended 100 m into the water. Diffuse plumes seen in satellite imagery rose to altitudes of 1.5 km and drifted W and NW during 4-11 April. Explosive activity producing noticeable ash plumes generally declined in April, and on the 12th the hazard status was lowered to Alert Level 2. However, hotspots continued to be recorded on an almost daily basis.
A pilot reported a low-level ash plume extending 90 km W on 27 April, but ash could not be identified in satellite data. Based on satellite imagery and CVGHM, the Darwin VAAC issued reports of diffuse low ash plumes drifting W during 5 and 10-12 May. On 19 June an ash plume rose to an altitude of 1.7 km. Clouds inhibited visual observations on the other days during 18-25 June. However, on 19 June, a dense white plume rising to 1,000 m high was observed. Between 28 June and 1 July, diffuse white plume was observed rising to 50-150 m. An ash column reached 750 m above the summit.
Based on observations of satellite imagery, the Darwin VAAC reported that on 18 September, diffuse ash plumes rose to an altitude of 2.4 km and drifted W for 140 km. CVGHM lowered the Alert Level to 1 on 9 October. During 3 September-9 October, plumes rose to an altitude of approximately 1.4 km, 700 m above the summit. Satellite imagery showed an ash plume on 13 October that rose to an altitude of 3 km and drifted N and W. Despite time gaps when plumes were not seen and the decreased frequency of explosion plumes, MODIS data recorded thermal anomalies at least every few days throughout April-October 2007, and continuing into February 2008.
Geologic Background. The small isolated island of Batu Tara in the Flores Sea about 50 km N of Lembata (fomerly Lomblen) Island contains a scarp on the eastern side similar to the Sciara del Fuoco of Italy's Stromboli volcano. Vegetation covers the flanks to within 50 m of the summit. Batu Tara lies north of the main volcanic arc and is noted for its potassic leucite-bearing basanitic and tephritic rocks. The first historical eruption, during 1847-52, produced explosions and a lava flow.
Information Contacts: Center of Volcanology and Geological Hazard Mitigation (CVGHM), Diponegoro 57, Bandung, Jawa Barat 40122, Indonesia (URL: http://vsi.esdm.go.id/); Darwin Volcanic Ash Advisory Centre (VAAC), Bureau of Meteorology, Northern Territory Regional Office, PO Box 40050, Casuarina, Northern Territory 0811, Australia (URL: http://www.bom.gov.au/info/vaac/); Michael Thirnbeck, Jakarta, Indonesia (URL: http://www.flickr.com/photos/thirnbeck/); Hawai'i Institute of Geophysics and Planetology (HIGP) Thermal Alerts System, School of Ocean and Earth Science and Technology (SOEST), Univ. of Hawai'i, 2525 Correa Road, Honolulu, HI 96822, USA (URL: http://modis.higp.hawaii.edu/).