Recently Published Bulletin Reports
Kadovar (Papua New Guinea) An ash plume and weak thermal anomaly during May 2023
San Miguel (El Salvador) Small gas-and-ash explosions during March and May 2023
Ebeko (Russia) Continued explosions, ash plumes, and ashfall during October 2022-May 2023
Home Reef (Tonga) Discolored plumes continued during November 2022-April 2023
Semisopochnoi (United States) Occasional explosions, ash deposits, and gas-and-steam plumes during December 2022-May 2023
Ambae (Vanuatu) New lava flow, ash plumes, and sulfur dioxide plumes during February-May 2023
Ibu (Indonesia) Daily ash explosions continue, along with thermal anomalies in the crater, October 2022-May 2023
Dukono (Indonesia) Continuing ash emissions, SO2 plumes, and thermal signals during October 2022-May 2023
Sabancaya (Peru) Explosions, gas-and-ash plumes, and thermal activity persist during November 2022-April 2023
Sheveluch (Russia) Significant explosions destroyed part of the lava-dome complex during April 2023
Bezymianny (Russia) Explosions, ash plumes, lava flows, and avalanches during November 2022-April 2023
Chikurachki (Russia) New explosive eruption during late January-early February 2023
Kadovar (Papua New Guinea) — June 2023  Cite this Report
Kadovar
Papua New Guinea
3.608°S, 144.588°E; summit elev. 365 m
All times are local (unless otherwise noted)
An ash plume and weak thermal anomaly during May 2023
Kadovar is a 2-km-wide island that is the emergent summit of a Bismarck Sea stratovolcano. It lies off the coast of New Guinea, about 25 km N of the mouth of the Sepik River. Prior to an eruption that began in 2018, a lava dome formed the high point of the volcano, filling an arcuate landslide scarp open to the S. Submarine debris-avalanche deposits occur to the S of the island. The current eruption began in January 2018 and has comprised lava effusion from vents at the summit and at the E coast; more recent activity has consisted of ash plumes, weak thermal activity, and gas-and-steam plumes (BGVN 48:02). This report covers activity during February through May 2023 using information from the Darwin Volcanic Ash Advisory Center (VAAC) and satellite data.
Activity during the reporting period was relatively low and mainly consisted of white gas-and-steam plumes that were visible in natural color satellite images on clear weather days (figure 67). According to a Darwin VAAC report, at 2040 on 6 May an ash plume rose to 4.6 km altitude and drifted W; by 2300 the plume had dissipated. MODIS satellite instruments using the MODVOLC thermal algorithm detected a single thermal hotspot on the SE side of the island on 7 May. Weak thermal activity was also detected in a satellite image on the E side of the island on 14 May, accompanied by a white gas-and-steam plume that drifted SE (figure 68).
Geologic Background. The 2-km-wide island of Kadovar is the emergent summit of a Bismarck Sea stratovolcano of Holocene age. It is part of the Schouten Islands, and lies off the coast of New Guinea, about 25 km N of the mouth of the Sepik River. Prior to an eruption that began in 2018, a lava dome formed the high point of the andesitic volcano, filling an arcuate landslide scarp open to the south; submarine debris-avalanche deposits occur in that direction. Thick lava flows with columnar jointing forms low cliffs along the coast. The youthful island lacks fringing or offshore reefs. A period of heightened thermal phenomena took place in 1976. An eruption began in January 2018 that included lava effusion from vents at the summit and at the E coast.
Information Contacts: Darwin Volcanic Ash Advisory Centre (VAAC), Bureau of Meteorology, Northern Territory Regional Office, PO Box 40050, Casuarina, NT 0811, Australia (URL: http://www.bom.gov.au/info/vaac/); Hawai'i Institute of Geophysics and Planetology (HIGP) - MODVOLC Thermal Alerts System, School of Ocean and Earth Science and Technology (SOEST), Univ. of Hawai'i, 2525 Correa Road, Honolulu, HI 96822, USA (URL: http://modis.higp.hawaii.edu/); Copernicus Browser, Copernicus Data Space Ecosystem, European Space Agency (URL: https://dataspace.copernicus.eu/browser/).
San Miguel (El Salvador) — June 2023 Cite this Report
San Miguel
El Salvador
13.434°N, 88.269°W; summit elev. 2130 m
All times are local (unless otherwise noted)
Small gas-and-ash explosions during March and May 2023
San Miguel in El Salvador is a broad, deep crater complex that has been frequently modified by eruptions recorded since the early 16th century and consists of the summit known locally as Chaparrastique. Flank eruptions have produced lava flows that extended to the N, NE, and SE during the 17-19th centuries. The most recent activity has consisted of minor ash eruptions from the summit crater. The current eruption period began in November 2022 and has been characterized by frequent phreatic explosions, gas-and-ash emissions, and sulfur dioxide plumes (BGVN 47:12). This report describes small gas-and-ash explosions during December 2022 through May 2023 based on special reports from the Ministero de Medio Ambiente y Recursos Naturales (MARN).
Activity has been relatively low since the last recorded explosions on 29 November 2022. Seismicity recorded by the San Miguel Volcano Station (VSM) located on the N flank at 1.7 km elevation had decreased by 7 December. Sulfur dioxide gas measurements taken with DOAS (Differential Optical Absorption Spectroscopy) mobile equipment were below typical previously recorded values: 300 tons per day (t/d). During December, small explosions were recorded by the seismic network and manifested as gas-and-steam emissions.
Gas-and-ash explosions in the crater occurred during January 2023, which were recorded by the seismic network. Sulfur dioxide values remained low, between 300-400 t/d through 10 March. At 0817 on 14 January a gas-and-ash emission was visible in webcam images, rising just above the crater rim. Some mornings during February, small gas-and-steam plumes were visible in the crater. On 7 March at 2252 MARN noted an increase in degassing from the central crater; gas emissions were constantly observed through the early morning hours on 8 March. During the early morning of 8 March through the afternoon on 9 March, 12 emissions were registered, some accompanied by ash. The last gas-and-ash emission was recorded at 1210 on 9 March; very fine ashfall was reported in El Tránsito (10 km S), La Morita (6 km W), and La Piedrita (3 km W). The smell of sulfur was reported in Piedra Azul (5 km SW). On 16 March MARN reported that gas-and-steam emissions decreased.
Low degassing and very low seismicity were reported during April; no explosions have been detected between 9 March and 27 May. The sulfur dioxide emissions remained between 350-400 t/d; during 13-20 April sulfur dioxide values fluctuated between 30-300 t/d. Activity remained low through most of May; on 23 May seismicity increased. An explosion was detected at 1647 on 27 May generated a gas-and-ash plume that rose 700 m high (figure 32); a decrease in seismicity and gas emissions followed. The DOAS station installed on the W flank recorded sulfur dioxide values that reached 400 t/d on 27 May; subsequent measurements showed a decrease to 268 t/d on 28 May and 100 t/d on 29 May.
Geologic Background. The symmetrical cone of San Miguel, one of the most active volcanoes in El Salvador, rises from near sea level to form one of the country's most prominent landmarks. A broad, deep, crater complex that has been frequently modified by eruptions recorded since the early 16th century caps the truncated unvegetated summit, also known locally as Chaparrastique. Flanks eruptions of the basaltic-andesitic volcano have produced many lava flows, including several during the 17th-19th centuries that extended to the N, NE, and SE. The SE-flank flows are the largest and form broad, sparsely vegetated lava fields crossed by highways and a railroad skirting the base of the volcano. Flank vent locations have migrated higher on the edifice during historical time, and the most recent activity has consisted of minor ash eruptions from the summit crater.
Information Contacts: Ministero de Medio Ambiente y Recursos Naturales (MARN), Km. 5½ Carretera a Nueva San Salvador, Avenida las Mercedes, San Salvador, El Salvador (URL: http://www.snet.gob.sv/ver/vulcanologia).
Ebeko
Russia
50.686°N, 156.014°E; summit elev. 1103 m
All times are local (unless otherwise noted)
Continued explosions, ash plumes, and ashfall during October 2022-May 2023
Ebeko, located on the N end of Paramushir Island in the Kuril Islands, consists of three summit craters along a SSW-NNE line at the northern end of a complex of five volcanic cones. Eruptions date back to the late 18th century and have been characterized as small-to-moderate explosions from the summit crater, accompanied by intense fumarolic activity. The current eruption period began in June 2022 and has recently consisted of frequent explosions, ash plumes, and thermal activity (BGVN 47:10). This report covers similar activity during October 2022 through May 2023, based on information from the Kamchatka Volcanic Eruptions Response Team (KVERT) and satellite data.
Activity during October consisted of explosive activity, ash plumes, and occasional thermal anomalies. Visual data by volcanologists from Severo-Kurilsk showed explosions producing ash clouds up to 2.1-3 km altitude which drifted E, N, NE, and SE during 1-8, 10, 16, and 18 October. KVERT issued several Volcano Observatory Notices for Aviation (VONA) on 7, 13-15, and 27 October 2022, stating that explosions generated ash plumes that rose to 2.3-4 km altitude and drifted 5 km E, NE, and SE. Ashfall was reported in Severo-Kurilsk (Paramushir Island, about 7 km E) on 7 and 13 October. Satellite data showed a thermal anomaly over the volcano on 15-16 October. Visual data showed ash plumes rising to 2.5-3.6 km altitude on 22, 25-29, and 31 October and moving NE due to constant explosions.
Similar activity continued during November, with explosions, ash plumes, and ashfall occurring. KVERT issued VONAs on 1-2, 4, 6-7, 9, 13, and 16 November that reported explosions and resulting ash plumes that rose to 1.7-3.6 km altitude and drifted 3-5 km SE, ESE, E, and NE. On 1 November ash plumes extended as far as 110 km SE. On 5, 8, 12, and 24-25 November explosions and ash plumes rose to 2-3.1 km altitude and drifted N and E. Ashfall was observed in Severo-Kurilsk on 7 and 16 November. A thermal anomaly was visible during 1-4, 16, and 20 November. Explosions during 26 November rose as high as 2.7 km altitude and drifted NE (figure 45).
Explosions and ash plumes continued to occur in December. During 1-2 and 4 December volcanologists from Severo-Kurilsk observed explosions that sent ash to 1.9-2.5 km altitude and drifted NE and SE (figure 46). VONAs were issued on 5, 9, and 16 December reporting that explosions generated ash plumes rising to 1.9 km, 2.6 km, and 2.4 km altitude and drifted 5 km SE, E, and NE, respectively. A thermal anomaly was visible in satellite imagery on 16 December. On 18 and 27-28 December explosions produced ash plumes that rose to 2.5 km altitude and drifted NE and SE. On 31 December an ash plume rose to 2 km altitude and drifted NE.
Explosions continued during January 2023, based on visual observations by volcanologists from Severo-Kurilsk. During 1-7 January explosions generated ash plumes that rose to 4 km altitude and drifted NE, E, W, and SE. According to VONAs issued by KVERT on 2, 4, 10, and 23 January, explosions produced ash plumes that rose to 2-4 km altitude and drifted 5 km N, NE, E, and ENE; the ash plume that rose to 4 km altitude occurred on 10 January (figure 47). Satellite data showed a thermal anomaly during 3-4, 10, 13, 16, 21, 22, and 31 January. KVERT reported that an ash cloud on 4 January moved 12 km NE. On 6 and 9-11 January explosions sent ash plumes to 4.5 km altitude and drifted W and ESE. On 13 January an ash plume rose to 3 km altitude and drifted SE. During 20-24 January ash plumes from explosions rose to 3.7 km altitude and drifted SE, N, and NE. On 21 January the ash plume drifted as far as 40 km NE. During 28-29 and 31 January and 1 February ash plumes rose to 4 km altitude and drifted NE.
During February, explosions, ash plumes, and ashfall were reported. During 1, 4-5 and 7-8 February explosions generated ash plumes that rose to 4.5 km altitude and drifted E and NE; ashfall was observed on 5 and 8 February. On 6 February an explosion produced an ash plume that rose to 3 km altitude and drifted 7 km E, causing ashfall in Severo-Kurilsk. A thermal anomaly was visible in satellite data on 8, 9, 13, and 21 February. Explosions on 9 and 12-13 February produced ash plumes that rose to 4 km altitude and drifted E and NE; the ash cloud on 12 February extended as far as 45 km E. On 22 February explosions sent ash to 3 km altitude that drifted E. During 24 and 26-27 February ash plumes rose to 4 km altitude and drifted E. On 28 February an explosion sent ash to 2.5-3 km altitude and drifted 5 km E; ashfall was observed in Severo-Kurilsk.
Activity continued during March; visual observations showed that explosions generated ash plumes that rose to 3.6 km altitude on 3, 5-7, and 9-12 March and drifted E, NE, and NW. Thermal anomalies were visible on 10, 13, and 29-30 March in satellite imagery. On 18, 21-23, 26, and 29-30 March explosions produced ash plumes that rose to 2.8 km altitude and drifted NE and E; the ash plumes during 22-23 March extended up to 76 km E. A VONA issued on 21 March reported an explosion that produced an ash plume that rose to 2.8 km altitude and drifted 5 km E. Another VONA issued on 23 March reported that satellite data showed an ash plume rising to 3 km altitude and drifted 14 km E.
Explosions during April continued to generate ash plumes. On 1 and 4 April an ash plume rose to 2.8-3.5 km altitude and drifted SE and NE. A thermal anomaly was visible in satellite imagery during 1-6 April. Satellite data showed ash plumes and clouds rising to 2-3 km altitude and drifting up to 12 km SW and E on 3 and 6 April (figure 48). KVERT issued VONAs on 3, 5, 14, 16 April describing explosions that produced ash plumes rising to 3 km, 3.5 km, 3.5 km, and 3 km altitude and drifting 5 km S, 5 km NE and SE, 72 km NNE, and 5 km NE, respectively. According to satellite data, the resulting ash cloud from the explosion on 14 April was 25 x 7 km in size and drifted 72-104 km NNE during 14-15 April. According to visual data by volcanologists from Severo-Kurilsk explosions sent ash up to 3.5 km altitude that drifted NE and E during 15-16, 22, 25-26, and 29 April.
The explosive eruption continued during May. Explosions during 3-4, 6-7, and 9-10 May generated ash plumes that rose to 4 km altitude and drifted SW and E. Satellite data showed a thermal anomaly on 3, 9, 13-14, and 24 May. During 12-16, 23-25, and 27-28 May ash plumes rose to 3.5 km altitude and drifted in different directions due to explosions. Two VONA notices were issued on 16 and 25 May, describing explosions that generated ash plumes rising to 3 km and 3.5 km altitude, respectively and extending 5 km E. The ash cloud on 25 May drifted 75 km SE.
Thermal activity in the summit crater, occasionally accompanied by ash plumes and ash deposits on the SE and E flanks due to frequent explosions, were visible in infrared and true color satellite images (figure 49).
Geologic Background. The flat-topped summit of the central cone of Ebeko volcano, one of the most active in the Kuril Islands, occupies the northern end of Paramushir Island. Three summit craters located along a SSW-NNE line form Ebeko volcano proper, at the northern end of a complex of five volcanic cones. Blocky lava flows extend west from Ebeko and SE from the neighboring Nezametnyi cone. The eastern part of the southern crater contains strong solfataras and a large boiling spring. The central crater is filled by a lake about 20 m deep whose shores are lined with steaming solfataras; the northern crater lies across a narrow, low barrier from the central crater and contains a small, cold crescentic lake. Historical activity, recorded since the late-18th century, has been restricted to small-to-moderate explosive eruptions from the summit craters. Intense fumarolic activity occurs in the summit craters, on the outer flanks of the cone, and in lateral explosion craters.
Information Contacts: Kamchatka Volcanic Eruptions Response Team (KVERT), Far Eastern Branch, Russian Academy of Sciences, 9 Piip Blvd., Petropavlovsk-Kamchatsky, 683006, Russia (URL: http://www.kscnet.ru/ivs/kvert/); MIROVA (Middle InfraRed Observation of Volcanic Activity), a collaborative project between the Universities of Turin and Florence (Italy) supported by the Centre for Volcanic Risk of the Italian Civil Protection Department (URL: http://www.mirovaweb.it/); Copernicus Browser, Copernicus Data Space Ecosystem, European Space Agency (URL: https://dataspace.copernicus.eu/browser/).
Home Reef
Tonga
18.992°S, 174.775°W; summit elev. -10 m
All times are local (unless otherwise noted)
Discolored plumes continued during November 2022-April 2023
Home Reef is a submarine volcano located in the central Tonga islands between Lateiki (Metis Shoal) and Late Island. The first recorded eruption occurred in the mid-19th century, when an ephemeral island formed. An eruption in 1984 produced a 12-km-high eruption plume, a large volume of floating pumice, and an ephemeral island 500 x 1,500 m wide, with cliffs 30-50 m high that enclosed a water-filled crater. Another island-forming eruption in 2006 produced widespread pumice rafts that drifted as far as Australia; by 2008 the island had eroded below sea level. The previous eruption occurred during October 2022 and was characterized by a new island-forming eruption, lava effusion, ash plumes, discolored water, and gas-and-steam plumes (BGVN 47:11). This report covers discolored water plumes during November 2022 through April 2023 using satellite data.
Discolored plumes continued during the reporting period and were observed in true color satellite images on clear weather days. Satellite images show light green-yellow discolored water extending W on 8 and 28 November 2022 (figure 31), and SW on 18 November. Light green-yellow plumes extended W on 3 December, S on 13 December, SW on 18 December, and W and S on 23 December (figure 31). On 12 January 2023 discolored green-yellow plumes extended to the NE, E, SE, and N. The plume moved SE on 17 January and NW on 22 January. Faint discolored water in February was visible moving NE on 1 February. A discolored plume extended NW on 8 and 28 March and NW on 13 March (figure 31). During April, clear weather showed green-blue discolored plumes moving S on 2 April, W on 7 April, and NE and S on 12 April. A strong green-yellow discolored plume extended E and NE on 22 April for several kilometers (figure 31).
Geologic Background. Home Reef, a submarine volcano midway between Metis Shoal and Late Island in the central Tonga islands, was first reported active in the mid-19th century, when an ephemeral island formed. An eruption in 1984 produced a 12-km-high eruption plume, large amounts of floating pumice, and an ephemeral 500 x 1,500 m island, with cliffs 30-50 m high that enclosed a water-filled crater. In 2006 an island-forming eruption produced widespread dacitic pumice rafts that drifted as far as Australia. Another island was built during a September-October 2022 eruption.
Information Contacts: Copernicus Browser, Copernicus Data Space Ecosystem, European Space Agency (URL: https://dataspace.copernicus.eu/browser/).
Semisopochnoi (United States) — June 2023 Cite this Report
Semisopochnoi
United States
51.93°N, 179.58°E; summit elev. 1221 m
All times are local (unless otherwise noted)
Occasional explosions, ash deposits, and gas-and-steam plumes during December 2022-May 2023
Semisopochnoi is located in the western Aleutians, is 20-km-wide at sea level, and contains an 8-km-wide caldera. The three-peaked Mount Young (formerly Cerberus) was constructed within the caldera during the Holocene. Each of these peaks contains a summit crater; the lava flows on the N flank appear younger than those on the S side. The current eruption period began in early February 2021 and has more recently consisted of intermittent explosions and ash emissions (BGVN 47:12). This report updates activity during December 2022 through May 2023 using daily, weekly, and special reports from the Alaska Volcano Observatory (AVO). AVO monitors the volcano using local seismic and infrasound sensors, satellite data, web cameras, and remote infrasound and lightning networks.
Activity during most of December 2022 was relatively quiet; according to AVO no eruptive or explosive activity was observed since 7 November 2022. Intermittent tremor and occasional small earthquakes were observed in geophysical data. Continuous gas-and-steam emissions were observed from the N crater of Mount Young in webcam images on clear weather days (figure 25). On 24 December, there was a slight increase in earthquake activity and several small possible explosion signals were detected in infrasound data. Eruptive activity resumed on 27 December at the N crater of Mount Young; AVO issued a Volcano Activity Notice (VAN) that reported minor ash deposits on the flanks of Mount Young that extended as far as 1 km from the vent, according to webcam images taken during 27-28 December (figure 26). No ash plumes were observed in webcam or satellite imagery, but a persistent gas-and-steam plume that might have contained some ash rose to 1.5 km altitude. As a result, AVO raised the Aviation Color Code (ACC) to Orange (the second highest level on a four-color scale) and the Volcano Alert Level (VAL) to Watch (the second highest level on a four-level scale). Possible explosions were detected during 21 December 2022 through 1 January 2023 and seismic tremor was recorded during 30-31 December.
During January 2023 eruptive activity continued at the active N crater of Mount Young. Minor ash deposits were observed on the flanks, extending about 2 km SSW, based on webcam images from 1 and 3 January. A possible explosion occurred during 1-2 January based on elevated seismicity recorded on local seismometers and an infrasound signal recorded minutes later by an array at Adak. Though no ash plumes were observed in webcam or satellite imagery, a persistent gas-and-steam plume rose to 1.5 km altitude that might have carried minor traces of ash. Ash deposits were accompanied by periods of elevated seismicity and infrasound signals from the local geophysical network, which AVO reported were likely due to weak explosive activity. Low-level explosive activity was also detected during 2-3 January, with minor gas-and-steam emissions and a new ash deposit that was visible in webcam images. Low-level explosive activity was detected in geophysical data during 4-5 January, with elevated seismicity and infrasound signals observed on local stations. Volcanic tremor was detected during 7-9 January and very weak explosive activity was detected in seismic and infrasound data on 9 January. Weak seismic and infrasound signals were recorded on 17 January, which indicated minor explosive activity, but no ash emissions were observed in clear webcam images; a gas-and-steam plume continued to rise to 1.5 km altitude. During 29-30 January, ash deposits near the summit were observed on fresh snow, according to webcam images.
The active N cone at Mount Young continued to produce a gas-and-steam plume during February, but no ash emissions or explosive events were detected. Seismicity remained elevated with faint tremor during early February. Gas-and-steam emissions from the N crater were observed in clear webcam images on 11-13 and 16 February; no explosive activity was detected in seismic, infrasound, or satellite data. Seismicity has also decreased, with no significant seismic tremor observed since 25 January. Therefore, the ACC was lowered to Yellow (the second lowest level on a four-color scale) and the VAL was lowered to Advisory (the second lowest level on a four-color scale) on 22 February.
Gas-and-steam emissions persisted during March from the N cone of Mount Young, based on clear webcam images. A few brief episodes of weak tremor were detected in seismic data, although seismicity decreased over the month. A gas-and-steam plume detected in satellite data extended 150 km on 18 March. Low-level ash emissions from the N cone at Mount Young were observed in several webcam images during 18-19 March, in addition to small explosions and volcanic tremor. The ACC was raised to Orange and the VAL increased to Watch on 19 March. A small explosion was detected in seismic and infrasound data on 21 March.
Low-level unrest continued during April, although cloudy weather often obscured views of the summit; periods of seismic tremor and local earthquakes were recorded. During 3-4 April a gas-and-steam plume was visible traveling more than 200 km overnight; no ash was evident in the plume, according to AVO. A gas-and-steam plume was observed during 4-6 April that extended 400 km but did not seem to contain ash. Small explosions were detected in seismic and infrasound data on 5 April. Occasional clear webcam images showed continuing gas-and-steam emissions rose from Mount Young, but no ash deposits were observed on the snow. On 19 April small explosions and tremor were detected in seismic and infrasound data. A period of seismic tremor was detected during 22-25 April, with possible weak explosions on 25 April. Ash deposits were visible near the crater rim, but it was unclear if these deposits were recent or due to older deposits.
Occasional small earthquakes were recorded during May, but there were no signs of explosive activity seen in geophysical data. Gas-and-steam emissions continued from the N crater of Mount Young, based on webcam images, and seismicity remained slightly elevated. A new, light ash deposit was visible during the morning of 5 May on fresh snow on the NW flank of Mount Young. During 10 May periods of volcanic tremor were observed. The ACC was lowered to Yellow and the VAL to Advisory on 17 May due to no additional evidence of activity.
Geologic Background. Semisopochnoi, the largest subaerial volcano of the western Aleutians, is 20 km wide at sea level and contains an 8-km-wide caldera. It formed as a result of collapse of a low-angle, dominantly basaltic volcano following the eruption of a large volume of dacitic pumice. The high point of the island is Anvil Peak, a double-peaked late-Pleistocene cone that forms much of the island's northern part. The three-peaked Mount Cerberus (renamed Mount Young in 2023) was constructed within the caldera during the Holocene. Each of the peaks contains a summit crater; lava flows on the N flank appear younger than those on the south side. Other post-caldera volcanoes include the symmetrical Sugarloaf Peak SSE of the caldera and Lakeshore Cone, a small cinder cone at the edge of Fenner Lake in the NE part of the caldera. Most documented eruptions have originated from Young, although Coats (1950) considered that both Sugarloaf and Lakeshore Cone could have been recently active.
Information Contacts: Alaska Volcano Observatory (AVO), a cooperative program of a) U.S. Geological Survey, 4200 University Drive, Anchorage, AK 99508-4667 USA (URL: https://avo.alaska.edu/), b) Geophysical Institute, University of Alaska, PO Box 757320, Fairbanks, AK 99775-7320, USA, and c) Alaska Division of Geological & Geophysical Surveys, 794 University Ave., Suite 200, Fairbanks, AK 99709, USA (URL: http://dggs.alaska.gov/).
Ambae
Vanuatu
15.389°S, 167.835°E; summit elev. 1496 m
All times are local (unless otherwise noted)
New lava flow, ash plumes, and sulfur dioxide plumes during February-May 2023
Ambae, also known as Aoba, is a large basaltic shield volcano in Vanuatu. A broad pyroclastic cone containing three crater lakes (Manaro Ngoru, Voui, and Manaro Lakua) is located at the summit within the youngest of at least two nested calderas. Periodic phreatic and pyroclastic explosions have been reported since the 16th century. A large eruption more than 400 years ago resulted in a volcanic cone within the summit crater that is now filled by Lake Voui; the similarly sized Lake Manaro fills the western third of the caldera. The previous eruption ended in August 2022 that was characterized by gas-and-steam and ash emissions and explosions of wet tephra (BGVN 47:10). This report covers a new eruption during February through May 2023 that consisted of a new lava flow, ash plumes, and sulfur dioxide emissions, using information from the Vanuatu Meteorology and Geo-Hazards Department (VMGD) and satellite data.
During the reporting period, the Alert Level remained at a 2 (on a scale of 0-5), which has been in place since December 2021. Activity during October 2022 through March 2023 remained relatively low and mostly consisted of gas-and-steam emissions in Lake Voui. VMGD reported that at 1300 on 15 November a satellite image captured a strong amount of sulfur dioxide rising above the volcano (figure 99), and that seismicity slightly increased. The southern and northern part of the island reported a strong sulfur dioxide smell and heard explosions. On 20 February 2023 a gas-and-ash plume rose 1.3 km above the summit and drifted SSW, according to a webcam image (figure 100). Gas-and-steam and possibly ash emissions continued on 23 February and volcanic earthquakes were recorded by the seismic network.
During April, volcanic earthquakes and gas-and-steam and ash emissions were reported from the cone in Lake Voui. VMGD reported that activity increased during 5-7 April; high gas-and-steam and ash plumes were visible, accompanied by nighttime incandescence. According to a Wellington VAAC report, a low-level ash plume rose as high as 2.5 km above the summit and drifted W and SW on 5 April, based on satellite imagery. Reports in Saratamata stated that a dark ash plume drifted to the WSW, but no loud explosion was heard. Webcam images from 2100 showed incandescence above the crater and reflected in the clouds. According to an aerial survey, field observations, and satellite data, water was no longer present in the lake. A lava flow was reported effusing from the vent and traveling N into the dry Lake Voui, which lasted three days. The next morning at 0745 on 6 April a gas-and-steam and ash plume rose 5.4 km above the summit and drifted ESE, based on information from VMGD (figure 101). The Wellington VAAC also reported that light ashfall was observed on the island. Intermittent gas-and-steam and ash emissions were visible on 7 April, some of which rose to an estimated 3 km above the summit and drifted E. Webcam images during 0107-0730 on 7 April showed continuing ash emissions. A gas-and-steam and ash plume rose 695 m above the summit crater at 0730 on 19 April and drifted ESE, based on a webcam image (figure 102).
According to visual and infrared satellite data, water was visible in Lake Voui as late as 24 March 2023 (figure 103). The vent in the caldera showed a gas-and-steam plume drifted SE. On 3 April thermal activity was first detected, accompanied by a gas-and-ash plume that drifted W (figure 103). The lava flow moved N within the dry lake and was shown cooling by 8 April. By 23 April much of the water in the lake had returned. Occasional sulfur dioxide plumes were detected by the TROPOMI instrument on the Sentinel-5P satellite that exceeded 2 Dobson Units (DU) and drifted in different directions (figure 104).
Geologic Background. The island of Ambae, also known as Aoba, is a massive 2,500 km3 basaltic shield that is the most voluminous volcano of the New Hebrides archipelago. A pronounced NE-SW-trending rift zone with numerous scoria cones gives the 16 x 38 km island an elongated form. A broad pyroclastic cone containing three crater lakes (Manaro Ngoru, Voui, and Manaro Lakua) is located at the summit within the youngest of at least two nested calderas, the largest of which is 6 km in diameter. That large central edifice is also called Manaro Voui or Lombenben volcano. Post-caldera explosive eruptions formed the summit craters about 360 years ago. A tuff cone was constructed within Lake Voui (or Vui) about 60 years later. The latest known flank eruption, about 300 years ago, destroyed the population of the Nduindui area near the western coast.
Information Contacts: Geo-Hazards Division, Vanuatu Meteorology and Geo-Hazards Department (VMGD), Ministry of Climate Change Adaptation, Meteorology, Geo-Hazards, Energy, Environment and Disaster Management, Private Mail Bag 9054, Lini Highway, Port Vila, Vanuatu (URL: http://www.vmgd.gov.vu/, https://www.facebook.com/VanuatuGeohazardsObservatory/); Wellington Volcanic Ash Advisory Centre (VAAC), Meteorological Service of New Zealand Ltd (MetService), PO Box 722, Wellington, New Zealand (URL: http://www.metservice.com/vaac/, http://www.ssd.noaa.gov/VAAC/OTH/NZ/messages.html); MIROVA (Middle InfraRed Observation of Volcanic Activity), a collaborative project between the Universities of Turin and Florence (Italy) supported by the Centre for Volcanic Risk of the Italian Civil Protection Department (URL: http://www.mirovaweb.it/); Global Sulfur Dioxide Monitoring Page, Atmospheric Chemistry and Dynamics Laboratory, NASA Goddard Space Flight Center (NASA/GSFC), 8800 Greenbelt Road, Goddard, Maryland, USA (URL: https://so2.gsfc.nasa.gov/); Copernicus Browser, Copernicus Data Space Ecosystem, European Space Agency (URL: https://dataspace.copernicus.eu/browser/).
Ibu
Indonesia
1.488°N, 127.63°E; summit elev. 1325 m
All times are local (unless otherwise noted)
Daily ash explosions continue, along with thermal anomalies in the crater, October 2022-May 2023
Persistent eruptive activity since April 2008 at Ibu, a stratovolcano on Indonesian’s Halmahera Island, has consisted of daily explosive ash emissions and plumes, along with observations of thermal anomalies (BGVN 47:04). The current eruption continued during October 2022-May 2023, described below, based on advisories issued by the Pusat Vulkanologi dan Mitigasi Bencana Geologi (PVMBG, also known as Indonesian Center for Volcanology and Geological Hazard Mitigation, CVGHM), daily reports by MAGMA Indonesia (a PVMBG platform), and the Darwin Volcanic Ash Advisory Centre (VAAC), and various satellite data. The Alert Level during the reporting period remained at 2 (on a scale of 1-4), except raised briefly to 3 on 27 May, and the public was warned to stay at least 2 km away from the active crater and 3.5 km away on the N side of the volcano.
According to MAGMA Indonesia, during October 2022-May 2023, daily gray-and-white ash plumes of variable densities rose 200-1,000 m above the summit and drifted in multiple directions. On 30 October and 11 November, plumes rose a maximum of 2 km and 1.5 km above the summit, respectively (figures 42 and 43). According to the Darwin VAAC, discrete ash emissions on 13 November rose to 2.1 km altitude, or 800 m above the summit, and drifted W, and multiple ash emissions on 15 November rose 1.4 km above the summit and drifted NE. Occasional larger ash explosions through May 2023 prompted PVMBG to issue Volcano Observatory Notice for Aviation (VONA) alerts (table 6); the Aviation Color Code remained at Orange throughout this period.
Table 6. Volcano Observatory Notice for Aviation (VONA) ash plume alerts for Ibu issued by PVMBG during October 2022-May 2023. Maximum height above the summit was estimated by a ground observer. VONAs in January-May 2023 all described the ash plumes as dense.
| Date |
Time (local) |
Max height above summit |
Direction |
| 17 Oct 2022 |
0858 |
800 m |
SW |
| 18 Oct 2022 |
1425 |
800 m |
S |
| 19 Oct 2022 |
2017 |
600 m |
SW |
| 21 Oct 2022 |
0916 |
800 m |
NW |
| 16 Jan 2023 |
1959 |
600 m |
NE |
| 22 Jan 2023 |
0942 |
1,000 m |
E |
| 29 Jan 2023 |
2138 |
1,000 m |
E |
| 10 May 2023 |
0940 |
800 m |
NW |
| 10 May 2023 |
2035 |
600 m |
E |
| 21 May 2023 |
2021 |
600 m |
W |
| 21 May 2023 |
2140 |
1,000 m |
W |
| 29 May 2023 |
1342 |
800 m |
N |
| 31 May 2023 |
1011 |
1,000 m |
SW |
Sentinel-2 L1C satellite images throughout the reporting period show two, sometimes three persistent thermal anomalies in the summit crater, with the most prominent hotspot from the top of a cone within the crater. Clear views were more common during March-April 2023, when a vent and lava flows on the NE flank of the intra-crater cone could be distinguished (figure 44). White-to-grayish emissions were also observed during brief periods when weather clouds allowed clear views.
The MIROVA space-based volcano hotspot detection system recorded almost daily thermal anomalies throughout the reporting period, though cloud cover often interfered with detections. Data from imaging spectroradiometers aboard NASA’s Aqua and Terra satellites and processed using the MODVOLC algorithm (MODIS-MODVOLC) recorded hotspots on one day during October 2022 and December 2022, two days in April 2023, three days in November 2022 and May 2023, and four days in March 2023.
Geologic Background. The truncated summit of Gunung Ibu stratovolcano along the NW coast of Halmahera Island has large nested summit craters. The inner crater, 1 km wide and 400 m deep, has contained several small crater lakes. The 1.2-km-wide outer crater is breached on the N, creating a steep-walled valley. A large cone grew ENE of the summit, and a smaller one to the WSW has fed a lava flow down the W flank. A group of maars is located below the N and W flanks. The first observed and recorded eruption was a small explosion from the summit crater in 1911. Eruptive activity began again in December 1998, producing a lava dome that eventually covered much of the floor of the inner summit crater along with ongoing explosive ash emissions.
Information Contacts: Pusat Vulkanologi dan Mitigasi Bencana Geologi (PVMBG, also known as Indonesian Center for Volcanology and Geological Hazard Mitigation, CVGHM), Jalan Diponegoro 57, Bandung 40122, Indonesia (URL: http://www.vsi.esdm.go.id/); MAGMA Indonesia (Multiplatform Application for Geohazard Mitigation and Assessment in Indonesia), Kementerian Energi dan Sumber Daya Mineral (URL: https://magma.esdm.go.id/v1); Copernicus Browser, Copernicus Data Space Ecosystem, European Space Agency (URL: https://dataspace.copernicus.eu/browser/); MIROVA (Middle InfraRed Observation of Volcanic Activity), a collaborative project between the Universities of Turin and Florence (Italy) supported by the Centre for Volcanic Risk of the Italian Civil Protection Department (URL: http://www.mirovaweb.it/); Hawai'i Institute of Geophysics and Planetology (HIGP) - MODVOLC Thermal Alerts System, School of Ocean and Earth Science and Technology (SOEST), Univ. of Hawai'i, 2525 Correa Road, Honolulu, HI 96822, USA (URL: http://modis.higp.hawaii.edu/).
Dukono
Indonesia
1.6992°N, 127.8783°E; summit elev. 1273 m
All times are local (unless otherwise noted)
Continuing ash emissions, SO2 plumes, and thermal signals during October 2022-May 2023
Dukono, a remote volcano on Indonesia’s Halmahera Island, has been erupting continuously since 1933, with frequent ash explosions and sulfur dioxide plumes (BGVN 46:11, 47:10). This activity continued during October 2022 through May 2023, based on reports from the Pusat Vulkanologi dan Mitigasi Bencana Geologi (PVMBG; also known as Indonesian Center for Volcanology and Geological Hazard Mitigation, CVGHM), the Darwin Volcanic Ash Advisory Centre (VAAC), and satellite data. During this period, the Alert Level remained at 2 (on a scale of 1-4) and the public was warned to remain outside of the 2-km exclusion zone. The highest reported plume of the period reached 9.4 km above the summit on 14 November 2022.
According to MAGMA Indonesia (a platform developed by PVMBG), white, gray, or dark plumes of variable densities were observed almost every day during the reporting period, except when fog obscured the volcano (figure 33). Plumes generally rose 25-450 m above the summit, but rose as high as 700-800 m on several days, somewhat lower than the maximum heights reached earlier in 2022 when plumes reached as high as 1 km. However, the Darwin VAAC reported that on 14 November 2022, a discrete ash plume rose 9.4 km above the summit (10.7 km altitude), accompanied by a strong hotspot and a sulfur dioxide signal observed in satellite imagery; a continuous ash plume that day and through the 15th rose to 2.1-2.4 km altitude and drifted NE.
Sentinel-2 images were obscured by weather clouds almost every viewing day during the reporting period. However, the few reasonably clear images showed a hotspot and white or gray emissions and plumes. Strong SO2 plumes from Dukono were present on many days during October 2022-May 2023, as detected using the TROPOMI instrument on the Sentinel-5P satellite (figure 34).
Geologic Background. Reports from this remote volcano in northernmost Halmahera are rare, but Dukono has been one of Indonesia's most active volcanoes. More-or-less continuous explosive eruptions, sometimes accompanied by lava flows, have occurred since 1933. During a major eruption in 1550 CE, a lava flow filled in the strait between Halmahera and the N-flank Gunung Mamuya cone. This complex volcano presents a broad, low profile with multiple summit peaks and overlapping craters. Malupang Wariang, 1 km SW of the summit crater complex, contains a 700 x 570 m crater that has also been active during historical time.
Information Contacts: Pusat Vulkanologi dan Mitigasi Bencana Geologi (PVMBG, also known as Indonesian Center for Volcanology and Geological Hazard Mitigation, CVGHM), Jalan Diponegoro 57, Bandung 40122, Indonesia (URL: http://www.vsi.esdm.go.id/); MAGMA Indonesia (Multiplatform Application for Geohazard Mitigation and Assessment in Indonesia), Kementerian Energi dan Sumber Daya Mineral (URL: https://magma.esdm.go.id/v1); Darwin Volcanic Ash Advisory Centre (VAAC), Bureau of Meteorology, Northern Territory Regional Office, PO Box 40050, Casuarina, NT 0811, Australia (URL: http://www.bom.gov.au/info/vaac/); NASA Global Sulfur Dioxide Monitoring Page, Atmospheric Chemistry and Dynamics Laboratory, NASA Goddard Space Flight Center (NASA/GSFC), 8800 Greenbelt Road, Goddard, Maryland, USA (URL: https://so2.gsfc.nasa.gov/); Sentinel Hub Playground (URL: https://www.sentinel-hub.com/explore/sentinel-playground).
Sabancaya
Peru
15.787°S, 71.857°W; summit elev. 5960 m
All times are local (unless otherwise noted)
Explosions, gas-and-ash plumes, and thermal activity persist during November 2022-April 2023
Sabancaya is located in Peru, NE of Ampato and SE of Hualca Hualca. Eruptions date back to 1750 and have been characterized by explosions, phreatic activity, ash plumes, and ashfall. The current eruption period began in November 2016 and has more recently consisted of daily explosions, gas-and-ash plumes, and thermal activity (BGVN 47:11). This report updates activity during November 2022 through April 2023 using information from Instituto Geophysico del Peru (IGP) that use weekly activity reports and various satellite data.
Intermittent low-to-moderate power thermal anomalies were reported by the MIROVA project during November 2022 through April 2023 (figure 119). There were few short gaps in thermal activity during mid-December 2022, late December-to-early January 2023, late January to mid-February, and late February. According to data recorded by the MODVOLC thermal algorithm, there were a total of eight thermal hotspots: three in November 2022, three in February 2023, one in March, and one in April. On clear weather days, some of this thermal anomaly was visible in infrared satellite imagery showing the active lava dome in the summit crater (figure 120). Almost daily moderate-to-strong sulfur dioxide plumes were recorded during the reporting period by the TROPOMI instrument on the Sentinel-5P satellite (figure 121). Many of these plumes exceeded 2 Dobson Units (DU) and drifted in multiple directions.
IGP reported that moderate activity during November and December 2022 continued; during November, an average number of explosions were reported each week: 30, 33, 36, and 35, and during December, it was 32, 40, 47, 52, and 67. Gas-and-ash plumes in November rose 3-3.5 km above the summit and drifted E, NE, SE, S, N, W, and SW. During December the gas-and-ash plumes rose 2-4 km above the summit and drifted in different directions. There were 1,259 volcanic earthquakes recorded during November and 1,693 during December. Seismicity also included volcano-tectonic-type events that indicate rock fracturing events. Slight inflation was observed in the N part of the volcano near Hualca Hualca (4 km N). Thermal activity was frequently reported in the crater at the active lava dome (figure 120).
Explosive activity continued during January and February 2023. The average number of explosions were reported each week during January (51, 50, 60, and 59) and February (43, 54, 51, and 50). Gas-and-ash plumes rose 1.6-2.9 km above the summit and drifted NW, SW, and W during January and rose 1.4-2.8 above the summit and drifted W, SW, E, SE, N, S, NW, and NE during February. IGP also detected 1,881 volcanic earthquakes during January and 1,661 during February. VT-type earthquakes were also reported. Minor inflation persisted near Hualca Hualca. Satellite imagery showed continuous thermal activity in the crater at the lava dome (figure 120).
During March, the average number of explosions each week was 46, 48, 31, 35, and 22 and during April, it was 29, 41, 31, and 27. Accompanying gas-and-ash plumes rose 1.7-2.6 km above the summit crater and drifted W, SW, NW, S, and SE during March. According to a Buenos Aires Volcano Ash Advisory Center (VAAC) notice, on 22 March at 1800 through 23 March an ash plume rose to 7 km altitude and drifted NW. By 0430 an ash plume rose to 7.6 km altitude and drifted W. On 24 and 26 March continuous ash emissions rose to 7.3 km altitude and drifted SW and on 28 March ash emissions rose to 7.6 km altitude. During April, gas-and-ash plumes rose 1.6-2.5 km above the summit and drifted W, SW, S, NW, NE, and E. Frequent volcanic earthquakes were recorded, with 1,828 in March and 1,077 in April, in addition to VT-type events. Thermal activity continued to be reported in the summit crater at the lava dome (figure 120).
Geologic Background. Sabancaya, located in the saddle NE of Ampato and SE of Hualca Hualca volcanoes, is the youngest of these volcanic centers and the only one to have erupted in historical time. The oldest of the three, Nevado Hualca Hualca, is of probable late-Pliocene to early Pleistocene age. The name Sabancaya (meaning "tongue of fire" in the Quechua language) first appeared in records in 1595 CE, suggesting activity prior to that date. Holocene activity has consisted of Plinian eruptions followed by emission of voluminous andesitic and dacitic lava flows, which form an extensive apron around the volcano on all sides but the south. Records of historical eruptions date back to 1750.
Information Contacts: Instituto Geofisico del Peru (IGP), Centro Vulcanológico Nacional (CENVUL), Calle Badajoz N° 169 Urb. Mayorazgo IV Etapa, Ate, Lima 15012, Perú (URL: https://www.igp.gob.pe/servicios/centro-vulcanologico-nacional/inicio); Buenos Aires Volcanic Ash Advisory Center (VAAC), Servicio Meteorológico Nacional-Fuerza Aérea Argentina, 25 de mayo 658, Buenos Aires, Argentina (URL: http://www.smn.gov.ar/vaac/buenosaires/inicio.php); MIROVA (Middle InfraRed Observation of Volcanic Activity), a collaborative project between the Universities of Turin and Florence (Italy) supported by the Centre for Volcanic Risk of the Italian Civil Protection Department (URL: http://www.mirovaweb.it/); Hawai'i Institute of Geophysics and Planetology (HIGP) - MODVOLC Thermal Alerts System, School of Ocean and Earth Science and Technology (SOEST), Univ. of Hawai'i, 2525 Correa Road, Honolulu, HI 96822, USA (URL: http://modis.higp.hawaii.edu/); NASA Global Sulfur Dioxide Monitoring Page, Atmospheric Chemistry and Dynamics Laboratory, NASA Goddard Space Flight Center (NASA/GSFC), 8800 Greenbelt Road, Goddard MD 20771, USA (URL: https://so2.gsfc.nasa.gov/); Copernicus Browser, Copernicus Data Space Ecosystem, European Space Agency (URL: https://dataspace.copernicus.eu/browser/).
Sheveluch
Russia
56.653°N, 161.36°E; summit elev. 3283 m
All times are local (unless otherwise noted)
Significant explosions destroyed part of the lava-dome complex during April 2023
Sheveluch (also spelled Shiveluch) in Kamchatka, has had at least 60 large eruptions during the last 10,000 years. The summit is truncated by a broad 9-km-wide caldera that is breached to the S, and many lava domes occur on the outer flanks. The lava dome complex was constructed within the large open caldera. Frequent collapses of the dome complex have produced debris avalanches; the resulting deposits cover much of the caldera floor. A major south-flank collapse during a 1964 Plinian explosion produced a scarp in which a “Young Sheveluch” dome began to form in 1980. Repeated episodes of dome formation and destruction since then have produced major and minor ash plumes, pyroclastic flows, block-and-ash flows, and “whaleback domes” of spine-like extrusions in 1993 and 2020 (BGVN 45:11). The current eruption period began in August 1999 and has more recently consisted of lava dome growth, explosions, ash plumes, and avalanches (BGVN 48:01). This report covers a significant explosive eruption during early-to-mid-April 2023 that generated a 20 km altitude ash plume, produced a strong sulfur dioxide plume, and destroyed part of the lava-dome complex; activity described during January through April 2023 use information primarily from the Kamchatka Volcanic Eruptions Response Team (KVERT) and various satellite data.
Satellite data. Activity during the majority of this reporting period was characterized by continued lava dome growth, strong fumarole activity, explosions, and hot avalanches. According to the MODVOLC Thermal Alerts System, 140 hotspots were detected through the reporting period, with 33 recorded in January 2023, 29 in February, 44 in March, and 34 in April. Frequent strong thermal activity was recorded during January 2023 through April, according to the MIROVA (Middle InfraRed Observation of Volcanic Activity) graph and resulted from the continuously growing lava dome (figure 94). A slightly stronger pulse in thermal activity was detected in early-to-mid-April, which represented the significant eruption that destroyed part of the lava-dome complex. Thermal anomalies were also visible in infrared satellite imagery at the summit crater (figure 95).
During January 2023 KVERT reported continued growth of the lava dome, accompanied by strong fumarolic activity, incandescence from the lava dome, explosions, ash plumes, and avalanches. Satellite data showed a daily thermal anomaly over the volcano. Video data showed ash plumes associated with collapses at the dome that generated avalanches that in turn produced ash plumes rising to 3.5 km altitude and drifting 40 km W on 4 January and rising to 7-7.5 km altitude and drifting 15 km SW on 5 January. A gas-and-steam plume containing some ash that was associated with avalanches rose to 5-6 km altitude and extended 52-92 km W on 7 January. Explosions that same day produced ash plumes that rose to 7-7.5 km altitude and drifted 10 km W. According to a Volcano Observatory Notice for Aviation (VONA) issued at 1344 on 19 January, explosions produced an ash cloud that was 15 x 25 km in size and rose to 9.6-10 km altitude, drifting 21-25 km W; as a result, the Aviation Color Code (ACC) was raised to Red (the highest level on a four-color scale). Another VONA issued at 1635 reported that no more ash plumes were observed, and the ACC was lowered to Orange (the second highest level on a four-color scale). On 22 January an ash plume from collapses and avalanches rose to 5 km altitude and drifted 25 km NE and SW; ash plumes associated with collapses extended 70 km NE on 27 and 31 January.
Lava dome growth, fumarolic activity, dome incandescence, and occasional explosions and avalanches continued during February and March. A daily thermal anomaly was visible in satellite data. Explosions on 1 February generated ash plumes that rose to 6.3-6.5 km altitude and extended 15 km NE. Video data showed an ash cloud from avalanches rising to 5.5 km altitude and drifting 5 km SE on 2 February. Satellite data showed gas-and-steam plumes containing some ash rose to 5-5.5 km altitude and drifted 68-110 km ENE and NE on 6 February, to 4.5-5 km altitude and drifted 35 km WNW on 22 February, and to 3.7-4 km altitude and drifted 47 km NE on 28 February. Scientists from the Kamchatka Volcanological Station (KVS) went on a field excursion on 25 February to document the growing lava dome, and although it was cloudy most of the day, nighttime incandescence was visible. Satellite data showed an ash plume extending up to 118 km E during 4-5 March. Video data from 1150 showed an ash cloud from avalanches rose to 3.7-5.5 km altitude and drifted 5-10 km ENE and E on 5 March. On 11 March an ash plume drifted 62 km E. On 27 March ash plumes rose to 3.5 km altitude and drifted 100 km E. Avalanches and constant incandescence at the lava dome was focused on the E and NE slopes on 28 March. A gas-and-steam plume containing some ash rose to 3.5 km altitude and moved 40 km E on 29 March. Ash plumes on 30 March rose to 3.5-3.7 km altitude and drifted 70 km NE.
Similar activity continued during April, with lava dome growth, strong fumarolic activity, incandescence in the dome, occasional explosions, and avalanches. A thermal anomaly persisted throughout the month. During 1-4 April weak ash plumes rose to 2.5-3 km altitude and extended 13-65 km SE and E.
Activity during 11 April 2023. The Institute of Volcanology and Seismology, Far Eastern Branch, Russian Academy of Sciences (IVS FEB RAS) reported a significant increase in seismicity around 0054 on 11 April, as reported by strong explosions detected on 11 April beginning at 0110 that sent ash plumes up to 7-10 km altitude and extended 100-435 km W, WNW, NNW, WSW, and SW. According to a Tokyo VAAC report the ash plume rose to 15.8 km altitude. By 0158 the plume extended over a 75 x 100 km area. According to an IVS FEB RAS report, the eruptive column was not vertical: the initial plume at 0120 on 11 April deviated to the NNE, at 0000 on 12 April, it drifted NW, and by 1900 it drifted SW. KVS reported that significant pulses of activity occurred at around 0200, 0320, and then a stronger phase around 0600. Levin Dmitry took a video from near Békés (3 km away) at around 0600 showing a rising plume; he also reported that a pyroclastic flow traveled across the road behind him as he left the area. According to IVS FEB RAS, the pyroclastic flow traveled several kilometers SSE, stopping a few hundred meters from a bridge on the road between Klyuchi and Petropavlovsk-Kamchatsky.
Ashfall was first observed in Klyuchi (45 km SW) at 0630, and a large, black ash plume blocked light by 0700. At 0729 KVERT issued a Volcano Observatory Notice for Aviation (VONA) raising the Aviation Color Code to Red (the highest level on a four-color scale). It also stated that a large ash plume had risen to 10 km altitude and drifted 100 km W. Near-constant lightning strikes were reported in the plume and sounds like thunderclaps were heard until about 1000. According to IVS FEB RAS the cloud was 200 km long and 76 km wide by 0830, and was spreading W at altitudes of 6-12 km. In the Klyuchi Village, the layer of both ash and snow reached 8.5 cm (figure 96); ashfall was also reported in Kozyrevsk (112 km SW) at 0930, Mayskoye, Anavgay, Atlasovo, Lazo, and Esso. Residents in Klyuchi reported continued darkness and ashfall at 1100. In some areas, ashfall was 6 cm deep and some residents reported dirty water coming from their plumbing. According to IVS FEB RAS, an ash cloud at 1150 rose to 5-20 km altitude and was 400 km long and 250 km wide, extending W. A VONA issued at 1155 reported that ash had risen to 10 km and drifted 340 km NNW and 240 km WSW. According to Simon Carn (Michigan Technological University), about 0.2 Tg of sulfur dioxide in the plume was measured in a satellite image from the TROPOMI instrument on the Sentinel-5P satellite acquired at 1343 that covered an area of about 189,000 km2 (figure 97). Satellite data at 1748 showed an ash plume that rose to 8 km altitude and drifted 430 km WSW and S, according to a VONA.
Activity during 12-15 April 2023. On 12 April at 0730 satellite images showed ash plumes rose to 7-8 km altitude and extended 600 km SW, 1,050 km ESE, and 1,300-3,000 km E. By 1710 that day, the explosions weakened. According to news sources, the ash-and-gas plumes drifted E toward the Aleutian Islands and reached the Gulf of Alaska by 13 April, causing flight disruptions. More than 100 flights involving Alaska airspace were cancelled due to the plume. Satellite data showed ash plumes rising to 4-5.5 km altitude and drifted 400-415 km SE and ESE on 13 April. KVS volcanologists observed the pyroclastic flow deposits and noted that steam rose from downed, smoldering trees. They also noted that the deposits were thin with very few large fragments, which differed from previous flows. The ash clouds traveled across the Pacific Ocean. Flight cancellations were also reported in NW Canada (British Columbia) during 13-14 April. During 14-15 April ash plumes rose to 6 km altitude and drifted 700 km NW.
Alaskan flight schedules were mostly back to normal by 15 April, with only minor delays and far less cancellations; a few cancellations continued to be reported in Canada. Clear weather on 15 April showed that most of the previous lava-dome complex was gone and a new crater roughly 1 km in diameter was observed (figure 98); gas-and-steam emissions were rising from this crater. Evidence suggested that there had been a directed blast to the SE, and pyroclastic flows traveled more than 20 km. An ash plume rose to 4.5-5.2 km altitude and drifted 93-870 km NW on 15 April.
Activity during 16-30 April 2023. Resuspended ash was lifted by the wind from the slopes and rose to 4 km altitude and drifted 224 km NW on 17 April. KVERT reported a plume of resuspended ash from the activity during 10-13 April on 19 April that rose to 3.5-4 km altitude and drifted 146-204 km WNW. During 21-22 April a plume stretched over the Scandinavian Peninsula. A gas-and-steam plume containing some ash rose to 3-3.5 km altitude and drifted 60 km SE on 30 April. A possible new lava dome was visible on the W slope of the volcano on 29-30 April (figure 99); satellite data showed two thermal anomalies, a bright one over the existing lava dome and a weaker one over the possible new one.
References. Girina, O., Loupian, E., Horvath, A., Melnikov, D., Manevich, A., Nuzhdaev, A., Bril, A., Ozerov, A., Kramareva, L., Sorokin, A., 2023, Analysis of the development of the paroxysmal eruption of Sheveluch volcano on April 10–13, 2023, based on data from various satellite systems, ??????????? ???????? ??? ?? ???????, 20(2).
Geologic Background. The high, isolated massif of Sheveluch volcano (also spelled Shiveluch) rises above the lowlands NNE of the Kliuchevskaya volcano group. The 1,300 km3 andesitic volcano is one of Kamchatka's largest and most active volcanic structures, with at least 60 large eruptions during the Holocene. The summit of roughly 65,000-year-old Stary Shiveluch is truncated by a broad 9-km-wide late-Pleistocene caldera breached to the south. Many lava domes occur on its outer flanks. The Molodoy Shiveluch lava dome complex was constructed during the Holocene within the large open caldera; Holocene lava dome extrusion also took place on the flanks of Stary Shiveluch. Widespread tephra layers from these eruptions have provided valuable time markers for dating volcanic events in Kamchatka. Frequent collapses of dome complexes, most recently in 1964, have produced debris avalanches whose deposits cover much of the floor of the breached caldera.
Information Contacts: Kamchatka Volcanic Eruptions Response Team (KVERT), Far Eastern Branch, Russian Academy of Sciences, 9 Piip Blvd., Petropavlovsk-Kamchatsky, 683006, Russia (URL: http://www.kscnet.ru/ivs/kvert/); Institute of Volcanology and Seismology, Far Eastern Branch, Russian Academy of Sciences (IVS FEB RAS), 9 Piip Blvd., Petropavlovsk-Kamchatsky 683006, Russia (URL: http://www.kscnet.ru/ivs/eng/); Kamchatka Volcanological Station, Kamchatka Branch of Geophysical Survey, (KB GS RAS), Klyuchi, Kamchatka Krai, Russia (URL: http://volkstat.ru/); Hawai'i Institute of Geophysics and Planetology (HIGP) - MODVOLC Thermal Alerts System, School of Ocean and Earth Science and Technology (SOEST), Univ. of Hawai'i, 2525 Correa Road, Honolulu, HI 96822, USA (URL: http://modis.higp.hawaii.edu/); MIROVA (Middle InfraRed Observation of Volcanic Activity), a collaborative project between the Universities of Turin and Florence (Italy) supported by the Centre for Volcanic Risk of the Italian Civil Protection Department (URL: http://www.mirovaweb.it/); Copernicus Browser, Copernicus Data Space Ecosystem, European Space Agency (URL: https://dataspace.copernicus.eu/browser/); Kam 24 News Agency, 683032, Kamchatka Territory, Petropavlovsk-Kamchatsky, Vysotnaya St., 2A (URL: https://kam24.ru/news/main/20230411/96657.html#.Cj5Jrky6.dpuf); Simon Carn, Geological and Mining Engineering and Sciences, Michigan Technological University, 1400 Townsend Drive, Houghton, MI 49931, USA (URL: http://www.volcarno.com/, Twitter: @simoncarn).
Bezymianny
Russia
55.972°N, 160.595°E; summit elev. 2882 m
All times are local (unless otherwise noted)
Explosions, ash plumes, lava flows, and avalanches during November 2022-April 2023
Bezymianny is located on the Kamchatka Peninsula of Russia as part of the Klyuchevskoy volcano group. Historic eruptions began in 1955 and have been characterized by dome growth, explosions, pyroclastic flows, ash plumes, and ashfall. During the 1955-56 eruption a large open crater was formed by collapse of the summit and an associated lateral blast. Subsequent episodic but ongoing lava-dome growth, accompanied by intermittent explosive activity and pyroclastic flows, has largely filled the 1956 crater. The current eruption period began in December 2016 and more recent activity has consisted of strong explosions, ash plumes, and thermal activity (BGVN 47:11). This report covers activity during November 2022 through April 2023, based on weekly and daily reports from the Kamchatka Volcano Eruptions Response Team (KVERT) and satellite data.
Activity during November and March 2023 was relatively low and mostly consisted of gas-and-steam emissions, occasional small collapses that generated avalanches along the lava dome slopes, and a persistent thermal anomaly over the volcano that was observed in satellite data on clear weather days. According to the Tokyo VAAC and KVERT, an explosion produced an ash plume that rose to 6 km altitude and drifted 25 km NE at 1825 on 29 March.
Gas-and-steam emissions, collapses generating avalanches, and thermal activity continued during April. According to two Volcano Observatory Notice for Aviation (VONA) issued on 2 and 6 April (local time) ash plumes rose to 3 km and 3.5-3.8 km altitude and drifted 35 km E and 140 km E, respectively. Satellite data from KVERT showed weak ash plumes extending up to 550 km E on 2 and 5-6 April.
A VONA issued at 0843 on 7 April described an ash plume that rose to 4.5-5 km altitude and drifted 250 km ESE. Later that day at 1326 satellite data showed an ash plume that rose to 5.5-6 km altitude and drifted 150 km ESE. A satellite image from 1600 showed an ash plume extending as far as 230 km ESE; KVERT noted that ash emissions were intensifying, likely due to avalanches from the growing lava dome. The Aviation Color Code (ACC) was raised to Red (the highest level on a four-color scale). At 1520 satellite data showed an ash plume rising to 5-5.5 km altitude and drifting 230 km ESE. That same day, Kamchatka Volcanological Station (KVS) volcanologists traveled to Ambon to collect ash; they reported that a notable eruption began at 1730, and within 20 minutes a large ash plume rose to 10 km altitude and drifted NW. KVERT reported that the strong explosive phase began at 1738. Video and satellite data taken at 1738 showed an ash plume that rose to 10-12 km altitude and drifted up to 2,800 km SE and E. Explosions were clearly audible 20 km away for 90 minutes, according to KVS. Significant amounts of ash fell at the Apakhonchich station, which turned the snow gray; ash continued to fall until the morning of 8 April. In a VONA issued at 0906 on 8 April, KVERT stated that the explosive eruption had ended; ash plumes had drifted 2,000 km E. The ACC was lowered to Orange (the third highest level on a four-color scale). The KVS team saw a lava flow on the active dome once the conditions were clear that same day (figure 53). On 20 April lava dome extrusion was reported; lava flows were noted on the flanks of the dome, and according to KVERT satellite data, a thermal anomaly was observed in the area. The ACC was lowered to Yellow (the second lowest on a four-color scale).
Satellite data showed an increase in thermal activity beginning in early April 2023. A total of 31 thermal hotspots were detected by the MODVOLC thermal algorithm on 4, 5, 7, and 12 April 2023. The elevated thermal activity resulted from an increase in explosive activity and the start of an active lava flow. The MIROVA (Middle InfraRed Observation of Volcanic Activity) volcano hotspot detection system based on the analysis of MODIS data also showed a pulse in thermal activity during the same time (figure 54). Infrared satellite imagery captured a continuous thermal anomaly at the summit crater, often accompanied by white gas-and-steam emissions (figure 55). On 4 April 2023 an active lava flow was observed descending the SE flank.
Geologic Background. The modern Bezymianny, much smaller than its massive neighbors Kamen and Kliuchevskoi on the Kamchatka Peninsula, was formed about 4,700 years ago over a late-Pleistocene lava-dome complex and an edifice built about 11,000-7,000 years ago. Three periods of intensified activity have occurred during the past 3,000 years. The latest period, which was preceded by a 1,000-year quiescence, began with the dramatic 1955-56 eruption. This eruption, similar to that of St. Helens in 1980, produced a large open crater that was formed by collapse of the summit and an associated lateral blast. Subsequent episodic but ongoing lava-dome growth, accompanied by intermittent explosive activity and pyroclastic flows, has largely filled the 1956 crater.
Information Contacts: Kamchatka Volcanic Eruptions Response Team (KVERT), Far Eastern Branch, Russian Academy of Sciences, 9 Piip Blvd., Petropavlovsk-Kamchatsky, 683006, Russia (URL: http://www.kscnet.ru/ivs/kvert/); Kamchatka Volcanological Station, Kamchatka Branch of Geophysical Survey, (KB GS RAS), Klyuchi, Kamchatka Krai, Russia (URL: http://volkstat.ru/); Hawai'i Institute of Geophysics and Planetology (HIGP) - MODVOLC Thermal Alerts System, School of Ocean and Earth Science and Technology (SOEST), Univ. of Hawai'i, 2525 Correa Road, Honolulu, HI 96822, USA (URL: http://modis.higp.hawaii.edu/); MIROVA (Middle InfraRed Observation of Volcanic Activity), a collaborative project between the Universities of Turin and Florence (Italy) supported by the Centre for Volcanic Risk of the Italian Civil Protection Department (URL: http://www.mirovaweb.it/); Copernicus Browser, Copernicus Data Space Ecosystem, European Space Agency (URL: https://dataspace.copernicus.eu/browser/).
Chikurachki
Russia
50.324°N, 155.461°E; summit elev. 1781 m
All times are local (unless otherwise noted)
New explosive eruption during late January-early February 2023
Chikurachki, located on Paramushir Island in the northern Kuriles, has had Plinian eruptions during the Holocene. Lava flows have reached the sea and formed capes on the NW coast; several young lava flows are also present on the E flank beneath a scoria deposit. Reported eruptions date back to 1690, with the most recent eruption period occurring during January through October 2022, characterized by occasional explosions, ash plumes, and thermal activity (BGVN 47:11). This report covers a new eruptive period during January through February 2023 that consisted of ash explosions and ash plumes, based on information from the Kamchatka Volcanic Eruptions Response Team (KVERT) and satellite data.
According to reports from KVERT, an explosive eruption began around 0630 on 29 January. Explosions generated ash plumes that rose to 3-3.5 km altitude and drifted 6-75 km SE and E, based on satellite data. As a result, the Aviation Color Code (ACC) was raised to Orange (the second highest level on a four-color scale). At 1406 and 1720 ash plumes were identified in satellite images that rose to 4.3 km altitude and extended 70 km E. By 2320 the ash plume had dissipated. A thermal anomaly was visible at the volcano on 31 January, according to a satellite image, and an ash plume was observed drifting 66 km NE.
Occasional explosions and ash plumes continued during early February. At 0850 on 1 February an ash plume rose to 3.5 km altitude and drifted 35 km NE. Satellite data showed an ash plume that rose to 3.2-3.5 km altitude and drifted 50 km NE at 1222 later that day (figure 22). A thermal anomaly was detected over the volcano during 5-6 February and ash plumes drifted as far as 125 km SE, E, and NE. Explosive events were reported at 0330 on 6 February that produced ash plumes rising to 4-4.5 km altitude and drifting 72-90 km N, NE, and ENE. KVERT noted that the last gas-and steam plume that contained some ash was observed on 8 February and drifted 55 km NE before the explosive eruption ended. The ACC was lowered to Yellow and then Green (the lowest level on a four-color scale) on 18 February.
Geologic Background. Chikurachki, the highest volcano on Paramushir Island in the northern Kuriles, is a relatively small cone constructed on a high Pleistocene edifice. Oxidized basaltic-to-andesitic scoria deposits covering the upper part of the young cone give it a distinctive red color. Frequent basaltic Plinian eruptions have occurred during the Holocene. Lava flows have reached the sea and formed capes on the NW coast; several young lava flows are also present on the E flank beneath a scoria deposit. The Tatarinov group of six volcanic centers is located immediately to the south, and the Lomonosov cinder cone group, the source of an early Holocene lava flow that reached the saddle between it and Fuss Peak to the west, lies at the southern end of the N-S-trending Chikurachki-Tatarinov complex. In contrast to the frequently active Chikurachki, the Tatarinov centers are extensively modified by erosion and have a more complex structure. Tephrochronology gives evidence of an eruption around 1690 CE from Tatarinov, although its southern cone contains a sulfur-encrusted crater with fumaroles that were active along the margin of a crater lake until 1959.
Information Contacts: Kamchatka Volcanic Eruptions Response Team (KVERT), Far East Division, Russian Academy of Sciences, 9 Piip Blvd., Petropavlovsk-Kamchatsky, 683006, Russia (URL: http://www.kscnet.ru/ivs/); Copernicus Browser, Copernicus Data Space Ecosystem, European Space Agency (URL: https://dataspace.copernicus.eu/browser/).
Search Bulletin Archive by Publication Date
Select a month and year from the drop-downs and click "Show Issue" to have that issue displayed in this tab.
The default month and year is the latest issue available.
Bulletin of the Global Volcanism Network - Volume 34, Number 02 (February 2009)
Managing Editor: Richard Wunderman
Curtis Island (New Zealand)
Acoustic data indicates possible nearby volcanic activity
Fournaise, Piton de la (France)
Quiet after April 2007 eruption; new eruption in September 2008
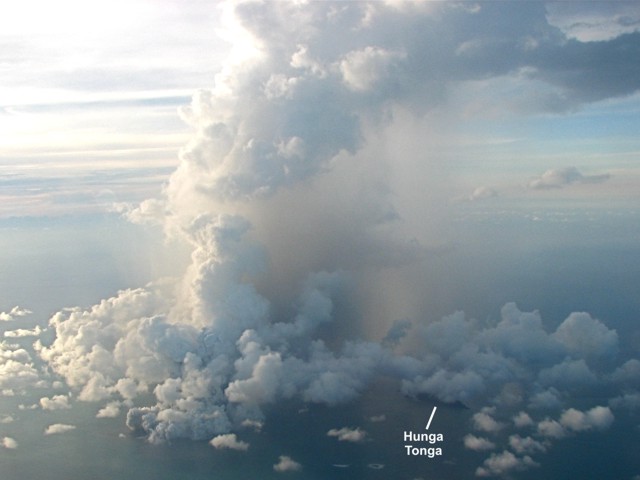
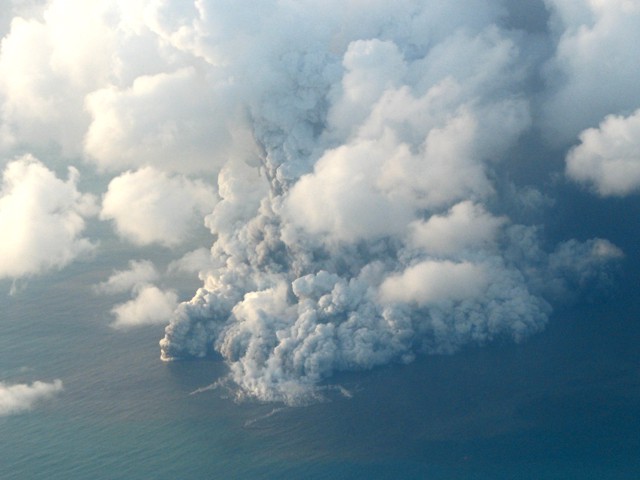
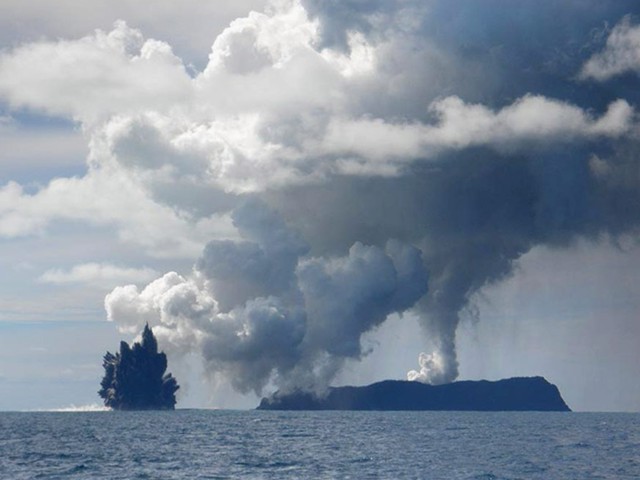
Hunga Tonga-Hunga Ha'apai (Tonga)
Eruption from two vents on 17 March 2009 creates new land
Ijen (Indonesia)
Visual, geochemical, and geophysical observations during mid-2008
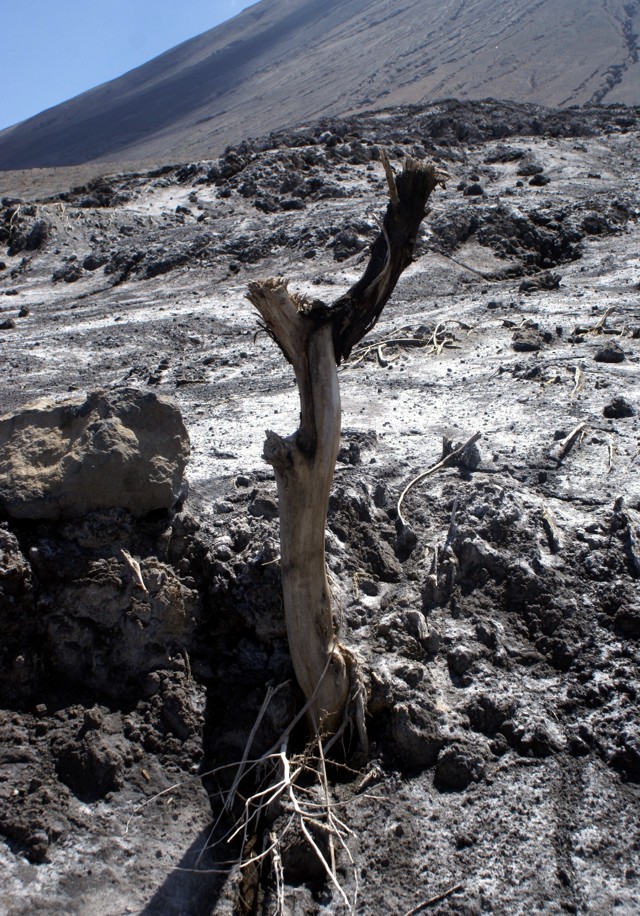
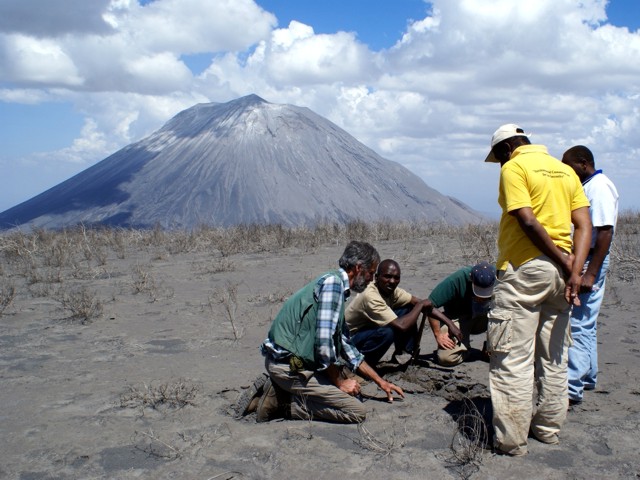
Lengai, Ol Doinyo (Tanzania)
Comparative quiet during mid-2008 into January 2009
Mayon (Philippines)
Mild phreatic explosion with ash plume on 10 August 2008
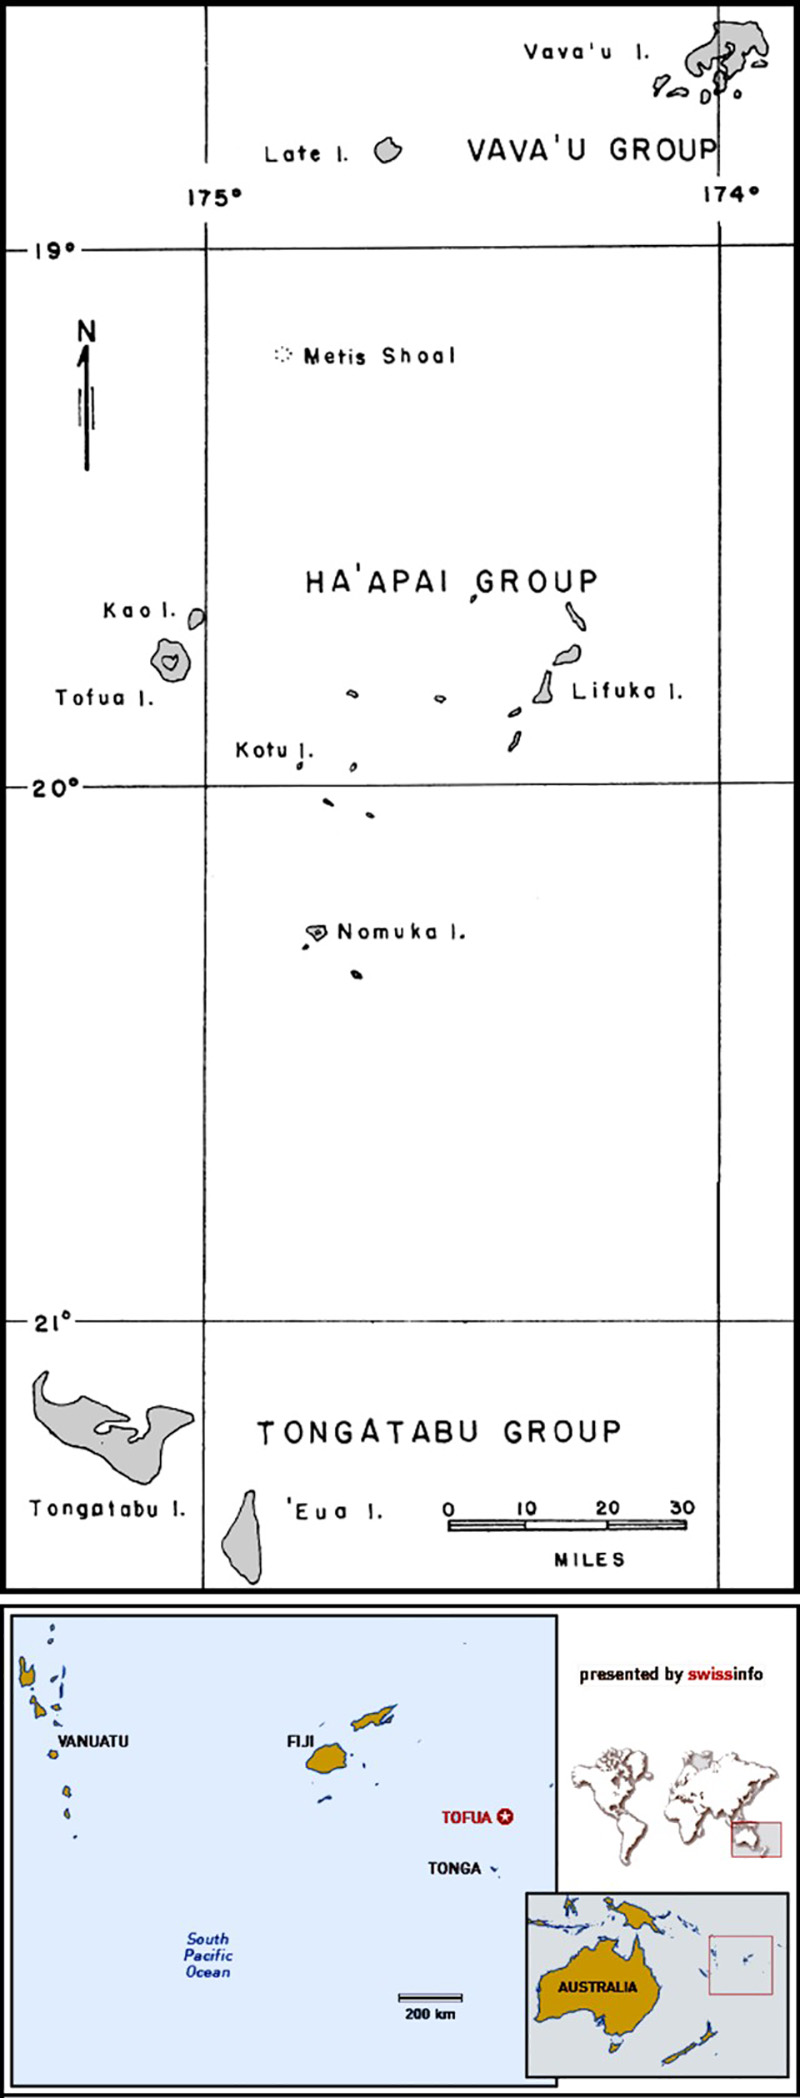
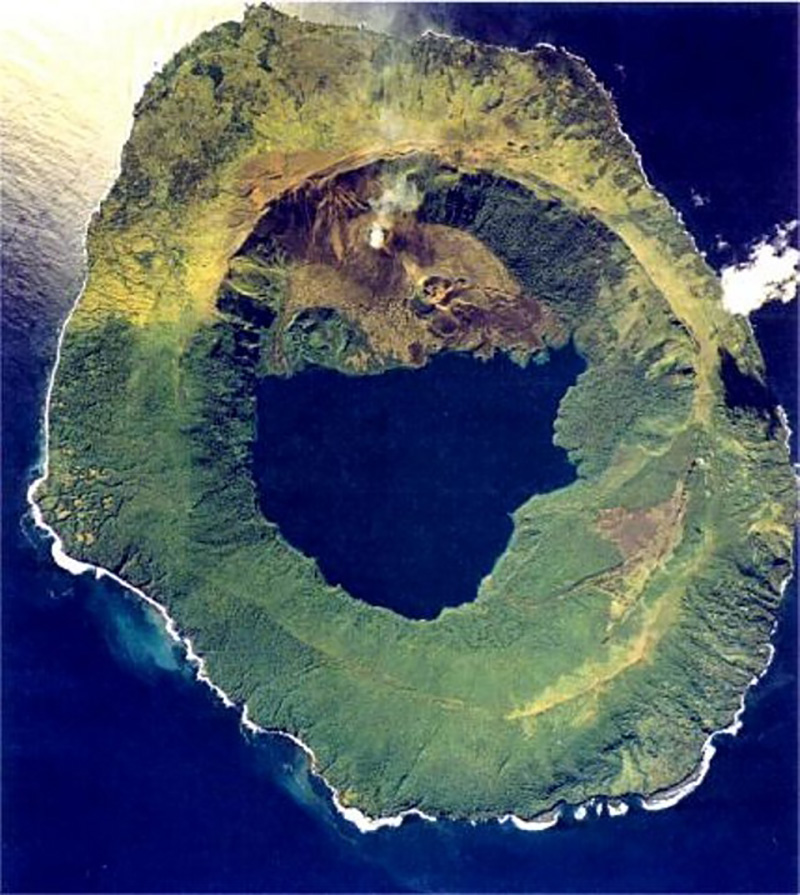
Tofua (Tonga)
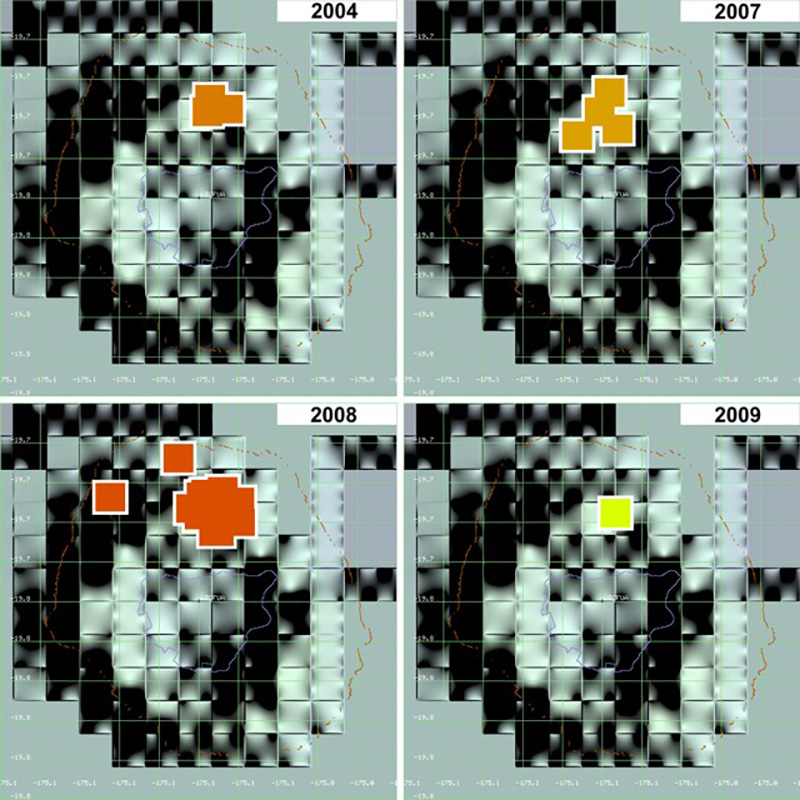
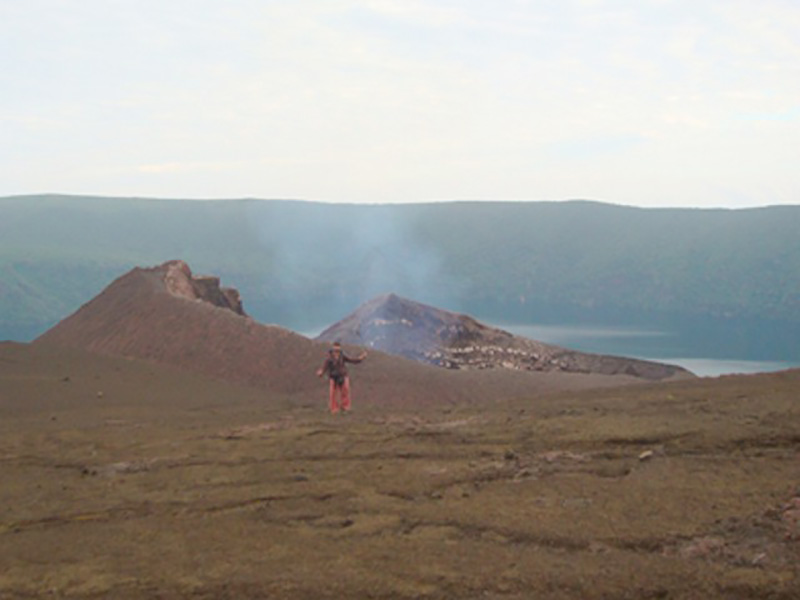
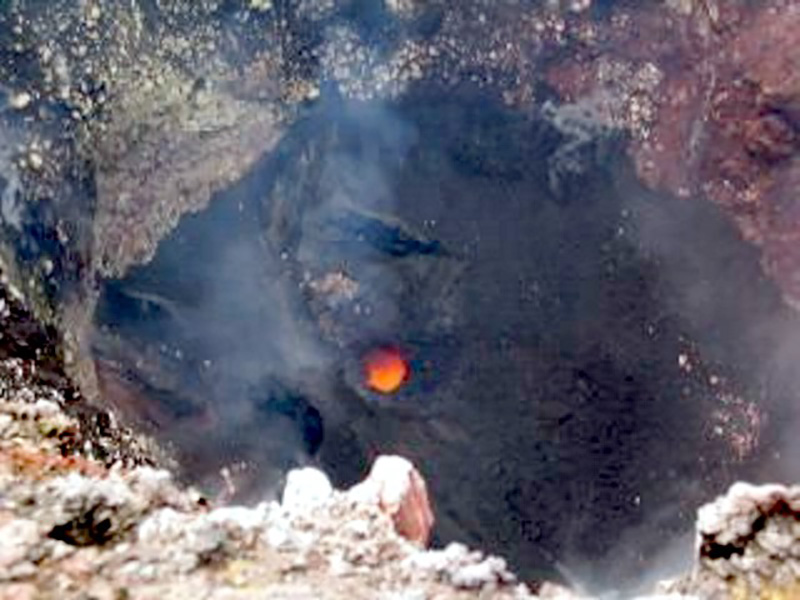
Intermittent observations and thermal alerts in 2004 and 2007-2009 indicate activity
Curtis Island (New Zealand) — February 2009 Cite this Report
Curtis Island
New Zealand
30.543°S, 178.556°W; summit elev. 47 m
All times are local (unless otherwise noted)
Acoustic data indicates possible nearby volcanic activity
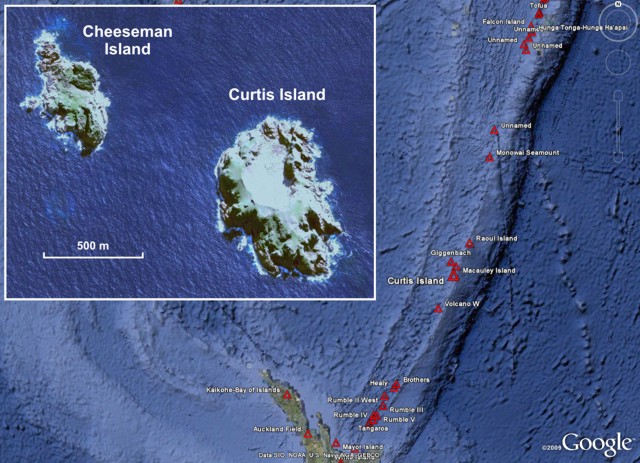
Olivier Hyvernaud reported that recent T-phase waves, recorded by the Laboratoire de Géophysique in Tahiti, originated from near Curtis Island (figure 1) and had waveforms suggesting a volcanic origin. The first of these hydroacoustic waves recorded on the Polynesian seismic network were a brief swarm of seven short strong events on 17 January 2009. On that day the network received the signals between 1706 and 1717 UTC. In addition, a single event was received 19 January 2009 at 0753 UTC. The best preliminary location for these events was 30.49°S, 178.55°W, a position 5-6 km NNE of Curtis Island and well within the area of the larger caldera structure.
On the New Zealand GNS Science website there is a brief discussion and two photos of Curtis Island, noting a short visit there, thermal activity, nearby mineral-rich volcanoes, and that it lies adjacent to a chain of submarine volcanoes (eg. Smith, 1988). They also stated "The benefit in studying this remote outcrop is the insight it gives into the composition of these underwater vents, while being relatively straightforward to measure in comparison."
On 1 April 2009 Brad Scott (GNS) added that they were not aware of any activity at this time. The island is remote and GNS personnel do not visit on a regular basis. The activity on the island is solfataric. He also noted that the island is composed of pyroclastic-flow (ignimbrites) deposits from an unknown nearby source.
No thermal alerts have been measured by the MODVOLC system for Curtis Island since at least the beginning of 2004 and through 1 April 2009.
References. Smith, I., 1988, The geochemistry of rock and water samples from Curtis Island volcano, Kermadec group, southwest Pacific: Journal of Volcanology and Geothermal Research, v. 34, no. 3-4, p. 233-240.
Geologic Background. Curtis and nearby Cheeseman Islands are the emergent portions of a submarine volcano along the Kermadec Ridge. The age of the small islands are considered to be Pleistocene, and rocks consist dominantly, if not entirely, of andesitic pyroclastic-flow deposits (Lloyd, 1992). Curtis Island, 500 x 800 m, contains a large fumarolically active crater whose floor is only 10 m above sea level. Reports of possible eruptions probably represent increased thermal activity. Geologic studies have documented 18 m of uplift during the past 200 years, with 7 m occurred between 1929 and 1964 (Doyle et al., 1979). An active submarine magmatic or solfataric vent is believed to exist nearby, but its activity cannot unequivocally be associated with the volcano (Lloyd, 1992).
Information Contacts: GNS Science, Wairakei Research Centre, Private Bag 2000, Taupo 3352, New Zealand (URL: http://www.gns.cri.nz/); Olivier Hyvernaud, Laboratoire de Géophysique, Commissariat a l'Energie Atomique (CEA/DASE/LDG), PO Box 640, Papeete, Tahiti, French Polynesia; Hawai'i Institute of Geophysics and Planetology (HIGP) Thermal Alerts System, School of Ocean and Earth Science and Technology (SOEST), Univ. of Hawai'i, 2525 Correa Road, Honolulu, HI 96822, USA (URL: http://modis.higp.hawaii.edu/).
Piton de la Fournaise (France) — February 2009 Cite this Report
Piton de la Fournaise
France
21.244°S, 55.708°E; summit elev. 2632 m
All times are local (unless otherwise noted)
Quiet after April 2007 eruption; new eruption in September 2008
This report summarizes the caldera collapse and extensive lava effusion at Piton de la Fournaise (PdF) during May-June 2007 and events beginning in August 2008, which led to a new eruption on 12 September 2008. Additional eruptive activity and unrest continued into January 2009.
Observations from 2007. A caldera collapse during early April 2007 (BGVN 32:12) deepened and enlarged to a depth of 350-360 m to engulf most of the Dolomieu crater floor. Peltier and others (2007; and in press) noted that the area of collapse encompassed 82 x 104 m2, an area 11% larger than the crater prior to April 2007. Post-collapse calculations by the Observatoire Volcanologique du Piton de la Fournaise / Institut de Physique du Globe de Paris (OVPDLF/IPGP) indicated that the caldera's downward movement involved a volume of 120 million cubic meters. On the SE flank lava flows up to 30-40 m thick and covered an estimated 4 km2, making this event one of PdF's largest historical eruptions. The collapse changed the stability of the summit massif; as a result, during most of 2007, access to Dolomieu was prohibited due to the high risk of collapse of the crater walls.
OVPDLF reported that the eruption ceased on 1 May 2007 but that seismicity continued during 2-7 May at and below the summit, and also indicated a large number of landslides from the Dolomieu crater walls. Two earthquakes occurred on 4 May; one was M 3.8. Light tremor and several significant earthquakes persisted throughout May and were considered to be the result of a collapse at depth. GPS information showed a contracting of Dolomieu. The larger summit earthquakes, observed since the end of April, were considered to be precursors of such a movement. On 13 May a helicopter pilot reported that part of the edge of the crater had fallen.
There were no major events until 20 June 2007 when a large number of earthquakes were recorded, including several below sea level. Throughout the rest of 2007 and the first half of 2008, PdF remained relatively quiet.
Observations from 2008. Renewed seismicity was observed by OVPDLF/IPGP in early August 2008. General seismicity was high, with up to 100 seismic events per day and some magnitudes as high as M 3. Significant seismic events were recorded on 4 and 15 August. No deformation was observed on 4 August by the inclinometer or permanent GPS network; however a small seismic event on 15 August lasted a little more than 2.5 hours and deformation was detected at the top of Dolomieu. By 18 August seismicity had decreased and deformation was no longer detected.
Seismic activity beneath the summit was again detected on 31 August and deformation was detected at the top of Dolomieu. By 2 September seismicity had decreased. Seismicity during 8-9 September was characterized by hundreds of earthquakes. Permanent GPS measurements indicated inflation since August and a N-S widening of the Dolomieu crater by 6.5 cm.
On 12 September OVPDLF reported an eruption accompanied by small episodes of tremor. Although initial field observations confirmed increased degassing on the S-W Dolomieu crater and H2S in the air, no lava was found within the crater. Small amounts of SO2 were detected by the OVPDLF/IPGP NOVAC network on the Enclos Fouqué caldera rim. Aerial observation noted lava flows escaping from a crack in the W slope in the crater; a small lava lake formed at the bottom of the crater. On 13 September, 95 earthquakes occurred, including three of M 1.5-1.8 and nine of M 1-1.5 (others were smaller). The next day 94 earthquakes occurred at the summit.
More seismic events were detected during 15-16 September 2008 and numerous landslides occurred shortly thereafter, but these may have been facilitated by heavy rains. On those days, a total of 296 earthquakes were recorded. Seismicity and SO2 degassing continued.
An eruption took place during 21 September-2 October 2008. On 21 September, lava flows issued from the fissure about halfway up the W wall of Dolomieu crater. The lava flow ponded at the bottom. A strong concentration of SO2 was detected near the edge of the crater. On 22 September Pele's hair was found around the summit area and the lava flow rate decreased. No further earthquakes were observed after the beginning of the eruption and the volcanic activity was confined within the Dolomieu crater. The eruption of lava flows declined on 23 September.
During 24-30 September lava flows issued from the W crater wall continued to pond at the bottom of Dolomieu crater. Based on air photos acquired on 25 September, the lava flow was an estimated 180 m long by 100 m wide and about 30 m thick. The erupted volume was about 300,000 m3. On 26 September, lava fountaining from the fissure was no longer visible, but bubbling lava in the cone was observed. During that week tremor was relatively light and lava flows remained confined to the Dolomieu crater.
The eruption came to an end on 2 October and tremor decreased significantly. A total volume of lava emitted during this 10-day eruption was estimated at about 850,000 m3 based on analysis of aerial photographs. During the eruption only one small deflation episode was recorded.
On 20 October a seismic crisis began beneath the summit accompanied by weak deformation. Subsequent quiescence followed until 31 October when another seismic crisis was characterized by hundreds of earthquakes.
A new eruption began on 28 November 2008 from the vent halfway up the W wall of Dolomieu crater. The lava flows ponded at the bottom of the crater and covered about 50 percent of the 21 September lava flow. A small quantity of Pele's hair was deposited inside Bory crater.
On 14 December, the OVPDLF/IPGP recorded a strong seismic crisis under the volcano with several hundreds of earthquakes. However, substantial deformation was absent. An eruption commenced on 15 December from two fissures inside Dolomieu, halfway up the N and NE wall beneath "La Soufrière" and about 200 m below the crater rim. The eruption was sporadic and weak.
OVPDLF reported that during 22-28 December 2008 lava continued to issue at a high rate from an active vent on the N side of Dolomieu crater, beneath "La Soufrière" and about 200 m below the crater rim. Gas plumes often reduced visibility. On 24 December, a small cone formed at the vent and occasionally produced lava fountains that fed a small lava lake. GPS monitoring equipment indicated stable conditions. Throughout the eruption volcanic tremor was quite variable. Around this time, ten lava flows were visible on the inner flanks of the crater and a plume was visible. No fresh lava was visible at the cone on 29 December. The degassing was quite strong and sometimes Dolomieu was filled with bluish gas; a plume was visible on the webcam.
Observations from 2009. Tremor initially decreased in January, though by the 2nd it was increasing again. Tremor stabilized below levels seen on 15 December 2008, and remained at that level through at least 22 January, suggesting that eruptions continued.
References. Peltier, A., Staudacher, T., Bachélery, P., Cayol, V., in press, The April 2007 eruption and the Dolomieu crater collapse, two major events at Piton de la Fournaise (La Réunion Island, Indian Ocean): Journal of Volcanology and Geothermal Research (proof copy available online).
Peltier, A., Staudacher, T., and Bachélery, P., 2007, Constraints on magma transfers and structures involved in the 2003 actity at Piton de La Fournaise from displacement data: Journal Geophys. Res., v. 112, p. B03207, doi: 10.1029/2006JB004379.
Geologic Background. Piton de la Fournaise is a massive basaltic shield volcano on the French island of Réunion in the western Indian Ocean. Much of its more than 530,000-year history overlapped with eruptions of the deeply dissected Piton des Neiges shield volcano to the NW. Three scarps formed at about 250,000, 65,000, and less than 5,000 years ago by progressive eastward slumping, leaving caldera-sized embayments open to the E and SE. Numerous pyroclastic cones are present on the floor of the scarps and their outer flanks. Most recorded eruptions have originated from the summit and flanks of Dolomieu, a 400-m-high lava shield that has grown within the youngest scarp, which is about 9 km wide and about 13 km from the western wall to the ocean on the E side. More than 150 eruptions, most of which have produced fluid basaltic lava flows, have occurred since the 17th century. Only six eruptions, in 1708, 1774, 1776, 1800, 1977, and 1986, have originated from fissures outside the scarps.
Information Contacts: Laurent Michon and Patrick Bachélery, Laboratoire GéoSciences Réunion, Institut de Physique du Globe de Paris, Université de La Réunion, CNRS, UMR 7154-Géologie des Systèmes Volcaniques, La Réunion, France; Thomas Staudacher and Valérie Ferrazzini, Observatoire Volcanologique du Piton de la Fournaise (OVPDLF), Institut de Physique du Globe de Paris, 14 route nationale 3, 27 ème km, 97418 La Plaine des Cafres, La Réunion, France (URL: http://www.ipgp.fr/fr/ovpf/actualites-ovpf/); Joan Marti, Institute of Earth Sciences "Jaume Almera," Consejo Superior de Investigaciones Cientificas, Barcelona, Spain.
Hunga Tonga-Hunga Ha'apai (Tonga) — February 2009 Cite this Report
Hunga Tonga-Hunga Ha'apai
Tonga
20.5532°S, 175.3841°W; summit elev. 114 m
All times are local (unless otherwise noted)
Eruption from two vents on 17 March 2009 creates new land
A new eruption from multiple vents on and near Hunga Ha'apai Island began producing ash and steam plumes sometime in the late afternoon of 17 March 2009. The early stage of the eruption was photographed by Steven Gates (figures 1 and 2) at 1804 on 17 March while flying from Vava'u to Tongatapu. Coordinates provided by the Chathams Pacific pilots accurately located the activity as being near the islands of Hunga Tonga and Hunga Ha'apai, about 55 km NNW of Tongatapu Island, where the capital, Nuku'alofa, is located. The pilots had not observed any activity on the way to Vava'u approximately 90 minutes earlier, nor did pilots on previous flights that morning.
According to Matongi Tonga news, the Tonga Defence Services reported the eruption to the Geological Division of the Ministry of Lands on 17 March. Government geologist Kelepi Mafi noted that "sharp tremors" had been recorded by their seismic instruments during the previous three weeks, though the seismicity could not be directly linked to the eruption. Quotes by Mafi indicated that, based on seismicity, the submarine eruption may have started on 16 March. However, initial reports of steam plumes seen on that day were incorrect, as were reports of the eruption being 10 km SW on Tongatapu.
As reported by Agence France Presse (AFP), radio journalist George Lavaka viewed the eruption from a game-fishing boat operated by Lothar Slabon on the afternoon of 18 March. He described an island completely covered in black ash, coconut tree stumps, and dead birds and fish in the surrounding water. Video and photographs taken by passengers on that boat clearly showed a submarine vent offshore to the S and another vent some distance away on the NW part of the island (figure 3). Activity increased during the hour that the boat was present, during which time both vents exhibited strong Surtseyan explosions (figure 4), an eruption type named for Surtsey volcano off the coast of Iceland. As the eruption from the offshore vent became stronger, the plume included larger amounts of steam, produced base surges along the ocean surface, and ejected bombs (figure 5). Fortunately the boat left the area just as the eruption escalated and volcanic bombs began falling around them.
A science team led by Mafi observed the eruption site at Hunga Ha'apai from a boat on 19 March. By that time, as reported by AFP, tephra had filled the gap between the submarine vent, originally about 100 m offshore, and the island, adding hundreds of square meters of land. Residents on Tongatapu reported orange glow from the eruption on the night of 19 March.
Aviation reports. A New Zealand Dominion Post article on 19 March noted that flights were disrupted and rerouted around the activity following warnings from Airways New Zealand and MetService NZ.
The Wellington VAAC issued an aviation notice on 18 March based on ground observations from the Tongatapu airport of a plume rising to an altitude of 7.6 km at 0659 that morning; ash was not seen in satellite data. Later that day, at 1330, a plume seen on MODIS satellite imagery was within 1 km of the vent and moving NE. A similar plume was reported based on MODIS and ground observations to an altitude of 4.5 km at 1600. Airport observers continued to report a plume to 5 km altitude at 1000 on 19 March, and to 4 km at 1700, but with a band of ash extending 2.5 km NE from the volcano to 2.4 km altitude.
D. Tait, a pilot for Air Chatham, noted that at 1700 on 19 March frequent eruptions were ejecting black ash, sometimes to a height of 300 m. The main white eruption plume was rising to about 4 km altitude and drifting ENE, to a distance of almost 500 km as seen in MODIS satellite imagery. He also observed that widespread ash and haze was trapped below an inversion layer at about 2 km altitude. On 20 March, a VAAC report at 1140 indicated a steam plume to 4 km but no visible eruption.
Pilot Tait reported that at 1015 on 21 March the island was covered by weather clouds, the crater was not visible, and there was no vertical plume; haze was again below an inversion layer at 1.5 km altitude. No eruptions were seen during the 15 minutes the island was visible on the return flight around 1250. However, steaming continued, with the plume rising to 1.8 km altitude. A new eruptive episode was reported by Tongatapu airport observers at 1409 on 21 March that sent an ash plume 800 m high.
Geologic Background. The small andesitic islands of Hunga Tonga and Hunga Ha'apai are part of the western and northern remnants of the rim (~6 km diameter) of a largely submarine caldera located about 30 km SSE of Falcon Island. The topmost sequence of welded and unwelded ignimbrite units from a caldera-forming eruption was 14C dated to 1040-1180 CE (Cronin et al., 2017; Brenna et al. 2022). At least two additional welded pumice-rich ignimbrite units and nonwelded pyroclastic flow deposits, below paleosols and other volcaniclastic deposits, indicated more very large previous eruptions (Cronin et al., 2017; Brenna et al. 2022). Several submarine eruptions have occurred at this caldera system since the first recorded eruption in 1912, including 1937 and S of the islands in 1988. A short eruption in 2009 added land to to Hunga Ha'apai. At that time the two islands were each about 2 km long, displaying inward-facing sea cliffs with lava and tephra layers dipping gently away from the caldera. An eruption during December 2014-January 2015 was centered between the islands, and combined them into one larger structure. Major explosive eruptions in late 2021 initially reshaped the central part of the combined island before stronger activity in mid-January 2022 removed most of the 2014-15 material; an even larger eruption the next day sent an eruption plume high into the stratosphere, triggered shock waves through the atmosphere and tsunami across the Pacific Ocean, and left only small remnants of the islands above the ocean surface.
Information Contacts: Steven Gates, Tradewind Island Sailing, Private Bag 63, Neiafu, Vava'u, Tonga (URL: http://www.manuoku.com/); Wellington Volcanic Ash Advisory Centre (VAAC), Meteorological Service of New Zealand Ltd (MetService), PO Box 722, Wellington, New Zealand (URL: http://www.metservice.com/ vaac/, http://vaac.metservice.com/); The Dominion Post (URL: http://dompost.co.nz/); Matongi Tonga Online, PO Box 958, Nuku'alofa, Tonga (URL: http://www.matangitonga.to/); Agence France Presse (AFP) (URL: http://www.afp.com/); The Boston Globe, Boston, MA, USA (URL: http://www.boston.com/).
Ijen (Indonesia) — February 2009 Cite this Report
Ijen
Indonesia
8.058°S, 114.242°E; summit elev. 2769 m
All times are local (unless otherwise noted)
Visual, geochemical, and geophysical observations during mid-2008
Our previous report on Ijen (BGVN 32:09) discussed the findings of a field visit during 6 July-2 August 2007 by researchers from Simon Fraser University, McGill University, and the Institut Teknologi Bandung (ITB). During their visit, this team documented degassing and increasing fumarole temperatures.
This team again conducted fieldwork at Ijen during 18 July-7 August 2008. This report discusses their findings. The East Java volcano is the scene of sulfur mining and a highly acidic lake.
Fumarole mound. In comparison to 2007, the fumarole mound of Kawah Ijen had changed substantially. The sulfur mining company had installed new pipes and constructed supporting walls. Combined with frequent spraying of water to cool the pipes, this has completely changed the surface coating of the mound. Furthermore, changes at the dome were noted. One area was flat in 2007, but sub-vertical in 2008, indicating an uplift of approximately 1 m. Uplift was also apparent in other areas, but could not be quantified.
Temperatures of the fumaroles were similar to those recorded in 2007. The exit temperature at the pipes varied between 150 and 230°C, with the highest values at pipes in flaming fumaroles (occasional flaming at pipe exits was observed when wind speed was low). Fumarole temperatures varied from 300°C (white fumes) to more than 580°C (flaming), but were highly variable with the weather conditions.
New fumarolic activity was observed W of the fumarole mound, both on the slope leading down to the lake and on the flank of the escarpment bordering the mound on the W (figure 9). According to the sulfur miners, these fumaroles appeared at the end of summer 2007. Temperatures were between 90 and 96°C and the fumaroles were coated in sulfur needles (figure 9). The location suggests a westward migration of the system.
Giggenbach-bottles, condensates, silica tubes, and rock samples were collected on the fumarole mound. Measurements of SO2, CO2, and H2O in the fumes at the foot of the fumarole mound were also made using a multi-gas instrument (Shinohara, 2005).
Gas ratios and flux measurements. The ratios of H2O/CO2/SO2 gases in the fumarole gases were measured using a portable multi-gas sensor built at Simon Fraser University. A Licor IR spectrometer measured CO2 concentrations, an InterScan electochemical cell sensor measured SO2 contents, and a Vaisala P-T-RH weather station measured the H2O content of the plume. When compared to magmatic gas ratios estimated from undegassed melt inclusion data, the fumarole gases appear to span a range from relatively dry (H20-poor) and CO2-enriched compositions to H2O-enriched, CO2-poor compositions. All gas compositions were highly depleted in SO2.
Giggenbach gas samples from previous surveys (VSI unpublished data, Delmelle and Bernard, 2000) confirm that the gases from the mound have variable H2O/CO2 ratios. This trend cannot be explained by mixing of the gases with various amounts of atmosphere because nitrogen contents in the gas phase do not correlate. The Giggenbach data also confirms that the gases were depleted in total sulfur (SO2 + H2S + minor species) relative to magmatic ratios. These observations were consistent with the precipitation of sulfur-bearing compounds in the lake (Delmelle and Bernard, 2000).
The total flux of SO2 gas from the fumarole mound was measured using a FLYSPEC (portable UV spectrometer) and averages 200 tons/day. This translates to an average of 720 tons/day of CO2 and 3,900 tons/day of H2O released into the atmosphere. Combining the SO2 flux with the Stotal/element ratios in the gas measured with the Giggenbach bottles, the authors estimated the flux of certain metals and halogens into the atmosphere to be 10 tons/day Cl, 25 g/day Hg, and 1,000 g/day Se.
Lake and Banyu Pahit river. Crater lake conditions were the same as last year. Lake level was approximately 10 cm higher, water temperature at the foot of the fumaroles was 37-39°C and pH and electrical conductivity (EC) were -0.01 and 312.6 mS/cm, respectively. The acid spring in the valley next to the fumarole mound was also unchanged, with a temperature of 50°C, pH of 1.72, and EC of 20.1 mS/cm. Measurements of the gas bubbling up from the springs indicated that it contained more than 100 ppm SO2 and 2 wt. % CO2.
The team conducted a transect along the Banyu Pahit river from the dam on the western end of the lake, to where it meets the Paltuding-Pelalangan road. This revealed that the actual source of the river is a set of springs about halfway along this transect (figure 10), with the water emerging from a cliff on the E flank of the valley from between two lava flows. Two sets of earlier springs are present, one immediately below the dam with abundant gypsum deposits, and another where the first valley from the E merges with the Banyu Pahit (valley A in figure 10).
Mapping along this transect revealed a thick sequence of phreatic, phreatomagmatic, and lahar deposits, as well as three distinct lava flows. Tracing these deposits upstream shows that they descended the Banyu Pahit valley, except for the most upstream part, where they follow valley A instead. This valley is blocked by a lava flow where it meets the lake, indicating that this flow postdates the deposits in the valley and that the section of the Banyu Pahit river immediately below the dam is relatively recent. The position of the second set of springs at the end of valley A may indicate that fluids are still making use of this original valley.
The team collected numerous samples of spring water, Banyu Pahit water, rocks and sediments along this part of the river to determine its sources and pathways. Preliminary field measurements are shown in figure 10.
Geophysical changes, summer 2006-2008. The gravity and differential GPS network of nine stations spread around the active crater, one at Paltuding and one at the volcanic observatory outside Ijen caldera were re-occupied each year. While no significant vertical deformation was observed on any of the stations, the dynamic gravity shows very strong variations between each year (figure 11). The mean error on gravity data was around 20 microGal, while the largest error was always less than 80 microGal. Between 2006 and 2007, the gravity change was of ~ 1,200 microGal (~ 1.2 mGal) and at the summit between 2007 and 2008 at ~ 300 microGal. This is in contrast to the "typical" gravity change of tens to hundreds microGal seen on active volcanoes (e.g., Rymer and others, 2005). At Ijen these changes are attributed to underground and surface water. Three arguments support this hypothesis, as follows.
First, Kawah Ijen hosts a large and deep lake (~30 x 106 m3) (Takano and others, 2004), whose surface level changes over the years. While the survey was made during the dry season each year, there was still some change visible on shoreline of the lake. No accurate measurements were made until summer 2008.
Second, the water table, located on the E flank, flows towards the lake. No data of water depth existent for this water table, but the water flow generates a natural electrical current, which were measured each year by self-potential. As with the gravity variation, similar changes were observed on the electrical profile around the active crater. Between 2006 and 2007, a significant decrease of the SP anomalies (~ 120 mV) on the N and E crater rim was observed. (BGVN 32:09), while between 2007 and 2008, these anomaly increased (~ 70 mV) to an intermediate level, between 2006 and 2008.
Third, no significant deformation was observed since 2006 on the summit of Kawah Ijen.
The geophysical survey indicated that both gravity (figure 11) and self-potential (BGVN 32:09) show compatible variations during 2006-2008. There was a decrease of both gravity and self-potential between 2006 and 2007, followed by an increase between 2007 and 2008. This finding suggests that these variations were due to changes of the lake and fresh groundwater flowing from Gunung Merapi toward Kawah Ijen lake.
References. Delmelle, P., and Bernard, A., 2000, Downstream composition changes of acidic volcanic waters discharged into the Banyupahit stream, Ijen caldera, Indonesia:Journal of Volcanology and Geothermal Research, v. 97, p. 55–75.
Rymer, H., Locke, C.A., Brenes, J., and Williams-Jones, G., 2005, Magma plumbing processes for persistent activity at Poás Volcano, Costa Rica: Geophysical Research Letters, v. 32, p.. L08307, doi:10.1029/2004GL022284.
Shinohara, H., 2005, A new technique to estimate volcanic gas composition: plume measurements with an estimate of volcanic gas composition: plume measurements with a portable multi-sensor system: Journal of Volcanology and Geothermal Research, v. 143, p. 319-333.
Geologic Background. The Ijen volcano complex at the eastern end of Java consists of a group of small stratovolcanoes constructed within the 20-km-wide Ijen (Kendeng) caldera. The north caldera wall forms a prominent arcuate ridge, but elsewhere the rim was buried by post-caldera volcanoes, including Gunung Merapi, which forms the high point of the complex. Immediately west of the Gunung Merapi stratovolcano is the historically active Kawah Ijen crater, which contains a nearly 1-km-wide, turquoise-colored, acid lake. Kawah Ijen is the site of a labor-intensive mining operation in which baskets of sulfur are hand-carried from the crater floor. Many other post-caldera cones and craters are located within the caldera or along its rim. The largest concentration of cones forms an E-W zone across the southern side of the caldera. Coffee plantations cover much of the caldera floor; nearby waterfalls and hot springs are tourist destinations.
Information Contacts: Vincent van Hinsberg, Stephanie Palmer, Julia King, and Willy (A.E.) Williams-Jones, Department of Earth and Planetary Sciences, McGill University, Montreal, Quebec, Canada (URL: http://www.mcgill.ca/eps/); Nathalie Vigouroux, Guillaume Mauri, and Glyn Williams-Jones, Department of Earth Sciences, Simon Fraser University, Burnaby, BC V5A 1S6, Canada (URL: http://www.sfu.ca/earth-sciences.html); Arif Susanto and Asnawir Nasution, Department of Geology, Institut Teknologi Bandung, Bandung, Indonesia (URL: http://www.itb.ac.id/).
Ol Doinyo Lengai (Tanzania) — February 2009 Cite this Report
Ol Doinyo Lengai
Tanzania
2.764°S, 35.914°E; summit elev. 2962 m
All times are local (unless otherwise noted)
Comparative quiet during mid-2008 into January 2009
Recent reports on Ol Doinyo Lengai provided observations from several climbing groups and pilots after the energetic eruptions during 2007-early 2008, events which included extra-crater lava flows and Plinian-style eruption clouds with heavy ashfalls. In contrast, eruptions during the previous 40 years mainly remained confined to the summit crater. The latest reported observations were made during April-September 2008 (BGVN 33:08) .
Since then, owing to the increased difficulty and hazard of both ascent and close proximity to the volcano, tourism and consequent reporting has sharply dropped off. However, some brief reports summarizing the observations of guides that escorted hikers to the summit were available for October and December 2008, and January 2009.
A team of US and Tanzanian geologists assembled at the request of the Government of Tanzania reported on their investigations. That report includes photos of lava flows and an isopach map of 2007-2009 tephra deposits found W of the volcano. Some of those tephra deposits were 17 cm thick, and during September 2007-March 2008 tephra falls caused thousands of residents to evacuate. Many residents had returned by mid-January 2009.
D'Oreye and others (2008) used synthetic aperture radar interferometry (InSAR) to study the geodetic behavior of several African volcanoes. They identified co-eruptive deformation at Lengai as well as a rift diking event in northern Tanzania.
Ascents and views of summit behavior. On 6 October 2008 French and Belgian climbers guided by Burra Amigadie observed a large mass of rock collapse into the active N crater. The mass fell from the crater's inner N wall. On 12 October 2008 climbers guided by Olomelok Naandato heard strong thundering noises and sensed tremors while ~ 150 m from the peak. On 26 October, thick steam from the crater was seen from a distance. The local government advised people not to climb the mountain until the situation normalized.
On 27 December 2008 ejection of the steam had subsided significantly and the mountain was considered generally calm despite small, periodic ash showers. Mountain climbing resumed. During 7-12 January 2009 climbers saw short-lived fumaroles emanating from the crater accompanied by moderate roaring sounds and tremors.
USGS and Tanzanian joint visit. During 18-22 January 2009 a team investigated the recent volcanism's impact. The team's members (see Information Contacts) came from the US Geological Survey (USGS) and US Agency for International Development, Office of Foreign Disaster Assistance, Volcano Disaster Assistance Program (VDAP); they joined geoscientists from the Geological Survey of Tanzania (GST) and Disaster Officials from the Disaster Management Department in the Prime Minister's Office. During their stay near Lengai, the team noted a small amount of steam occasionally rising from the N crater, and narrow plumes of white steam over the northern uppermost slopes.
The September 2007-March 2008 tephra falls covered an area predominantly to the W (figure 117). A few ash-thickness measurements were collected there across the trend of the September 2007-March 2008 tephra falls. Thicknesses as great as 17 cm were found 4 km from the vent (figure 118).
Lava flows deposited on the W flank in 2006 reached 200 m wide at the point of greatest breadth and extended 4.4 km downslope from the summit, terminating at ~ 1,230 m elevation. Where visited, the flows' surface textures were mostly pahoehoe with patches of a'a 3-5 m thick (figure 119). Trees caught in the lava flows remained standing and largely uncharred (figure 120), providing evidence that the lava flows were at or below the ignition temperature for vegetation.
A guide who ascended Lengai the morning of 20 January 2009 saw active lava flows on the NE portion of the N crater's floor.
On 22 January team members traveled to the village of Naiyobi, in the Ngorogoro Conservation Area ~ 12 km SW of the summit. Naiyobi, and the neighboring village of Kapenjiro (15 km S of the volcano). Residents were evacuated from these villages during the height of activity. According to the area coordinator, by January 2009 thousands of people had returned to both villages. Ash thicknesses measured on 22 January at a location 5.6 km NW of Naiyobi village were 5-6 cm (figure 121).
The US team had an interview that was featured on the web (Ransom, 2009). They noted the comparative repose seen during 2008 and that fewer than 10,000 people live within 10 km of the volcano. The rainy season (May-October), had passed by the time the US-Tanzanian team had arrived, and grass had begun to grow on previously ash-covered surfaces. Despite the emergence of these grasses, the team expected that next rainy season(s) will probably trigger mudflows and flash floods. This would impose periods of days when vehicles would be unable to reach the small communities around the volcano.
Gari Mayberry noted "The International Volcano Health Hazard Network has produced some pamphlets that discuss how to deal with ashfall. We are going to work with our colleagues from the University of Dar es Salaam in Tanzania who have offered to translate these pamphlets into Swahili so that local people ... can learn more about how they can deal with this hazard. It may go on to be translated into Maa, the local Masai language."
In discussing the lack of monitoring they noted that circumstances, "... forced us to look at the situation in a new way and to determine that disaster risk reduction education may be the most feasible way to reduce the hazard because it will be quite difficult due to the lack of infrastructure ... to install monitoring equipment."
They also commented that the unique carbonatite lavas are "so low on the temperature scale that it almost doesn't glow red. It has a hard time igniting trees or grasses as it flows over it because it's right at the point of ignition temperature from any of the things that grow on the surface ...."
References. D'Oreye, N., Fernandez, J, Gonzalez, P, Kervyn, F, Wauthier, C, Frischknecht, C, Calais, E, Heleno, S, Cayol, V, Oyen, A, Marinkovic, P, 2008, Systematic InSAR monitoring of African active volcanic zones: What we have learned in three years, or an harvest beyond our expectations: Dept. of Geophys./Astrophys., Nat. Museum of Natural History, Walferdange, in Second workshop on use of remote sensing techniques for monitoring volcanoes and seismogenic areas, 11-14 November 2008, p. 1-6, ISBN: 978-1-4244-2546-4
Ransom, C. N., 2009, Tanzanian Villagers Encouraged to Learn Hazards of Living Near Erupting Volcano, US Geological Survey; Audio interview taken 5 March 2009 (with transcript): USGS Interviews Collection (URL: http://gallery.usgs.gov/audios/244).
Geologic Background. The symmetrical Ol Doinyo Lengai is the only volcano known to have erupted carbonatite tephras and lavas in historical time. The prominent stratovolcano, known to the Maasai as "The Mountain of God," rises abruptly above the broad plain south of Lake Natron in the Gregory Rift Valley. The cone-building stage ended about 15,000 years ago and was followed by periodic ejection of natrocarbonatitic and nephelinite tephra during the Holocene. Historical eruptions have consisted of smaller tephra ejections and emission of numerous natrocarbonatitic lava flows on the floor of the summit crater and occasionally down the upper flanks. The depth and morphology of the northern crater have changed dramatically during the course of historical eruptions, ranging from steep crater walls about 200 m deep in the mid-20th century to shallow platforms mostly filling the crater. Long-term lava effusion in the summit crater beginning in 1983 had by the turn of the century mostly filled the northern crater; by late 1998 lava had begun overflowing the crater rim.
Information Contacts: B.H. Shabani and Ms Sofia, Disaster Management Department, Prime Minister's Office, United Republic of Tanzania; Abdulkarim Mruma and Elikunda Kanza, Geological Survey of Tanzania (GST), PO Box 903, Dodoma, Tanzania (URL: http://www.gst.go.tz/); Gari Mayberry, US Geological Survey (USGS) and US Agency for International Development, Office of Foreign Disaster Assistance, Washington, DC, USA (URL: http://volcanoes.usgs.gov/vhp/vdap.php); Tom Casadevall, USGS, Denver, CO, USA; David Sherrod, Cascades Volcano Observatory, USGS, Vancouver, WA, USA.
Mayon (Philippines) — February 2009 Cite this Report
Mayon
Philippines
13.257°N, 123.685°E; summit elev. 2462 m
All times are local (unless otherwise noted)
Mild phreatic explosion with ash plume on 10 August 2008
Our last report on Mayon (BGVN 32:05) discussed an eruption from 13 July to early October 2006, along with deadly lahars down Mayon's flanks caused by a typhoon that struck the Philippines on 30 November 2006. On 25 October 2006, the Philippine Institute of Volcanology and Seismology (PHIVOLCS) lowered the hazard status to Alert Level 1 (low level unrest).
The U.S. Air Force Weather Agency (AFWA) reported that an eruption had occurred on 4 June 2007. It sent a steam-and-ash plume seen on satellite imagery up to 4 km altitude, which blew toward the SW.
There were no further reports on Mayon until August 2008. On 10 August PHIVOLCS reported a mild explosion that produced an ash plume that rose to an altitude of 2.7 km and drifted ENE. According to PHIVOLCS, seismic activity during the weeks before the explosion had increased slightly and incandescence at the crater had intensified. Some inflation of the volcanic edifice also was apparent. The seismic network recorded the ash ejection as an explosion-type earthquake that lasted for one minute. Immediately after the explosion, visual observation becomes hampered by the thick clouds. Precise leveling surveys during 10-22 May 2008 compared to 17 February-2 March 2008 showed the edifice inflated.
A news account inThe Philippine Star described the explosion as phreatic and ash bearing, based on discussions with PHIVOLCS staff.
Geologic Background. Symmetrical Mayon, which rises above the Albay Gulf NW of Legazpi City, is the most active volcano of the Philippines. The steep upper slopes are capped by a small summit crater. Recorded eruptions since 1616 CE range from Strombolian to basaltic Plinian, with cyclical activity beginning with basaltic eruptions, followed by longer term andesitic lava flows. Eruptions occur predominately from the central conduit and have also produced lava flows that travel far down the flanks. Pyroclastic flows and mudflows have commonly swept down many of the approximately 40 ravines that radiate from the summit and have often damaged populated lowland areas. A violent eruption in 1814 killed more than 1,200 people and devastated several towns.
Information Contacts: Philippine Institute of Volcanology and Seismology (PHIVOLCS), University of the Philippines Campus, Diliman, Quezon City, Philippines (URL: http://www.phivolcs.dost.gov.ph/); U.S. Air Force Weather Agency, Public Affairs Office; 106 Peacekeeper Dr., Ste 2NE; Offutt AFB, NE 68113-4039, USA; The Philippine Star (URL: http://www.philstar.com/).
Tofua
Tonga
19.75°S, 175.07°W; summit elev. 515 m
All times are local (unless otherwise noted)
Intermittent observations and thermal alerts in 2004 and 2007-2009 indicate activity
An increased number of satellite-based MODVOLC thermal alerts occurred at Tofua (figure 1) on nine days during March to November 2008, as compared with alerts on three days in 2004, none in 2005 or 2006, two days in 2007, and one day in 2009 (as of 5 April). All of these infrared-derived alerts have been in the same area, a zone several kilometers N of the lake near the 5-km-diameter caldera's N rim, a region where numerous cones and craters reside. One or more of those cones was steaming in a 1990 image. In that image, this area appears steep and largely rocky, an unlikely location for repeated fires (figure 2). Eyewitness views of glow, scoria and spatter ejections from in the crater of Lofia cone during 1993, 2004, and 2009 suggest that at least some if not all the MODVOLC alerts are credible signatures reflecting the minimum level of volcanism at Tofua.
Previous reports in the Bulletin on Tofua covered aspects of activity during portions of 1979, 2000, and 2006 (SEAN 04:06, 04:12; BGVN 26:12, and 31:06, respectively). Taylor and Ewart (1997) compiled a chronology of Tongan eruptions.
Observations during 1993. Mary Lyn Fonua sent the following summary regarding a visit to Tofua in 1993. "It was quite a long time ago that we did a photographic feature on Tofua in May 1993 for our Eva magazine. Pesi, my husband, went there on [29 April 1993] on a two seater amphibian aircraft piloted by Peter Goldstern that landed on the crater lake. There was a smoking vent on the side of the volcano and thick yellowish smoke pouring out of the wall of the crater. They felt the island rumbling. There were hot thermal pools to bathe in. I seem to remember Pesi saying that ... it was possible to see a glow from volcanic activity in the crater at night. About 10 people were living on the island at the time, on the southern tip of the island .... There was forest and scrub on some parts of the island."
The above description of visible glow presumably came from the Lofia vent area just N of the lake. Vegetation and permanent or itinerant inhabitants suggests that some of the outlying thermal alerts discussed below might have been false-positives due to fires. Nicole Keller, of Woods Hole Oceanographic Institution, also notes that Tongans often communicate from island to island using fires.
Observations during 2004. Nicole Keller sent the following information about her October 2004 visit. "The only fumaroles were located inside Lofia crater?not at all accessible. None of the other, smaller cones around Lofia were active in any way (no obvious signs of degassing, no sulfur smell), but definitely had some alteration features that suggest they were hydrothermally altered in the past. Every few minutes there was a rumbling, and every now and again (1-time to 2-times per hour) there was a bigger explosion projecting juvenile scoria over the crater rim." Similar activity was seen by John Caulfield in May 2006 (BGVN 31:06), but without the scoria showers.
MODVOLC Thermal Alerts, 2004-2009. Satellite thermal data over Tofua revealed the absence of thermal alerts between 30 May 2004 and 18 March 2007. The MODVOLC alerts mentioned above began 19 March 2004 (table 1 and figure 3). The maps reveal repeating alerts at and adjacent to the N-caldera cone (Lofia). The October 2004 in situ observations from Keller confirm that the 19 March and 10 and 29 May 2004 MODVOLC alerts were probably due to volcanism. Given the pattern of small ongoing eruptions from a deep crater at Lofia as discussed by visitors during 1993, 2004, and at some point during 2008-2009, it is likely most of the MODVOLC alerts reflect volcanism at Tofua.
Table 1. Satellite thermal alerts (MODVOLC) for Tofua volcano from 19 March 2004 through 6 April 2009. No alerts were measured between 30 May 2004 and 14 March 2007. Courtesy of HIGP Thermal Alerts System.
| Date (UTC) |
Time (UTC) |
Pixels |
Satellite |
| 19 Mar 2004 |
1020 |
1 |
Terra |
| 10 May 2004 |
1300 |
1 |
Aqua |
| 29 May 2004 |
1025 |
1 |
Terra |
| 15 Mar 2007 |
0125 |
1 |
Aqua |
| 22 May 2007 |
1025 |
3 |
Terra |
| 07 Mar 2008 |
1015 |
1 |
Terra |
| 07 Mar 2008 |
1320 |
1 |
Aqua |
| 21 Jun 2008 |
1050 |
2 |
Terra |
| 21 Jun 2008 |
2145 |
1 |
Terra |
| 22 Jun 2008 |
1305 |
2 |
Aqua |
| 23 Jun 2008 |
1040 |
1 |
Terra |
| 04 Jul 2008 |
1020 |
1 |
Terra |
| 22 Aug 2008 |
0140 |
1 |
Aqua |
| 23 Aug 2008 |
0045 |
1 |
Aqua |
| 20 Nov 2008 |
1310 |
2 |
Aqua |
| 21 Nov 2008 |
1045 |
1 |
Terra |
| 08 Mar 2009 |
1030 |
1 |
Terra |
The HIGP Thermal Alerts System listed approximately 190 pixels ~ 45 km SE of Tofua Island on 17 January 2009. Rob Wright of the MODIS/MODVOLC team explained that these were artifacts over the ocean due to reflected sunlight (see http://modis.higp.hawaii.edu/daytime.html). "The last field in the MODVOLC text alert file is a sunglint vector. When this number is over 12 degrees it means that the MODIS sensor was 'looking' within 12 degrees of the specular angle (like being blinded by a mirror when the sun-mirror-eye angle is just right). In this case the mirror is the water surface. We leave them off the map because they are not real hot-spots. We leave them in the text alert file because our 12 degree threshold errs on the side of caution, and other workers may want to use a less restrictive threshold." On the date in question the glint vector was between 1 and 3.
Observations during March 2009. Swiss adventurer Xavier Rosset reported a clear description of minor eruptive activity at Tofua. His audio dialog, posted 13 March 2009, referred to his visit to the active cone during the preceding week, although the exact date of observation was unclear. At that time the crater was about 80-100 m deep and the same in diameter. Three openings of undetermined size displayed an orange glow. Lava ejections from these vents rose 10-50 m high and were accompanied by loud noises. Photos taken by Rosset (figures 4 and 5) show the active cone with lava in the bottom. Rosset's 27 March 2009 dialog discusses a strong earthquake in the region (Mw 7.6 on 20 March, centered ~ 45 km SE of Tofua), which caused several rockfalls on the island. He visited the volcano in the afternoon and, looking into the active crater, saw few noticeable changes.
References. Bauer, G.R., 1970, The Geology of Tofua Island, Tonga: Pacific Science, v. 24, no. 3, p. 333-350.
Morrison, C., 29 May 2008, Xavier Rosset, 300 days alone on an island: The Islomaniac website (http://www.the-islomaniac.com/).
Taylor, P.W., and Ewart, A., 1997, The Tofua Volcanic Arc, Tonga, SW Pacific: a review of historic volcanic activity: Aust Volc Invest Occ Rpt, 97/01, 58 p.
Geologic Background. The low, forested Tofua Island in the central part of the Tonga Islands group is the emergent summit of a large stratovolcano that was seen in eruption by Captain Cook in 1774. The summit contains a 5-km-wide caldera whose walls drop steeply about 500 m. Three post-caldera cones were constructed at the northern end of a cold fresh-water caldera lake, whose surface lies only 30 m above sea level. The easternmost cone has three craters and produced young basaltic-andesite lava flows, some of which traveled into the caldera lake. The largest and northernmost of the cones, Lofia, has a steep-sided crater that is 70 m wide and 120 m deep and has been the source of historical eruptions, first reported in the 18th century. The fumarolically active crater of Lofia has a flat floor formed by a ponded lava flow.
Information Contacts: Hawai'i Institute of Geophysics and Planetology (HIGP) Thermal Alerts System, School of Ocean and Earth Science and Technology (SOEST), Univ. of Hawai'i, 2525 Correa Road, Honolulu, HI 96822, USA (URL: http://modis.higp.hawaii.edu/); Mary Lyn Fonua, Matangi Tonga Online, Vava'u Press Ltd., Tonga (URL: http://www.matangitonga.to/); Xavier Rosset (URL: http://www.xavierrosset.com/); Paul W. Taylor, Australian Volcanological Investigations, P.O. Box 291, Pymble, NSW, 2073 Australia; Nicole S. Keller, Department of Geology and Geophysics, Woods Hole Oceanographic Institution, Woods Hole, MA, USA.