Recently Published Bulletin Reports
Kadovar (Papua New Guinea) An ash plume and weak thermal anomaly during May 2023
San Miguel (El Salvador) Small gas-and-ash explosions during March and May 2023
Ebeko (Russia) Continued explosions, ash plumes, and ashfall during October 2022-May 2023
Home Reef (Tonga) Discolored plumes continued during November 2022-April 2023
Semisopochnoi (United States) Occasional explosions, ash deposits, and gas-and-steam plumes during December 2022-May 2023
Ambae (Vanuatu) New lava flow, ash plumes, and sulfur dioxide plumes during February-May 2023
Ibu (Indonesia) Daily ash explosions continue, along with thermal anomalies in the crater, October 2022-May 2023
Dukono (Indonesia) Continuing ash emissions, SO2 plumes, and thermal signals during October 2022-May 2023
Sabancaya (Peru) Explosions, gas-and-ash plumes, and thermal activity persist during November 2022-April 2023
Sheveluch (Russia) Significant explosions destroyed part of the lava-dome complex during April 2023
Bezymianny (Russia) Explosions, ash plumes, lava flows, and avalanches during November 2022-April 2023
Chikurachki (Russia) New explosive eruption during late January-early February 2023
Kadovar (Papua New Guinea) — June 2023  Cite this Report
Kadovar
Papua New Guinea
3.608°S, 144.588°E; summit elev. 365 m
All times are local (unless otherwise noted)
An ash plume and weak thermal anomaly during May 2023
Kadovar is a 2-km-wide island that is the emergent summit of a Bismarck Sea stratovolcano. It lies off the coast of New Guinea, about 25 km N of the mouth of the Sepik River. Prior to an eruption that began in 2018, a lava dome formed the high point of the volcano, filling an arcuate landslide scarp open to the S. Submarine debris-avalanche deposits occur to the S of the island. The current eruption began in January 2018 and has comprised lava effusion from vents at the summit and at the E coast; more recent activity has consisted of ash plumes, weak thermal activity, and gas-and-steam plumes (BGVN 48:02). This report covers activity during February through May 2023 using information from the Darwin Volcanic Ash Advisory Center (VAAC) and satellite data.
Activity during the reporting period was relatively low and mainly consisted of white gas-and-steam plumes that were visible in natural color satellite images on clear weather days (figure 67). According to a Darwin VAAC report, at 2040 on 6 May an ash plume rose to 4.6 km altitude and drifted W; by 2300 the plume had dissipated. MODIS satellite instruments using the MODVOLC thermal algorithm detected a single thermal hotspot on the SE side of the island on 7 May. Weak thermal activity was also detected in a satellite image on the E side of the island on 14 May, accompanied by a white gas-and-steam plume that drifted SE (figure 68).
Geologic Background. The 2-km-wide island of Kadovar is the emergent summit of a Bismarck Sea stratovolcano of Holocene age. It is part of the Schouten Islands, and lies off the coast of New Guinea, about 25 km N of the mouth of the Sepik River. Prior to an eruption that began in 2018, a lava dome formed the high point of the andesitic volcano, filling an arcuate landslide scarp open to the south; submarine debris-avalanche deposits occur in that direction. Thick lava flows with columnar jointing forms low cliffs along the coast. The youthful island lacks fringing or offshore reefs. A period of heightened thermal phenomena took place in 1976. An eruption began in January 2018 that included lava effusion from vents at the summit and at the E coast.
Information Contacts: Darwin Volcanic Ash Advisory Centre (VAAC), Bureau of Meteorology, Northern Territory Regional Office, PO Box 40050, Casuarina, NT 0811, Australia (URL: http://www.bom.gov.au/info/vaac/); Hawai'i Institute of Geophysics and Planetology (HIGP) - MODVOLC Thermal Alerts System, School of Ocean and Earth Science and Technology (SOEST), Univ. of Hawai'i, 2525 Correa Road, Honolulu, HI 96822, USA (URL: http://modis.higp.hawaii.edu/); Copernicus Browser, Copernicus Data Space Ecosystem, European Space Agency (URL: https://dataspace.copernicus.eu/browser/).
San Miguel (El Salvador) — June 2023 Cite this Report
San Miguel
El Salvador
13.434°N, 88.269°W; summit elev. 2130 m
All times are local (unless otherwise noted)
Small gas-and-ash explosions during March and May 2023
San Miguel in El Salvador is a broad, deep crater complex that has been frequently modified by eruptions recorded since the early 16th century and consists of the summit known locally as Chaparrastique. Flank eruptions have produced lava flows that extended to the N, NE, and SE during the 17-19th centuries. The most recent activity has consisted of minor ash eruptions from the summit crater. The current eruption period began in November 2022 and has been characterized by frequent phreatic explosions, gas-and-ash emissions, and sulfur dioxide plumes (BGVN 47:12). This report describes small gas-and-ash explosions during December 2022 through May 2023 based on special reports from the Ministero de Medio Ambiente y Recursos Naturales (MARN).
Activity has been relatively low since the last recorded explosions on 29 November 2022. Seismicity recorded by the San Miguel Volcano Station (VSM) located on the N flank at 1.7 km elevation had decreased by 7 December. Sulfur dioxide gas measurements taken with DOAS (Differential Optical Absorption Spectroscopy) mobile equipment were below typical previously recorded values: 300 tons per day (t/d). During December, small explosions were recorded by the seismic network and manifested as gas-and-steam emissions.
Gas-and-ash explosions in the crater occurred during January 2023, which were recorded by the seismic network. Sulfur dioxide values remained low, between 300-400 t/d through 10 March. At 0817 on 14 January a gas-and-ash emission was visible in webcam images, rising just above the crater rim. Some mornings during February, small gas-and-steam plumes were visible in the crater. On 7 March at 2252 MARN noted an increase in degassing from the central crater; gas emissions were constantly observed through the early morning hours on 8 March. During the early morning of 8 March through the afternoon on 9 March, 12 emissions were registered, some accompanied by ash. The last gas-and-ash emission was recorded at 1210 on 9 March; very fine ashfall was reported in El Tránsito (10 km S), La Morita (6 km W), and La Piedrita (3 km W). The smell of sulfur was reported in Piedra Azul (5 km SW). On 16 March MARN reported that gas-and-steam emissions decreased.
Low degassing and very low seismicity were reported during April; no explosions have been detected between 9 March and 27 May. The sulfur dioxide emissions remained between 350-400 t/d; during 13-20 April sulfur dioxide values fluctuated between 30-300 t/d. Activity remained low through most of May; on 23 May seismicity increased. An explosion was detected at 1647 on 27 May generated a gas-and-ash plume that rose 700 m high (figure 32); a decrease in seismicity and gas emissions followed. The DOAS station installed on the W flank recorded sulfur dioxide values that reached 400 t/d on 27 May; subsequent measurements showed a decrease to 268 t/d on 28 May and 100 t/d on 29 May.
Geologic Background. The symmetrical cone of San Miguel, one of the most active volcanoes in El Salvador, rises from near sea level to form one of the country's most prominent landmarks. A broad, deep, crater complex that has been frequently modified by eruptions recorded since the early 16th century caps the truncated unvegetated summit, also known locally as Chaparrastique. Flanks eruptions of the basaltic-andesitic volcano have produced many lava flows, including several during the 17th-19th centuries that extended to the N, NE, and SE. The SE-flank flows are the largest and form broad, sparsely vegetated lava fields crossed by highways and a railroad skirting the base of the volcano. Flank vent locations have migrated higher on the edifice during historical time, and the most recent activity has consisted of minor ash eruptions from the summit crater.
Information Contacts: Ministero de Medio Ambiente y Recursos Naturales (MARN), Km. 5½ Carretera a Nueva San Salvador, Avenida las Mercedes, San Salvador, El Salvador (URL: http://www.snet.gob.sv/ver/vulcanologia).
Ebeko
Russia
50.686°N, 156.014°E; summit elev. 1103 m
All times are local (unless otherwise noted)
Continued explosions, ash plumes, and ashfall during October 2022-May 2023
Ebeko, located on the N end of Paramushir Island in the Kuril Islands, consists of three summit craters along a SSW-NNE line at the northern end of a complex of five volcanic cones. Eruptions date back to the late 18th century and have been characterized as small-to-moderate explosions from the summit crater, accompanied by intense fumarolic activity. The current eruption period began in June 2022 and has recently consisted of frequent explosions, ash plumes, and thermal activity (BGVN 47:10). This report covers similar activity during October 2022 through May 2023, based on information from the Kamchatka Volcanic Eruptions Response Team (KVERT) and satellite data.
Activity during October consisted of explosive activity, ash plumes, and occasional thermal anomalies. Visual data by volcanologists from Severo-Kurilsk showed explosions producing ash clouds up to 2.1-3 km altitude which drifted E, N, NE, and SE during 1-8, 10, 16, and 18 October. KVERT issued several Volcano Observatory Notices for Aviation (VONA) on 7, 13-15, and 27 October 2022, stating that explosions generated ash plumes that rose to 2.3-4 km altitude and drifted 5 km E, NE, and SE. Ashfall was reported in Severo-Kurilsk (Paramushir Island, about 7 km E) on 7 and 13 October. Satellite data showed a thermal anomaly over the volcano on 15-16 October. Visual data showed ash plumes rising to 2.5-3.6 km altitude on 22, 25-29, and 31 October and moving NE due to constant explosions.
Similar activity continued during November, with explosions, ash plumes, and ashfall occurring. KVERT issued VONAs on 1-2, 4, 6-7, 9, 13, and 16 November that reported explosions and resulting ash plumes that rose to 1.7-3.6 km altitude and drifted 3-5 km SE, ESE, E, and NE. On 1 November ash plumes extended as far as 110 km SE. On 5, 8, 12, and 24-25 November explosions and ash plumes rose to 2-3.1 km altitude and drifted N and E. Ashfall was observed in Severo-Kurilsk on 7 and 16 November. A thermal anomaly was visible during 1-4, 16, and 20 November. Explosions during 26 November rose as high as 2.7 km altitude and drifted NE (figure 45).
Explosions and ash plumes continued to occur in December. During 1-2 and 4 December volcanologists from Severo-Kurilsk observed explosions that sent ash to 1.9-2.5 km altitude and drifted NE and SE (figure 46). VONAs were issued on 5, 9, and 16 December reporting that explosions generated ash plumes rising to 1.9 km, 2.6 km, and 2.4 km altitude and drifted 5 km SE, E, and NE, respectively. A thermal anomaly was visible in satellite imagery on 16 December. On 18 and 27-28 December explosions produced ash plumes that rose to 2.5 km altitude and drifted NE and SE. On 31 December an ash plume rose to 2 km altitude and drifted NE.
Explosions continued during January 2023, based on visual observations by volcanologists from Severo-Kurilsk. During 1-7 January explosions generated ash plumes that rose to 4 km altitude and drifted NE, E, W, and SE. According to VONAs issued by KVERT on 2, 4, 10, and 23 January, explosions produced ash plumes that rose to 2-4 km altitude and drifted 5 km N, NE, E, and ENE; the ash plume that rose to 4 km altitude occurred on 10 January (figure 47). Satellite data showed a thermal anomaly during 3-4, 10, 13, 16, 21, 22, and 31 January. KVERT reported that an ash cloud on 4 January moved 12 km NE. On 6 and 9-11 January explosions sent ash plumes to 4.5 km altitude and drifted W and ESE. On 13 January an ash plume rose to 3 km altitude and drifted SE. During 20-24 January ash plumes from explosions rose to 3.7 km altitude and drifted SE, N, and NE. On 21 January the ash plume drifted as far as 40 km NE. During 28-29 and 31 January and 1 February ash plumes rose to 4 km altitude and drifted NE.
During February, explosions, ash plumes, and ashfall were reported. During 1, 4-5 and 7-8 February explosions generated ash plumes that rose to 4.5 km altitude and drifted E and NE; ashfall was observed on 5 and 8 February. On 6 February an explosion produced an ash plume that rose to 3 km altitude and drifted 7 km E, causing ashfall in Severo-Kurilsk. A thermal anomaly was visible in satellite data on 8, 9, 13, and 21 February. Explosions on 9 and 12-13 February produced ash plumes that rose to 4 km altitude and drifted E and NE; the ash cloud on 12 February extended as far as 45 km E. On 22 February explosions sent ash to 3 km altitude that drifted E. During 24 and 26-27 February ash plumes rose to 4 km altitude and drifted E. On 28 February an explosion sent ash to 2.5-3 km altitude and drifted 5 km E; ashfall was observed in Severo-Kurilsk.
Activity continued during March; visual observations showed that explosions generated ash plumes that rose to 3.6 km altitude on 3, 5-7, and 9-12 March and drifted E, NE, and NW. Thermal anomalies were visible on 10, 13, and 29-30 March in satellite imagery. On 18, 21-23, 26, and 29-30 March explosions produced ash plumes that rose to 2.8 km altitude and drifted NE and E; the ash plumes during 22-23 March extended up to 76 km E. A VONA issued on 21 March reported an explosion that produced an ash plume that rose to 2.8 km altitude and drifted 5 km E. Another VONA issued on 23 March reported that satellite data showed an ash plume rising to 3 km altitude and drifted 14 km E.
Explosions during April continued to generate ash plumes. On 1 and 4 April an ash plume rose to 2.8-3.5 km altitude and drifted SE and NE. A thermal anomaly was visible in satellite imagery during 1-6 April. Satellite data showed ash plumes and clouds rising to 2-3 km altitude and drifting up to 12 km SW and E on 3 and 6 April (figure 48). KVERT issued VONAs on 3, 5, 14, 16 April describing explosions that produced ash plumes rising to 3 km, 3.5 km, 3.5 km, and 3 km altitude and drifting 5 km S, 5 km NE and SE, 72 km NNE, and 5 km NE, respectively. According to satellite data, the resulting ash cloud from the explosion on 14 April was 25 x 7 km in size and drifted 72-104 km NNE during 14-15 April. According to visual data by volcanologists from Severo-Kurilsk explosions sent ash up to 3.5 km altitude that drifted NE and E during 15-16, 22, 25-26, and 29 April.
The explosive eruption continued during May. Explosions during 3-4, 6-7, and 9-10 May generated ash plumes that rose to 4 km altitude and drifted SW and E. Satellite data showed a thermal anomaly on 3, 9, 13-14, and 24 May. During 12-16, 23-25, and 27-28 May ash plumes rose to 3.5 km altitude and drifted in different directions due to explosions. Two VONA notices were issued on 16 and 25 May, describing explosions that generated ash plumes rising to 3 km and 3.5 km altitude, respectively and extending 5 km E. The ash cloud on 25 May drifted 75 km SE.
Thermal activity in the summit crater, occasionally accompanied by ash plumes and ash deposits on the SE and E flanks due to frequent explosions, were visible in infrared and true color satellite images (figure 49).
Geologic Background. The flat-topped summit of the central cone of Ebeko volcano, one of the most active in the Kuril Islands, occupies the northern end of Paramushir Island. Three summit craters located along a SSW-NNE line form Ebeko volcano proper, at the northern end of a complex of five volcanic cones. Blocky lava flows extend west from Ebeko and SE from the neighboring Nezametnyi cone. The eastern part of the southern crater contains strong solfataras and a large boiling spring. The central crater is filled by a lake about 20 m deep whose shores are lined with steaming solfataras; the northern crater lies across a narrow, low barrier from the central crater and contains a small, cold crescentic lake. Historical activity, recorded since the late-18th century, has been restricted to small-to-moderate explosive eruptions from the summit craters. Intense fumarolic activity occurs in the summit craters, on the outer flanks of the cone, and in lateral explosion craters.
Information Contacts: Kamchatka Volcanic Eruptions Response Team (KVERT), Far Eastern Branch, Russian Academy of Sciences, 9 Piip Blvd., Petropavlovsk-Kamchatsky, 683006, Russia (URL: http://www.kscnet.ru/ivs/kvert/); MIROVA (Middle InfraRed Observation of Volcanic Activity), a collaborative project between the Universities of Turin and Florence (Italy) supported by the Centre for Volcanic Risk of the Italian Civil Protection Department (URL: http://www.mirovaweb.it/); Copernicus Browser, Copernicus Data Space Ecosystem, European Space Agency (URL: https://dataspace.copernicus.eu/browser/).
Home Reef
Tonga
18.992°S, 174.775°W; summit elev. -10 m
All times are local (unless otherwise noted)
Discolored plumes continued during November 2022-April 2023
Home Reef is a submarine volcano located in the central Tonga islands between Lateiki (Metis Shoal) and Late Island. The first recorded eruption occurred in the mid-19th century, when an ephemeral island formed. An eruption in 1984 produced a 12-km-high eruption plume, a large volume of floating pumice, and an ephemeral island 500 x 1,500 m wide, with cliffs 30-50 m high that enclosed a water-filled crater. Another island-forming eruption in 2006 produced widespread pumice rafts that drifted as far as Australia; by 2008 the island had eroded below sea level. The previous eruption occurred during October 2022 and was characterized by a new island-forming eruption, lava effusion, ash plumes, discolored water, and gas-and-steam plumes (BGVN 47:11). This report covers discolored water plumes during November 2022 through April 2023 using satellite data.
Discolored plumes continued during the reporting period and were observed in true color satellite images on clear weather days. Satellite images show light green-yellow discolored water extending W on 8 and 28 November 2022 (figure 31), and SW on 18 November. Light green-yellow plumes extended W on 3 December, S on 13 December, SW on 18 December, and W and S on 23 December (figure 31). On 12 January 2023 discolored green-yellow plumes extended to the NE, E, SE, and N. The plume moved SE on 17 January and NW on 22 January. Faint discolored water in February was visible moving NE on 1 February. A discolored plume extended NW on 8 and 28 March and NW on 13 March (figure 31). During April, clear weather showed green-blue discolored plumes moving S on 2 April, W on 7 April, and NE and S on 12 April. A strong green-yellow discolored plume extended E and NE on 22 April for several kilometers (figure 31).
Geologic Background. Home Reef, a submarine volcano midway between Metis Shoal and Late Island in the central Tonga islands, was first reported active in the mid-19th century, when an ephemeral island formed. An eruption in 1984 produced a 12-km-high eruption plume, large amounts of floating pumice, and an ephemeral 500 x 1,500 m island, with cliffs 30-50 m high that enclosed a water-filled crater. In 2006 an island-forming eruption produced widespread dacitic pumice rafts that drifted as far as Australia. Another island was built during a September-October 2022 eruption.
Information Contacts: Copernicus Browser, Copernicus Data Space Ecosystem, European Space Agency (URL: https://dataspace.copernicus.eu/browser/).
Semisopochnoi (United States) — June 2023 Cite this Report
Semisopochnoi
United States
51.93°N, 179.58°E; summit elev. 1221 m
All times are local (unless otherwise noted)
Occasional explosions, ash deposits, and gas-and-steam plumes during December 2022-May 2023
Semisopochnoi is located in the western Aleutians, is 20-km-wide at sea level, and contains an 8-km-wide caldera. The three-peaked Mount Young (formerly Cerberus) was constructed within the caldera during the Holocene. Each of these peaks contains a summit crater; the lava flows on the N flank appear younger than those on the S side. The current eruption period began in early February 2021 and has more recently consisted of intermittent explosions and ash emissions (BGVN 47:12). This report updates activity during December 2022 through May 2023 using daily, weekly, and special reports from the Alaska Volcano Observatory (AVO). AVO monitors the volcano using local seismic and infrasound sensors, satellite data, web cameras, and remote infrasound and lightning networks.
Activity during most of December 2022 was relatively quiet; according to AVO no eruptive or explosive activity was observed since 7 November 2022. Intermittent tremor and occasional small earthquakes were observed in geophysical data. Continuous gas-and-steam emissions were observed from the N crater of Mount Young in webcam images on clear weather days (figure 25). On 24 December, there was a slight increase in earthquake activity and several small possible explosion signals were detected in infrasound data. Eruptive activity resumed on 27 December at the N crater of Mount Young; AVO issued a Volcano Activity Notice (VAN) that reported minor ash deposits on the flanks of Mount Young that extended as far as 1 km from the vent, according to webcam images taken during 27-28 December (figure 26). No ash plumes were observed in webcam or satellite imagery, but a persistent gas-and-steam plume that might have contained some ash rose to 1.5 km altitude. As a result, AVO raised the Aviation Color Code (ACC) to Orange (the second highest level on a four-color scale) and the Volcano Alert Level (VAL) to Watch (the second highest level on a four-level scale). Possible explosions were detected during 21 December 2022 through 1 January 2023 and seismic tremor was recorded during 30-31 December.
During January 2023 eruptive activity continued at the active N crater of Mount Young. Minor ash deposits were observed on the flanks, extending about 2 km SSW, based on webcam images from 1 and 3 January. A possible explosion occurred during 1-2 January based on elevated seismicity recorded on local seismometers and an infrasound signal recorded minutes later by an array at Adak. Though no ash plumes were observed in webcam or satellite imagery, a persistent gas-and-steam plume rose to 1.5 km altitude that might have carried minor traces of ash. Ash deposits were accompanied by periods of elevated seismicity and infrasound signals from the local geophysical network, which AVO reported were likely due to weak explosive activity. Low-level explosive activity was also detected during 2-3 January, with minor gas-and-steam emissions and a new ash deposit that was visible in webcam images. Low-level explosive activity was detected in geophysical data during 4-5 January, with elevated seismicity and infrasound signals observed on local stations. Volcanic tremor was detected during 7-9 January and very weak explosive activity was detected in seismic and infrasound data on 9 January. Weak seismic and infrasound signals were recorded on 17 January, which indicated minor explosive activity, but no ash emissions were observed in clear webcam images; a gas-and-steam plume continued to rise to 1.5 km altitude. During 29-30 January, ash deposits near the summit were observed on fresh snow, according to webcam images.
The active N cone at Mount Young continued to produce a gas-and-steam plume during February, but no ash emissions or explosive events were detected. Seismicity remained elevated with faint tremor during early February. Gas-and-steam emissions from the N crater were observed in clear webcam images on 11-13 and 16 February; no explosive activity was detected in seismic, infrasound, or satellite data. Seismicity has also decreased, with no significant seismic tremor observed since 25 January. Therefore, the ACC was lowered to Yellow (the second lowest level on a four-color scale) and the VAL was lowered to Advisory (the second lowest level on a four-color scale) on 22 February.
Gas-and-steam emissions persisted during March from the N cone of Mount Young, based on clear webcam images. A few brief episodes of weak tremor were detected in seismic data, although seismicity decreased over the month. A gas-and-steam plume detected in satellite data extended 150 km on 18 March. Low-level ash emissions from the N cone at Mount Young were observed in several webcam images during 18-19 March, in addition to small explosions and volcanic tremor. The ACC was raised to Orange and the VAL increased to Watch on 19 March. A small explosion was detected in seismic and infrasound data on 21 March.
Low-level unrest continued during April, although cloudy weather often obscured views of the summit; periods of seismic tremor and local earthquakes were recorded. During 3-4 April a gas-and-steam plume was visible traveling more than 200 km overnight; no ash was evident in the plume, according to AVO. A gas-and-steam plume was observed during 4-6 April that extended 400 km but did not seem to contain ash. Small explosions were detected in seismic and infrasound data on 5 April. Occasional clear webcam images showed continuing gas-and-steam emissions rose from Mount Young, but no ash deposits were observed on the snow. On 19 April small explosions and tremor were detected in seismic and infrasound data. A period of seismic tremor was detected during 22-25 April, with possible weak explosions on 25 April. Ash deposits were visible near the crater rim, but it was unclear if these deposits were recent or due to older deposits.
Occasional small earthquakes were recorded during May, but there were no signs of explosive activity seen in geophysical data. Gas-and-steam emissions continued from the N crater of Mount Young, based on webcam images, and seismicity remained slightly elevated. A new, light ash deposit was visible during the morning of 5 May on fresh snow on the NW flank of Mount Young. During 10 May periods of volcanic tremor were observed. The ACC was lowered to Yellow and the VAL to Advisory on 17 May due to no additional evidence of activity.
Geologic Background. Semisopochnoi, the largest subaerial volcano of the western Aleutians, is 20 km wide at sea level and contains an 8-km-wide caldera. It formed as a result of collapse of a low-angle, dominantly basaltic volcano following the eruption of a large volume of dacitic pumice. The high point of the island is Anvil Peak, a double-peaked late-Pleistocene cone that forms much of the island's northern part. The three-peaked Mount Cerberus (renamed Mount Young in 2023) was constructed within the caldera during the Holocene. Each of the peaks contains a summit crater; lava flows on the N flank appear younger than those on the south side. Other post-caldera volcanoes include the symmetrical Sugarloaf Peak SSE of the caldera and Lakeshore Cone, a small cinder cone at the edge of Fenner Lake in the NE part of the caldera. Most documented eruptions have originated from Young, although Coats (1950) considered that both Sugarloaf and Lakeshore Cone could have been recently active.
Information Contacts: Alaska Volcano Observatory (AVO), a cooperative program of a) U.S. Geological Survey, 4200 University Drive, Anchorage, AK 99508-4667 USA (URL: https://avo.alaska.edu/), b) Geophysical Institute, University of Alaska, PO Box 757320, Fairbanks, AK 99775-7320, USA, and c) Alaska Division of Geological & Geophysical Surveys, 794 University Ave., Suite 200, Fairbanks, AK 99709, USA (URL: http://dggs.alaska.gov/).
Ambae
Vanuatu
15.389°S, 167.835°E; summit elev. 1496 m
All times are local (unless otherwise noted)
New lava flow, ash plumes, and sulfur dioxide plumes during February-May 2023
Ambae, also known as Aoba, is a large basaltic shield volcano in Vanuatu. A broad pyroclastic cone containing three crater lakes (Manaro Ngoru, Voui, and Manaro Lakua) is located at the summit within the youngest of at least two nested calderas. Periodic phreatic and pyroclastic explosions have been reported since the 16th century. A large eruption more than 400 years ago resulted in a volcanic cone within the summit crater that is now filled by Lake Voui; the similarly sized Lake Manaro fills the western third of the caldera. The previous eruption ended in August 2022 that was characterized by gas-and-steam and ash emissions and explosions of wet tephra (BGVN 47:10). This report covers a new eruption during February through May 2023 that consisted of a new lava flow, ash plumes, and sulfur dioxide emissions, using information from the Vanuatu Meteorology and Geo-Hazards Department (VMGD) and satellite data.
During the reporting period, the Alert Level remained at a 2 (on a scale of 0-5), which has been in place since December 2021. Activity during October 2022 through March 2023 remained relatively low and mostly consisted of gas-and-steam emissions in Lake Voui. VMGD reported that at 1300 on 15 November a satellite image captured a strong amount of sulfur dioxide rising above the volcano (figure 99), and that seismicity slightly increased. The southern and northern part of the island reported a strong sulfur dioxide smell and heard explosions. On 20 February 2023 a gas-and-ash plume rose 1.3 km above the summit and drifted SSW, according to a webcam image (figure 100). Gas-and-steam and possibly ash emissions continued on 23 February and volcanic earthquakes were recorded by the seismic network.
During April, volcanic earthquakes and gas-and-steam and ash emissions were reported from the cone in Lake Voui. VMGD reported that activity increased during 5-7 April; high gas-and-steam and ash plumes were visible, accompanied by nighttime incandescence. According to a Wellington VAAC report, a low-level ash plume rose as high as 2.5 km above the summit and drifted W and SW on 5 April, based on satellite imagery. Reports in Saratamata stated that a dark ash plume drifted to the WSW, but no loud explosion was heard. Webcam images from 2100 showed incandescence above the crater and reflected in the clouds. According to an aerial survey, field observations, and satellite data, water was no longer present in the lake. A lava flow was reported effusing from the vent and traveling N into the dry Lake Voui, which lasted three days. The next morning at 0745 on 6 April a gas-and-steam and ash plume rose 5.4 km above the summit and drifted ESE, based on information from VMGD (figure 101). The Wellington VAAC also reported that light ashfall was observed on the island. Intermittent gas-and-steam and ash emissions were visible on 7 April, some of which rose to an estimated 3 km above the summit and drifted E. Webcam images during 0107-0730 on 7 April showed continuing ash emissions. A gas-and-steam and ash plume rose 695 m above the summit crater at 0730 on 19 April and drifted ESE, based on a webcam image (figure 102).
According to visual and infrared satellite data, water was visible in Lake Voui as late as 24 March 2023 (figure 103). The vent in the caldera showed a gas-and-steam plume drifted SE. On 3 April thermal activity was first detected, accompanied by a gas-and-ash plume that drifted W (figure 103). The lava flow moved N within the dry lake and was shown cooling by 8 April. By 23 April much of the water in the lake had returned. Occasional sulfur dioxide plumes were detected by the TROPOMI instrument on the Sentinel-5P satellite that exceeded 2 Dobson Units (DU) and drifted in different directions (figure 104).
Geologic Background. The island of Ambae, also known as Aoba, is a massive 2,500 km3 basaltic shield that is the most voluminous volcano of the New Hebrides archipelago. A pronounced NE-SW-trending rift zone with numerous scoria cones gives the 16 x 38 km island an elongated form. A broad pyroclastic cone containing three crater lakes (Manaro Ngoru, Voui, and Manaro Lakua) is located at the summit within the youngest of at least two nested calderas, the largest of which is 6 km in diameter. That large central edifice is also called Manaro Voui or Lombenben volcano. Post-caldera explosive eruptions formed the summit craters about 360 years ago. A tuff cone was constructed within Lake Voui (or Vui) about 60 years later. The latest known flank eruption, about 300 years ago, destroyed the population of the Nduindui area near the western coast.
Information Contacts: Geo-Hazards Division, Vanuatu Meteorology and Geo-Hazards Department (VMGD), Ministry of Climate Change Adaptation, Meteorology, Geo-Hazards, Energy, Environment and Disaster Management, Private Mail Bag 9054, Lini Highway, Port Vila, Vanuatu (URL: http://www.vmgd.gov.vu/, https://www.facebook.com/VanuatuGeohazardsObservatory/); Wellington Volcanic Ash Advisory Centre (VAAC), Meteorological Service of New Zealand Ltd (MetService), PO Box 722, Wellington, New Zealand (URL: http://www.metservice.com/vaac/, http://www.ssd.noaa.gov/VAAC/OTH/NZ/messages.html); MIROVA (Middle InfraRed Observation of Volcanic Activity), a collaborative project between the Universities of Turin and Florence (Italy) supported by the Centre for Volcanic Risk of the Italian Civil Protection Department (URL: http://www.mirovaweb.it/); Global Sulfur Dioxide Monitoring Page, Atmospheric Chemistry and Dynamics Laboratory, NASA Goddard Space Flight Center (NASA/GSFC), 8800 Greenbelt Road, Goddard, Maryland, USA (URL: https://so2.gsfc.nasa.gov/); Copernicus Browser, Copernicus Data Space Ecosystem, European Space Agency (URL: https://dataspace.copernicus.eu/browser/).
Ibu
Indonesia
1.488°N, 127.63°E; summit elev. 1325 m
All times are local (unless otherwise noted)
Daily ash explosions continue, along with thermal anomalies in the crater, October 2022-May 2023
Persistent eruptive activity since April 2008 at Ibu, a stratovolcano on Indonesian’s Halmahera Island, has consisted of daily explosive ash emissions and plumes, along with observations of thermal anomalies (BGVN 47:04). The current eruption continued during October 2022-May 2023, described below, based on advisories issued by the Pusat Vulkanologi dan Mitigasi Bencana Geologi (PVMBG, also known as Indonesian Center for Volcanology and Geological Hazard Mitigation, CVGHM), daily reports by MAGMA Indonesia (a PVMBG platform), and the Darwin Volcanic Ash Advisory Centre (VAAC), and various satellite data. The Alert Level during the reporting period remained at 2 (on a scale of 1-4), except raised briefly to 3 on 27 May, and the public was warned to stay at least 2 km away from the active crater and 3.5 km away on the N side of the volcano.
According to MAGMA Indonesia, during October 2022-May 2023, daily gray-and-white ash plumes of variable densities rose 200-1,000 m above the summit and drifted in multiple directions. On 30 October and 11 November, plumes rose a maximum of 2 km and 1.5 km above the summit, respectively (figures 42 and 43). According to the Darwin VAAC, discrete ash emissions on 13 November rose to 2.1 km altitude, or 800 m above the summit, and drifted W, and multiple ash emissions on 15 November rose 1.4 km above the summit and drifted NE. Occasional larger ash explosions through May 2023 prompted PVMBG to issue Volcano Observatory Notice for Aviation (VONA) alerts (table 6); the Aviation Color Code remained at Orange throughout this period.
Table 6. Volcano Observatory Notice for Aviation (VONA) ash plume alerts for Ibu issued by PVMBG during October 2022-May 2023. Maximum height above the summit was estimated by a ground observer. VONAs in January-May 2023 all described the ash plumes as dense.
| Date |
Time (local) |
Max height above summit |
Direction |
| 17 Oct 2022 |
0858 |
800 m |
SW |
| 18 Oct 2022 |
1425 |
800 m |
S |
| 19 Oct 2022 |
2017 |
600 m |
SW |
| 21 Oct 2022 |
0916 |
800 m |
NW |
| 16 Jan 2023 |
1959 |
600 m |
NE |
| 22 Jan 2023 |
0942 |
1,000 m |
E |
| 29 Jan 2023 |
2138 |
1,000 m |
E |
| 10 May 2023 |
0940 |
800 m |
NW |
| 10 May 2023 |
2035 |
600 m |
E |
| 21 May 2023 |
2021 |
600 m |
W |
| 21 May 2023 |
2140 |
1,000 m |
W |
| 29 May 2023 |
1342 |
800 m |
N |
| 31 May 2023 |
1011 |
1,000 m |
SW |
Sentinel-2 L1C satellite images throughout the reporting period show two, sometimes three persistent thermal anomalies in the summit crater, with the most prominent hotspot from the top of a cone within the crater. Clear views were more common during March-April 2023, when a vent and lava flows on the NE flank of the intra-crater cone could be distinguished (figure 44). White-to-grayish emissions were also observed during brief periods when weather clouds allowed clear views.
The MIROVA space-based volcano hotspot detection system recorded almost daily thermal anomalies throughout the reporting period, though cloud cover often interfered with detections. Data from imaging spectroradiometers aboard NASA’s Aqua and Terra satellites and processed using the MODVOLC algorithm (MODIS-MODVOLC) recorded hotspots on one day during October 2022 and December 2022, two days in April 2023, three days in November 2022 and May 2023, and four days in March 2023.
Geologic Background. The truncated summit of Gunung Ibu stratovolcano along the NW coast of Halmahera Island has large nested summit craters. The inner crater, 1 km wide and 400 m deep, has contained several small crater lakes. The 1.2-km-wide outer crater is breached on the N, creating a steep-walled valley. A large cone grew ENE of the summit, and a smaller one to the WSW has fed a lava flow down the W flank. A group of maars is located below the N and W flanks. The first observed and recorded eruption was a small explosion from the summit crater in 1911. Eruptive activity began again in December 1998, producing a lava dome that eventually covered much of the floor of the inner summit crater along with ongoing explosive ash emissions.
Information Contacts: Pusat Vulkanologi dan Mitigasi Bencana Geologi (PVMBG, also known as Indonesian Center for Volcanology and Geological Hazard Mitigation, CVGHM), Jalan Diponegoro 57, Bandung 40122, Indonesia (URL: http://www.vsi.esdm.go.id/); MAGMA Indonesia (Multiplatform Application for Geohazard Mitigation and Assessment in Indonesia), Kementerian Energi dan Sumber Daya Mineral (URL: https://magma.esdm.go.id/v1); Copernicus Browser, Copernicus Data Space Ecosystem, European Space Agency (URL: https://dataspace.copernicus.eu/browser/); MIROVA (Middle InfraRed Observation of Volcanic Activity), a collaborative project between the Universities of Turin and Florence (Italy) supported by the Centre for Volcanic Risk of the Italian Civil Protection Department (URL: http://www.mirovaweb.it/); Hawai'i Institute of Geophysics and Planetology (HIGP) - MODVOLC Thermal Alerts System, School of Ocean and Earth Science and Technology (SOEST), Univ. of Hawai'i, 2525 Correa Road, Honolulu, HI 96822, USA (URL: http://modis.higp.hawaii.edu/).
Dukono
Indonesia
1.6992°N, 127.8783°E; summit elev. 1273 m
All times are local (unless otherwise noted)
Continuing ash emissions, SO2 plumes, and thermal signals during October 2022-May 2023
Dukono, a remote volcano on Indonesia’s Halmahera Island, has been erupting continuously since 1933, with frequent ash explosions and sulfur dioxide plumes (BGVN 46:11, 47:10). This activity continued during October 2022 through May 2023, based on reports from the Pusat Vulkanologi dan Mitigasi Bencana Geologi (PVMBG; also known as Indonesian Center for Volcanology and Geological Hazard Mitigation, CVGHM), the Darwin Volcanic Ash Advisory Centre (VAAC), and satellite data. During this period, the Alert Level remained at 2 (on a scale of 1-4) and the public was warned to remain outside of the 2-km exclusion zone. The highest reported plume of the period reached 9.4 km above the summit on 14 November 2022.
According to MAGMA Indonesia (a platform developed by PVMBG), white, gray, or dark plumes of variable densities were observed almost every day during the reporting period, except when fog obscured the volcano (figure 33). Plumes generally rose 25-450 m above the summit, but rose as high as 700-800 m on several days, somewhat lower than the maximum heights reached earlier in 2022 when plumes reached as high as 1 km. However, the Darwin VAAC reported that on 14 November 2022, a discrete ash plume rose 9.4 km above the summit (10.7 km altitude), accompanied by a strong hotspot and a sulfur dioxide signal observed in satellite imagery; a continuous ash plume that day and through the 15th rose to 2.1-2.4 km altitude and drifted NE.
Sentinel-2 images were obscured by weather clouds almost every viewing day during the reporting period. However, the few reasonably clear images showed a hotspot and white or gray emissions and plumes. Strong SO2 plumes from Dukono were present on many days during October 2022-May 2023, as detected using the TROPOMI instrument on the Sentinel-5P satellite (figure 34).
Geologic Background. Reports from this remote volcano in northernmost Halmahera are rare, but Dukono has been one of Indonesia's most active volcanoes. More-or-less continuous explosive eruptions, sometimes accompanied by lava flows, have occurred since 1933. During a major eruption in 1550 CE, a lava flow filled in the strait between Halmahera and the N-flank Gunung Mamuya cone. This complex volcano presents a broad, low profile with multiple summit peaks and overlapping craters. Malupang Wariang, 1 km SW of the summit crater complex, contains a 700 x 570 m crater that has also been active during historical time.
Information Contacts: Pusat Vulkanologi dan Mitigasi Bencana Geologi (PVMBG, also known as Indonesian Center for Volcanology and Geological Hazard Mitigation, CVGHM), Jalan Diponegoro 57, Bandung 40122, Indonesia (URL: http://www.vsi.esdm.go.id/); MAGMA Indonesia (Multiplatform Application for Geohazard Mitigation and Assessment in Indonesia), Kementerian Energi dan Sumber Daya Mineral (URL: https://magma.esdm.go.id/v1); Darwin Volcanic Ash Advisory Centre (VAAC), Bureau of Meteorology, Northern Territory Regional Office, PO Box 40050, Casuarina, NT 0811, Australia (URL: http://www.bom.gov.au/info/vaac/); NASA Global Sulfur Dioxide Monitoring Page, Atmospheric Chemistry and Dynamics Laboratory, NASA Goddard Space Flight Center (NASA/GSFC), 8800 Greenbelt Road, Goddard, Maryland, USA (URL: https://so2.gsfc.nasa.gov/); Sentinel Hub Playground (URL: https://www.sentinel-hub.com/explore/sentinel-playground).
Sabancaya
Peru
15.787°S, 71.857°W; summit elev. 5960 m
All times are local (unless otherwise noted)
Explosions, gas-and-ash plumes, and thermal activity persist during November 2022-April 2023
Sabancaya is located in Peru, NE of Ampato and SE of Hualca Hualca. Eruptions date back to 1750 and have been characterized by explosions, phreatic activity, ash plumes, and ashfall. The current eruption period began in November 2016 and has more recently consisted of daily explosions, gas-and-ash plumes, and thermal activity (BGVN 47:11). This report updates activity during November 2022 through April 2023 using information from Instituto Geophysico del Peru (IGP) that use weekly activity reports and various satellite data.
Intermittent low-to-moderate power thermal anomalies were reported by the MIROVA project during November 2022 through April 2023 (figure 119). There were few short gaps in thermal activity during mid-December 2022, late December-to-early January 2023, late January to mid-February, and late February. According to data recorded by the MODVOLC thermal algorithm, there were a total of eight thermal hotspots: three in November 2022, three in February 2023, one in March, and one in April. On clear weather days, some of this thermal anomaly was visible in infrared satellite imagery showing the active lava dome in the summit crater (figure 120). Almost daily moderate-to-strong sulfur dioxide plumes were recorded during the reporting period by the TROPOMI instrument on the Sentinel-5P satellite (figure 121). Many of these plumes exceeded 2 Dobson Units (DU) and drifted in multiple directions.
IGP reported that moderate activity during November and December 2022 continued; during November, an average number of explosions were reported each week: 30, 33, 36, and 35, and during December, it was 32, 40, 47, 52, and 67. Gas-and-ash plumes in November rose 3-3.5 km above the summit and drifted E, NE, SE, S, N, W, and SW. During December the gas-and-ash plumes rose 2-4 km above the summit and drifted in different directions. There were 1,259 volcanic earthquakes recorded during November and 1,693 during December. Seismicity also included volcano-tectonic-type events that indicate rock fracturing events. Slight inflation was observed in the N part of the volcano near Hualca Hualca (4 km N). Thermal activity was frequently reported in the crater at the active lava dome (figure 120).
Explosive activity continued during January and February 2023. The average number of explosions were reported each week during January (51, 50, 60, and 59) and February (43, 54, 51, and 50). Gas-and-ash plumes rose 1.6-2.9 km above the summit and drifted NW, SW, and W during January and rose 1.4-2.8 above the summit and drifted W, SW, E, SE, N, S, NW, and NE during February. IGP also detected 1,881 volcanic earthquakes during January and 1,661 during February. VT-type earthquakes were also reported. Minor inflation persisted near Hualca Hualca. Satellite imagery showed continuous thermal activity in the crater at the lava dome (figure 120).
During March, the average number of explosions each week was 46, 48, 31, 35, and 22 and during April, it was 29, 41, 31, and 27. Accompanying gas-and-ash plumes rose 1.7-2.6 km above the summit crater and drifted W, SW, NW, S, and SE during March. According to a Buenos Aires Volcano Ash Advisory Center (VAAC) notice, on 22 March at 1800 through 23 March an ash plume rose to 7 km altitude and drifted NW. By 0430 an ash plume rose to 7.6 km altitude and drifted W. On 24 and 26 March continuous ash emissions rose to 7.3 km altitude and drifted SW and on 28 March ash emissions rose to 7.6 km altitude. During April, gas-and-ash plumes rose 1.6-2.5 km above the summit and drifted W, SW, S, NW, NE, and E. Frequent volcanic earthquakes were recorded, with 1,828 in March and 1,077 in April, in addition to VT-type events. Thermal activity continued to be reported in the summit crater at the lava dome (figure 120).
Geologic Background. Sabancaya, located in the saddle NE of Ampato and SE of Hualca Hualca volcanoes, is the youngest of these volcanic centers and the only one to have erupted in historical time. The oldest of the three, Nevado Hualca Hualca, is of probable late-Pliocene to early Pleistocene age. The name Sabancaya (meaning "tongue of fire" in the Quechua language) first appeared in records in 1595 CE, suggesting activity prior to that date. Holocene activity has consisted of Plinian eruptions followed by emission of voluminous andesitic and dacitic lava flows, which form an extensive apron around the volcano on all sides but the south. Records of historical eruptions date back to 1750.
Information Contacts: Instituto Geofisico del Peru (IGP), Centro Vulcanológico Nacional (CENVUL), Calle Badajoz N° 169 Urb. Mayorazgo IV Etapa, Ate, Lima 15012, Perú (URL: https://www.igp.gob.pe/servicios/centro-vulcanologico-nacional/inicio); Buenos Aires Volcanic Ash Advisory Center (VAAC), Servicio Meteorológico Nacional-Fuerza Aérea Argentina, 25 de mayo 658, Buenos Aires, Argentina (URL: http://www.smn.gov.ar/vaac/buenosaires/inicio.php); MIROVA (Middle InfraRed Observation of Volcanic Activity), a collaborative project between the Universities of Turin and Florence (Italy) supported by the Centre for Volcanic Risk of the Italian Civil Protection Department (URL: http://www.mirovaweb.it/); Hawai'i Institute of Geophysics and Planetology (HIGP) - MODVOLC Thermal Alerts System, School of Ocean and Earth Science and Technology (SOEST), Univ. of Hawai'i, 2525 Correa Road, Honolulu, HI 96822, USA (URL: http://modis.higp.hawaii.edu/); NASA Global Sulfur Dioxide Monitoring Page, Atmospheric Chemistry and Dynamics Laboratory, NASA Goddard Space Flight Center (NASA/GSFC), 8800 Greenbelt Road, Goddard MD 20771, USA (URL: https://so2.gsfc.nasa.gov/); Copernicus Browser, Copernicus Data Space Ecosystem, European Space Agency (URL: https://dataspace.copernicus.eu/browser/).
Sheveluch
Russia
56.653°N, 161.36°E; summit elev. 3283 m
All times are local (unless otherwise noted)
Significant explosions destroyed part of the lava-dome complex during April 2023
Sheveluch (also spelled Shiveluch) in Kamchatka, has had at least 60 large eruptions during the last 10,000 years. The summit is truncated by a broad 9-km-wide caldera that is breached to the S, and many lava domes occur on the outer flanks. The lava dome complex was constructed within the large open caldera. Frequent collapses of the dome complex have produced debris avalanches; the resulting deposits cover much of the caldera floor. A major south-flank collapse during a 1964 Plinian explosion produced a scarp in which a “Young Sheveluch” dome began to form in 1980. Repeated episodes of dome formation and destruction since then have produced major and minor ash plumes, pyroclastic flows, block-and-ash flows, and “whaleback domes” of spine-like extrusions in 1993 and 2020 (BGVN 45:11). The current eruption period began in August 1999 and has more recently consisted of lava dome growth, explosions, ash plumes, and avalanches (BGVN 48:01). This report covers a significant explosive eruption during early-to-mid-April 2023 that generated a 20 km altitude ash plume, produced a strong sulfur dioxide plume, and destroyed part of the lava-dome complex; activity described during January through April 2023 use information primarily from the Kamchatka Volcanic Eruptions Response Team (KVERT) and various satellite data.
Satellite data. Activity during the majority of this reporting period was characterized by continued lava dome growth, strong fumarole activity, explosions, and hot avalanches. According to the MODVOLC Thermal Alerts System, 140 hotspots were detected through the reporting period, with 33 recorded in January 2023, 29 in February, 44 in March, and 34 in April. Frequent strong thermal activity was recorded during January 2023 through April, according to the MIROVA (Middle InfraRed Observation of Volcanic Activity) graph and resulted from the continuously growing lava dome (figure 94). A slightly stronger pulse in thermal activity was detected in early-to-mid-April, which represented the significant eruption that destroyed part of the lava-dome complex. Thermal anomalies were also visible in infrared satellite imagery at the summit crater (figure 95).
During January 2023 KVERT reported continued growth of the lava dome, accompanied by strong fumarolic activity, incandescence from the lava dome, explosions, ash plumes, and avalanches. Satellite data showed a daily thermal anomaly over the volcano. Video data showed ash plumes associated with collapses at the dome that generated avalanches that in turn produced ash plumes rising to 3.5 km altitude and drifting 40 km W on 4 January and rising to 7-7.5 km altitude and drifting 15 km SW on 5 January. A gas-and-steam plume containing some ash that was associated with avalanches rose to 5-6 km altitude and extended 52-92 km W on 7 January. Explosions that same day produced ash plumes that rose to 7-7.5 km altitude and drifted 10 km W. According to a Volcano Observatory Notice for Aviation (VONA) issued at 1344 on 19 January, explosions produced an ash cloud that was 15 x 25 km in size and rose to 9.6-10 km altitude, drifting 21-25 km W; as a result, the Aviation Color Code (ACC) was raised to Red (the highest level on a four-color scale). Another VONA issued at 1635 reported that no more ash plumes were observed, and the ACC was lowered to Orange (the second highest level on a four-color scale). On 22 January an ash plume from collapses and avalanches rose to 5 km altitude and drifted 25 km NE and SW; ash plumes associated with collapses extended 70 km NE on 27 and 31 January.
Lava dome growth, fumarolic activity, dome incandescence, and occasional explosions and avalanches continued during February and March. A daily thermal anomaly was visible in satellite data. Explosions on 1 February generated ash plumes that rose to 6.3-6.5 km altitude and extended 15 km NE. Video data showed an ash cloud from avalanches rising to 5.5 km altitude and drifting 5 km SE on 2 February. Satellite data showed gas-and-steam plumes containing some ash rose to 5-5.5 km altitude and drifted 68-110 km ENE and NE on 6 February, to 4.5-5 km altitude and drifted 35 km WNW on 22 February, and to 3.7-4 km altitude and drifted 47 km NE on 28 February. Scientists from the Kamchatka Volcanological Station (KVS) went on a field excursion on 25 February to document the growing lava dome, and although it was cloudy most of the day, nighttime incandescence was visible. Satellite data showed an ash plume extending up to 118 km E during 4-5 March. Video data from 1150 showed an ash cloud from avalanches rose to 3.7-5.5 km altitude and drifted 5-10 km ENE and E on 5 March. On 11 March an ash plume drifted 62 km E. On 27 March ash plumes rose to 3.5 km altitude and drifted 100 km E. Avalanches and constant incandescence at the lava dome was focused on the E and NE slopes on 28 March. A gas-and-steam plume containing some ash rose to 3.5 km altitude and moved 40 km E on 29 March. Ash plumes on 30 March rose to 3.5-3.7 km altitude and drifted 70 km NE.
Similar activity continued during April, with lava dome growth, strong fumarolic activity, incandescence in the dome, occasional explosions, and avalanches. A thermal anomaly persisted throughout the month. During 1-4 April weak ash plumes rose to 2.5-3 km altitude and extended 13-65 km SE and E.
Activity during 11 April 2023. The Institute of Volcanology and Seismology, Far Eastern Branch, Russian Academy of Sciences (IVS FEB RAS) reported a significant increase in seismicity around 0054 on 11 April, as reported by strong explosions detected on 11 April beginning at 0110 that sent ash plumes up to 7-10 km altitude and extended 100-435 km W, WNW, NNW, WSW, and SW. According to a Tokyo VAAC report the ash plume rose to 15.8 km altitude. By 0158 the plume extended over a 75 x 100 km area. According to an IVS FEB RAS report, the eruptive column was not vertical: the initial plume at 0120 on 11 April deviated to the NNE, at 0000 on 12 April, it drifted NW, and by 1900 it drifted SW. KVS reported that significant pulses of activity occurred at around 0200, 0320, and then a stronger phase around 0600. Levin Dmitry took a video from near Békés (3 km away) at around 0600 showing a rising plume; he also reported that a pyroclastic flow traveled across the road behind him as he left the area. According to IVS FEB RAS, the pyroclastic flow traveled several kilometers SSE, stopping a few hundred meters from a bridge on the road between Klyuchi and Petropavlovsk-Kamchatsky.
Ashfall was first observed in Klyuchi (45 km SW) at 0630, and a large, black ash plume blocked light by 0700. At 0729 KVERT issued a Volcano Observatory Notice for Aviation (VONA) raising the Aviation Color Code to Red (the highest level on a four-color scale). It also stated that a large ash plume had risen to 10 km altitude and drifted 100 km W. Near-constant lightning strikes were reported in the plume and sounds like thunderclaps were heard until about 1000. According to IVS FEB RAS the cloud was 200 km long and 76 km wide by 0830, and was spreading W at altitudes of 6-12 km. In the Klyuchi Village, the layer of both ash and snow reached 8.5 cm (figure 96); ashfall was also reported in Kozyrevsk (112 km SW) at 0930, Mayskoye, Anavgay, Atlasovo, Lazo, and Esso. Residents in Klyuchi reported continued darkness and ashfall at 1100. In some areas, ashfall was 6 cm deep and some residents reported dirty water coming from their plumbing. According to IVS FEB RAS, an ash cloud at 1150 rose to 5-20 km altitude and was 400 km long and 250 km wide, extending W. A VONA issued at 1155 reported that ash had risen to 10 km and drifted 340 km NNW and 240 km WSW. According to Simon Carn (Michigan Technological University), about 0.2 Tg of sulfur dioxide in the plume was measured in a satellite image from the TROPOMI instrument on the Sentinel-5P satellite acquired at 1343 that covered an area of about 189,000 km2 (figure 97). Satellite data at 1748 showed an ash plume that rose to 8 km altitude and drifted 430 km WSW and S, according to a VONA.
Activity during 12-15 April 2023. On 12 April at 0730 satellite images showed ash plumes rose to 7-8 km altitude and extended 600 km SW, 1,050 km ESE, and 1,300-3,000 km E. By 1710 that day, the explosions weakened. According to news sources, the ash-and-gas plumes drifted E toward the Aleutian Islands and reached the Gulf of Alaska by 13 April, causing flight disruptions. More than 100 flights involving Alaska airspace were cancelled due to the plume. Satellite data showed ash plumes rising to 4-5.5 km altitude and drifted 400-415 km SE and ESE on 13 April. KVS volcanologists observed the pyroclastic flow deposits and noted that steam rose from downed, smoldering trees. They also noted that the deposits were thin with very few large fragments, which differed from previous flows. The ash clouds traveled across the Pacific Ocean. Flight cancellations were also reported in NW Canada (British Columbia) during 13-14 April. During 14-15 April ash plumes rose to 6 km altitude and drifted 700 km NW.
Alaskan flight schedules were mostly back to normal by 15 April, with only minor delays and far less cancellations; a few cancellations continued to be reported in Canada. Clear weather on 15 April showed that most of the previous lava-dome complex was gone and a new crater roughly 1 km in diameter was observed (figure 98); gas-and-steam emissions were rising from this crater. Evidence suggested that there had been a directed blast to the SE, and pyroclastic flows traveled more than 20 km. An ash plume rose to 4.5-5.2 km altitude and drifted 93-870 km NW on 15 April.
Activity during 16-30 April 2023. Resuspended ash was lifted by the wind from the slopes and rose to 4 km altitude and drifted 224 km NW on 17 April. KVERT reported a plume of resuspended ash from the activity during 10-13 April on 19 April that rose to 3.5-4 km altitude and drifted 146-204 km WNW. During 21-22 April a plume stretched over the Scandinavian Peninsula. A gas-and-steam plume containing some ash rose to 3-3.5 km altitude and drifted 60 km SE on 30 April. A possible new lava dome was visible on the W slope of the volcano on 29-30 April (figure 99); satellite data showed two thermal anomalies, a bright one over the existing lava dome and a weaker one over the possible new one.
References. Girina, O., Loupian, E., Horvath, A., Melnikov, D., Manevich, A., Nuzhdaev, A., Bril, A., Ozerov, A., Kramareva, L., Sorokin, A., 2023, Analysis of the development of the paroxysmal eruption of Sheveluch volcano on April 10–13, 2023, based on data from various satellite systems, ??????????? ???????? ??? ?? ???????, 20(2).
Geologic Background. The high, isolated massif of Sheveluch volcano (also spelled Shiveluch) rises above the lowlands NNE of the Kliuchevskaya volcano group. The 1,300 km3 andesitic volcano is one of Kamchatka's largest and most active volcanic structures, with at least 60 large eruptions during the Holocene. The summit of roughly 65,000-year-old Stary Shiveluch is truncated by a broad 9-km-wide late-Pleistocene caldera breached to the south. Many lava domes occur on its outer flanks. The Molodoy Shiveluch lava dome complex was constructed during the Holocene within the large open caldera; Holocene lava dome extrusion also took place on the flanks of Stary Shiveluch. Widespread tephra layers from these eruptions have provided valuable time markers for dating volcanic events in Kamchatka. Frequent collapses of dome complexes, most recently in 1964, have produced debris avalanches whose deposits cover much of the floor of the breached caldera.
Information Contacts: Kamchatka Volcanic Eruptions Response Team (KVERT), Far Eastern Branch, Russian Academy of Sciences, 9 Piip Blvd., Petropavlovsk-Kamchatsky, 683006, Russia (URL: http://www.kscnet.ru/ivs/kvert/); Institute of Volcanology and Seismology, Far Eastern Branch, Russian Academy of Sciences (IVS FEB RAS), 9 Piip Blvd., Petropavlovsk-Kamchatsky 683006, Russia (URL: http://www.kscnet.ru/ivs/eng/); Kamchatka Volcanological Station, Kamchatka Branch of Geophysical Survey, (KB GS RAS), Klyuchi, Kamchatka Krai, Russia (URL: http://volkstat.ru/); Hawai'i Institute of Geophysics and Planetology (HIGP) - MODVOLC Thermal Alerts System, School of Ocean and Earth Science and Technology (SOEST), Univ. of Hawai'i, 2525 Correa Road, Honolulu, HI 96822, USA (URL: http://modis.higp.hawaii.edu/); MIROVA (Middle InfraRed Observation of Volcanic Activity), a collaborative project between the Universities of Turin and Florence (Italy) supported by the Centre for Volcanic Risk of the Italian Civil Protection Department (URL: http://www.mirovaweb.it/); Copernicus Browser, Copernicus Data Space Ecosystem, European Space Agency (URL: https://dataspace.copernicus.eu/browser/); Kam 24 News Agency, 683032, Kamchatka Territory, Petropavlovsk-Kamchatsky, Vysotnaya St., 2A (URL: https://kam24.ru/news/main/20230411/96657.html#.Cj5Jrky6.dpuf); Simon Carn, Geological and Mining Engineering and Sciences, Michigan Technological University, 1400 Townsend Drive, Houghton, MI 49931, USA (URL: http://www.volcarno.com/, Twitter: @simoncarn).
Bezymianny
Russia
55.972°N, 160.595°E; summit elev. 2882 m
All times are local (unless otherwise noted)
Explosions, ash plumes, lava flows, and avalanches during November 2022-April 2023
Bezymianny is located on the Kamchatka Peninsula of Russia as part of the Klyuchevskoy volcano group. Historic eruptions began in 1955 and have been characterized by dome growth, explosions, pyroclastic flows, ash plumes, and ashfall. During the 1955-56 eruption a large open crater was formed by collapse of the summit and an associated lateral blast. Subsequent episodic but ongoing lava-dome growth, accompanied by intermittent explosive activity and pyroclastic flows, has largely filled the 1956 crater. The current eruption period began in December 2016 and more recent activity has consisted of strong explosions, ash plumes, and thermal activity (BGVN 47:11). This report covers activity during November 2022 through April 2023, based on weekly and daily reports from the Kamchatka Volcano Eruptions Response Team (KVERT) and satellite data.
Activity during November and March 2023 was relatively low and mostly consisted of gas-and-steam emissions, occasional small collapses that generated avalanches along the lava dome slopes, and a persistent thermal anomaly over the volcano that was observed in satellite data on clear weather days. According to the Tokyo VAAC and KVERT, an explosion produced an ash plume that rose to 6 km altitude and drifted 25 km NE at 1825 on 29 March.
Gas-and-steam emissions, collapses generating avalanches, and thermal activity continued during April. According to two Volcano Observatory Notice for Aviation (VONA) issued on 2 and 6 April (local time) ash plumes rose to 3 km and 3.5-3.8 km altitude and drifted 35 km E and 140 km E, respectively. Satellite data from KVERT showed weak ash plumes extending up to 550 km E on 2 and 5-6 April.
A VONA issued at 0843 on 7 April described an ash plume that rose to 4.5-5 km altitude and drifted 250 km ESE. Later that day at 1326 satellite data showed an ash plume that rose to 5.5-6 km altitude and drifted 150 km ESE. A satellite image from 1600 showed an ash plume extending as far as 230 km ESE; KVERT noted that ash emissions were intensifying, likely due to avalanches from the growing lava dome. The Aviation Color Code (ACC) was raised to Red (the highest level on a four-color scale). At 1520 satellite data showed an ash plume rising to 5-5.5 km altitude and drifting 230 km ESE. That same day, Kamchatka Volcanological Station (KVS) volcanologists traveled to Ambon to collect ash; they reported that a notable eruption began at 1730, and within 20 minutes a large ash plume rose to 10 km altitude and drifted NW. KVERT reported that the strong explosive phase began at 1738. Video and satellite data taken at 1738 showed an ash plume that rose to 10-12 km altitude and drifted up to 2,800 km SE and E. Explosions were clearly audible 20 km away for 90 minutes, according to KVS. Significant amounts of ash fell at the Apakhonchich station, which turned the snow gray; ash continued to fall until the morning of 8 April. In a VONA issued at 0906 on 8 April, KVERT stated that the explosive eruption had ended; ash plumes had drifted 2,000 km E. The ACC was lowered to Orange (the third highest level on a four-color scale). The KVS team saw a lava flow on the active dome once the conditions were clear that same day (figure 53). On 20 April lava dome extrusion was reported; lava flows were noted on the flanks of the dome, and according to KVERT satellite data, a thermal anomaly was observed in the area. The ACC was lowered to Yellow (the second lowest on a four-color scale).
Satellite data showed an increase in thermal activity beginning in early April 2023. A total of 31 thermal hotspots were detected by the MODVOLC thermal algorithm on 4, 5, 7, and 12 April 2023. The elevated thermal activity resulted from an increase in explosive activity and the start of an active lava flow. The MIROVA (Middle InfraRed Observation of Volcanic Activity) volcano hotspot detection system based on the analysis of MODIS data also showed a pulse in thermal activity during the same time (figure 54). Infrared satellite imagery captured a continuous thermal anomaly at the summit crater, often accompanied by white gas-and-steam emissions (figure 55). On 4 April 2023 an active lava flow was observed descending the SE flank.
Geologic Background. The modern Bezymianny, much smaller than its massive neighbors Kamen and Kliuchevskoi on the Kamchatka Peninsula, was formed about 4,700 years ago over a late-Pleistocene lava-dome complex and an edifice built about 11,000-7,000 years ago. Three periods of intensified activity have occurred during the past 3,000 years. The latest period, which was preceded by a 1,000-year quiescence, began with the dramatic 1955-56 eruption. This eruption, similar to that of St. Helens in 1980, produced a large open crater that was formed by collapse of the summit and an associated lateral blast. Subsequent episodic but ongoing lava-dome growth, accompanied by intermittent explosive activity and pyroclastic flows, has largely filled the 1956 crater.
Information Contacts: Kamchatka Volcanic Eruptions Response Team (KVERT), Far Eastern Branch, Russian Academy of Sciences, 9 Piip Blvd., Petropavlovsk-Kamchatsky, 683006, Russia (URL: http://www.kscnet.ru/ivs/kvert/); Kamchatka Volcanological Station, Kamchatka Branch of Geophysical Survey, (KB GS RAS), Klyuchi, Kamchatka Krai, Russia (URL: http://volkstat.ru/); Hawai'i Institute of Geophysics and Planetology (HIGP) - MODVOLC Thermal Alerts System, School of Ocean and Earth Science and Technology (SOEST), Univ. of Hawai'i, 2525 Correa Road, Honolulu, HI 96822, USA (URL: http://modis.higp.hawaii.edu/); MIROVA (Middle InfraRed Observation of Volcanic Activity), a collaborative project between the Universities of Turin and Florence (Italy) supported by the Centre for Volcanic Risk of the Italian Civil Protection Department (URL: http://www.mirovaweb.it/); Copernicus Browser, Copernicus Data Space Ecosystem, European Space Agency (URL: https://dataspace.copernicus.eu/browser/).
Chikurachki
Russia
50.324°N, 155.461°E; summit elev. 1781 m
All times are local (unless otherwise noted)
New explosive eruption during late January-early February 2023
Chikurachki, located on Paramushir Island in the northern Kuriles, has had Plinian eruptions during the Holocene. Lava flows have reached the sea and formed capes on the NW coast; several young lava flows are also present on the E flank beneath a scoria deposit. Reported eruptions date back to 1690, with the most recent eruption period occurring during January through October 2022, characterized by occasional explosions, ash plumes, and thermal activity (BGVN 47:11). This report covers a new eruptive period during January through February 2023 that consisted of ash explosions and ash plumes, based on information from the Kamchatka Volcanic Eruptions Response Team (KVERT) and satellite data.
According to reports from KVERT, an explosive eruption began around 0630 on 29 January. Explosions generated ash plumes that rose to 3-3.5 km altitude and drifted 6-75 km SE and E, based on satellite data. As a result, the Aviation Color Code (ACC) was raised to Orange (the second highest level on a four-color scale). At 1406 and 1720 ash plumes were identified in satellite images that rose to 4.3 km altitude and extended 70 km E. By 2320 the ash plume had dissipated. A thermal anomaly was visible at the volcano on 31 January, according to a satellite image, and an ash plume was observed drifting 66 km NE.
Occasional explosions and ash plumes continued during early February. At 0850 on 1 February an ash plume rose to 3.5 km altitude and drifted 35 km NE. Satellite data showed an ash plume that rose to 3.2-3.5 km altitude and drifted 50 km NE at 1222 later that day (figure 22). A thermal anomaly was detected over the volcano during 5-6 February and ash plumes drifted as far as 125 km SE, E, and NE. Explosive events were reported at 0330 on 6 February that produced ash plumes rising to 4-4.5 km altitude and drifting 72-90 km N, NE, and ENE. KVERT noted that the last gas-and steam plume that contained some ash was observed on 8 February and drifted 55 km NE before the explosive eruption ended. The ACC was lowered to Yellow and then Green (the lowest level on a four-color scale) on 18 February.
Geologic Background. Chikurachki, the highest volcano on Paramushir Island in the northern Kuriles, is a relatively small cone constructed on a high Pleistocene edifice. Oxidized basaltic-to-andesitic scoria deposits covering the upper part of the young cone give it a distinctive red color. Frequent basaltic Plinian eruptions have occurred during the Holocene. Lava flows have reached the sea and formed capes on the NW coast; several young lava flows are also present on the E flank beneath a scoria deposit. The Tatarinov group of six volcanic centers is located immediately to the south, and the Lomonosov cinder cone group, the source of an early Holocene lava flow that reached the saddle between it and Fuss Peak to the west, lies at the southern end of the N-S-trending Chikurachki-Tatarinov complex. In contrast to the frequently active Chikurachki, the Tatarinov centers are extensively modified by erosion and have a more complex structure. Tephrochronology gives evidence of an eruption around 1690 CE from Tatarinov, although its southern cone contains a sulfur-encrusted crater with fumaroles that were active along the margin of a crater lake until 1959.
Information Contacts: Kamchatka Volcanic Eruptions Response Team (KVERT), Far East Division, Russian Academy of Sciences, 9 Piip Blvd., Petropavlovsk-Kamchatsky, 683006, Russia (URL: http://www.kscnet.ru/ivs/); Copernicus Browser, Copernicus Data Space Ecosystem, European Space Agency (URL: https://dataspace.copernicus.eu/browser/).
Search Bulletin Archive by Publication Date
Select a month and year from the drop-downs and click "Show Issue" to have that issue displayed in this tab.
The default month and year is the latest issue available.
Bulletin of the Global Volcanism Network - Volume 36, Number 08 (August 2011)
Managing Editor: Richard Wunderman
Changbaishan (China-North Korea)
Observatory notes high seismicity during mid-2002 to mid-2005
Cleveland (United States)
Dome growth during August-September 2011 seen evolving in radar data
Dukono (Indonesia)
Continued frequent minor ash plume at least as late as 13 September 2011
Ibu (Indonesia)
Frequent minor white-to-gray plumes and small avalanches
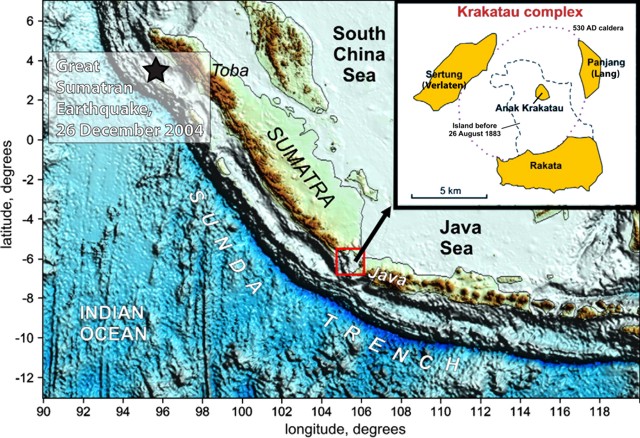
Krakatau (Indonesia)
2009-2011 eruptive phases; magma plumbing; date of ancestral eruption
Soufriere Hills (United Kingdom)
Extrusive pause follows 11 February 2010 partial dome collapse
Tambora (Indonesia)
Increased seismicity and minor steam venting in 2011
Tinakula (Solomon Islands)
MODVOLC thermal alerts extend through September 2011
Changbaishan (China-North Korea) — August 2011 Cite this Report
Changbaishan
China-North Korea
41.98°N, 128.08°E; summit elev. 2744 m
All times are local (unless otherwise noted)
Observatory notes high seismicity during mid-2002 to mid-2005
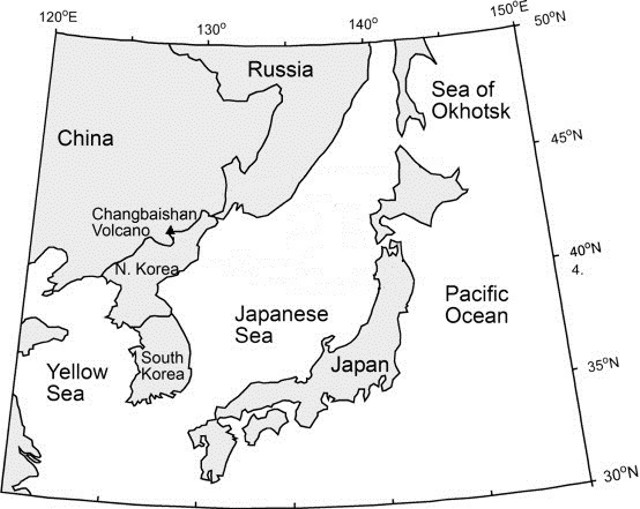
At the 25th General Assembly of the International Union of Geodesy and Geophysics (IUGG), the Chinese National Committee released an overview of data on Chinese volcanoes, especially Changbaishan volcano (figure 3), which they considered the most dangerous and the most likely to erupt (Fan and others, 2011; Liu and others 2011). Focusing on Changbaishan volcano and its summit caldera called Tianchi, Tianchi Volcano Observatory (TVO) released data collected since it formed in 1999. This report will summarize both the TVO's monitoring network and their findings from 1999 to 2010, focusing on the seismic crisis during mid-2002 to mid-2005. As clarification, the name Tianchi is used to refer to the ~ 5 km diameter summit caldera vent of the volcanic complex, and the name Changbaishan is used to refer to the complex in general. The latter name has many synonyms, including Baegdu, Baekdoosan, Baitoushan, Chang-pai-shan, Hakuto, and P'aektu-san.
To continuously monitor seismicity, TVO's Changbaishan volcano center was built in the highlands 40 km from the volcano, and five, two, and four seismic stations were installed within 15, 25, and 50 km of the volcano, respectively. Liu and others (2011) report that TVO's system "can detect M 0.1 volcanic events and give the [detailed] location of M 1.0 and larger volcanic events."
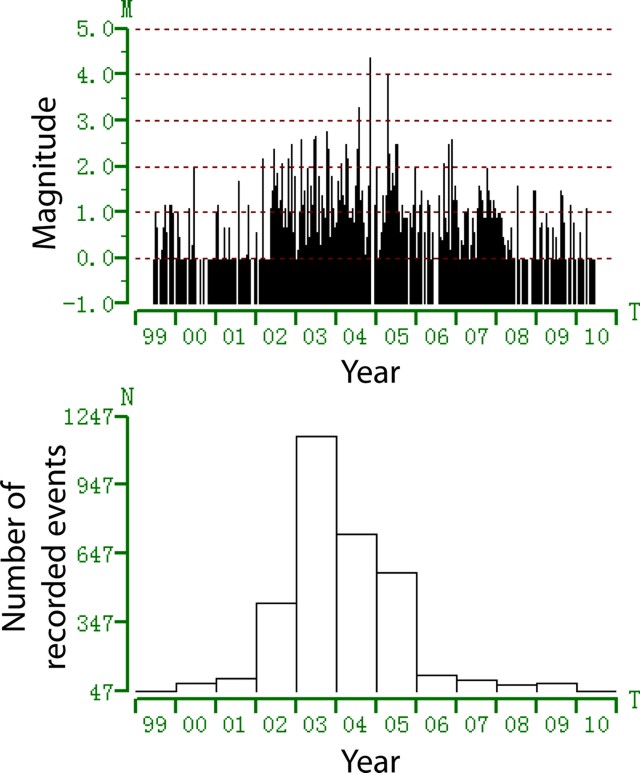
Seismic crisis. Our previous report on Changbaishan briefly discussed an increase in seismicity centered at the volcano in 2003 (BGVN 35:08). Figure 4 and table 1 illustrate that the increased seismicity occurred both in terms of the magnitude and the number of seismic events recorded. A histogram of the annual number of earthquakes from 2002 through 2005 shows a peak in 2003. M 2 and larger earthquakes became common in 2002, and peaked in late 2004. Note that tectonic earthquakes of M 4.4 and 4.0 occurred on 17 December 2004 and 15 April 2005, respectively, and are not related to this trend or Tianchi volcano (Liu and others, 2011). Following the seismic crisis, the number of earthquakes declined slowly, reaching background levels by 2006 (Liu and others, 2011). Liu and others (2011) break the seismic data into three periods over the TVO monitoring history (table 1). As is common with earthquakes at volcanoes around the world, seismic activity at Changbaishan often occurred in swarms, especially from 2002 to 2003, when hundreds of seismic events were sometimes recorded within a single day (figure 4, table 1).
Table 1. Tianchi volcano observatory (TVO) detected three distinct seismic episodes. * = Not including tectonic earthquakes of M 4.4 and 4.0 that occurred on 17 December 2004 and 15 April 2005, respectively. From Liu and others (2011).
| Date Range |
Activity |
Max. Magnitude |
Number of events/time period |
| 1999-Jun 2002 |
Background |
1.5 |
Under 12/month. |
| Jul 2002-Jul 2005 |
Peak (crisis) |
3.7* |
Over 100/day, in a series of swarms. |
| Aug 2005-present |
Recovery |
-- |
Under 12/month, generally. |
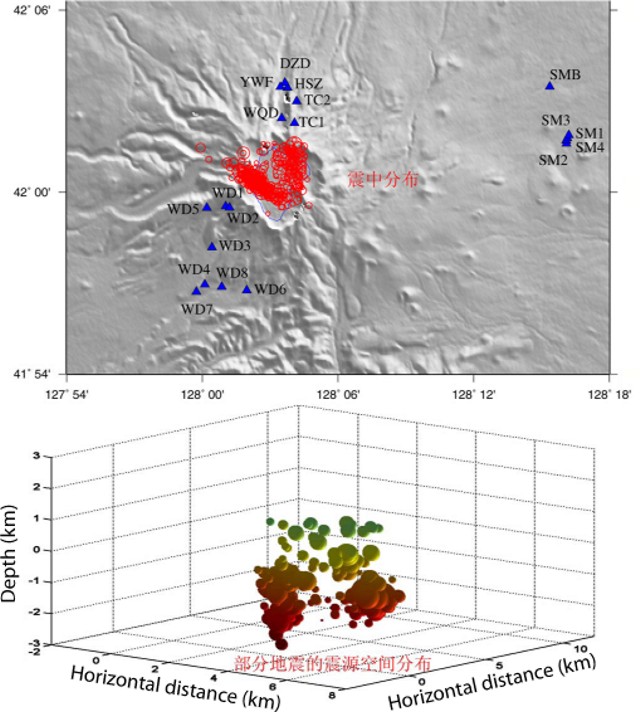
The hypocenters of earthquakes occurring at Changbaishan, and specifically the Tianchi caldera, were calculated from 2001 to present (figure 5). The majority of the earthquakes originated within 3 km of the Tianchi caldera rim (map distance), and within 5 km depth from the caldera rim.
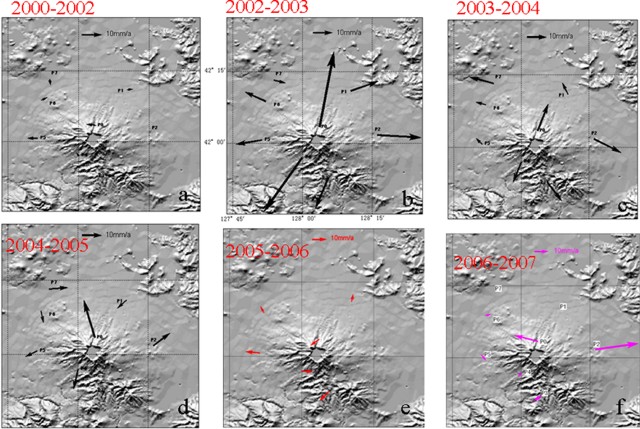
Coinciding with the increased seismic activity from July 2002 to July 2005, the ground deformation of Changbaishan also entered into a period of inflation, as measured by GPS instruments (figure 6). Horizontal displacement reached a maximum of 4 cm between 2002 and 2003, and continued on a declining trend (figure 6; Liu and others, 2011). Similarly, vertical displacement reached a maximum of 38.6 mm between 2002 and 2003, and declined in the following years; a cumulative vertical displacement of 68.12 mm was measured from 2002 to 2005 (Liu and others, 2011). Vertical displacements of the N and W slopes of the volcano (measured once per year from 2006 to 2009) are presented in table 2.
Table 2. Vertical displacement measurements of the N and W slopes of Changbaishan, measured once per year from 2006 through 2009. From Liu and others (2011).
| Year |
Slope |
Elevation (mm) |
Difference from previous year (mm) |
| 2006 |
North |
901140.05 |
-- |
| 2007 |
North |
901148.20 |
8.15 |
| 2008 |
North |
901149.26 |
1.06 |
| 2009 |
North |
901151.70 |
2.44 |
| |
| 2006 |
West |
1084636.20 |
-- |
| 2007 |
West |
1084661.54 |
25.34 |
| 2008 |
West |
1084659.21 |
-2.33 |
| 2009 |
West |
1084653.77 |
-5.44 |
Magma source of Changbaishan. TVO monitored the gas flux of (among others) CO2, N2, He, H2, O2, and CH4, as well as the temperature of hot springs as a supplementary data set. Of particular interest is the measured helium (He) isotopic ratio, 3He/4He. The isotope 3He is often considered primordial. The concentration of 3He on Earth is considered to be essentially stable; the majority of 3He on Earth was trapped upon the formation of the Earth. 4He is a product of the alpha decay of heavy elements in the Earth's crust, and is still produced on Earth by alpha-particle emissions from heavy elements that have differentiated into the Earth's crust and then escape into the atmosphere. The mantle is depleted (relative to the crust and atmosphere) in 4He. 3He/4He ratios (R) of volcanic gases are compared with the common atmospheric 3He/4He ratio (Ra). If volcanic gases provide a particularly high R value (e.g., R = 5, or 5 Ra, indicating values 5 times the atmospheric 3He/4He ratio), then they are considered to be of mantle origin (i.e., depleted in 4He). Liu and others (2011) reported an average 3He/4He value of 5.61 Ra, and concluded that the gases being monitored are mantle sourced.
Liu and others (2011) also reported that He and H2 gas flux increased significantly in 2003 and 2004, associated with the above-mentioned increased volcano-seismicity of July 2002 to July 2005. They also reported He and H2 gas flux increases in October and November 2006, again associated with volcano-seismicity (as well as an M 2.6 tectonic earthquake on 11 November 2006).
From fluid geochemistry measurements, Liu and others (2011) reported that H2S and SO2 fluxes are low but suggested monitoring should increase in the event that the measured values increase.
References. Fan, Q., Sui, J., Zhao, Y., Li, N., and Sun, Q., 2011, Recent progress in active volcanoes in China, in China National Report on Volcanology and Chemistry of the Earth's Interior, for the 25th General Assembly of IUGG, Melbourne, Australia, 28 June-7 July 2011 (prepared by the Chinese National Committee for the International Association of Volcanology and Chemistry of the Earth's Interior (IAVCEI)), pgs. 15-18.
Liu, G., Yang, J., Wang, L., and Sun, J., 2011, The active level analysis of Changbaishan volcano, in China National Report on Volcanology and Chemistry of the Earth's Interior, for the 25th General Assembly of IUGG, Melbourne, Australia, 28 June - 7 July 2011 (prepared by the Chinese National Committee for the International Association of Volcanology and Chemistry of the Earth's Interior (IAVCEI)), pgs. 19-43.
Machida, H., and Arai, F., 1983, Extensive ash falls in and around the Sea of Japan from large late Quaternary eruptions, Journal of Volcanology and Geothermal Research, v. 18, p. 151-164.
Geologic Background. Massive Changbaishan stratovolcano (also known as Baitoushan and by the Korean names of Baegdu, Paektu, or P'aektu-san), is located along the China/Korea border. A 5-km-wide, 850-m-deep summit caldera is filled by Lake Tianchi (Sky Lake). The 60-km-diameter dominantly trachytic and rhyolitic volcano was constructed over the Changbaishan (Laoheidingzi) shield volcano. Satellitic cinder cones are aligned along a NNE trend. One of the largest known Holocene explosive eruptions took place here about 946 CE, depositing tephra as far away as northern Japan and forming in part the present caldera; Yang et al. (2021) estimated the total erupted volume to be 40-98 km3. Minor eruptions have been recorded since the 15th century.
Information Contacts: Changbaishan Tianchi Volcano Observatory (TVO), Antu 133613, China.
Cleveland (United States) — August 2011 Cite this Report
Cleveland
United States
52.825°N, 169.944°W; summit elev. 1730 m
All times are local (unless otherwise noted)
Dome growth during August-September 2011 seen evolving in radar data
Figure 10 shows the location of Cleveland volcano, the scene of significant changes in dome morphology in August and September 2011. On 31 March 2011 the Alaska Volcano Observatory (AVO) lowered the Volcano Alert Level and the Aviation Color Code for Cleveland to Unassigned, noting that no eruptive activity had been confirmed during the previous few months (BGVN 36:05). Cleveland lacks a real-time seismic network, which means AVO cannot track local earthquakes and estimate volcanic unrest. AVO notes that short-lived explosions with ash clouds that could exceed 6.1 km altitude can occur without warning and may go undetected on satellite imagery for hours. Low-level ash emissions at Cleveland occur frequently and do not necessarily mean a larger eruption is imminent. AVO continues to monitor the volcano using satellite imagery.
AVO reported that on 20 July 2011 the Volcano Alert Level for Cleveland was raised to Advisory, and the Aviation Color Code was raised to Yellow due to thermal anomalies visible in satellite imagery during 19-20 and 22 July 2011. Cloud cover prevented observations during 21 and 23-26 July.
During the week of 25-31 July 2011 elevated but weak thermal anomalies were observed in satellite images of during periods of clear weather. AVO found no evidence of ash emissions or eruptive activity. Observations on 29 July 2011 showed a small lava dome ~ 40 m in diameter in the summit crater, apparently formed since 19 July based on measured thermal anomalies. Observations on 2 August revealed growth of the lava dome from ~40 to 50 m in diameter. In response, AVO raised the Aviation Color Code to Orange and the Alert Level to Watch.
An animated sequence of satellite radar images revealed what was hard to see through persistent weather clouds. They portrayed dynamic growth of the lava dome during early August through at least late September 2011 (figure 11).
AVO reported weak thermal anomalies in satellite imagery during 2-3, 5, 7-9, and 13-14 August when cloud cover was limited or absent. They noted that a scientist flying N of the volcano on 14 August observed small white puffs of steam rising 30-60 m above the summit, even though most of the volcano was obscured by clouds.
During 17-23 August cloud cover over Cleveland prevented observations of the summit crater. On 21 August AVO noted that a weak, 1-pixel thermal anomaly was observed in a recent satellite view during a cloud break. On 30 August 2011, satellite observations during the previous two weeks indicated a pause in lava-dome growth. AVO lowered the Volcano Alert Level to Advisory and the Aviation Color Code to Yellow. Cloud cover prevented views of the summit crater during 31 August-2 September, but a thermal anomaly at the summit was observed during 3-5 September.
Observations on 6-7 September 2011 indicated that the lava dome had resumed growth (figure 11), reaching 120 m in diameter and filling the floor of the crater. AVO again raised the Volcano Alert Level to Watch and the Aviation Color Code to Orange. Although cloud cover often prevented observations of Cleveland during 7-12 September, a thermal anomaly on the lava dome was visible during 8-9 and 12 September, and a possible anomaly was visible on 10 September. These anomalies suggested that lava-dome growth was continuing, although no activity was observed in partly cloudy satellite images during 12-17 September. During 17-18 September a thermal anomaly was detected in imagery.
A report on 20 September noted that recent observations revealed the lava dome had grown to ~165 m in diameter. The dome remained contained within the ~ 200-m-diameter crater at Cleveland's summit, having advanced to ~ 20 m below the E crater rim.
During 20-22 September no observations of elevated surface temperatures or ash emissions from Cleveland were visible in partly cloudy satellite images. Elevated surface temperatures were observed in satellite images during 23-24 September, suggesting that the lava dome eruption was continuing. On 24-25 September 2011 elevated surface temperatures were absent in several clear satellite images. Cloud cover prevented observations on 26 September. Satellite views detected continued elevated summit temperatures over the period 27-28 September 2011. Satellite data also suggested ongoing eruption as the lava dome continued growing.
Geologic Background. The beautifully symmetrical Mount Cleveland stratovolcano is situated at the western end of the uninhabited Chuginadak Island. It lies SE across Carlisle Pass strait from Carlisle volcano and NE across Chuginadak Pass strait from Herbert volcano. Joined to the rest of Chuginadak Island by a low isthmus, Cleveland is the highest of the Islands of the Four Mountains group and is one of the most active of the Aleutian Islands. The native name, Chuginadak, refers to the Aleut goddess of fire, who was thought to reside on the volcano. Numerous large lava flows descend the steep-sided flanks. It is possible that some 18th-to-19th century eruptions attributed to Carlisle should be ascribed to Cleveland (Miller et al., 1998). In 1944 it produced the only known fatality from an Aleutian eruption. Recent eruptions have been characterized by short-lived explosive ash emissions, at times accompanied by lava fountaining and lava flows down the flanks.
Information Contacts: Alaska Volcano Observatory (AVO), a cooperative program of a) U.S. Geological Survey (USGS), 4200 University Drive, Anchorage, AK 99508-4667 USA (URL: http://www.avo.alaska.edu/), b) Geophysical Institute, University of Alaska, PO Box 757320, Fairbanks, AK 99775-7320, USA, and c) Alaska Division of Geological & Geophysical Surveys (ADGGS), 794 University Ave., Suite 200, Fairbanks, AK 99709, USA (URL: http://www.dggs.alaska.gov/).
Dukono (Indonesia) — August 2011 Cite this Report
Dukono
Indonesia
1.6992°N, 127.8783°E; summit elev. 1273 m
All times are local (unless otherwise noted)
Continued frequent minor ash plume at least as late as 13 September 2011
Frequent minor ash plumes have occurred at Dukono (see figure 4) since before July 2008 (BGVN 33:08, 33:11, 35:04, and 36:03). This report covers the time period subsequent to our previous report, which ended on 4 April 2011 (BGVN 36:03), through 13 September 2011. The Darwin Volcanic Ash Advisory Centre (VAAC) has provided continuous monitoring of the activity through satellite surveillance (table 12) during this time period.
Table 12. Ash plumes from Dukono detected in satellite images between 21 April 2011 and 13 September 2011. Each date or date range represents at least one plume. No plumes were reported between the end of the table in our previous report (4 April 2011) and 21 April 2011. Data from the Darwin Volcanic Ash Advisory Centre.
| Date (UTC) |
Plume Altitude |
Plume Direction |
Plume Distance |
| 21 Apr-22 Apr 2011 |
2.1 km |
NE and E |
Up to 85 km |
| 28 Apr-02 May 2011 |
4.3 km |
NW, W, and SW |
55-150 km |
| 10 May-12 May 2011 |
4.3 km |
NE and E |
75-110 km |
| 16 May 2011 |
3 km |
E |
Over 90 km |
| 19 May 2011 |
3 km |
NE |
110 km |
| 01 Jun 2011 |
3 km |
NE |
110 km |
| 01 Jul 2011 |
3 km |
E |
110 km |
| 06 Jul-07 Jul 2011 |
3 km |
NW |
55 km |
| 11 Aug 2011 |
3 km |
Various |
14-93 km |
| 14 Aug 2011 |
3 km |
NW |
93 km |
| 18 Aug-21 Aug 2011 |
3 km |
N and NE |
110-150 km |
| 13 Sep 2011 |
3 km |
NW |
75 km |
According to a news article (Metro TV News), seismic activity increased in August 2011. On 11 August, ash explosions were audible within a radius of about 7 km from the base of the volcano. Ash was ejected as high as 1 km above the crater, producing plumes that drifted E and S, and also approached Tobelo City (14 km ENE). The news article noted that seismographs at the Dukono observation post had recorded more than 100 eruption earthquakes during this time.
A news report posted on the web (YouTube, 2011) discussed an eruption at Dukono during first half of September 2011. The commentator spoke in Indonesian. The video shows a large column of ash rising what appears to be on the order of one or a few kilometers above the crater. This news report was discussed elsewhere as well on the web.
During this reporting period (21 April 2011 to 13 September 2011), there were no thermal alerts derived from the Hawai'i Institute of Geophysics and Planetology Thermal Alerts System (MODVOLC). The most recent MODVOLC thermal alert was on 20 November 2010.
Reference. YouTube (2011), Gunung Dukono letusan, Leputan 6.com, uploaded by szbrnr on 7 September 2011 (URL: http://www.youtube.com/watch?v=mb3We1MwXdg).
Geologic Background. Reports from this remote volcano in northernmost Halmahera are rare, but Dukono has been one of Indonesia's most active volcanoes. More-or-less continuous explosive eruptions, sometimes accompanied by lava flows, have occurred since 1933. During a major eruption in 1550 CE, a lava flow filled in the strait between Halmahera and the N-flank Gunung Mamuya cone. This complex volcano presents a broad, low profile with multiple summit peaks and overlapping craters. Malupang Wariang, 1 km SW of the summit crater complex, contains a 700 x 570 m crater that has also been active during historical time.
Information Contacts: Darwin Volcanic Ash Advisory Centre (VAAC), Bureau of Meteorology, Northern Territory Regional Office, PO Box 40050, Casuarina, NT 0811, Australia (URL: http://www.bom.gov.au/info/vaac/); Center of Volcanology and Geological Hazard Mitigation (CVGHM), Jalan Diponegoro 57, Bandung 40122, Indonesia (URL: http://vsi.esdm.go.id/); Hawai'i Institute of Geophysics and Planetology (HIGP) Thermal Alerts System, School of Ocean and Earth Science and Technology (SOEST), University of Hawai'i, 2525 Correa Road, Honolulu, HI 96822, USA (URL: http://modis.higp.hawaii.edu/); Metro TV News (URL: http://www.metrotvnews.com).
Ibu
Indonesia
1.488°N, 127.63°E; summit elev. 1325 m
All times are local (unless otherwise noted)
Frequent minor white-to-gray plumes and small avalanches
Ibu (figure 9) has been intermittently active since 1998. Small explosions were noted during 2009 through January 2010 (BGVN 35:05). This report discuss seismic events from January 2011 to September 2011.
According to the Center of Volcanology and Geological Hazard Mitigation (CVGHM), during January 2011 to 8 September 2011, white-to-gray plumes rose 200-400 m above the craters. For 2011, CVGHM reported seismically detected avalanches, which on average occurred 45 times/day during January-April, 60 times/day during May-July, and 46 times/day during the first week of September. During much of 2011 seismicity fluctuated, but decreased towards September, prompting CVGHM to lower the Alert Level to 2 (on a scale of 1-4) on 8 September.
On 20 August 2011, observers from the nearby villages of Goin (exact location undisclosed) and Duono (5 km NW of Ibu) noted multiple eruptions from the S, E, and N craters. Plumes rose 50-250 m above the craters and an avalanche traveled 300 m in undisclosed direction.
During 2010, MODVOLC thermal alerts appeared about once per week on average, whereas, during 1 January 2011 through 13 September 2011, these alerts only appeared about once every 2.4 weeks on average. (Those alerts are derived from satellite data collected by the MODIS instrument and processed by the Hawai'i Institute of Geophysics and Planetology.)
Geologic Background. The truncated summit of Gunung Ibu stratovolcano along the NW coast of Halmahera Island has large nested summit craters. The inner crater, 1 km wide and 400 m deep, has contained several small crater lakes. The 1.2-km-wide outer crater is breached on the N, creating a steep-walled valley. A large cone grew ENE of the summit, and a smaller one to the WSW has fed a lava flow down the W flank. A group of maars is located below the N and W flanks. The first observed and recorded eruption was a small explosion from the summit crater in 1911. Eruptive activity began again in December 1998, producing a lava dome that eventually covered much of the floor of the inner summit crater along with ongoing explosive ash emissions.
Information Contacts: Center of Volcanology and Geological Hazard Mitigation (CVGHM), Saut Simatupang, 57, Bandung 40122, Indonesia (URL: http://vsi.esdm.go.id/); Hawai'i Institute of Geophysics and Planetology (HIGP) MODVOLC Thermal Alerts System, School of Ocean and Earth Science and Technology (SOEST), Univ. of Hawai'i, 2525 Correa Road, Honolulu, HI 96822, USA (URL: http://modis.higp.hawaii.edu/).
Krakatau (Indonesia) — August 2011 Cite this Report
Krakatau
Indonesia
6.1009°S, 105.4233°E; summit elev. 285 m
All times are local (unless otherwise noted)
2009-2011 eruptive phases; magma plumbing; date of ancestral eruption
Anak Krakatau (the active post-collapse cone of Krakatau volcano, figure 23) began another eruptive [period] around 25 October 2010, characterized by up to hundreds of explosions per day (e.g., 251 explosions during 31 October-1 November 2010 as noted in the Jakarta Post). In November 2010, Arnold Binas documented explosive activity, ballistic bombs, column collapse generating pyroclastic flows, and volcanic lightning... (figure 24).
According to the Center for Volcanology and Geological Hazard Mitigation (CVGHM) and the Darwin Volcanic Ash Advisory Centre (VAAC), ash plumes reached heights of 2.4 km altitude on 24 December 2010 and 12 January 2011; on 15 January 2011, an ash plume reached 3 km altitude. Ashfall in early January 2011 covered the solar panels running seismometers monitoring Anak Krakatau, rendering them inoperative until rainfall cleared the ash from the solar panels. Following the seismometer failure and amid continued activity of the volcano, the South Lampung Disaster Mitigation Agency (BPBD) ordered the evacuation of seven districts (of the 17 districts of South Lampung Regency) on 11 January 2011 (Jakarta Post).
In March 2011, the activity at Anak Krakatau decreased and the eruption was considered to be over. According to a local news service (TO:DAY), the head of the Anak Krakatau monitoring post reported that in the previous month, volcanic earthquakes became fewer and at greater focal depths. They had ranged from a high of 500-600 shallow earthquakes per day, declining to dozens per day in March 2011. The eruptive pause lasted, at most, until 31 July 2011 when NASA's Earth Observing-1 (EO-1) satellite observed a diffuse plume drifting W (figure 25).
In August, Andi Rosadi reported on the Volcano Discovery website that the seismometer monitoring Anak Krakatau was again damaged by explosions venting from the summit crater, noting "many quite big new bombs around the old crater." CVGHM reported that GPS measurement stations had been damaged as well. Rosadi also described and photographed large areas of incandescence within the summit crater on 8 August 2011, reporting a lava dome or "dry lava lake glowing in the central crater" (figure 26). The Volcano Discovery website noted that on 6 September 2011, Chris Weber reported fire fountaining reaching ~10 m high.
On 30 September, CVGHM reported that the seismometers were again operational following 18 September, and increased the Alert Level from 2 to 3 (on a scale from 1 to 4), citing visual and seismic observations. Visually, while no ash producing eruptions had occurred from 14-30 September, CVGHM reported that the E flank of the volcano was covered in solfataras, with thin gusts of smoke within the crater and along crater walls. They also reported vibration in the body of the volcano within distances of 700 m from the summit. Seismically, from 18-30 September, CVGHM reported persistent volcanic earthquakes (volcanic earthquake swarms), noting that volcanic earthquakes had reached a level of 4-5 events per minute. As of 3 October, the Alert Level remained at 3, and residents and tourists were prohibited within 2 km of the crater.
Plumbing of the Krakatau system.Three recent publications addressed magma generation and plumbing of the Krakatau system from different disciplinary approaches. Employing mineral-melt equilibria thermo-barometry on Krakatau's phenocryst phases of clinopyroxene and plagioclase, Dahren and others (2010) demonstrated that clinopyroxene crystallizes at 8-12 km depth, while plagioclase crystallizes at 4-6 km depth. The two crystallization depth ranges could suggest multiple magma storage regions in the Krakatau system. They also noted that clinopyroxenes erupted before 1981 recorded deeper crystallization (and thus storage) - depths of 8-22 km - indicating a shallowing of the plumbing system over the last ~ 40 years.
From seismic tomography and inversion, Jaxybulatov and others (2011) reported a multi-layered structure beneath the Krakatau system (figure 27). They found their model similar to the one noted above (Dahren and others, 2010). They also reported that the deep-focus earthquakes they studied (100-160 km focal depths) were likely related to phase transitions and fluid fluxes in the subducting slab. They suggested these could lead to diapirism and formation of magma chambers in the overlying mantle wedge and crust.
In their spatial and temporal analysis of seismological data from 1964-2005, Špièák and others (2011) reported both deepening and shallowing of earthquake foci over the past 40 ? 5 years (figure 28). This result is not dissimilar to that of Dahren and others (2010), but ?pièák and others (2011) concluded that the pattern reflects "depth variations of tectonic stress concentration rather than vertical migration of the source of magma." Similar to Jaxybulatov and others (2011), ?pièák and others (2011) also reported that the deepest events (~100 km) constrain the primary magma generation of the system to depths greater than 100 km. They further noted an aseismic gap in the Wadati-Benioff zone of the subducting plate at 100-120 km depth. They inferred that this gap is likely the consequence of partial melting "inhibiting stress concentration necessary to generate stronger earthquakes," while an increased occurrence of earthquakes in the lithospheric wedge above probably reflects magma ascent.
Revised first millenium eruption date. Prior to 2000, a caldera-forming event at Krakatau ("Proto-Krakatau") was hypothesized to have occurred circa 416 CE. From an intensive, multi-disciplinary approach, Wohletz (2000) hypothesized that the catastrophic event actually occurred in the year prior to widespread climate perturbation during 535-536 CE. He noted that the 338th century of the Shaka calendar was probably previously mis-aligned to 416 CE of the western calendar. Since Wohletz (2000), the date of this eruption is widely accepted as 535 CE (see inset of figure 23 for map representation of the caldera's topographic margin).
References. Dahren, B., Troll., V.R., Andersson, U., Chadwick, J.P., and Gardner, M.F., 2010, Investigating magma plumbing beneath Anak Krakatau volcano, Indonesia: evidence for multiple magma storage regions, Geophysical Research Abstracts, v. 12, 1607-7962; in7th EGU General Assembly, 2010.
Jaxybulatov, K., Koulakov, I., Ibs-von Seht, M., Klinge, K., Reichert, C., Dahren, B., and Troll, V.R., 2011, Evidence for high fluid/melt content beneath Krakatau volcano (Indonesia) from local earthquake tomography, Journal of Volcanology and Geothermal Research, v. 206, p. 96-105.
Špièák, A., Van?k, J., and Hanu?, V., 2011, Recent plumbing system of the Krakatau volcano revealed by teleseismic earthquake distribution, International Journal of Earth Sciences, v. 100, p. 1375-1381.
Wohletz K.H., 2000, Were the Dark Ages triggered by volcano-related climate changes in the 6th century? EOS Transactions of the American Geophys. Union, v. 48(81), F1305.
Geologic Background. The renowned Krakatau (frequently mis-named as Krakatoa) volcano lies in the Sunda Strait between Java and Sumatra. Collapse of an older edifice, perhaps in 416 or 535 CE, formed a 7-km-wide caldera. Remnants of that volcano are preserved in Verlaten and Lang Islands; subsequently the Rakata, Danan, and Perbuwatan cones were formed, coalescing to create the pre-1883 Krakatau Island. Caldera collapse during the catastrophic 1883 eruption destroyed Danan and Perbuwatan, and left only a remnant of Rakata. This eruption caused more than 36,000 fatalities, most as a result of tsunamis that swept the adjacent coastlines of Sumatra and Java. Pyroclastic surges traveled 40 km across the Sunda Strait and reached the Sumatra coast. After a quiescence of less than a half century, the post-collapse cone of Anak Krakatau (Child of Krakatau) was constructed within the 1883 caldera at a point between the former Danan and Perbuwatan cones. Anak Krakatau has been the site of frequent eruptions since 1927.
Information Contacts: Center for Volcanology and Geological Hazard Mitigation (CVGHM), Jl. Diponegoro 57, Bandung, West Java, Indonesia, 40 122 (URL: http://www.vsi.esdm.go.id/); Arnold Binas, Sydney, Australia (URL: http://www.arnoldbinas.com); Darwin Volcanic Ash Advisory Centre (VAAC) (URL: http://www.bom.gov.au/info/vaac/); The Jakarta Post (URL: http://www.thejakartapost.com/); TO:DAY (URL: http://today.co.id/); NASA Earth Observatory, NASA Goddard Space Flight Center (URL: http://earthobservatory.nasa.gov/); Andi Rosadi, Chris Weber, and Tom Pfeiffer, Volcano Discovery (URL: http://www.volcanodiscovery.com/).
Soufriere Hills (United Kingdom) — August 2011 Cite this Report
Soufriere Hills
United Kingdom
16.72°N, 62.18°W; summit elev. 915 m
All times are local (unless otherwise noted)
Extrusive pause follows 11 February 2010 partial dome collapse
Our previous report on Soufrière Hills volcano, Montserrat, (BGVN 35:03), was published in the month following the 11 February 2010 partial dome collapse, which consisted of 40-50 x 106 m3 of material (~20% of the dome's pre-collapse volume) and left a collapse scar ~ 300 m wide on the N flank of the dome. The ash column from this event reached ~15 km altitude, and large pyroclastic flows extended the island's E shoreline, creating ~1 km2 of new land surface. This event marked the end of Extrusive Phase 5, the most recent phase of extrusive activity since the volcano's awakening in 1995 (figure 88). Since then, and as recently as 9 September 2011, Soufrière Hills experienced a low level of activity with pyroclastic flows and rockfalls, but no significant extrusion of lava; a behavior typical of pauses in extrusion at this volcano since 1995 (figure 88). The Hazard Level remained at 3 (on a scale from 1 to 5). Most of the data and information in this report is from Cole and others, 2010 and Cole and others, 2011. Information has also been contributed by the Montserrat Volcano Observatory (MVO).
Pyroclastic flows and rockfalls removed 3.65 x 10⁶ m3 (~ 1.9 % volume) of the dome from 12 February 2010 to 30 April 2011. Of these events, 54 were small pyroclastic flows (maximum runout of 1 km) and 31 were moderate-large pyroclastic flows (maximum runout of 2 km), generated mainly from three source regions:(1) above Gages Valley (W side); (2) N of the head of the 11 February 2010 collapse scar; and (3) at the head of the Tar River Valley (ESE side).
Undercutting of the dome face above Gages Valley (W side) by heavy summer rainfall in 2010 compromised dome stability and led to the largest pyroclastic flows. Pyroclastic flows occasionally generated small plumes and ashfall in inhabited areas of the island.
Lahars in the Belham Valley (on the volcano's W side) decreased from 40 measurable events (during late February-October 2010) to 10 measurable events (during November 2010-April 2011). The lahars were well correlated with peak rainfall events, and the 40 lahars occurring from 28 February to 31 October 2010 were attributed to especially heavy rainfall occurring in the months of April, late July, September, and October 2010. Figure 89 shows a house in Belham Valley partially covered by lahar deposits.
As of 9 September 2011 the Washington Volcanic Ash Advisory Center (VAAC) reported eruptive plumes only a handful of times since 28 February 2010. Based on a METAR weather report and analyses of satellite imagery, on 10 August 2010 a narrow plume drifted 100 km WNW. According to the Washington VAAC, on 2 October 2010 the MVO reported that an ash plume rose to an altitude of 2.1 km altitude and drifted W. The next day an ash plume seen in satellite imagery drifted 55 km WNW and NW. A few hours later, an area of ash at an altitude of 2.1 km altitude was observed 140 km to the WNW. On 11 October a diffuse steam-and-gas plume drifted NNW.
Seismicity generally remained low, with low-frequency seismicity, long-period (LP), hybrid, and LP-rockfall events detected between 1 November 2010 and 9 September 2011 (figure 88). Short periods of volcano-tectonic (VT) earthquake activity on 25 June and 2 July 2010 were followed by ash venting; roaring could be heard N of the volcano. Another VT short swarm on 3 December 2010 was associated with an increase in gas emission and additional minor ash venting.
SO2 flux also remained low, with the daily average from 28 February 2010 to 30 April 2011 measured at 375 tons/day; low values typical of periods of pause. Elevated SO2 flux occurred in early May 2010 (up to 1,250 tons/day), November 2010, and March 2011 (figure 88).
During the reporting interval, mid-February 2010 to 9 September 2011, steady but weak inflation occurred, with only minor changes to the dome. The changes stemmed from mass wasting such as rockfalls and from pyroclastic flows.
Incandescence from various places on the lava dome was observed and analyzed (figure 90). The largest feature was a fumarolic gas vent on the floor of the 11 February collapse scar (see "Gas vent", figure 90 B, D). From the incandescent color, the temperature is estimated to be 500-600°C. Dome interior temperatures are considered likely nearly magmatic.
References. Cole, P., Bass, V., Christopher, T., Eligon, C., Murrell, C., Odbert, H., Smith, P., Stewart, R., Stinton, A., Syers, R., Robertson, R., and Williams, P., 2010, Report to the Scientific Advisory Committee on Volcanic Activity at Soufrière Hills Volcano Montserrat, Report on Activity between 28 February 2010 and 31 October 2010, Open File Report OFR 10-02a, Prepared for SAC 15: 15 ? 17 November 2010. Monsterrat Volcano Observatory (MVO).
Cole, P., Bass, V., Christopher, T., Murrell, C., Odbert, H., Smith, P., Stewart, R., Stinton, A., Syers, R., and Williams, P., 2011, MVO scientific report for volcanic activity between 1 November 2010 and 30 April 2011, Open File Report OFR 11-01. Monsterrat Volcano Observatory (MVO).
Geologic Background. The complex, dominantly andesitic Soufrière Hills volcano occupies the southern half of the island of Montserrat. The summit area consists primarily of a series of lava domes emplaced along an ESE-trending zone. The volcano is flanked by Pleistocene complexes to the north and south. English's Crater, a 1-km-wide crater breached widely to the east by edifice collapse, was formed about 2000 years ago as a result of the youngest of several collapse events producing submarine debris-avalanche deposits. Block-and-ash flow and surge deposits associated with dome growth predominate in flank deposits, including those from an eruption that likely preceded the 1632 CE settlement of the island, allowing cultivation on recently devegetated land to near the summit. Non-eruptive seismic swarms occurred at 30-year intervals in the 20th century, but no historical eruptions were recorded until 1995. Long-term small-to-moderate ash eruptions beginning in that year were later accompanied by lava-dome growth and pyroclastic flows that forced evacuation of the southern half of the island and ultimately destroyed the capital city of Plymouth, causing major social and economic disruption.
Information Contacts: Montserrat Volcano Observatory (MVO), Fleming, Montserrat, West Indies (URL: http://www.mvo.ms/); Washington Volcanic Ash Advisory Center (VAAC), Satellite Analysis Branch (SAB), NOAA/NESDIS E/SP23, NOAA Science Center Room 401, 5200 Auth Rd, Camp Springs, MD 20746, USA (URL: http://www.ospo.noaa.gov/Products/atmosphere/vaac/).
Tambora (Indonesia) — August 2011 Cite this Report
Tambora
Indonesia
8.25°S, 118°E; summit elev. 2850 m
All times are local (unless otherwise noted)
Increased seismicity and minor steam venting in 2011
Beginning in April 2011, Tambora volcano, Indonesia (figure 1), experienced increased seismic activity and minor steam venting. As a result, the Center for Volcanology and Geological Hazard Mitigation (CVGHM) raised the Alert Level for Tambora. This report will summarize the increased activity from April 2011 through 8 September 2011, as reported by CVGHM.
Seismicity at Tambora increased steadily from April 2011 to at least 8 September. CVGHM reported six seismic signals that were monitored: volcanic earthquakes (VA), shallow volcanic earthquakes (VB), distant tectonic earthquakes (TJ), local tectonic earthquakes (TL), low-frequency earthquakes (LF), and volcanic tremor. Seismic activity from April through August is summarized in figure 2. In addition to increased seismicity, ground-based observers described dense white plumes rising 50-75 m above the caldera rim in April and June.
Volcanic tremor started 29 August and continued every day since, with the exception of 3 September (table 1). The tremor was accompanied by diffuse plumes rising 10-20 m above the caldera rim on 29 August and 5 September. Based on seismic activity and visual observations, CVGHM raised the Alert Level to 2 (on a scale from 1 to 4) on 30 August, and forbade access to the peak of Tambora.
Table 1. Summary of seismicity at Tambora since the onset of volcanic tremor on 29 August 2011. On both 29 August and 5 September seismicity was accompanied by plumes rising 10-20 m above the caldera rim. Data from CVGHM.
| Date |
Volcanic A-type |
Volcanic B-type |
Local tectonic |
Low-frequency |
Tremor |
| 29 Aug 2011 |
14 |
-- |
3 |
-- |
continuous |
| 30 Aug 2011 |
9 |
5 |
2 |
1 |
continuous |
| 31 Aug 2011 |
6 |
5 |
-- |
2 |
continuous |
| 01 Sep 2011 |
15 |
-- |
2 |
2 |
continuous |
| 02 Sep 2011 |
6 |
4 |
4 |
6 |
11 |
| 03 Sep 2011 |
5 |
5 |
4 |
4 |
-- |
| 04 Sep 2011 |
6 |
1 |
3 |
4 |
11 |
| 05 Sep 2011 |
11 |
7 |
3 |
1 |
4 |
| 06 Sep 2011 |
7 |
4 |
-- |
-- |
continuous |
| 07 Sep 2011 |
40 |
6 |
1 |
-- |
continuous |
Along with the continuation of the tremor after 29 August, CVGHM reported an increase in other types of seismic activity from 30 August to 7 September. On 5 September an earthquake was felt by residents (exact location undisclosed). Instruments recorded 40 volcanic earthquakes on 7 September (table 1); 32 of those were recorded within 6 hours. On 8 September, CVGHM raised the Alert Level to 3, invoked a 3 km exclusion zone, and prohibited access to Disaster Prone Areas III, summarized in table 2. The Disaster Prone Areas were largely based on the devastating 1815 eruption of Tambora. As of 21 September, the Alert Level remained at 3.
Table 2. Summary of Disaster Prone Areas at Tambora defined on the basis of radial distance from the peak of Tambora. Courtesy of CVGHM.
| Area |
Radius from Tambora |
Potential hazards |
| Disaster Prone Area I |
8 km |
Lahars, ash fall, and incandescent bombs. |
| Disaster Prone Area II |
5 km |
Pyroclastic flows, lava flows, toxic gases, incandescent bombs, ash fall, lahars/mudflows, and high acidity in water. |
| Disaster Prone Area III |
3 km |
Pyroclastic flows, lava flows, toxic gases, incandescent bombs, and heavy ash fall. |
References. Wilford, J.N., 2006, Under an 1815 Volcano Eruption, Remains of a 'Lost Kingdom', the New York Times, URL: http://www.nytimes.com/2006/02/28/science/28volc.html; Posted 28 February 2006; accessed 26 September 2011.
Geologic Background. The massive Tambora stratovolcano forms the entire 60-km-wide Sanggar Peninsula on northern Sumbawa Island. The largely trachybasaltic-to-trachyandesitic volcano grew to about 4,000 m elevation before forming a caldera more than 43,000 years ago. Late-Pleistocene lava flows largely filled the early caldera, after which activity changed to dominantly explosive eruptions during the early Holocene. Tambora was the source of history's largest explosive eruption, in April 1815. Pyroclastic flows reached the sea on all sides of the peninsula, and heavy tephra fall devastated croplands, causing an estimated 60,000 fatalities. The eruption of an estimated more than 150 km3 of tephra formed a 6-km-wide, 1250-m-deep caldera and produced global climatic effects. Minor lava domes and flows have been extruded on the caldera floor at Tambora during the 19th and 20th centuries.
Information Contacts: Center for Volcanology and Geological Hazard Mitigation (CVGHM), Jl. Diponegoro 57, Bandung, West Java, Indonesia, 40 122 (URL: http://www.vsi.esdm.go.id/).
Tinakula (Solomon Islands) — August 2011 Cite this Report
Tinakula
Solomon Islands
10.386°S, 165.804°E; summit elev. 796 m
All times are local (unless otherwise noted)
MODVOLC thermal alerts extend through September 2011
Our previous report on Tinakula (BGVN 35:01) summarized MODVOLC thermal alert data through 27 February 2010. This report notes MODVOLC alerts through September 2011. Tinakula is a rarely visited or monitored island in the Santa Cruz Island complex, which is part of the Solomon Island group in the South Pacific ocean (figures 8-10).
An image captured on 25 May 2010 by the MODIS instrument aboard the Aqua satellite, showed an ash plume from the volcano. It is not known whether plumes during the time period of this report were frequent.
MODVOLC thermal alerts continued through the rest of 2010 and through at least September 2011. During March 2010 through October 2010, the number of alerts ranged from zero to three per month. The number of alerts rose to 10 in November and to 20 in December, then decreased to 11 in January 2011. Between February and 26 September 2011, the number of alerts ranged from two to 12 per month. In July 2011, the two recorded alerts were 4 pixels each, a high during the time period for this report.
References. Eissen, J-P., Blot, C., and Louat, R., 1991, Chronology of the historic volcanic activity of the New Hebrides island arc from 1595 to 1991: Rapports Scientifiques et Technique, Sciences de la Terre, No. 2, ORSTOM, France.Hughes, G.W., 1972, Geological map of Tinakula: Nendö sheet EOI 1, Soloman Geol. Survey, Honiara.McCoy, P.C., and Cleghorn, 1988, Archaeological Excavations on Santa Cruz (Nendö), Southeast Solomon Islands: Summary Report, pp. 104-115 (map on 105 and at URL: http://www.jstor.org/stable/40386813?seq=2),in Archaeology in Oceania.
Geologic Background. The small 3.5-km-wide island of Tinakula is the exposed summit of a massive stratovolcano at the NW end of the Santa Cruz islands. It has a breached summit crater that extends from the summit to below sea level. Landslides enlarged this scarp in 1965, creating an embayment on the NW coast. The Mendana cone is located on the SE side. The dominantly andesitic volcano has frequently been observed in eruption since the era of Spanish exploration began in 1595. In about 1840, an explosive eruption apparently produced pyroclastic flows that swept all sides of the island, killing its inhabitants. Recorded eruptions have frequently originated from a cone constructed within the large breached crater. These have left the upper flanks and the steep apron of lava flows and volcaniclastic debris within the breach unvegetated.
Information Contacts: Hawai'i Institute of Geophysics and Planetology (HIGP), MODVOLC Thermal Alerts System, School of Ocean and Earth Science and Technology (SOEST), Univ. of Hawai'i, 2525 Correa Road, Honolulu, HI 96822, USA (URL: http://modis.higp.hawaii.edu/); Iomoon.com (URL: http://www.iomoon.com/).