Recently Published Bulletin Reports
Kadovar (Papua New Guinea) An ash plume and weak thermal anomaly during May 2023
San Miguel (El Salvador) Small gas-and-ash explosions during March and May 2023
Ebeko (Russia) Continued explosions, ash plumes, and ashfall during October 2022-May 2023
Home Reef (Tonga) Discolored plumes continued during November 2022-April 2023
Semisopochnoi (United States) Occasional explosions, ash deposits, and gas-and-steam plumes during December 2022-May 2023
Ambae (Vanuatu) New lava flow, ash plumes, and sulfur dioxide plumes during February-May 2023
Ibu (Indonesia) Daily ash explosions continue, along with thermal anomalies in the crater, October 2022-May 2023
Dukono (Indonesia) Continuing ash emissions, SO2 plumes, and thermal signals during October 2022-May 2023
Sabancaya (Peru) Explosions, gas-and-ash plumes, and thermal activity persist during November 2022-April 2023
Sheveluch (Russia) Significant explosions destroyed part of the lava-dome complex during April 2023
Bezymianny (Russia) Explosions, ash plumes, lava flows, and avalanches during November 2022-April 2023
Chikurachki (Russia) New explosive eruption during late January-early February 2023
Kadovar (Papua New Guinea) — June 2023  Cite this Report
Kadovar
Papua New Guinea
3.608°S, 144.588°E; summit elev. 365 m
All times are local (unless otherwise noted)
An ash plume and weak thermal anomaly during May 2023
Kadovar is a 2-km-wide island that is the emergent summit of a Bismarck Sea stratovolcano. It lies off the coast of New Guinea, about 25 km N of the mouth of the Sepik River. Prior to an eruption that began in 2018, a lava dome formed the high point of the volcano, filling an arcuate landslide scarp open to the S. Submarine debris-avalanche deposits occur to the S of the island. The current eruption began in January 2018 and has comprised lava effusion from vents at the summit and at the E coast; more recent activity has consisted of ash plumes, weak thermal activity, and gas-and-steam plumes (BGVN 48:02). This report covers activity during February through May 2023 using information from the Darwin Volcanic Ash Advisory Center (VAAC) and satellite data.
Activity during the reporting period was relatively low and mainly consisted of white gas-and-steam plumes that were visible in natural color satellite images on clear weather days (figure 67). According to a Darwin VAAC report, at 2040 on 6 May an ash plume rose to 4.6 km altitude and drifted W; by 2300 the plume had dissipated. MODIS satellite instruments using the MODVOLC thermal algorithm detected a single thermal hotspot on the SE side of the island on 7 May. Weak thermal activity was also detected in a satellite image on the E side of the island on 14 May, accompanied by a white gas-and-steam plume that drifted SE (figure 68).
Geologic Background. The 2-km-wide island of Kadovar is the emergent summit of a Bismarck Sea stratovolcano of Holocene age. It is part of the Schouten Islands, and lies off the coast of New Guinea, about 25 km N of the mouth of the Sepik River. Prior to an eruption that began in 2018, a lava dome formed the high point of the andesitic volcano, filling an arcuate landslide scarp open to the south; submarine debris-avalanche deposits occur in that direction. Thick lava flows with columnar jointing forms low cliffs along the coast. The youthful island lacks fringing or offshore reefs. A period of heightened thermal phenomena took place in 1976. An eruption began in January 2018 that included lava effusion from vents at the summit and at the E coast.
Information Contacts: Darwin Volcanic Ash Advisory Centre (VAAC), Bureau of Meteorology, Northern Territory Regional Office, PO Box 40050, Casuarina, NT 0811, Australia (URL: http://www.bom.gov.au/info/vaac/); Hawai'i Institute of Geophysics and Planetology (HIGP) - MODVOLC Thermal Alerts System, School of Ocean and Earth Science and Technology (SOEST), Univ. of Hawai'i, 2525 Correa Road, Honolulu, HI 96822, USA (URL: http://modis.higp.hawaii.edu/); Copernicus Browser, Copernicus Data Space Ecosystem, European Space Agency (URL: https://dataspace.copernicus.eu/browser/).
San Miguel (El Salvador) — June 2023 Cite this Report
San Miguel
El Salvador
13.434°N, 88.269°W; summit elev. 2130 m
All times are local (unless otherwise noted)
Small gas-and-ash explosions during March and May 2023
San Miguel in El Salvador is a broad, deep crater complex that has been frequently modified by eruptions recorded since the early 16th century and consists of the summit known locally as Chaparrastique. Flank eruptions have produced lava flows that extended to the N, NE, and SE during the 17-19th centuries. The most recent activity has consisted of minor ash eruptions from the summit crater. The current eruption period began in November 2022 and has been characterized by frequent phreatic explosions, gas-and-ash emissions, and sulfur dioxide plumes (BGVN 47:12). This report describes small gas-and-ash explosions during December 2022 through May 2023 based on special reports from the Ministero de Medio Ambiente y Recursos Naturales (MARN).
Activity has been relatively low since the last recorded explosions on 29 November 2022. Seismicity recorded by the San Miguel Volcano Station (VSM) located on the N flank at 1.7 km elevation had decreased by 7 December. Sulfur dioxide gas measurements taken with DOAS (Differential Optical Absorption Spectroscopy) mobile equipment were below typical previously recorded values: 300 tons per day (t/d). During December, small explosions were recorded by the seismic network and manifested as gas-and-steam emissions.
Gas-and-ash explosions in the crater occurred during January 2023, which were recorded by the seismic network. Sulfur dioxide values remained low, between 300-400 t/d through 10 March. At 0817 on 14 January a gas-and-ash emission was visible in webcam images, rising just above the crater rim. Some mornings during February, small gas-and-steam plumes were visible in the crater. On 7 March at 2252 MARN noted an increase in degassing from the central crater; gas emissions were constantly observed through the early morning hours on 8 March. During the early morning of 8 March through the afternoon on 9 March, 12 emissions were registered, some accompanied by ash. The last gas-and-ash emission was recorded at 1210 on 9 March; very fine ashfall was reported in El Tránsito (10 km S), La Morita (6 km W), and La Piedrita (3 km W). The smell of sulfur was reported in Piedra Azul (5 km SW). On 16 March MARN reported that gas-and-steam emissions decreased.
Low degassing and very low seismicity were reported during April; no explosions have been detected between 9 March and 27 May. The sulfur dioxide emissions remained between 350-400 t/d; during 13-20 April sulfur dioxide values fluctuated between 30-300 t/d. Activity remained low through most of May; on 23 May seismicity increased. An explosion was detected at 1647 on 27 May generated a gas-and-ash plume that rose 700 m high (figure 32); a decrease in seismicity and gas emissions followed. The DOAS station installed on the W flank recorded sulfur dioxide values that reached 400 t/d on 27 May; subsequent measurements showed a decrease to 268 t/d on 28 May and 100 t/d on 29 May.
Geologic Background. The symmetrical cone of San Miguel, one of the most active volcanoes in El Salvador, rises from near sea level to form one of the country's most prominent landmarks. A broad, deep, crater complex that has been frequently modified by eruptions recorded since the early 16th century caps the truncated unvegetated summit, also known locally as Chaparrastique. Flanks eruptions of the basaltic-andesitic volcano have produced many lava flows, including several during the 17th-19th centuries that extended to the N, NE, and SE. The SE-flank flows are the largest and form broad, sparsely vegetated lava fields crossed by highways and a railroad skirting the base of the volcano. Flank vent locations have migrated higher on the edifice during historical time, and the most recent activity has consisted of minor ash eruptions from the summit crater.
Information Contacts: Ministero de Medio Ambiente y Recursos Naturales (MARN), Km. 5½ Carretera a Nueva San Salvador, Avenida las Mercedes, San Salvador, El Salvador (URL: http://www.snet.gob.sv/ver/vulcanologia).
Ebeko
Russia
50.686°N, 156.014°E; summit elev. 1103 m
All times are local (unless otherwise noted)
Continued explosions, ash plumes, and ashfall during October 2022-May 2023
Ebeko, located on the N end of Paramushir Island in the Kuril Islands, consists of three summit craters along a SSW-NNE line at the northern end of a complex of five volcanic cones. Eruptions date back to the late 18th century and have been characterized as small-to-moderate explosions from the summit crater, accompanied by intense fumarolic activity. The current eruption period began in June 2022 and has recently consisted of frequent explosions, ash plumes, and thermal activity (BGVN 47:10). This report covers similar activity during October 2022 through May 2023, based on information from the Kamchatka Volcanic Eruptions Response Team (KVERT) and satellite data.
Activity during October consisted of explosive activity, ash plumes, and occasional thermal anomalies. Visual data by volcanologists from Severo-Kurilsk showed explosions producing ash clouds up to 2.1-3 km altitude which drifted E, N, NE, and SE during 1-8, 10, 16, and 18 October. KVERT issued several Volcano Observatory Notices for Aviation (VONA) on 7, 13-15, and 27 October 2022, stating that explosions generated ash plumes that rose to 2.3-4 km altitude and drifted 5 km E, NE, and SE. Ashfall was reported in Severo-Kurilsk (Paramushir Island, about 7 km E) on 7 and 13 October. Satellite data showed a thermal anomaly over the volcano on 15-16 October. Visual data showed ash plumes rising to 2.5-3.6 km altitude on 22, 25-29, and 31 October and moving NE due to constant explosions.
Similar activity continued during November, with explosions, ash plumes, and ashfall occurring. KVERT issued VONAs on 1-2, 4, 6-7, 9, 13, and 16 November that reported explosions and resulting ash plumes that rose to 1.7-3.6 km altitude and drifted 3-5 km SE, ESE, E, and NE. On 1 November ash plumes extended as far as 110 km SE. On 5, 8, 12, and 24-25 November explosions and ash plumes rose to 2-3.1 km altitude and drifted N and E. Ashfall was observed in Severo-Kurilsk on 7 and 16 November. A thermal anomaly was visible during 1-4, 16, and 20 November. Explosions during 26 November rose as high as 2.7 km altitude and drifted NE (figure 45).
Explosions and ash plumes continued to occur in December. During 1-2 and 4 December volcanologists from Severo-Kurilsk observed explosions that sent ash to 1.9-2.5 km altitude and drifted NE and SE (figure 46). VONAs were issued on 5, 9, and 16 December reporting that explosions generated ash plumes rising to 1.9 km, 2.6 km, and 2.4 km altitude and drifted 5 km SE, E, and NE, respectively. A thermal anomaly was visible in satellite imagery on 16 December. On 18 and 27-28 December explosions produced ash plumes that rose to 2.5 km altitude and drifted NE and SE. On 31 December an ash plume rose to 2 km altitude and drifted NE.
Explosions continued during January 2023, based on visual observations by volcanologists from Severo-Kurilsk. During 1-7 January explosions generated ash plumes that rose to 4 km altitude and drifted NE, E, W, and SE. According to VONAs issued by KVERT on 2, 4, 10, and 23 January, explosions produced ash plumes that rose to 2-4 km altitude and drifted 5 km N, NE, E, and ENE; the ash plume that rose to 4 km altitude occurred on 10 January (figure 47). Satellite data showed a thermal anomaly during 3-4, 10, 13, 16, 21, 22, and 31 January. KVERT reported that an ash cloud on 4 January moved 12 km NE. On 6 and 9-11 January explosions sent ash plumes to 4.5 km altitude and drifted W and ESE. On 13 January an ash plume rose to 3 km altitude and drifted SE. During 20-24 January ash plumes from explosions rose to 3.7 km altitude and drifted SE, N, and NE. On 21 January the ash plume drifted as far as 40 km NE. During 28-29 and 31 January and 1 February ash plumes rose to 4 km altitude and drifted NE.
During February, explosions, ash plumes, and ashfall were reported. During 1, 4-5 and 7-8 February explosions generated ash plumes that rose to 4.5 km altitude and drifted E and NE; ashfall was observed on 5 and 8 February. On 6 February an explosion produced an ash plume that rose to 3 km altitude and drifted 7 km E, causing ashfall in Severo-Kurilsk. A thermal anomaly was visible in satellite data on 8, 9, 13, and 21 February. Explosions on 9 and 12-13 February produced ash plumes that rose to 4 km altitude and drifted E and NE; the ash cloud on 12 February extended as far as 45 km E. On 22 February explosions sent ash to 3 km altitude that drifted E. During 24 and 26-27 February ash plumes rose to 4 km altitude and drifted E. On 28 February an explosion sent ash to 2.5-3 km altitude and drifted 5 km E; ashfall was observed in Severo-Kurilsk.
Activity continued during March; visual observations showed that explosions generated ash plumes that rose to 3.6 km altitude on 3, 5-7, and 9-12 March and drifted E, NE, and NW. Thermal anomalies were visible on 10, 13, and 29-30 March in satellite imagery. On 18, 21-23, 26, and 29-30 March explosions produced ash plumes that rose to 2.8 km altitude and drifted NE and E; the ash plumes during 22-23 March extended up to 76 km E. A VONA issued on 21 March reported an explosion that produced an ash plume that rose to 2.8 km altitude and drifted 5 km E. Another VONA issued on 23 March reported that satellite data showed an ash plume rising to 3 km altitude and drifted 14 km E.
Explosions during April continued to generate ash plumes. On 1 and 4 April an ash plume rose to 2.8-3.5 km altitude and drifted SE and NE. A thermal anomaly was visible in satellite imagery during 1-6 April. Satellite data showed ash plumes and clouds rising to 2-3 km altitude and drifting up to 12 km SW and E on 3 and 6 April (figure 48). KVERT issued VONAs on 3, 5, 14, 16 April describing explosions that produced ash plumes rising to 3 km, 3.5 km, 3.5 km, and 3 km altitude and drifting 5 km S, 5 km NE and SE, 72 km NNE, and 5 km NE, respectively. According to satellite data, the resulting ash cloud from the explosion on 14 April was 25 x 7 km in size and drifted 72-104 km NNE during 14-15 April. According to visual data by volcanologists from Severo-Kurilsk explosions sent ash up to 3.5 km altitude that drifted NE and E during 15-16, 22, 25-26, and 29 April.
The explosive eruption continued during May. Explosions during 3-4, 6-7, and 9-10 May generated ash plumes that rose to 4 km altitude and drifted SW and E. Satellite data showed a thermal anomaly on 3, 9, 13-14, and 24 May. During 12-16, 23-25, and 27-28 May ash plumes rose to 3.5 km altitude and drifted in different directions due to explosions. Two VONA notices were issued on 16 and 25 May, describing explosions that generated ash plumes rising to 3 km and 3.5 km altitude, respectively and extending 5 km E. The ash cloud on 25 May drifted 75 km SE.
Thermal activity in the summit crater, occasionally accompanied by ash plumes and ash deposits on the SE and E flanks due to frequent explosions, were visible in infrared and true color satellite images (figure 49).
Geologic Background. The flat-topped summit of the central cone of Ebeko volcano, one of the most active in the Kuril Islands, occupies the northern end of Paramushir Island. Three summit craters located along a SSW-NNE line form Ebeko volcano proper, at the northern end of a complex of five volcanic cones. Blocky lava flows extend west from Ebeko and SE from the neighboring Nezametnyi cone. The eastern part of the southern crater contains strong solfataras and a large boiling spring. The central crater is filled by a lake about 20 m deep whose shores are lined with steaming solfataras; the northern crater lies across a narrow, low barrier from the central crater and contains a small, cold crescentic lake. Historical activity, recorded since the late-18th century, has been restricted to small-to-moderate explosive eruptions from the summit craters. Intense fumarolic activity occurs in the summit craters, on the outer flanks of the cone, and in lateral explosion craters.
Information Contacts: Kamchatka Volcanic Eruptions Response Team (KVERT), Far Eastern Branch, Russian Academy of Sciences, 9 Piip Blvd., Petropavlovsk-Kamchatsky, 683006, Russia (URL: http://www.kscnet.ru/ivs/kvert/); MIROVA (Middle InfraRed Observation of Volcanic Activity), a collaborative project between the Universities of Turin and Florence (Italy) supported by the Centre for Volcanic Risk of the Italian Civil Protection Department (URL: http://www.mirovaweb.it/); Copernicus Browser, Copernicus Data Space Ecosystem, European Space Agency (URL: https://dataspace.copernicus.eu/browser/).
Home Reef
Tonga
18.992°S, 174.775°W; summit elev. -10 m
All times are local (unless otherwise noted)
Discolored plumes continued during November 2022-April 2023
Home Reef is a submarine volcano located in the central Tonga islands between Lateiki (Metis Shoal) and Late Island. The first recorded eruption occurred in the mid-19th century, when an ephemeral island formed. An eruption in 1984 produced a 12-km-high eruption plume, a large volume of floating pumice, and an ephemeral island 500 x 1,500 m wide, with cliffs 30-50 m high that enclosed a water-filled crater. Another island-forming eruption in 2006 produced widespread pumice rafts that drifted as far as Australia; by 2008 the island had eroded below sea level. The previous eruption occurred during October 2022 and was characterized by a new island-forming eruption, lava effusion, ash plumes, discolored water, and gas-and-steam plumes (BGVN 47:11). This report covers discolored water plumes during November 2022 through April 2023 using satellite data.
Discolored plumes continued during the reporting period and were observed in true color satellite images on clear weather days. Satellite images show light green-yellow discolored water extending W on 8 and 28 November 2022 (figure 31), and SW on 18 November. Light green-yellow plumes extended W on 3 December, S on 13 December, SW on 18 December, and W and S on 23 December (figure 31). On 12 January 2023 discolored green-yellow plumes extended to the NE, E, SE, and N. The plume moved SE on 17 January and NW on 22 January. Faint discolored water in February was visible moving NE on 1 February. A discolored plume extended NW on 8 and 28 March and NW on 13 March (figure 31). During April, clear weather showed green-blue discolored plumes moving S on 2 April, W on 7 April, and NE and S on 12 April. A strong green-yellow discolored plume extended E and NE on 22 April for several kilometers (figure 31).
Geologic Background. Home Reef, a submarine volcano midway between Metis Shoal and Late Island in the central Tonga islands, was first reported active in the mid-19th century, when an ephemeral island formed. An eruption in 1984 produced a 12-km-high eruption plume, large amounts of floating pumice, and an ephemeral 500 x 1,500 m island, with cliffs 30-50 m high that enclosed a water-filled crater. In 2006 an island-forming eruption produced widespread dacitic pumice rafts that drifted as far as Australia. Another island was built during a September-October 2022 eruption.
Information Contacts: Copernicus Browser, Copernicus Data Space Ecosystem, European Space Agency (URL: https://dataspace.copernicus.eu/browser/).
Semisopochnoi (United States) — June 2023 Cite this Report
Semisopochnoi
United States
51.93°N, 179.58°E; summit elev. 1221 m
All times are local (unless otherwise noted)
Occasional explosions, ash deposits, and gas-and-steam plumes during December 2022-May 2023
Semisopochnoi is located in the western Aleutians, is 20-km-wide at sea level, and contains an 8-km-wide caldera. The three-peaked Mount Young (formerly Cerberus) was constructed within the caldera during the Holocene. Each of these peaks contains a summit crater; the lava flows on the N flank appear younger than those on the S side. The current eruption period began in early February 2021 and has more recently consisted of intermittent explosions and ash emissions (BGVN 47:12). This report updates activity during December 2022 through May 2023 using daily, weekly, and special reports from the Alaska Volcano Observatory (AVO). AVO monitors the volcano using local seismic and infrasound sensors, satellite data, web cameras, and remote infrasound and lightning networks.
Activity during most of December 2022 was relatively quiet; according to AVO no eruptive or explosive activity was observed since 7 November 2022. Intermittent tremor and occasional small earthquakes were observed in geophysical data. Continuous gas-and-steam emissions were observed from the N crater of Mount Young in webcam images on clear weather days (figure 25). On 24 December, there was a slight increase in earthquake activity and several small possible explosion signals were detected in infrasound data. Eruptive activity resumed on 27 December at the N crater of Mount Young; AVO issued a Volcano Activity Notice (VAN) that reported minor ash deposits on the flanks of Mount Young that extended as far as 1 km from the vent, according to webcam images taken during 27-28 December (figure 26). No ash plumes were observed in webcam or satellite imagery, but a persistent gas-and-steam plume that might have contained some ash rose to 1.5 km altitude. As a result, AVO raised the Aviation Color Code (ACC) to Orange (the second highest level on a four-color scale) and the Volcano Alert Level (VAL) to Watch (the second highest level on a four-level scale). Possible explosions were detected during 21 December 2022 through 1 January 2023 and seismic tremor was recorded during 30-31 December.
During January 2023 eruptive activity continued at the active N crater of Mount Young. Minor ash deposits were observed on the flanks, extending about 2 km SSW, based on webcam images from 1 and 3 January. A possible explosion occurred during 1-2 January based on elevated seismicity recorded on local seismometers and an infrasound signal recorded minutes later by an array at Adak. Though no ash plumes were observed in webcam or satellite imagery, a persistent gas-and-steam plume rose to 1.5 km altitude that might have carried minor traces of ash. Ash deposits were accompanied by periods of elevated seismicity and infrasound signals from the local geophysical network, which AVO reported were likely due to weak explosive activity. Low-level explosive activity was also detected during 2-3 January, with minor gas-and-steam emissions and a new ash deposit that was visible in webcam images. Low-level explosive activity was detected in geophysical data during 4-5 January, with elevated seismicity and infrasound signals observed on local stations. Volcanic tremor was detected during 7-9 January and very weak explosive activity was detected in seismic and infrasound data on 9 January. Weak seismic and infrasound signals were recorded on 17 January, which indicated minor explosive activity, but no ash emissions were observed in clear webcam images; a gas-and-steam plume continued to rise to 1.5 km altitude. During 29-30 January, ash deposits near the summit were observed on fresh snow, according to webcam images.
The active N cone at Mount Young continued to produce a gas-and-steam plume during February, but no ash emissions or explosive events were detected. Seismicity remained elevated with faint tremor during early February. Gas-and-steam emissions from the N crater were observed in clear webcam images on 11-13 and 16 February; no explosive activity was detected in seismic, infrasound, or satellite data. Seismicity has also decreased, with no significant seismic tremor observed since 25 January. Therefore, the ACC was lowered to Yellow (the second lowest level on a four-color scale) and the VAL was lowered to Advisory (the second lowest level on a four-color scale) on 22 February.
Gas-and-steam emissions persisted during March from the N cone of Mount Young, based on clear webcam images. A few brief episodes of weak tremor were detected in seismic data, although seismicity decreased over the month. A gas-and-steam plume detected in satellite data extended 150 km on 18 March. Low-level ash emissions from the N cone at Mount Young were observed in several webcam images during 18-19 March, in addition to small explosions and volcanic tremor. The ACC was raised to Orange and the VAL increased to Watch on 19 March. A small explosion was detected in seismic and infrasound data on 21 March.
Low-level unrest continued during April, although cloudy weather often obscured views of the summit; periods of seismic tremor and local earthquakes were recorded. During 3-4 April a gas-and-steam plume was visible traveling more than 200 km overnight; no ash was evident in the plume, according to AVO. A gas-and-steam plume was observed during 4-6 April that extended 400 km but did not seem to contain ash. Small explosions were detected in seismic and infrasound data on 5 April. Occasional clear webcam images showed continuing gas-and-steam emissions rose from Mount Young, but no ash deposits were observed on the snow. On 19 April small explosions and tremor were detected in seismic and infrasound data. A period of seismic tremor was detected during 22-25 April, with possible weak explosions on 25 April. Ash deposits were visible near the crater rim, but it was unclear if these deposits were recent or due to older deposits.
Occasional small earthquakes were recorded during May, but there were no signs of explosive activity seen in geophysical data. Gas-and-steam emissions continued from the N crater of Mount Young, based on webcam images, and seismicity remained slightly elevated. A new, light ash deposit was visible during the morning of 5 May on fresh snow on the NW flank of Mount Young. During 10 May periods of volcanic tremor were observed. The ACC was lowered to Yellow and the VAL to Advisory on 17 May due to no additional evidence of activity.
Geologic Background. Semisopochnoi, the largest subaerial volcano of the western Aleutians, is 20 km wide at sea level and contains an 8-km-wide caldera. It formed as a result of collapse of a low-angle, dominantly basaltic volcano following the eruption of a large volume of dacitic pumice. The high point of the island is Anvil Peak, a double-peaked late-Pleistocene cone that forms much of the island's northern part. The three-peaked Mount Cerberus (renamed Mount Young in 2023) was constructed within the caldera during the Holocene. Each of the peaks contains a summit crater; lava flows on the N flank appear younger than those on the south side. Other post-caldera volcanoes include the symmetrical Sugarloaf Peak SSE of the caldera and Lakeshore Cone, a small cinder cone at the edge of Fenner Lake in the NE part of the caldera. Most documented eruptions have originated from Young, although Coats (1950) considered that both Sugarloaf and Lakeshore Cone could have been recently active.
Information Contacts: Alaska Volcano Observatory (AVO), a cooperative program of a) U.S. Geological Survey, 4200 University Drive, Anchorage, AK 99508-4667 USA (URL: https://avo.alaska.edu/), b) Geophysical Institute, University of Alaska, PO Box 757320, Fairbanks, AK 99775-7320, USA, and c) Alaska Division of Geological & Geophysical Surveys, 794 University Ave., Suite 200, Fairbanks, AK 99709, USA (URL: http://dggs.alaska.gov/).
Ambae
Vanuatu
15.389°S, 167.835°E; summit elev. 1496 m
All times are local (unless otherwise noted)
New lava flow, ash plumes, and sulfur dioxide plumes during February-May 2023
Ambae, also known as Aoba, is a large basaltic shield volcano in Vanuatu. A broad pyroclastic cone containing three crater lakes (Manaro Ngoru, Voui, and Manaro Lakua) is located at the summit within the youngest of at least two nested calderas. Periodic phreatic and pyroclastic explosions have been reported since the 16th century. A large eruption more than 400 years ago resulted in a volcanic cone within the summit crater that is now filled by Lake Voui; the similarly sized Lake Manaro fills the western third of the caldera. The previous eruption ended in August 2022 that was characterized by gas-and-steam and ash emissions and explosions of wet tephra (BGVN 47:10). This report covers a new eruption during February through May 2023 that consisted of a new lava flow, ash plumes, and sulfur dioxide emissions, using information from the Vanuatu Meteorology and Geo-Hazards Department (VMGD) and satellite data.
During the reporting period, the Alert Level remained at a 2 (on a scale of 0-5), which has been in place since December 2021. Activity during October 2022 through March 2023 remained relatively low and mostly consisted of gas-and-steam emissions in Lake Voui. VMGD reported that at 1300 on 15 November a satellite image captured a strong amount of sulfur dioxide rising above the volcano (figure 99), and that seismicity slightly increased. The southern and northern part of the island reported a strong sulfur dioxide smell and heard explosions. On 20 February 2023 a gas-and-ash plume rose 1.3 km above the summit and drifted SSW, according to a webcam image (figure 100). Gas-and-steam and possibly ash emissions continued on 23 February and volcanic earthquakes were recorded by the seismic network.
During April, volcanic earthquakes and gas-and-steam and ash emissions were reported from the cone in Lake Voui. VMGD reported that activity increased during 5-7 April; high gas-and-steam and ash plumes were visible, accompanied by nighttime incandescence. According to a Wellington VAAC report, a low-level ash plume rose as high as 2.5 km above the summit and drifted W and SW on 5 April, based on satellite imagery. Reports in Saratamata stated that a dark ash plume drifted to the WSW, but no loud explosion was heard. Webcam images from 2100 showed incandescence above the crater and reflected in the clouds. According to an aerial survey, field observations, and satellite data, water was no longer present in the lake. A lava flow was reported effusing from the vent and traveling N into the dry Lake Voui, which lasted three days. The next morning at 0745 on 6 April a gas-and-steam and ash plume rose 5.4 km above the summit and drifted ESE, based on information from VMGD (figure 101). The Wellington VAAC also reported that light ashfall was observed on the island. Intermittent gas-and-steam and ash emissions were visible on 7 April, some of which rose to an estimated 3 km above the summit and drifted E. Webcam images during 0107-0730 on 7 April showed continuing ash emissions. A gas-and-steam and ash plume rose 695 m above the summit crater at 0730 on 19 April and drifted ESE, based on a webcam image (figure 102).
According to visual and infrared satellite data, water was visible in Lake Voui as late as 24 March 2023 (figure 103). The vent in the caldera showed a gas-and-steam plume drifted SE. On 3 April thermal activity was first detected, accompanied by a gas-and-ash plume that drifted W (figure 103). The lava flow moved N within the dry lake and was shown cooling by 8 April. By 23 April much of the water in the lake had returned. Occasional sulfur dioxide plumes were detected by the TROPOMI instrument on the Sentinel-5P satellite that exceeded 2 Dobson Units (DU) and drifted in different directions (figure 104).
Geologic Background. The island of Ambae, also known as Aoba, is a massive 2,500 km3 basaltic shield that is the most voluminous volcano of the New Hebrides archipelago. A pronounced NE-SW-trending rift zone with numerous scoria cones gives the 16 x 38 km island an elongated form. A broad pyroclastic cone containing three crater lakes (Manaro Ngoru, Voui, and Manaro Lakua) is located at the summit within the youngest of at least two nested calderas, the largest of which is 6 km in diameter. That large central edifice is also called Manaro Voui or Lombenben volcano. Post-caldera explosive eruptions formed the summit craters about 360 years ago. A tuff cone was constructed within Lake Voui (or Vui) about 60 years later. The latest known flank eruption, about 300 years ago, destroyed the population of the Nduindui area near the western coast.
Information Contacts: Geo-Hazards Division, Vanuatu Meteorology and Geo-Hazards Department (VMGD), Ministry of Climate Change Adaptation, Meteorology, Geo-Hazards, Energy, Environment and Disaster Management, Private Mail Bag 9054, Lini Highway, Port Vila, Vanuatu (URL: http://www.vmgd.gov.vu/, https://www.facebook.com/VanuatuGeohazardsObservatory/); Wellington Volcanic Ash Advisory Centre (VAAC), Meteorological Service of New Zealand Ltd (MetService), PO Box 722, Wellington, New Zealand (URL: http://www.metservice.com/vaac/, http://www.ssd.noaa.gov/VAAC/OTH/NZ/messages.html); MIROVA (Middle InfraRed Observation of Volcanic Activity), a collaborative project between the Universities of Turin and Florence (Italy) supported by the Centre for Volcanic Risk of the Italian Civil Protection Department (URL: http://www.mirovaweb.it/); Global Sulfur Dioxide Monitoring Page, Atmospheric Chemistry and Dynamics Laboratory, NASA Goddard Space Flight Center (NASA/GSFC), 8800 Greenbelt Road, Goddard, Maryland, USA (URL: https://so2.gsfc.nasa.gov/); Copernicus Browser, Copernicus Data Space Ecosystem, European Space Agency (URL: https://dataspace.copernicus.eu/browser/).
Ibu
Indonesia
1.488°N, 127.63°E; summit elev. 1325 m
All times are local (unless otherwise noted)
Daily ash explosions continue, along with thermal anomalies in the crater, October 2022-May 2023
Persistent eruptive activity since April 2008 at Ibu, a stratovolcano on Indonesian’s Halmahera Island, has consisted of daily explosive ash emissions and plumes, along with observations of thermal anomalies (BGVN 47:04). The current eruption continued during October 2022-May 2023, described below, based on advisories issued by the Pusat Vulkanologi dan Mitigasi Bencana Geologi (PVMBG, also known as Indonesian Center for Volcanology and Geological Hazard Mitigation, CVGHM), daily reports by MAGMA Indonesia (a PVMBG platform), and the Darwin Volcanic Ash Advisory Centre (VAAC), and various satellite data. The Alert Level during the reporting period remained at 2 (on a scale of 1-4), except raised briefly to 3 on 27 May, and the public was warned to stay at least 2 km away from the active crater and 3.5 km away on the N side of the volcano.
According to MAGMA Indonesia, during October 2022-May 2023, daily gray-and-white ash plumes of variable densities rose 200-1,000 m above the summit and drifted in multiple directions. On 30 October and 11 November, plumes rose a maximum of 2 km and 1.5 km above the summit, respectively (figures 42 and 43). According to the Darwin VAAC, discrete ash emissions on 13 November rose to 2.1 km altitude, or 800 m above the summit, and drifted W, and multiple ash emissions on 15 November rose 1.4 km above the summit and drifted NE. Occasional larger ash explosions through May 2023 prompted PVMBG to issue Volcano Observatory Notice for Aviation (VONA) alerts (table 6); the Aviation Color Code remained at Orange throughout this period.
Table 6. Volcano Observatory Notice for Aviation (VONA) ash plume alerts for Ibu issued by PVMBG during October 2022-May 2023. Maximum height above the summit was estimated by a ground observer. VONAs in January-May 2023 all described the ash plumes as dense.
| Date |
Time (local) |
Max height above summit |
Direction |
| 17 Oct 2022 |
0858 |
800 m |
SW |
| 18 Oct 2022 |
1425 |
800 m |
S |
| 19 Oct 2022 |
2017 |
600 m |
SW |
| 21 Oct 2022 |
0916 |
800 m |
NW |
| 16 Jan 2023 |
1959 |
600 m |
NE |
| 22 Jan 2023 |
0942 |
1,000 m |
E |
| 29 Jan 2023 |
2138 |
1,000 m |
E |
| 10 May 2023 |
0940 |
800 m |
NW |
| 10 May 2023 |
2035 |
600 m |
E |
| 21 May 2023 |
2021 |
600 m |
W |
| 21 May 2023 |
2140 |
1,000 m |
W |
| 29 May 2023 |
1342 |
800 m |
N |
| 31 May 2023 |
1011 |
1,000 m |
SW |
Sentinel-2 L1C satellite images throughout the reporting period show two, sometimes three persistent thermal anomalies in the summit crater, with the most prominent hotspot from the top of a cone within the crater. Clear views were more common during March-April 2023, when a vent and lava flows on the NE flank of the intra-crater cone could be distinguished (figure 44). White-to-grayish emissions were also observed during brief periods when weather clouds allowed clear views.
The MIROVA space-based volcano hotspot detection system recorded almost daily thermal anomalies throughout the reporting period, though cloud cover often interfered with detections. Data from imaging spectroradiometers aboard NASA’s Aqua and Terra satellites and processed using the MODVOLC algorithm (MODIS-MODVOLC) recorded hotspots on one day during October 2022 and December 2022, two days in April 2023, three days in November 2022 and May 2023, and four days in March 2023.
Geologic Background. The truncated summit of Gunung Ibu stratovolcano along the NW coast of Halmahera Island has large nested summit craters. The inner crater, 1 km wide and 400 m deep, has contained several small crater lakes. The 1.2-km-wide outer crater is breached on the N, creating a steep-walled valley. A large cone grew ENE of the summit, and a smaller one to the WSW has fed a lava flow down the W flank. A group of maars is located below the N and W flanks. The first observed and recorded eruption was a small explosion from the summit crater in 1911. Eruptive activity began again in December 1998, producing a lava dome that eventually covered much of the floor of the inner summit crater along with ongoing explosive ash emissions.
Information Contacts: Pusat Vulkanologi dan Mitigasi Bencana Geologi (PVMBG, also known as Indonesian Center for Volcanology and Geological Hazard Mitigation, CVGHM), Jalan Diponegoro 57, Bandung 40122, Indonesia (URL: http://www.vsi.esdm.go.id/); MAGMA Indonesia (Multiplatform Application for Geohazard Mitigation and Assessment in Indonesia), Kementerian Energi dan Sumber Daya Mineral (URL: https://magma.esdm.go.id/v1); Copernicus Browser, Copernicus Data Space Ecosystem, European Space Agency (URL: https://dataspace.copernicus.eu/browser/); MIROVA (Middle InfraRed Observation of Volcanic Activity), a collaborative project between the Universities of Turin and Florence (Italy) supported by the Centre for Volcanic Risk of the Italian Civil Protection Department (URL: http://www.mirovaweb.it/); Hawai'i Institute of Geophysics and Planetology (HIGP) - MODVOLC Thermal Alerts System, School of Ocean and Earth Science and Technology (SOEST), Univ. of Hawai'i, 2525 Correa Road, Honolulu, HI 96822, USA (URL: http://modis.higp.hawaii.edu/).
Dukono
Indonesia
1.6992°N, 127.8783°E; summit elev. 1273 m
All times are local (unless otherwise noted)
Continuing ash emissions, SO2 plumes, and thermal signals during October 2022-May 2023
Dukono, a remote volcano on Indonesia’s Halmahera Island, has been erupting continuously since 1933, with frequent ash explosions and sulfur dioxide plumes (BGVN 46:11, 47:10). This activity continued during October 2022 through May 2023, based on reports from the Pusat Vulkanologi dan Mitigasi Bencana Geologi (PVMBG; also known as Indonesian Center for Volcanology and Geological Hazard Mitigation, CVGHM), the Darwin Volcanic Ash Advisory Centre (VAAC), and satellite data. During this period, the Alert Level remained at 2 (on a scale of 1-4) and the public was warned to remain outside of the 2-km exclusion zone. The highest reported plume of the period reached 9.4 km above the summit on 14 November 2022.
According to MAGMA Indonesia (a platform developed by PVMBG), white, gray, or dark plumes of variable densities were observed almost every day during the reporting period, except when fog obscured the volcano (figure 33). Plumes generally rose 25-450 m above the summit, but rose as high as 700-800 m on several days, somewhat lower than the maximum heights reached earlier in 2022 when plumes reached as high as 1 km. However, the Darwin VAAC reported that on 14 November 2022, a discrete ash plume rose 9.4 km above the summit (10.7 km altitude), accompanied by a strong hotspot and a sulfur dioxide signal observed in satellite imagery; a continuous ash plume that day and through the 15th rose to 2.1-2.4 km altitude and drifted NE.
Sentinel-2 images were obscured by weather clouds almost every viewing day during the reporting period. However, the few reasonably clear images showed a hotspot and white or gray emissions and plumes. Strong SO2 plumes from Dukono were present on many days during October 2022-May 2023, as detected using the TROPOMI instrument on the Sentinel-5P satellite (figure 34).
Geologic Background. Reports from this remote volcano in northernmost Halmahera are rare, but Dukono has been one of Indonesia's most active volcanoes. More-or-less continuous explosive eruptions, sometimes accompanied by lava flows, have occurred since 1933. During a major eruption in 1550 CE, a lava flow filled in the strait between Halmahera and the N-flank Gunung Mamuya cone. This complex volcano presents a broad, low profile with multiple summit peaks and overlapping craters. Malupang Wariang, 1 km SW of the summit crater complex, contains a 700 x 570 m crater that has also been active during historical time.
Information Contacts: Pusat Vulkanologi dan Mitigasi Bencana Geologi (PVMBG, also known as Indonesian Center for Volcanology and Geological Hazard Mitigation, CVGHM), Jalan Diponegoro 57, Bandung 40122, Indonesia (URL: http://www.vsi.esdm.go.id/); MAGMA Indonesia (Multiplatform Application for Geohazard Mitigation and Assessment in Indonesia), Kementerian Energi dan Sumber Daya Mineral (URL: https://magma.esdm.go.id/v1); Darwin Volcanic Ash Advisory Centre (VAAC), Bureau of Meteorology, Northern Territory Regional Office, PO Box 40050, Casuarina, NT 0811, Australia (URL: http://www.bom.gov.au/info/vaac/); NASA Global Sulfur Dioxide Monitoring Page, Atmospheric Chemistry and Dynamics Laboratory, NASA Goddard Space Flight Center (NASA/GSFC), 8800 Greenbelt Road, Goddard, Maryland, USA (URL: https://so2.gsfc.nasa.gov/); Sentinel Hub Playground (URL: https://www.sentinel-hub.com/explore/sentinel-playground).
Sabancaya
Peru
15.787°S, 71.857°W; summit elev. 5960 m
All times are local (unless otherwise noted)
Explosions, gas-and-ash plumes, and thermal activity persist during November 2022-April 2023
Sabancaya is located in Peru, NE of Ampato and SE of Hualca Hualca. Eruptions date back to 1750 and have been characterized by explosions, phreatic activity, ash plumes, and ashfall. The current eruption period began in November 2016 and has more recently consisted of daily explosions, gas-and-ash plumes, and thermal activity (BGVN 47:11). This report updates activity during November 2022 through April 2023 using information from Instituto Geophysico del Peru (IGP) that use weekly activity reports and various satellite data.
Intermittent low-to-moderate power thermal anomalies were reported by the MIROVA project during November 2022 through April 2023 (figure 119). There were few short gaps in thermal activity during mid-December 2022, late December-to-early January 2023, late January to mid-February, and late February. According to data recorded by the MODVOLC thermal algorithm, there were a total of eight thermal hotspots: three in November 2022, three in February 2023, one in March, and one in April. On clear weather days, some of this thermal anomaly was visible in infrared satellite imagery showing the active lava dome in the summit crater (figure 120). Almost daily moderate-to-strong sulfur dioxide plumes were recorded during the reporting period by the TROPOMI instrument on the Sentinel-5P satellite (figure 121). Many of these plumes exceeded 2 Dobson Units (DU) and drifted in multiple directions.
IGP reported that moderate activity during November and December 2022 continued; during November, an average number of explosions were reported each week: 30, 33, 36, and 35, and during December, it was 32, 40, 47, 52, and 67. Gas-and-ash plumes in November rose 3-3.5 km above the summit and drifted E, NE, SE, S, N, W, and SW. During December the gas-and-ash plumes rose 2-4 km above the summit and drifted in different directions. There were 1,259 volcanic earthquakes recorded during November and 1,693 during December. Seismicity also included volcano-tectonic-type events that indicate rock fracturing events. Slight inflation was observed in the N part of the volcano near Hualca Hualca (4 km N). Thermal activity was frequently reported in the crater at the active lava dome (figure 120).
Explosive activity continued during January and February 2023. The average number of explosions were reported each week during January (51, 50, 60, and 59) and February (43, 54, 51, and 50). Gas-and-ash plumes rose 1.6-2.9 km above the summit and drifted NW, SW, and W during January and rose 1.4-2.8 above the summit and drifted W, SW, E, SE, N, S, NW, and NE during February. IGP also detected 1,881 volcanic earthquakes during January and 1,661 during February. VT-type earthquakes were also reported. Minor inflation persisted near Hualca Hualca. Satellite imagery showed continuous thermal activity in the crater at the lava dome (figure 120).
During March, the average number of explosions each week was 46, 48, 31, 35, and 22 and during April, it was 29, 41, 31, and 27. Accompanying gas-and-ash plumes rose 1.7-2.6 km above the summit crater and drifted W, SW, NW, S, and SE during March. According to a Buenos Aires Volcano Ash Advisory Center (VAAC) notice, on 22 March at 1800 through 23 March an ash plume rose to 7 km altitude and drifted NW. By 0430 an ash plume rose to 7.6 km altitude and drifted W. On 24 and 26 March continuous ash emissions rose to 7.3 km altitude and drifted SW and on 28 March ash emissions rose to 7.6 km altitude. During April, gas-and-ash plumes rose 1.6-2.5 km above the summit and drifted W, SW, S, NW, NE, and E. Frequent volcanic earthquakes were recorded, with 1,828 in March and 1,077 in April, in addition to VT-type events. Thermal activity continued to be reported in the summit crater at the lava dome (figure 120).
Geologic Background. Sabancaya, located in the saddle NE of Ampato and SE of Hualca Hualca volcanoes, is the youngest of these volcanic centers and the only one to have erupted in historical time. The oldest of the three, Nevado Hualca Hualca, is of probable late-Pliocene to early Pleistocene age. The name Sabancaya (meaning "tongue of fire" in the Quechua language) first appeared in records in 1595 CE, suggesting activity prior to that date. Holocene activity has consisted of Plinian eruptions followed by emission of voluminous andesitic and dacitic lava flows, which form an extensive apron around the volcano on all sides but the south. Records of historical eruptions date back to 1750.
Information Contacts: Instituto Geofisico del Peru (IGP), Centro Vulcanológico Nacional (CENVUL), Calle Badajoz N° 169 Urb. Mayorazgo IV Etapa, Ate, Lima 15012, Perú (URL: https://www.igp.gob.pe/servicios/centro-vulcanologico-nacional/inicio); Buenos Aires Volcanic Ash Advisory Center (VAAC), Servicio Meteorológico Nacional-Fuerza Aérea Argentina, 25 de mayo 658, Buenos Aires, Argentina (URL: http://www.smn.gov.ar/vaac/buenosaires/inicio.php); MIROVA (Middle InfraRed Observation of Volcanic Activity), a collaborative project between the Universities of Turin and Florence (Italy) supported by the Centre for Volcanic Risk of the Italian Civil Protection Department (URL: http://www.mirovaweb.it/); Hawai'i Institute of Geophysics and Planetology (HIGP) - MODVOLC Thermal Alerts System, School of Ocean and Earth Science and Technology (SOEST), Univ. of Hawai'i, 2525 Correa Road, Honolulu, HI 96822, USA (URL: http://modis.higp.hawaii.edu/); NASA Global Sulfur Dioxide Monitoring Page, Atmospheric Chemistry and Dynamics Laboratory, NASA Goddard Space Flight Center (NASA/GSFC), 8800 Greenbelt Road, Goddard MD 20771, USA (URL: https://so2.gsfc.nasa.gov/); Copernicus Browser, Copernicus Data Space Ecosystem, European Space Agency (URL: https://dataspace.copernicus.eu/browser/).
Sheveluch
Russia
56.653°N, 161.36°E; summit elev. 3283 m
All times are local (unless otherwise noted)
Significant explosions destroyed part of the lava-dome complex during April 2023
Sheveluch (also spelled Shiveluch) in Kamchatka, has had at least 60 large eruptions during the last 10,000 years. The summit is truncated by a broad 9-km-wide caldera that is breached to the S, and many lava domes occur on the outer flanks. The lava dome complex was constructed within the large open caldera. Frequent collapses of the dome complex have produced debris avalanches; the resulting deposits cover much of the caldera floor. A major south-flank collapse during a 1964 Plinian explosion produced a scarp in which a “Young Sheveluch” dome began to form in 1980. Repeated episodes of dome formation and destruction since then have produced major and minor ash plumes, pyroclastic flows, block-and-ash flows, and “whaleback domes” of spine-like extrusions in 1993 and 2020 (BGVN 45:11). The current eruption period began in August 1999 and has more recently consisted of lava dome growth, explosions, ash plumes, and avalanches (BGVN 48:01). This report covers a significant explosive eruption during early-to-mid-April 2023 that generated a 20 km altitude ash plume, produced a strong sulfur dioxide plume, and destroyed part of the lava-dome complex; activity described during January through April 2023 use information primarily from the Kamchatka Volcanic Eruptions Response Team (KVERT) and various satellite data.
Satellite data. Activity during the majority of this reporting period was characterized by continued lava dome growth, strong fumarole activity, explosions, and hot avalanches. According to the MODVOLC Thermal Alerts System, 140 hotspots were detected through the reporting period, with 33 recorded in January 2023, 29 in February, 44 in March, and 34 in April. Frequent strong thermal activity was recorded during January 2023 through April, according to the MIROVA (Middle InfraRed Observation of Volcanic Activity) graph and resulted from the continuously growing lava dome (figure 94). A slightly stronger pulse in thermal activity was detected in early-to-mid-April, which represented the significant eruption that destroyed part of the lava-dome complex. Thermal anomalies were also visible in infrared satellite imagery at the summit crater (figure 95).
During January 2023 KVERT reported continued growth of the lava dome, accompanied by strong fumarolic activity, incandescence from the lava dome, explosions, ash plumes, and avalanches. Satellite data showed a daily thermal anomaly over the volcano. Video data showed ash plumes associated with collapses at the dome that generated avalanches that in turn produced ash plumes rising to 3.5 km altitude and drifting 40 km W on 4 January and rising to 7-7.5 km altitude and drifting 15 km SW on 5 January. A gas-and-steam plume containing some ash that was associated with avalanches rose to 5-6 km altitude and extended 52-92 km W on 7 January. Explosions that same day produced ash plumes that rose to 7-7.5 km altitude and drifted 10 km W. According to a Volcano Observatory Notice for Aviation (VONA) issued at 1344 on 19 January, explosions produced an ash cloud that was 15 x 25 km in size and rose to 9.6-10 km altitude, drifting 21-25 km W; as a result, the Aviation Color Code (ACC) was raised to Red (the highest level on a four-color scale). Another VONA issued at 1635 reported that no more ash plumes were observed, and the ACC was lowered to Orange (the second highest level on a four-color scale). On 22 January an ash plume from collapses and avalanches rose to 5 km altitude and drifted 25 km NE and SW; ash plumes associated with collapses extended 70 km NE on 27 and 31 January.
Lava dome growth, fumarolic activity, dome incandescence, and occasional explosions and avalanches continued during February and March. A daily thermal anomaly was visible in satellite data. Explosions on 1 February generated ash plumes that rose to 6.3-6.5 km altitude and extended 15 km NE. Video data showed an ash cloud from avalanches rising to 5.5 km altitude and drifting 5 km SE on 2 February. Satellite data showed gas-and-steam plumes containing some ash rose to 5-5.5 km altitude and drifted 68-110 km ENE and NE on 6 February, to 4.5-5 km altitude and drifted 35 km WNW on 22 February, and to 3.7-4 km altitude and drifted 47 km NE on 28 February. Scientists from the Kamchatka Volcanological Station (KVS) went on a field excursion on 25 February to document the growing lava dome, and although it was cloudy most of the day, nighttime incandescence was visible. Satellite data showed an ash plume extending up to 118 km E during 4-5 March. Video data from 1150 showed an ash cloud from avalanches rose to 3.7-5.5 km altitude and drifted 5-10 km ENE and E on 5 March. On 11 March an ash plume drifted 62 km E. On 27 March ash plumes rose to 3.5 km altitude and drifted 100 km E. Avalanches and constant incandescence at the lava dome was focused on the E and NE slopes on 28 March. A gas-and-steam plume containing some ash rose to 3.5 km altitude and moved 40 km E on 29 March. Ash plumes on 30 March rose to 3.5-3.7 km altitude and drifted 70 km NE.
Similar activity continued during April, with lava dome growth, strong fumarolic activity, incandescence in the dome, occasional explosions, and avalanches. A thermal anomaly persisted throughout the month. During 1-4 April weak ash plumes rose to 2.5-3 km altitude and extended 13-65 km SE and E.
Activity during 11 April 2023. The Institute of Volcanology and Seismology, Far Eastern Branch, Russian Academy of Sciences (IVS FEB RAS) reported a significant increase in seismicity around 0054 on 11 April, as reported by strong explosions detected on 11 April beginning at 0110 that sent ash plumes up to 7-10 km altitude and extended 100-435 km W, WNW, NNW, WSW, and SW. According to a Tokyo VAAC report the ash plume rose to 15.8 km altitude. By 0158 the plume extended over a 75 x 100 km area. According to an IVS FEB RAS report, the eruptive column was not vertical: the initial plume at 0120 on 11 April deviated to the NNE, at 0000 on 12 April, it drifted NW, and by 1900 it drifted SW. KVS reported that significant pulses of activity occurred at around 0200, 0320, and then a stronger phase around 0600. Levin Dmitry took a video from near Békés (3 km away) at around 0600 showing a rising plume; he also reported that a pyroclastic flow traveled across the road behind him as he left the area. According to IVS FEB RAS, the pyroclastic flow traveled several kilometers SSE, stopping a few hundred meters from a bridge on the road between Klyuchi and Petropavlovsk-Kamchatsky.
Ashfall was first observed in Klyuchi (45 km SW) at 0630, and a large, black ash plume blocked light by 0700. At 0729 KVERT issued a Volcano Observatory Notice for Aviation (VONA) raising the Aviation Color Code to Red (the highest level on a four-color scale). It also stated that a large ash plume had risen to 10 km altitude and drifted 100 km W. Near-constant lightning strikes were reported in the plume and sounds like thunderclaps were heard until about 1000. According to IVS FEB RAS the cloud was 200 km long and 76 km wide by 0830, and was spreading W at altitudes of 6-12 km. In the Klyuchi Village, the layer of both ash and snow reached 8.5 cm (figure 96); ashfall was also reported in Kozyrevsk (112 km SW) at 0930, Mayskoye, Anavgay, Atlasovo, Lazo, and Esso. Residents in Klyuchi reported continued darkness and ashfall at 1100. In some areas, ashfall was 6 cm deep and some residents reported dirty water coming from their plumbing. According to IVS FEB RAS, an ash cloud at 1150 rose to 5-20 km altitude and was 400 km long and 250 km wide, extending W. A VONA issued at 1155 reported that ash had risen to 10 km and drifted 340 km NNW and 240 km WSW. According to Simon Carn (Michigan Technological University), about 0.2 Tg of sulfur dioxide in the plume was measured in a satellite image from the TROPOMI instrument on the Sentinel-5P satellite acquired at 1343 that covered an area of about 189,000 km2 (figure 97). Satellite data at 1748 showed an ash plume that rose to 8 km altitude and drifted 430 km WSW and S, according to a VONA.
Activity during 12-15 April 2023. On 12 April at 0730 satellite images showed ash plumes rose to 7-8 km altitude and extended 600 km SW, 1,050 km ESE, and 1,300-3,000 km E. By 1710 that day, the explosions weakened. According to news sources, the ash-and-gas plumes drifted E toward the Aleutian Islands and reached the Gulf of Alaska by 13 April, causing flight disruptions. More than 100 flights involving Alaska airspace were cancelled due to the plume. Satellite data showed ash plumes rising to 4-5.5 km altitude and drifted 400-415 km SE and ESE on 13 April. KVS volcanologists observed the pyroclastic flow deposits and noted that steam rose from downed, smoldering trees. They also noted that the deposits were thin with very few large fragments, which differed from previous flows. The ash clouds traveled across the Pacific Ocean. Flight cancellations were also reported in NW Canada (British Columbia) during 13-14 April. During 14-15 April ash plumes rose to 6 km altitude and drifted 700 km NW.
Alaskan flight schedules were mostly back to normal by 15 April, with only minor delays and far less cancellations; a few cancellations continued to be reported in Canada. Clear weather on 15 April showed that most of the previous lava-dome complex was gone and a new crater roughly 1 km in diameter was observed (figure 98); gas-and-steam emissions were rising from this crater. Evidence suggested that there had been a directed blast to the SE, and pyroclastic flows traveled more than 20 km. An ash plume rose to 4.5-5.2 km altitude and drifted 93-870 km NW on 15 April.
Activity during 16-30 April 2023. Resuspended ash was lifted by the wind from the slopes and rose to 4 km altitude and drifted 224 km NW on 17 April. KVERT reported a plume of resuspended ash from the activity during 10-13 April on 19 April that rose to 3.5-4 km altitude and drifted 146-204 km WNW. During 21-22 April a plume stretched over the Scandinavian Peninsula. A gas-and-steam plume containing some ash rose to 3-3.5 km altitude and drifted 60 km SE on 30 April. A possible new lava dome was visible on the W slope of the volcano on 29-30 April (figure 99); satellite data showed two thermal anomalies, a bright one over the existing lava dome and a weaker one over the possible new one.
References. Girina, O., Loupian, E., Horvath, A., Melnikov, D., Manevich, A., Nuzhdaev, A., Bril, A., Ozerov, A., Kramareva, L., Sorokin, A., 2023, Analysis of the development of the paroxysmal eruption of Sheveluch volcano on April 10–13, 2023, based on data from various satellite systems, ??????????? ???????? ??? ?? ???????, 20(2).
Geologic Background. The high, isolated massif of Sheveluch volcano (also spelled Shiveluch) rises above the lowlands NNE of the Kliuchevskaya volcano group. The 1,300 km3 andesitic volcano is one of Kamchatka's largest and most active volcanic structures, with at least 60 large eruptions during the Holocene. The summit of roughly 65,000-year-old Stary Shiveluch is truncated by a broad 9-km-wide late-Pleistocene caldera breached to the south. Many lava domes occur on its outer flanks. The Molodoy Shiveluch lava dome complex was constructed during the Holocene within the large open caldera; Holocene lava dome extrusion also took place on the flanks of Stary Shiveluch. Widespread tephra layers from these eruptions have provided valuable time markers for dating volcanic events in Kamchatka. Frequent collapses of dome complexes, most recently in 1964, have produced debris avalanches whose deposits cover much of the floor of the breached caldera.
Information Contacts: Kamchatka Volcanic Eruptions Response Team (KVERT), Far Eastern Branch, Russian Academy of Sciences, 9 Piip Blvd., Petropavlovsk-Kamchatsky, 683006, Russia (URL: http://www.kscnet.ru/ivs/kvert/); Institute of Volcanology and Seismology, Far Eastern Branch, Russian Academy of Sciences (IVS FEB RAS), 9 Piip Blvd., Petropavlovsk-Kamchatsky 683006, Russia (URL: http://www.kscnet.ru/ivs/eng/); Kamchatka Volcanological Station, Kamchatka Branch of Geophysical Survey, (KB GS RAS), Klyuchi, Kamchatka Krai, Russia (URL: http://volkstat.ru/); Hawai'i Institute of Geophysics and Planetology (HIGP) - MODVOLC Thermal Alerts System, School of Ocean and Earth Science and Technology (SOEST), Univ. of Hawai'i, 2525 Correa Road, Honolulu, HI 96822, USA (URL: http://modis.higp.hawaii.edu/); MIROVA (Middle InfraRed Observation of Volcanic Activity), a collaborative project between the Universities of Turin and Florence (Italy) supported by the Centre for Volcanic Risk of the Italian Civil Protection Department (URL: http://www.mirovaweb.it/); Copernicus Browser, Copernicus Data Space Ecosystem, European Space Agency (URL: https://dataspace.copernicus.eu/browser/); Kam 24 News Agency, 683032, Kamchatka Territory, Petropavlovsk-Kamchatsky, Vysotnaya St., 2A (URL: https://kam24.ru/news/main/20230411/96657.html#.Cj5Jrky6.dpuf); Simon Carn, Geological and Mining Engineering and Sciences, Michigan Technological University, 1400 Townsend Drive, Houghton, MI 49931, USA (URL: http://www.volcarno.com/, Twitter: @simoncarn).
Bezymianny
Russia
55.972°N, 160.595°E; summit elev. 2882 m
All times are local (unless otherwise noted)
Explosions, ash plumes, lava flows, and avalanches during November 2022-April 2023
Bezymianny is located on the Kamchatka Peninsula of Russia as part of the Klyuchevskoy volcano group. Historic eruptions began in 1955 and have been characterized by dome growth, explosions, pyroclastic flows, ash plumes, and ashfall. During the 1955-56 eruption a large open crater was formed by collapse of the summit and an associated lateral blast. Subsequent episodic but ongoing lava-dome growth, accompanied by intermittent explosive activity and pyroclastic flows, has largely filled the 1956 crater. The current eruption period began in December 2016 and more recent activity has consisted of strong explosions, ash plumes, and thermal activity (BGVN 47:11). This report covers activity during November 2022 through April 2023, based on weekly and daily reports from the Kamchatka Volcano Eruptions Response Team (KVERT) and satellite data.
Activity during November and March 2023 was relatively low and mostly consisted of gas-and-steam emissions, occasional small collapses that generated avalanches along the lava dome slopes, and a persistent thermal anomaly over the volcano that was observed in satellite data on clear weather days. According to the Tokyo VAAC and KVERT, an explosion produced an ash plume that rose to 6 km altitude and drifted 25 km NE at 1825 on 29 March.
Gas-and-steam emissions, collapses generating avalanches, and thermal activity continued during April. According to two Volcano Observatory Notice for Aviation (VONA) issued on 2 and 6 April (local time) ash plumes rose to 3 km and 3.5-3.8 km altitude and drifted 35 km E and 140 km E, respectively. Satellite data from KVERT showed weak ash plumes extending up to 550 km E on 2 and 5-6 April.
A VONA issued at 0843 on 7 April described an ash plume that rose to 4.5-5 km altitude and drifted 250 km ESE. Later that day at 1326 satellite data showed an ash plume that rose to 5.5-6 km altitude and drifted 150 km ESE. A satellite image from 1600 showed an ash plume extending as far as 230 km ESE; KVERT noted that ash emissions were intensifying, likely due to avalanches from the growing lava dome. The Aviation Color Code (ACC) was raised to Red (the highest level on a four-color scale). At 1520 satellite data showed an ash plume rising to 5-5.5 km altitude and drifting 230 km ESE. That same day, Kamchatka Volcanological Station (KVS) volcanologists traveled to Ambon to collect ash; they reported that a notable eruption began at 1730, and within 20 minutes a large ash plume rose to 10 km altitude and drifted NW. KVERT reported that the strong explosive phase began at 1738. Video and satellite data taken at 1738 showed an ash plume that rose to 10-12 km altitude and drifted up to 2,800 km SE and E. Explosions were clearly audible 20 km away for 90 minutes, according to KVS. Significant amounts of ash fell at the Apakhonchich station, which turned the snow gray; ash continued to fall until the morning of 8 April. In a VONA issued at 0906 on 8 April, KVERT stated that the explosive eruption had ended; ash plumes had drifted 2,000 km E. The ACC was lowered to Orange (the third highest level on a four-color scale). The KVS team saw a lava flow on the active dome once the conditions were clear that same day (figure 53). On 20 April lava dome extrusion was reported; lava flows were noted on the flanks of the dome, and according to KVERT satellite data, a thermal anomaly was observed in the area. The ACC was lowered to Yellow (the second lowest on a four-color scale).
Satellite data showed an increase in thermal activity beginning in early April 2023. A total of 31 thermal hotspots were detected by the MODVOLC thermal algorithm on 4, 5, 7, and 12 April 2023. The elevated thermal activity resulted from an increase in explosive activity and the start of an active lava flow. The MIROVA (Middle InfraRed Observation of Volcanic Activity) volcano hotspot detection system based on the analysis of MODIS data also showed a pulse in thermal activity during the same time (figure 54). Infrared satellite imagery captured a continuous thermal anomaly at the summit crater, often accompanied by white gas-and-steam emissions (figure 55). On 4 April 2023 an active lava flow was observed descending the SE flank.
Geologic Background. The modern Bezymianny, much smaller than its massive neighbors Kamen and Kliuchevskoi on the Kamchatka Peninsula, was formed about 4,700 years ago over a late-Pleistocene lava-dome complex and an edifice built about 11,000-7,000 years ago. Three periods of intensified activity have occurred during the past 3,000 years. The latest period, which was preceded by a 1,000-year quiescence, began with the dramatic 1955-56 eruption. This eruption, similar to that of St. Helens in 1980, produced a large open crater that was formed by collapse of the summit and an associated lateral blast. Subsequent episodic but ongoing lava-dome growth, accompanied by intermittent explosive activity and pyroclastic flows, has largely filled the 1956 crater.
Information Contacts: Kamchatka Volcanic Eruptions Response Team (KVERT), Far Eastern Branch, Russian Academy of Sciences, 9 Piip Blvd., Petropavlovsk-Kamchatsky, 683006, Russia (URL: http://www.kscnet.ru/ivs/kvert/); Kamchatka Volcanological Station, Kamchatka Branch of Geophysical Survey, (KB GS RAS), Klyuchi, Kamchatka Krai, Russia (URL: http://volkstat.ru/); Hawai'i Institute of Geophysics and Planetology (HIGP) - MODVOLC Thermal Alerts System, School of Ocean and Earth Science and Technology (SOEST), Univ. of Hawai'i, 2525 Correa Road, Honolulu, HI 96822, USA (URL: http://modis.higp.hawaii.edu/); MIROVA (Middle InfraRed Observation of Volcanic Activity), a collaborative project between the Universities of Turin and Florence (Italy) supported by the Centre for Volcanic Risk of the Italian Civil Protection Department (URL: http://www.mirovaweb.it/); Copernicus Browser, Copernicus Data Space Ecosystem, European Space Agency (URL: https://dataspace.copernicus.eu/browser/).
Chikurachki
Russia
50.324°N, 155.461°E; summit elev. 1781 m
All times are local (unless otherwise noted)
New explosive eruption during late January-early February 2023
Chikurachki, located on Paramushir Island in the northern Kuriles, has had Plinian eruptions during the Holocene. Lava flows have reached the sea and formed capes on the NW coast; several young lava flows are also present on the E flank beneath a scoria deposit. Reported eruptions date back to 1690, with the most recent eruption period occurring during January through October 2022, characterized by occasional explosions, ash plumes, and thermal activity (BGVN 47:11). This report covers a new eruptive period during January through February 2023 that consisted of ash explosions and ash plumes, based on information from the Kamchatka Volcanic Eruptions Response Team (KVERT) and satellite data.
According to reports from KVERT, an explosive eruption began around 0630 on 29 January. Explosions generated ash plumes that rose to 3-3.5 km altitude and drifted 6-75 km SE and E, based on satellite data. As a result, the Aviation Color Code (ACC) was raised to Orange (the second highest level on a four-color scale). At 1406 and 1720 ash plumes were identified in satellite images that rose to 4.3 km altitude and extended 70 km E. By 2320 the ash plume had dissipated. A thermal anomaly was visible at the volcano on 31 January, according to a satellite image, and an ash plume was observed drifting 66 km NE.
Occasional explosions and ash plumes continued during early February. At 0850 on 1 February an ash plume rose to 3.5 km altitude and drifted 35 km NE. Satellite data showed an ash plume that rose to 3.2-3.5 km altitude and drifted 50 km NE at 1222 later that day (figure 22). A thermal anomaly was detected over the volcano during 5-6 February and ash plumes drifted as far as 125 km SE, E, and NE. Explosive events were reported at 0330 on 6 February that produced ash plumes rising to 4-4.5 km altitude and drifting 72-90 km N, NE, and ENE. KVERT noted that the last gas-and steam plume that contained some ash was observed on 8 February and drifted 55 km NE before the explosive eruption ended. The ACC was lowered to Yellow and then Green (the lowest level on a four-color scale) on 18 February.
Geologic Background. Chikurachki, the highest volcano on Paramushir Island in the northern Kuriles, is a relatively small cone constructed on a high Pleistocene edifice. Oxidized basaltic-to-andesitic scoria deposits covering the upper part of the young cone give it a distinctive red color. Frequent basaltic Plinian eruptions have occurred during the Holocene. Lava flows have reached the sea and formed capes on the NW coast; several young lava flows are also present on the E flank beneath a scoria deposit. The Tatarinov group of six volcanic centers is located immediately to the south, and the Lomonosov cinder cone group, the source of an early Holocene lava flow that reached the saddle between it and Fuss Peak to the west, lies at the southern end of the N-S-trending Chikurachki-Tatarinov complex. In contrast to the frequently active Chikurachki, the Tatarinov centers are extensively modified by erosion and have a more complex structure. Tephrochronology gives evidence of an eruption around 1690 CE from Tatarinov, although its southern cone contains a sulfur-encrusted crater with fumaroles that were active along the margin of a crater lake until 1959.
Information Contacts: Kamchatka Volcanic Eruptions Response Team (KVERT), Far East Division, Russian Academy of Sciences, 9 Piip Blvd., Petropavlovsk-Kamchatsky, 683006, Russia (URL: http://www.kscnet.ru/ivs/); Copernicus Browser, Copernicus Data Space Ecosystem, European Space Agency (URL: https://dataspace.copernicus.eu/browser/).
Search Bulletin Archive by Publication Date
Select a month and year from the drop-downs and click "Show Issue" to have that issue displayed in this tab.
The default month and year is the latest issue available.
Bulletin of the Global Volcanism Network - Volume 37, Number 10 (October 2012)
Managing Editor: Richard Wunderman
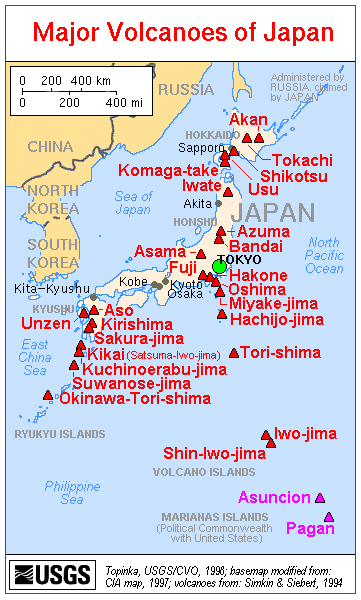
Asamayama (Japan)
No changes in high-temperature areas around summit crater; seismicity remained low
Axial Seamount (Undersea Features)
New reports on April 2011 eruption
Copahue (Chile-Argentina)
Crater lake geochemical study suggests recent magma intrusion
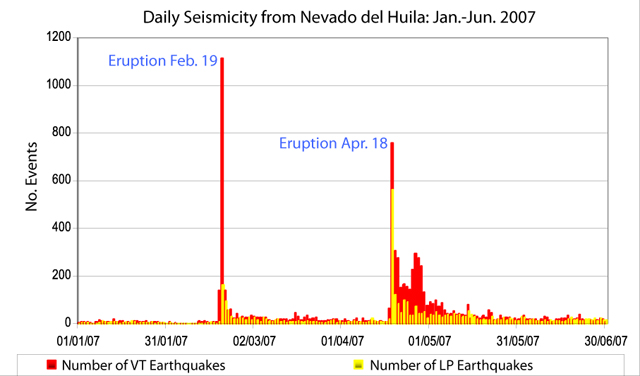
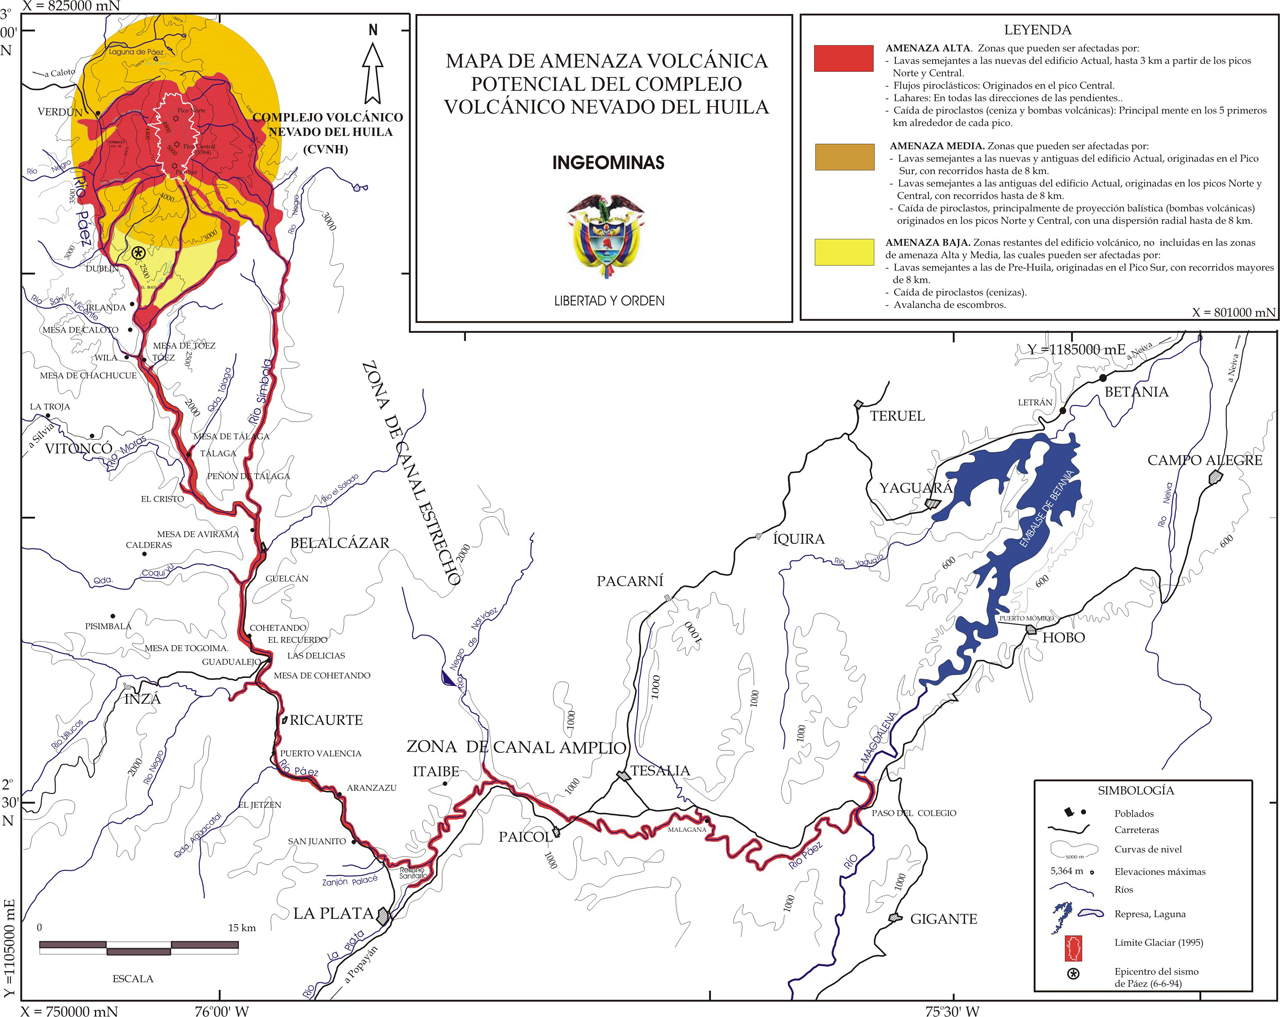
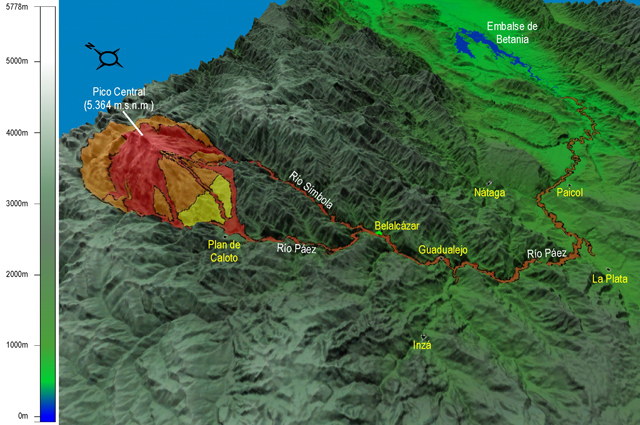
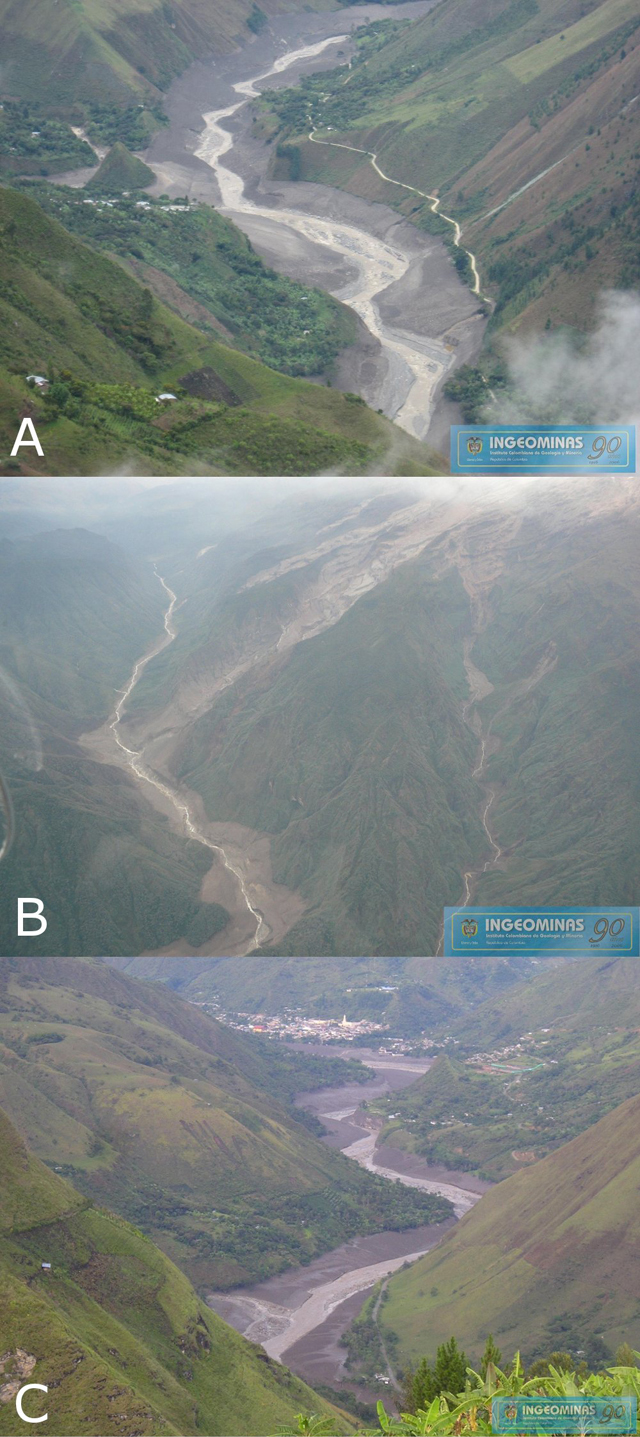
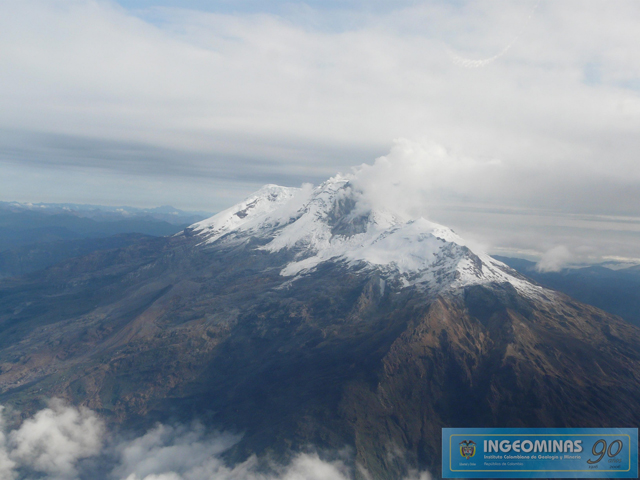
Huila, Nevado del (Colombia)
10 lives lost, houses and infrastructure destroyed during November 2008 eruption
Tengger Caldera (Indonesia)
Modest April 2011 eruption at Bromo followed by increasing tremor
Tokachidake (Japan)
Small hot gas emissions and minor seismicity in mid-2012
Asamayama (Japan) — October 2012 Cite this Report
Asamayama
Japan
36.406°N, 138.523°E; summit elev. 2568 m
All times are local (unless otherwise noted)
No changes in high-temperature areas around summit crater; seismicity remained low
Asama's quiescence during May-December 2009 noted in our previous report (BGVN 35:10) continued into 2010. Only two minor incidents were noteable during the end of the year. During 11-12 November seismic activity was at a low level, though it was slightly above background. White plumes were seen rising to a height of ~100-400 m above the crater. No remarkable changes were noted by either GPS or tiltmeter observations. Alert Level 1 continued during this period.
An observation flight was conducted in cooperation with the Japan Ground Self-Defense Force (JGSDF) on 2 November. High-temperature areas were confirmed in and around the center of the summit crater. No changes in the distribution of thermal anomalies was detected since the last observation on 13 April. The SO2 flux averaged ~200-300 tonnes/day (t/d) during November.
In December, seismic activity continued at a low level except for a slight increase during 28-31 December. A white plume was observed rising ~100-300 m above the crater. The SO2 flux measured an average of 100-300 t/d. No remarkable changes were noted by either GPS or tiltmeter observations.
There was no exceptional activity during either 2011 or 2012 to date.
Geologic Background. Asamayama, Honshu's most active volcano, overlooks the resort town of Karuizawa, 140 km NW of Tokyo. The volcano is located at the junction of the Izu-Marianas and NE Japan volcanic arcs. The modern Maekake cone forms the summit and is situated east of the remnant of an older andesitic volcano, Kurofuyama, which was destroyed by a late-Pleistocene landslide about 20,000 years before present (BP). Growth of a dacitic shield volcano was accompanied by pumiceous pyroclastic flows, the largest of which occurred about 14,000-11,000 BP, and by growth of the Ko-Asamayama lava dome on the east flank. Maekake, capped by the Kamayama pyroclastic cone that forms the present summit, is probably only a few thousand years old and has observed activity dating back at least to the 11th century CE. Maekake has had several major Plinian eruptions, the last two of which occurred in 1108 (Asamayama's largest Holocene eruption) and 1783 CE.
Information Contacts: Japan Meteorological Agency (JMA), Otemachi, 1-3-4, Chiyoda-ke Tokyo 100-8122, Japan (URL: http://www.jma.go.jp/).
Axial Seamount (Undersea Features) — October 2012 Cite this Report
Axial Seamount
Undersea Features
45.95°N, 130°W; summit elev. -1410 m
All times are local (unless otherwise noted)
New reports on April 2011 eruption
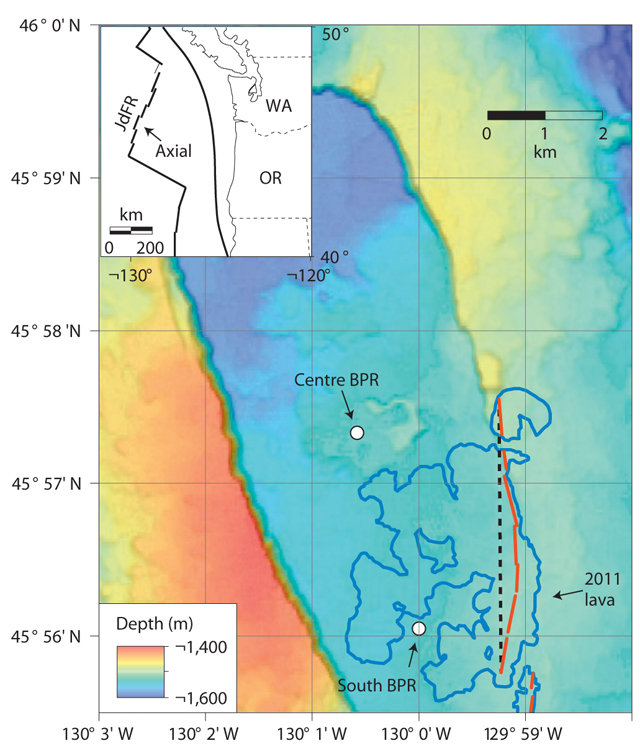
William Chadwick recently notified Bulletin editors of three new papers concerning the April 2011 eruption of Axial Seamount: Caress and others, 2012; Chadwick and others, 2012; and Dziak and others, 2012. This eruption, recorded by in situ monitoring instruments (ocean bottom pressure recorders and hydrophones), took place during 6-12 April 2011 (BGVN 36:07) and resulted in an erupted volume of lava calculated by bathymetric remapping of 99 x 106 m3 (Chadwick and others, 2012). The activity took place at the S end of the caldera and the S rift zone (figure 9).
The first recorded eruption of Axial Seamount occurred during 25-31 January 1998 (BGVN 23:01, 23:02) with a lava volume estimated by Chadwick to be 29 x 106 m3. Chadwick noted that he was currently preparing a paper detailing the 1998 eruption that may result in a revision of the lava volume from that event.
References. Caress, D.W., Clague, D.A., Paduan, J.B., Martin, J.F., Dreyer, B.M., Chadwick Jr., W.W., Denny, A., and Kelley, D.S., 2012, Repeat bathymetric surveys at 1-metre resolution of lava flows erupted at Axial Seamount in April 2011, Nature Geoscience, v. 5, p.483-488 (DOI: 10.1038/NGEO1496).
Chadwick Jr., W.W., Nooner, S.L., Butterfield, D.A., and Lilley, M.D., 2012, Seafloor deformation and forecasts of the April 2011 eruption at Axial Seamount, Nature Geoscience, v. 5, p.474-477 (DOI: 10.1038/NGEO1464).
Dziak, R.P., Haxel1, J.H., Bohnenstiehl, D.R., Chadwick Jr., W.W., Nooner, S.L., Fowler, M.J., Matsumoto, H., and Butterfield, D.A., 2012, Seismic precursors and magma ascent before the April 2011 eruption at Axial Seamount, Nature Geoscience, v. 5, p.478-482 (DOI: 10.1038/NGEO1490).
Geologic Background. Axial Seamount rises 700 m above the mean level of the central Juan de Fuca Ridge crest about 480 km W of Cannon Beach, Oregon, to within about 1,400 m of the ocean surface. It is the most magmatically and seismically active site on the Juan de Fuca Ridge between the Blanco Fracture Zone and the Cobb offset. The summit is marked by an unusual rectangular-shaped caldera (3 x 8 km) that lies between two rift zones and is estimated to have formed about 31,000 years ago. The caldera is breached to the SE and is defined on three sides by boundary faults of up to 150 m relief. Hydrothermal vents with biological communities are located near the caldera fault and along the rift zones. Hydrothermal venting was discovered north of the caldera in 1983. Detailed mapping and sampling efforts have identified more than 50 lava flows emplaced since about 410 CE (Clague et al., 2013). Eruptions producing fissure-fed lava flows that buried previously installed seafloor instrumentation were detected seismically and geodetically in 1998 and 2011, and confirmed shortly after each eruption during submersible dives.
Information Contacts: William W. Chadwick, NOAA and Oregon State University.
Copahue (Chile-Argentina) — October 2012 Cite this Report
Copahue
Chile-Argentina
37.856°S, 71.183°W; summit elev. 2953 m
All times are local (unless otherwise noted)
Crater lake geochemical study suggests recent magma intrusion
The following summary describes Copahue's crater lake activity during 1992-2000 as presented by Varekamp and others (2001). Copahue erupted sporadically in the 1990's with a series of explosions, and later in July 2000. The 1992 and 1995 eruptions were phreatic and ejected fragmented, hydrothermally altered rocks, and copious amounts of liquid sulfur. In contrast, the July 2000 eruption (BGVN 25:06, 25:09) was phreato-magmatic and was characterized by explosions that ejected incandescent juvenile material and chilled sulfur fragments; dark ash covered an area up to 50 km from the source.
Data gathered during 1997-2000 by Varekamp and others (2001) suggested that Copahue acts as a "beehive" volcano, meaning that void spaces were generated by near-congruent rock dissolution, and these spaces were subsequently filled by accumulating liquid sulfur and precipitated silica. During the phreatic eruptions of 1992 and 1995, much of that liquid sulfur was ejected; in contrast the phreato-magmatic eruptions of 2000 left the hydrothermal system largely intact. The RFE/Cl ratio (RFE = rock-forming elements = Ca + Na + Mg + K + Al + Fe) measured in the crater lake water increased dramatically in July 2000. This spike was interpreted by Varekamp and others (2001) to be a result of a recent intrusion of fresh magma and therefore more interaction between water and newly solidified rock.
Varekamp and others (2001) concluded that "Integration of [data from the Upper Rio Agrio river] and the modeled volcanic fluxes into the crater lake provide the following parameters for the whole Copahue system in November 1999: an energy flux of ~32 MW, an equivalent sulfur gas input of ~344 t SO2/d, a net rock removal rate of about 12,000 m3/yr, and an elemental sulfur accumulation rate of about 11,600 m3/yr." The eruption of large amounts of liquid sulfur in 1992 and 1995 strongly supported inferences about gradual elemental sulfur accumulation inside the volcano. Analyses also suggested that the eruptions of Copahue during 2000 were preceded by a dramatic increase of volcanically-derived elements into the crater lake. The authors further concluded that "The evolution of the crater lake fluids during the twentieth century suggest a gradual awakening of Copahue volcano". Continued monitoring of crater lake temperature and composition would be useful to assess future volcanic activity.
Other studies. Varekamp and others (2004) concluded that Copahue represented "a rare example of the occurrence of hydrothermal fluids on the surface of the earth from a deep source with a strong magmatic signal." Varekamp (2004) noted that Copahue "has a volcanic spring-fed acid river with deposits of red hematite in the streambed and abundant gypsum mineralization, and these fluids are saturated with K-jarosite. This riverbed may be a modern terrestrial analog of the Opportunity Rover landing site on the planet Mars." Another paper (Varekamp and others, 2006) described the geochemistry and isotopic characteristics of the Caviahue-Copahue volcanic complex; they discuss the roles of crust and sediments from the subducting slab as contributions to the magma systems.
According to the Chilean National Service of Geology and Mining (SERNAGEOMIN), Copahue had been quiet since its last major eruption in 2000 until recently. A new eruption took place in mid-2012; subsequent reports will discuss this event.
References. Varekamp, J.C., 2004, Copahue Volcano: A Modern Terrestrial Analog for the Opportunity Landing Site?, Eos, v. 85, no. 41, p. 401 and 407.
Varekamp, J.C., Ouimette, A.P., Hermán, S.W., Bermúdez, A., and Delpino, D., 2001, Hydrothermal element fluxes from Copahue, Argentina: A "beehive" volcano in turmoil, Geology, v. 29, no. 11, p. 1059-1062.
Varekamp, J.C., Ouimette, A.P., and Kreulen, R., 2004, The magmato-hydrothermal system of Copahue volcano, Argentina, in Wanty, R.B., and Seal, R.R., (eds), Water Rock Interaction: Proceedings of the Eleventh International Symposium on Water Rock Interaction, WRI-11, 27 June-2 July 2004, Saratoga Springs, NY, v. 1, p. 215-218, Taylor and Francis Group, London.
Varekamp, J.C., deMoor, J.M., Merrill, M.D., Colvin, A.S., Goss, A.R., Vroon, P.Z., and Hilton, D.R., 2006, Geochemistry and isotopic characteristics ofthe Caviahue-Copahue volcanic complex, Province of Neuquen, Argentina, Geological Society of America Special Papers 2006, v. 407, pp. 317-342.
Geologic Background. Volcán Copahue is an elongated composite cone constructed along the Chile-Argentina border within the 6.5 x 8.5 km wide Trapa-Trapa caldera that formed between 0.6 and 0.4 million years ago near the NW margin of the 20 x 15 km Pliocene Caviahue (Del Agrio) caldera. The eastern summit crater, part of a 2-km-long, ENE-WSW line of nine craters, contains a briny, acidic 300-m-wide crater lake (also referred to as El Agrio or Del Agrio) and displays intense fumarolic activity. Acidic hot springs occur below the eastern outlet of the crater lake, contributing to the acidity of the Río Agrio, and another geothermal zone is located within Caviahue caldera about 7 km NE of the summit. Infrequent mild-to-moderate explosive eruptions have been recorded since the 18th century. Twentieth-century eruptions from the crater lake have ejected pyroclastic rocks and chilled liquid sulfur fragments.
Information Contacts: J.C. Varekamp, Department of Earth & Environmental Sciences, 265 Church St., Wesleyan University, Middletown CT 06459-0139 USA; Servicio Nacional de Geología e Minería (SERNAGEOMIN), Av. Santa María 0104, Casilla 10465, Santiago, Chile (URL: http://www.sernageomin.cl/).
Nevado del Huila (Colombia) — October 2012 Cite this Report
Nevado del Huila
Colombia
2.93°N, 76.03°W; summit elev. 5364 m
All times are local (unless otherwise noted)
10 lives lost, houses and infrastructure destroyed during November 2008 eruption
Eruptions at Nevado del Huila during February and April 2007 included substantial ash plumes, lahars, earthquake swarms (with individual earthquakes up to M ~3), and the growth of fissures, crevasses, and new fumaroles on the upper, glacier-covered flanks (BGVN 33:01). After the explosive eruption on 18 April 2007, the Instituto Colombiano de Geología y Minería (INGEOMINAS) reported decreasing seismicity and activity through December 2007 (figure 13). After that, sporadic peaks in seismicity occurred in 2008 and, after a significant increase in long period (LP) earthquakes in November 2008, a large eruption and devastating lahars occurred on 20 November 2008. In this report, we discuss hazard mitigation efforts, escalating SO2 emissions, and unrest that culminated in that fatal November 2008 eruption.
INGEOMINAS activity bulletins and documentation of humanitarian efforts in this report were initially synthesized and edited by Jamie Kern, as part of a graduate student writing assignment in a volcanology class at Oregon State University under the guidance of professor Shan de Silva.
Two volcanic hazard maps. The INGEOMINAS map of potential volcanic hazards for Nevado del Huila focuses on both the immediate area around the volcanic complex and the extensive drainages in the region (figures 14 and 15), which are differing ways to depict the same hazard information.
In figures 14 and 15, the red zone (highest risk) includes the young volcanic edifice and the major drainages; this region may experience lava flows up to 3 km from the edifice, particularly from the N and central peaks (see figure 6 in BGVN 33:01 for an annotated photo of peaks and names); pyroclastic flows are possible from the central peak (Pico Central); lahars could occur along the flanks and connected drainages; ash and volcanic bombs may fall to distances of 5 km from the volcanic peaks. Volcanic seismicity and gases are also a hazard in the most proximal regions. Note the high risk area extends more than 100 km along the length of the major drainage system (reaching the junction with Río Magdalena).
The orange zone (moderate risk) extends beyond the immediate volcanic edifice and encompasses an approximately circular region within a radius of 8 km. Within this zone, lava flows could cover the young and old edifice originating from Pico Sur (S peak) reaching distances up to 5 km; lava flows from the N and central peaks may cover the old edifice; pyroclastics, particularly lava bombs, could reach this region and fall up to 8 km from the N and central peaks. Seismicity and hazardous volcanic gases could also occur in the orange zone, but these events have a lower probability here compared to similar events in the red zone.
The yellow zone (lowest risk) is confined to the S flank within the Río Páez drainage system. This area was distinguished from the other regions due to the potential for debris avalanches, pyroclastic fall (mainly ash), and lava flows that could cover the pre-Huila edifice originating from Pico Sur and extending ~8 km down slope. Pyroclastic flows are also possible in the case of dome or lava flow front collapse.
Post-eruptive activity, May-December 2007. After the main eruption on 18 April 2007 and small ash emissions on 14 and 27 May 2007, INGEOMINAS reported that Nevado del Huila entered a period of relative quiescence (BGVN 33:01).
In late April, SO2 emissions remained high. OMI and mobile DOAS instruments detected SO2 emissions of greater than 13,000 tons per day between 24 and 28 April (table 1). Mobile DOAS data was also available during 1-2 June. Values in the range of 3,000-6,900 tons per day (t/d) were obtained from overflights and land-based traverses beneath the plume (BGVN 33:01).
Table 1. Between 2 March 2007 and 1 May 2007, INGEOMINAS reported seven analyses of SO2 flux from the OMI/Aura satellite. Courtesy of INGEOMINAS, Simon Carn (Michigan Technological University), and the Joint Center for Earth Systems Technology (University of Maryland Baltimore County).
| Date |
SO2 concentration-pathlength (for total metric tons atmospheric column) |
Areal extent of SO2 (km2) |
Maximum Altitude (km above summit) |
| 20 Feb 2007 |
2,500 |
154,265 |
3.67 |
| 21 Feb 2007 |
~1,000 |
270,273 |
5.11 |
| 02 Mar 2007 |
1,000-1,500 |
-- |
~1.4 |
| 24 Apr 2007 |
1,555 |
51,767 |
3.71 |
| 26 Apr 2007 |
1,365 |
30,853 |
5.85 |
| 28 Apr 2007 |
1,444 |
51,262 |
3.61 |
| 01 May 2007 |
594 |
24,446 |
2.21 |
After seismic activity peaked during 19-30 April with more than 2,800 volcano-tectonic (VT) events detected, 1,331 VT events were detected in May. Four tremor events during that month were linked to small ash eruptions, the strongest occurred at 1010 UTC on 14 May and 0524 UTC on 21 May.
Seismicity decreased from over 300 events per week in June 2007 to fewer than 100 events per week in December 2007. Shallow and deep earthquakes were recorded during this time period, mostly M 2 or less. Earthquakes were generally clustered in three groups; the shallowest events were those that occurred within less than 3 km below the surface, those that occurred at depths of 4-8 km below the surface, and the deepest events, which occurred at depths between 15-25 km. Small ash explosions may have occurred during tremor events in July and one event in August. The appearance of tremor in local seismic records is often part of the criteria that INGEOMINAS considers when interpreting ash emissions from Nevado del Huila.
During a 19 August observation flight conducted by INGEOMINAS, scientists observed no changes in the dimensions of the fractures or the fumarolic activity since the April eruptions (figure 16). Observers saw a white column of gas that rose up to 100 m above the crater.
Activity during January-May 2008. In January 2008, INGEOMINAS reported five episodes of tremor attributed to small ash events. People aboard commercial flights passing over the volcano in early January reported new ash deposits on the W flank of Pico Central. Seismometers detected pulses of tremor (~19), VT earthquakes (~193), and long-period (LP) seismicity (~284).
In February, INGEOMINAS reported that seismicity had decreased slightly. Volcanic tremor was rare (~4 events) and ~131 VT and ~193 LP events were detected. On 8 and 12 February, traverses with a mobile DOAS measured SO2 fluxes of 1,371 and 612 t/d, respectively. On both days, the gas column was dispersing NW. INGEOMINAS scientists conducted these surveys along the Pan-American Highway between Calí and Popayán.
Seismicity increased in March. Four swarms of earthquakes were detected and INGEOMINAS reported 23 tremor events, 704 VT events, and 478 LP earthquakes. SO2 emissions were assessed on 25 March during a mobile DOAS survey yielding 655 t/d.
Based on elevated seismicity, INGEOMINAS announced on 29 March 2008 an increase in Alert Level from Yellow (III, "Changes in the behavior of volcanic activity") to Orange (II, "Probability of eruption in terms of days or weeks").
El Tiempo reported on 4 April 2008 that Colombian Red Cross volunteers in the town of Belalcázar (~28 km SSE) on the Páez River were on 24-hour alert. The Local Committee of Disaster Prevention ordered the municipal school closed and placed the hospital on maximum alert. Jorge Quintero, director of the Red Cross in Belalcázar, reported that the town was aware of the dangers of mudflows and evacuation routes were in place, but that there were few shelters in the town and little aid to help them prepare for an eruption.
During an observation flight on 5 April, no significant geomorphic changes were observed at Pico Central or Pico Norte; sulfur odors were reported near areas of the E flank. Authorities of the Department of Cauca gave evacuation orders for families living in the Páez river basin on Monday 7 April. Inhabitants in high-risk areas were told to move to shelters in larger cities such as Inzá (25 km SSW) and Belalcázar. Elevated seismicity continued; ~12 pulses of tremor, 140 VT, and 84 LP earthquakes were recorded during 2-8 April.
Based on weekly bulletins from INGEOMINAS, there had been no reports of ash emissions since 25 March. On 8 April, the Alert Level was decreased to Yellow (III). On 13 April, a seismic swarm lasting over 2 hours and an associated M 3.4 earthquake near Pico Central resulted in an increase of the Alert Level to Orange (II).
On 14 April, a swarm of earthquakes was detected and LP seismicity suggested ash emissions had occurred. At 2308, the Alert Level was raised to Red (I), indicating "imminent eruption or in course," although the darkness made it difficult to discern what activity was occurring. El Tiempo reported that 4,500 people evacuated in less than 20 minutes from high-risk areas. The following day, the Alert Level was lowered to Orange (II).
On 15 April, INGEOMINAS reported that a seismic swarm occurred; between 2300 on 14 April and 0300 on 15 April, ~300 earthquakes were detected. Three VT earthquakes were detected during 13-15 April with magnitudes between 3.0 and 3.7. A gas survey with a mobile DOAS system was conducted on 15 April; the gas plume was dispersing W from the summit with an average flux of 700 t/d. SO2 surveys were repeated between 16 and 19 April and INGEOMINAS reported fluxes with a maximum of 1,541 t/d and a minimum of 514 t/d (the gas column dispersed W and the traverse followed the Pan-American Highway).
An observation flight on 29 April revealed no significant changes due to volcanic activity, but some glacial material had shaken loose and formed small flows high on the volcano that did not reach any major rivers. April seismicity included 966 VT, 642 LP, and 65 tremor events (figure 17).
By early May, seismicity had decreased and the Alert Level was lowered to Yellow (III) on 6 May. On 9 May at 2316, 25 minutes of tremor occurred in an episode likely associated with ash emissions. This episode was preceded by 16 pulses of low-magnitude tremor. Sparse M 2-3 earthquakes were registered from Pico Central throughout the month and a swarm of 20 such events occurred on 27 May. The largest earthquake during this time, M 3.9, occurred at 2020. This event was felt by residents in the area of Plan de Caloto (2-7 km SW of Nevado del Huila) and had a relatively shallow depth, ~3 km below the summit of Pico Central. During 27-29 May LP earthquakes dominated the records.
Activity during June-August 2008. From June to August 2008, INGEOMINAS conducted gas surveys with a mobile DOAS system and recorded elevated SO2 emissions (figure 18). During this time period, the minimum flux was measured on 3 June (600 t/d) and the maximum flux was on 20 June (6,700 t/d). Sulfur dioxide odors were reported by scientists during an overflight of Nevado del Huila on 12 June 2008.
Seismicity during June-August 2008 included small episodes of VT and LP events, however, VT earthquakes dominated the record beginning in July (figure 19). An M 3.9 earthquake was felt by local residents on 11 June; this event occurred at 1503 local time and had a focal depth of 3 km below the summit of Pico Central. On 2 July at 1756, an M 2.7 VT earthquake occurred that was also detected by local populations in Plan de Caloto. This event was located 6.7 km S of Pico Central and had a focal depth of 2 km.
From June to August 2008, an average of 60 hybrid and 6 surficial events (rockfalls, avalanches, glacial noise, etc.) were detected per month. For the month of August 2008, seismometers detected 1,456 VT, 502 LP, 62 hybrid, 15 tremor, and 13 surficial events. Compared to April 2008, the distribution of earthquake hypocenters had become more dispersed over time. Thus, in August, earthquake focal depths were in the range of 0-13 km and were concentrated within linear groups (figure 20).
Activity during September-October 2008. On 2 September 2008, an M 4.6 earthquake shook Pico Central, after which seismic activity steadily increased during the month. This earthquake was located 2.2 km NE of Pico Central and 1.7 km deep. Relatively large earthquakes were detected during 4-8 and 13-14 September. Four of the six largest earthquakes during 4-8 September caused local residents to report shaking. The largest event was an M 4, located 1 km N of Pico Central and at a depth of 3.5 km.
An M 4 earthquake that occurred at 1329 on 14 September was also noticed by residents; this event was 6.2 km SW of Pico Central with a focal depth of 7.3 km. VT seismicity continued to dominate the records in September and that month, the number of LP, tremor, and hybrid earthquakes increased compared to August (table 2).
Table 2. Seismicity detected at Nevado del Huila during August-December 2008. Courtesy of INGEOMINAS.
| Month |
Volcano-tectonic |
Long-period |
Tremor |
Hybrid |
Surficial (eg. rockfalls) |
| Aug 2008 |
1,456 |
502 |
15 |
62 |
13 |
| Sep 2008 |
1,722 |
770 |
34 |
564 |
8 |
| Oct 2008 |
1,437 |
2,260 |
537 |
105 |
10 |
| Nov 2008 |
890 |
18,704 |
903 |
0 |
2 |
| Dec 2008 |
259 |
221 |
19 |
7 |
0 |
INGEOMINAS conducted four gas surveys in September and measured elevated SO2 emissions during traverses along the Pan-American Highway between Popayán and Calí, and also along the road between Corinto and Santander de Quilichao. The highest values were obtained on 4 September, when the SO2 flux was measured to be 9,215 t/d (figure 18).
During an observation flight in cooperation with the Colombian Air Force (FAC) on 12 September, observers noted intense fumarolic activity and small mudflows on the volcano's upper flanks. Seismicity was relatively high on 12 September and, at 0817, INGEOMINAS reported a tremor signal with a duration of approximately four hours. Ash-and-gas emissions may have been associated with that event.
INGEOMINAS detected over 550 seismic events clustered in 4 seismic swarms over 48 hours during 2-3 October 2008. On 2 October, the SO2 flux was 10,590 t/d, the highest yet recorded in 2008 (figure 21). INGEOMINAS interpreted this increased activity to represent a magmatic intrusion that was actively degassing. Fluctuating activity continued throughout October. NOAA satellite images revealed a constant flow of SO2 gas in a white cloud from the northern sector of the volcano. By 28 October, SO2 emissions had increased to 13,482 t/d, and passengers on commercial flights over the volcano noticed a strong sulfur odor.
INGEOMINAS recorded significant increases in LP and tremor seismicity in October 2008 (table 2). LP earthquakes more than doubled and tremor had increased from 34 to 537 events since the previous month. VT events had occurred slightly less frequently (1,437 events in October compared to 1,722 events in September), and there were fewer hybrid events recorded.
Elevated activity in early November 2008. In early November, residents of Wila, Tóez, and Plan de Caloto along the Páez River (approximately 2-7 km to the SW) reported ashfall and strong sulfur odors following an intense period of seismicity on 3 November. Inhabitants on the S side of the volcano observed that gas emissions changed color from white to gray for short intervals.
Continuous seismic tremor was detected on 7 November and prompted an increase in the Alert Level from Yellow to Orange. INGEOMINAS reported that the volcano had entered a phase of unrest that could lead to hazardous conditions.
With the assistance of the Colombian Air Force, scientists aboard flights on 8 and 9 November observed cracks forming on the S side of Pico Central and traces of mudflows and ash originating from Pico Central that were thought to have contributed to the murky water in the Páez River during preceding days. Twenty families evacuated from the Símbola River on the E flank after increased seismic and fumarolic activity. A team of civil servants from Popayán was deployed to Belalcázar and Inzá to coordinate evacuations in the event of an eruption. The mayor of the Páez municipality closed schools in areas surrounding the Páez River and announced evacuation routes.
During the second week of November 2008, INGEOMINAS reported that, on average, 1,210 earthquakes were occurring per day. Earthquakes related to dynamic fluids (LP events) continued to dominate seismic records and INGEOMINAS described these events as possible evidence of a magma system migrating to the surface. They continued to receive reports of sulfur odors and ashfall in local regions W and SW of the edifice.
During 7-17 November, the Washington Volcanic Ash Advisory Center (VAAC) reported possible ash plumes from Nevado del Huila, however, satellite observations were limited due to persistent cloud cover. On 9, 10, 13, and 14 November, clear satellite views of the region revealed ash plumes up to ~9.25 km wide and ~37 km long drifting from the volcano. On 9 and 10 November, ash plumes reached ~5.5 km altitude and tended to drift W; communities located up to 20 km NW of Nevado del Huila reported ashfall on the morning of 10 November. On 13 and 14 November, ash plumes reached 6.7 km altitude and drifted SW and S, respectively.
On 14 November, scientists identified a conspicuous "drumbeat" pattern of seismicity underneath the volcano, signifying the movement of magma and the potential buildup to an eruption (figure 22). This pattern intensified over the next six days.
Drumbeat earthquakes. The term "drumbeat" was coined by scientists during the onset of the Mount St. Helens (MSH) 2004 eruption (BGVN 30:12). After a series of seismic swarms, tremor, and explosions from the crater, USGS scientists noted that regular, impulsive seismic signals were detected at shallow depths beneath the Mount St. Helens dome on 16 October 2004; this pattern of seismicity continued until the end of 2005 (Moran and others, 2008).
“Seismograms showed that drumbeat waveforms typically had impulsive, high-frequency onsets and low-frequency codas, similar to those of other ‘hybrid’ volcanic earthquakes...all drumbeats originated at depths
Eruption during 20-21 November 2008. At 2145 on 20 November 2008, Nevado del Huila erupted. Two large lahars swept into the Páez River, claiming 10 lives and destroying bridges, houses, and pastures. According to the UN Office for the Coordination of Humanitarian Affairs (OCHA), the lahars had heights of as much as 30 meters, traveled down the Páez river, and joined the Magdalena River, which feeds the Betania reservoir in Yaguara municipality in Huila department; the reservoir cushioned the impact of the mud flows moving downstream. The inhabitants of Taravira (~22 km S), Toez (~15 km SSW), and La Estrella reported significant ashfall and loud noises likely associated with lahars in nearby drainages. By the following day, seismic activity diminished significantly, and the Alert Level was lowered from Red (I, posted during the eruption) to Orange (II).
The Washington VAAC detected two large plumes of gas and ash at 0345 on 21 November with altitudes ~14 km and ~11 km drifting SE and W, respectively. Two additional alerts were released (at 0445 and 1045) that tracked the ash plumes as they continued to drift at velocities up to 10 m/s SE and W.
During two observation flights conducted with the support of the Colombian Air Force, observers saw a 400-m-diameter crater in the S part of Pico Central containing a degassing lava dome on 21 November (figure 23). The lava dome was thought to have formed during previous months, but had not been visible due to poor weather conditions prior to the eruption. Lahars were observed to originate from the upper flanks of the volcano and extend into the Páez River basin (figure 24). Strong fumarolic activity was observed along the large cracks in the volcano from previous eruptions. INGEOMINAS reported that they would continuously monitor the lava dome for future hazards, but that they believed that the late November eruption had ended.
Human toll and humanitarian response. On 23 November 2008, the National Direction for Prevention and Assistance (DPAD) reported that six people had died (three boys, one girl and two men) and three people were missing. The International Federation's Disaster Relief Emergency Fund (DREF) reported that over 8,000 people were affected by the lahars (table 3). On 21 November, President Alvaro Uribe flew over the disaster area to observe the damage. Afterward, he designated a special commission to oversee the repair of infrastructure damaged by the mudflows. Destruction of bridges and roads made humanitarian aid to the area difficult, especially to more isolated communities, but the Colombian Air Force (FAC) provided air support to ease relief efforts.
Table 3. Human impact of the 20 November 2008 Nevado del Huila eruption. Adapted from ReliefWeb DREF report.
| Category |
Number of People |
| People evacuated during the eruption phase |
6,000 |
| People affected after the eruption |
2,864 |
| Casualties |
10 |
| Injured |
7 |
| Missing |
6 |
| Houses destroyed in urban areas |
40 |
| Houses destroyed in rural areas |
7 |
| Houses damaged in urban areas |
75 |
| Houses damaged in rural areas |
14 |
DREF funding had been awarded to the Colombian Red Cross Society (CRCS) in April 2008 to provide disaster aid. Temporary shelters set up by the CRCS in Belalcázar were crude but successfully sheltered nearly 1,000 people early in the relief efforts. The Colombian government and the National System for Disaster Preparedness and Response (SNPAD) provided over 98 tons of humanitarian relief distributed by SNPAD, CRCS, FAC, and other organizations.
Activity during December 2008. After the November eruption, volcanic unrest significantly decreased. Seismic activity decreased to less than 500 events per week (table 2), and SO2 emissions decreased to approximately 2,500 t/d (figure 18). Overflights were conducted on 4 and 6 December to observe the degassing lava dome; gases were primarily rising from the highest portions of the dome, producing a white plume reaching less than 1,000 m above the peak (figure 25). New fractures were also observed in the surface of Pico Central's glaciers. INGEOMINAS reported an estimated lava-dome volume of 4,500,000 m3. A more recent estimate, however, was proposed in an online December report by INGEOMINAS citing 32,000,000 m3 with dimensions of 700 m N-S and 250 m E-W.
On 12 December 2008, a webcam was installed within the SSW sector of Nevado del Huila and by 18 December began to provide continuous visual monitoring of changes in the dome. Installed at Tafxnú (viewing the NW flank of Nevado del Huila), the camera was programmed to refresh the images every minute. This equipment was a donation from the U.S. Geological Survey.
On 18 December a permanent station dedicated to the monitoring of SO2 emissions was installed in the town of Caloto (Cauca). Elevated SO2 emissions continued to the end of December and were detected by the AURA/OMI satellite. Sulfur dioxide odors were noted by a commercial airline crew at 0158 on 30 December.
References. Iverson, R.M., Dzurisin, D., Gardner, C.A., Gerlach, T.M., LaHusen, R.G., Lisowski, M., Major, J.J., Malone, S.D., Messerich, J.A., Moran, S.C., Pallister, J.S., Qamar, A.I., Schilling, S.P., and Vallance, J.W. (2006) Dynamics of seismogenic volcanic extrusion at Mount St Helens in 2004-05, Nature, 444: 439-443.
Moran, S.C., Malone, S.D., Qamar, A.I., Thelen, W.A., Wright, A.K., and Caplan-Auerbach, J. (2008) Seismicity associated with renewed dome building at Mount St. Helens, 2004-2005. In Sherrod, D.R., Scott, W.E., Stauffer, P.H. (eds) A volcano rekindled: the renewed eruption of Mount St. Helens, 2004-2006. U.S. Geological Survey Professional Paper 1750: 27-60.
Geologic Background. Nevado del Huila, the highest peak in the Colombian Andes, is an elongated N-S-trending volcanic chain mantled by a glacier icecap. The andesitic-dacitic volcano was constructed within a 10-km-wide caldera. Volcanism at Nevado del Huila has produced six volcanic cones whose ages in general migrated from south to north. The high point of the complex is Pico Central. Two glacier-free lava domes lie at the southern end of the volcanic complex. The first historical activity was an explosive eruption in the mid-16th century. Long-term, persistent steam columns had risen from Pico Central prior to the next eruption in 2007, when explosive activity was accompanied by damaging mudflows.
Information Contacts: Instituto Colombiano de Geologia y Mineria (INGEOMINAS), Observatorio Vulcanológico y Sismológico de Popayán, Popayán, Colombia; Washington Volcanic Ash Advisory Center (VAAC), NOAA Science Center Room 401, 5200 Auth road, Camp Springs, MD 20746, USA (URL: http://www.ospo.noaa.gov/Products/atmosphere/vaac/); Ozone Monitoring Instrument (OMI), Sulfur Dioxide Group, Joint Center for Earth Systems Technology, University of Maryland Baltimore County (UMBC), 1000 Hilltop Circle, Baltimore, MD 21250, USA (URL: https://so2.gsfc.nasa.gov/); United Nations Office for the Coordination of Humanitarian Affairs (OCHA) (URL: http://www.unocha.org/); International Federation’s Disaster Relief Emergency Fund (DREF) (URL: http://www.ifrc.org/); Colombian Red Cross Society (CRCS) (URL: http://www.cruzrojacolombiana.org/); ReliefWeb (URL: https://reliefweb.int/report/colombia/colombia-volcano-dref-operation-no-mdrco005-final-report); El Tiempo (URL: http://www.eltiempo.com/archivo/documento/CMS-4100993).
Tengger Caldera (Indonesia) — October 2012 Cite this Report
Tengger Caldera
Indonesia
7.942°S, 112.95°E; summit elev. 2329 m
All times are local (unless otherwise noted)
Modest April 2011 eruption at Bromo followed by increasing tremor
This report discusses Bromo's behavior during April 2011 to early October 2012, an interval of ongoing seismicity. The Bromo cone, located within the Tengger caldera, has erupted repeatedly since about the year 1590. Under normal conditions in recent decades, Bromo emits a white, sulfurous, diffuse-to-dense vapor plume reaching heights of about 75-150 m above the rim. Observations of Bromo are carried out both visually and with instruments. Visual observation is aided by a closed circuit TV (CCTV) camera. A seismic station incorporates both analog and digital recordings. Observations of deformation are carried out with one tiltmeter station.
Our last report on Bromo (BGVN 36:03) presented activity through March 2011, which could be differentiated into largely Strombolian phases accompanied by little ash and variable levels of degassing, and phases during which significant amounts of ash were released (Roscoe, 2011). Strombolian phases were sometimes accompanied by powerful shockwaves, often after short periods (10-30 seconds) of complete calm (Roscoe, 2011).
During most of April 2011, the Bromo cone was relatively quiet until 27 April when the Darwin Volcanic Ash Advisory Centre (VAAC) reported an ash plume rising to an altitude of ~4.3 km and drifting ~75 km WSW. From 1-10 May the Center of Volcanology and Geological Hazard Mitigation (CVGHM) reported white-to-gray ash plumes rising ~400-600 m above the crater and drifting ENE, and incandescence emanating from the crater. On 2 May the Darwin VAAC reported that a significant ash plume rose to an altitude of ~3 km and drifted ~75 km N. Based on analyses of satellite imagery, the Darwin VAAC again reported that during 9-10 May ash plumes from Bromo rose to an altitude of ~2.7 km and drifted 45-75 km NE and E. During 11-20 May white-to-gray ash plumes rose ~200-400 m above the crater and drifted E.
Ash plumes continued to rise from the crater during 1-13 June, reaching heights of ~100-200 m above the crater and drifting E. Ash fell in areas within 2 km to the E and NE during May and June. On 13 June the Alert Level was lowered to 2 (on a scale of 1-4). During the rest of 2011 Bromo was quiet.
From 1 January-29 March 2012 CVGHM reported that white plumes from the Bromo cone rose ~50 m above the crater; background seismicity declined. On 30 March the Alert Level was lowered to 1. This modest activity continued until 1 September when diffuse white plumes from the Bromo cone rose 50 m above the crater. During 1-28 September 2012, the following seismic events were recorded: 6 deep volcanic, 1 shallow volcanic, and 57 long-distance tectonic earthquakes. Tremor continued with a maximum amplitude of 0.5 mm. From 29 September to 1 October 2012 continuous tremor was recorded, reaching a maximum amplitude of 11 mm. The dominant reading was 0.5 mm.
Seismicity increased on 1 October, and during 1-3 October a sulfur odor was occasionally noted at the Bromo Observation Post. On 2 October 2012, continuous tremor reached a maximum amplitude of 11 mm with a dominant reading of 7 mm. On 3 October the tremor rose continuously, reaching 22 mm. Accordingly, on 3 October the Alert Level was raised to 2.
Reference. Roscoe, R., 2011, Bromo Volcano (Tengger Caldera), Photovolcanica, 86 photographs, Updated 21 August 2011, Accessed 21 November 2012 (URL: http://www.photovolcanica.com/VolcanoInfo/Bromo/Bromo.html).
Geologic Background. The 16-km-wide Tengger caldera is located at the northern end of a volcanic massif extending from Semeru volcano. The massive volcanic complex dates back to about 820,000 years ago and consists of five overlapping stratovolcanoes, each truncated by a caldera. Lava domes, pyroclastic cones, and a maar occupy the flanks of the massif. The Ngadisari caldera at the NE end of the complex formed about 150,000 years ago and is now drained through the Sapikerep valley. The most recent of the calderas is the 9 x 10 km wide Sandsea caldera at the SW end of the complex, which formed incrementally during the late Pleistocene and early Holocene. An overlapping cluster of post-caldera cones was constructed on the floor of the Sandsea caldera within the past several thousand years. The youngest of these is Bromo, one of Java's most active and most frequently visited volcanoes.
Information Contacts: Center of Volcanology and Geological Hazard Mitigation (CVGHM), Jalan Diponegoro 57, Bandung 40122, Indonesia (URL: http://vsi.esdm.go.id/); Darwin Volcanic Ash Advisory Centre (VAAC), Bureau of Meteorology, Northern Territory Regional Office, PO Box 40050, Casuarina, NT 0811, Australia (URL: http://www.bom.gov.au/info/vaac/).
Tokachidake (Japan) — October 2012 Cite this Report
Tokachidake
Japan
43.418°N, 142.686°E; summit elev. 2077 m
All times are local (unless otherwise noted)
Small hot gas emissions and minor seismicity in mid-2012
During 1995-1996, Tokachi (also called Tokachi-dake) intermittently experienced increased seismicity (BGVN 20:07, 20:08, 20:11/12, and 21:05). The volcano is located in central Hokkaido, the northernmost of Japan's 47 prefectures (figure 6).
Monthly reports of volcanic activity from the Japan Meteorological Agency (JMA) translated into English resumed in October 2010. The only recent English-translated JMA report on Tokachi appeared in June 2012. The only other account available on this volcano between 1996 and June 2012 was in 2003, when a news account (Associated Press) mentioned that volcanic tremor occurred on 8 February 2003 and lasted for 37 minutes. This news account noted that the JMA saw no emissions or other signs that an eruption had occurred.
According to JMA, a small event in Taisho crater occurred, apparently on 1 June 2012. Hot gas from this event flowed down the NE and E flanks of Tokachi. Aerial observations on 1 June 2012 with an infrared camera revealed high temperature areas on the E wall of Taisho crater. No ejecta such as volcanic ash was observed around the crater. A field study that same day measured the average sulfur dioxide flux as 600 metric tons/day (t/d). After 4 June, the crater's temperature and gas emission volume decreased.
According to JMA, on 30 June 2012 volcanic glow in the Taisho crater was observed with a high-sensitivity camera. This glow gradually brightened toward the early morning of 1 July and continued through the early morning of 5 July. Thereafter, the glow diminished, suggesting a decreasing temperature. JMA believed the glow stemmed from the emission of high-temperature volcanic gases and the burning of sulfur. No changes occurred with respect to volcanic earthquakes, tremor, ground deformation, and infrasonic data either before or after the period of volcanic glow.
On 1 July, infrared camera observations again revealed high-temperature areas on the E wall of Taisho crater. These high temperatures persisted through most of July, after which they returned to normal. Several reports in July noted a small new fumarole near an existing fumarole on the E wall of the crater. Scientists conducting a field survey on 1 July measured the flux of sulfur dioxide from the fumarole at 600 t/d. No field surveys were conducted after 3 July because of bad weather, but officials believed that SO2 levels had decreased, given that emissions from the fumarole had decreased.
On 11 July, instruments recorded small-amplitude, short-duration volcanic tremor. This was followed by small-amplitude volcanic earthquakes until the next morning. These events were not accompanied by any change in fumarole emissions, infrasonic data, or ground-deformation data. The hypocenters were located just beneath the shallow part of the Ground Crater (in Japanese, Guraundo-kako; translates into English as "old crater").
In July, GPS ground deformation data at Mae-Tokachi-Dake, a stratovolcano cone of Tokachi, found a small area of inflation at the shallow part of a crater designated as 62-2.
Geologic Background. Tokachidake volcano consists of a group of dominantly andesitic stratovolcanoes and lava domes arranged on a NE-SW line above a plateau of welded Pleistocene tuffs in central Hokkaido. Numerous explosion craters and cinder cones are located on the upper flanks of the small stratovolcanoes, with the youngest Holocene centers located at the NW end of the chain. Frequent historical eruptions, consisting mostly of mild-to-moderate phreatic explosions, have been recorded since the mid-19th century. Two larger eruptions occurred in 1926 and 1962. Partial cone collapse of the western flank during the 1926 eruption produced a disastrous debris avalanche and mudflow.
Information Contacts: Japan Meteorological Agency (JMA), Otemachi, 1-3-4, Chiyoda-ku Tokyo 100-8122, Japan (URL: http://www.jma.go.jp/); Associated Press (URL: https://www.ap.org/).