Recently Published Bulletin Reports
Manam (Papua New Guinea) Few ash plumes during November-December 2022
Krakatau (Indonesia) Strombolian activity and ash plumes during November 2022-April 2023
Stromboli (Italy) Strombolian explosions and lava flows continue during January-April 2023
Nishinoshima (Japan) Small ash plumes and fumarolic activity during November 2022 through April 2023
Karangetang (Indonesia) Lava flows, incandescent avalanches, and ash plumes during January-June 2023
Ahyi (United States) Intermittent hydroacoustic signals and discolored plumes during November 2022-June 2023
Kadovar (Papua New Guinea) An ash plume and weak thermal anomaly during May 2023
San Miguel (El Salvador) Small gas-and-ash explosions during March and May 2023
Semisopochnoi (United States) Occasional explosions, ash deposits, and gas-and-steam plumes during December 2022-May 2023
Ebeko (Russia) Continued explosions, ash plumes, and ashfall during October 2022-May 2023
Home Reef (Tonga) Discolored plumes continued during November 2022-April 2023
Ambae (Vanuatu) New lava flow, ash plumes, and sulfur dioxide plumes during February-May 2023
Manam (Papua New Guinea) — July 2023  Cite this Report
Manam
Papua New Guinea
4.08°S, 145.037°E; summit elev. 1807 m
All times are local (unless otherwise noted)
Few ash plumes during November-December 2022
Manam is a 10-km-wide island that consists of two active summit craters: the Main summit crater and the South summit crater and is located 13 km off the northern coast of mainland Papua New Guinea. Frequent mild-to-moderate eruptions have been recorded since 1616. The current eruption period began during June 2014 and has more recently been characterized by intermittent ash plumes and thermal activity (BGVN 47:11). This report updates activity that occurred from November 2022 through May 2023 based on information from the Darwin Volcanic Ash Advisory Center (VAAC) and various satellite data.
Ash plumes were reported during November and December 2022 by the Darwin VAAC. On 7 November an ash plume rose to 2.1 km altitude and drifted NE based on satellite images and weather models. On 14 November an ash plume rose to 2.1 km altitude and drifted W based on RVO webcam images. On 20 November ash plumes rose to 1.8 km altitude and drifted NW. On 26 December an ash plume rose to 3 km altitude and drifted S and SSE.
Intermittent sulfur dioxide plumes were detected using the TROPOMI instrument on the Sentinel-5P satellite, some of which exceeded at least two Dobson Units (DU) and drifted in different directions (figure 93). Occasional low-to-moderate power thermal anomalies were recorded by the MIROVA (Middle InfraRed Observation of Volcanic Activity) system; less than five anomalies were recorded each month during November 2022 through May 2023 (figure 94). Two thermal hotspots were detected by the MODVOLC thermal alerts system on 10 December 2022. On clear weather days, thermal activity was also captured in infrared satellite imagery in both the Main and South summit craters, accompanied by gas-and-steam emissions (figure 95).
Geologic Background. The 10-km-wide island of Manam, lying 13 km off the northern coast of mainland Papua New Guinea, is one of the country's most active volcanoes. Four large radial valleys extend from the unvegetated summit of the conical basaltic-andesitic stratovolcano to its lower flanks. These valleys channel lava flows and pyroclastic avalanches that have sometimes reached the coast. Five small satellitic centers are located near the island's shoreline on the northern, southern, and western sides. Two summit craters are present; both are active, although most observed eruptions have originated from the southern crater, concentrating eruptive products during much of the past century into the SE valley. Frequent eruptions, typically of mild-to-moderate scale, have been recorded since 1616. Occasional larger eruptions have produced pyroclastic flows and lava flows that reached flat-lying coastal areas and entered the sea, sometimes impacting populated areas.
Information Contacts: Rabaul Volcano Observatory (RVO), Geohazards Management Division, Department of Mineral Policy and Geohazards Management (DMPGM), PO Box 3386, Kokopo, East New Britain Province, Papua New Guinea; Darwin Volcanic Ash Advisory Centre (VAAC), Bureau of Meteorology, Northern Territory Regional Office, PO Box 40050, Casuarina, NT 0811, Australia (URL: http://www.bom.gov.au/info/vaac/); MIROVA (Middle InfraRed Observation of Volcanic Activity), a collaborative project between the Universities of Turin and Florence (Italy) supported by the Centre for Volcanic Risk of the Italian Civil Protection Department (URL: http://www.mirovaweb.it/); Hawai'i Institute of Geophysics and Planetology (HIGP) - MODVOLC Thermal Alerts System, School of Ocean and Earth Science and Technology (SOEST), Univ. of Hawai'i, 2525 Correa Road, Honolulu, HI 96822, USA (URL: http://modis.higp.hawaii.edu/); NASA Global Sulfur Dioxide Monitoring Page, Atmospheric Chemistry and Dynamics Laboratory, NASA Goddard Space Flight Center (NASA/GSFC), 8800 Greenbelt Road, Goddard, Maryland, USA (URL: https://so2.gsfc.nasa.gov/); Copernicus Browser, Copernicus Data Space Ecosystem, European Space Agency (URL: https://dataspace.copernicus.eu/browser/).
Krakatau (Indonesia) — July 2023 Cite this Report
Krakatau
Indonesia
6.1009°S, 105.4233°E; summit elev. 285 m
All times are local (unless otherwise noted)
Strombolian activity and ash plumes during November 2022-April 2023
Krakatau is located in the Sunda Strait between Java and Sumatra, Indonesia. Caldera collapse during the catastrophic 1883 eruption destroyed Danan and Perbuwatan cones and left only a remnant of Rakata. The post-collapse cone of Anak Krakatau (Child of Krakatau) was constructed within the 1883 caldera at a point between the former Danan and Perbuwatan cones; it has been the site of frequent eruptions since 1927. The current eruption period began in May 2021 and has recently consisted of explosions, ash plumes, and thermal activity (BGVN 47:11). This report covers activity during November 2022 through April 2023 based on information provided by the Indonesian Center for Volcanology and Geological Hazard Mitigation, referred to as Pusat Vulkanologi dan Mitigasi Bencana Geologi (PVMBG), MAGMA Indonesia, the Darwin Volcanic Ash Advisory Center (VAAC), and several sources of satellite data.
Activity was relatively low during November and December 2022. Daily white gas-and-steam plumes rose 25-100 m above the summit and drifted in different directions. Gray ash plumes rose 200 m above the summit and drifted NE at 1047 and at 2343 on 11 November. On 14 November at 0933 ash plumes rose 300 m above the summit and drifted E. An ash plume was reported at 0935 on 15 December that rose 100 m above the summit and drifted NE. An eruptive event at 1031 later that day generated an ash plume that rose 700 m above the summit and drifted NE. A gray ash plume at 1910 rose 100 m above the summit and drifted E. Incandescent material was ejected above the vent based on an image taken at 1936.
During January 2023 daily white gas-and-steam plumes rose 25-300 m above the summit and drifted in multiple directions. Gray-to-brown ash plumes were reported at 1638 on 3 January, at 1410 and 1509 on 4 January, and at 0013 on 5 January that rose 100-750 m above the summit and drifted NE and E; the gray-to-black ash plume at 1509 on 4 January rose as high as 3 km above the summit and drifted E. Gray ash plumes were recorded at 1754, 2241, and 2325 on 11 January and at 0046 on 12 January and rose 200-300 m above the summit and drifted NE. Toward the end of January, PVMBG reported that activity had intensified; Strombolian activity was visible in webcam images taken at 0041, 0043, and 0450 on 23 January. Multiple gray ash plumes throughout the day rose 200-500 m above the summit and drifted E and SE (figure 135). Webcam images showed progressively intensifying Strombolian activity at 1919, 1958, and 2113 on 24 January; a gray ash plume at 1957 rose 300 m above the summit and drifted E (figure 135). Eruptive events at 0231 and 2256 on 25 January and at 0003 on 26 January ejected incandescent material from the vent, based on webcam images. Gray ash plumes observed during 26-27 January rose 300-500 m above the summit and drifted NE, E, and SE.
Low levels of activity were reported during February and March. Daily white gas-and-steam plumes rose 25-300 m above the summit and drifted in different directions. The Darwin VAAC reported that continuous ash emissions rose to 1.5-1.8 km altitude and drifted W and NW during 1240-1300 on 10 March, based on satellite images, weather models, and PVMBG webcams. White-and-gray ash plumes rose 500 m and 300 m above the summit and drifted SW at 1446 and 1846 on 18 March, respectively. An eruptive event was recorded at 2143, though it was not visible due to darkness. Multiple ash plumes were reported during 27-29 March that rose as high as 2.5 km above the summit and drifted NE, W, and SW (figure 136). Webcam images captured incandescent ejecta above the vent at 0415 and around the summit area at 2003 on 28 March and at 0047 above the vent on 29 March.
Daily white gas-and-steam plumes rose 25-300 m above the summit and drifted in multiple directions during April and May. White-and-gray and black plumes rose 50-300 m above the summit on 2 and 9 April. On 11 May at 1241 a gray ash plume rose 1-3 km above the summit and drifted SW. On 12 May at 0920 a gray ash plume rose 2.5 km above the summit and drifted SW and at 2320 an ash plume rose 1.5 km above the summit and drifted SW. An accompanying webcam image showed incandescent ejecta. On 13 May at 0710 a gray ash plume rose 2 km above the summit and drifted SW (figure 137).
The MIROVA (Middle InfraRed Observation of Volcanic Activity) graph of MODIS thermal anomaly data showed intermittent low-to-moderate power thermal anomalies during November 2022 through April 2023 (figure 138). Some of this thermal activity was also visible in infrared satellite imagery at the crater, accompanied by gas-and-steam and ash plumes that drifted in different directions (figure 139).
Geologic Background. The renowned Krakatau (frequently mis-named as Krakatoa) volcano lies in the Sunda Strait between Java and Sumatra. Collapse of an older edifice, perhaps in 416 or 535 CE, formed a 7-km-wide caldera. Remnants of that volcano are preserved in Verlaten and Lang Islands; subsequently the Rakata, Danan, and Perbuwatan cones were formed, coalescing to create the pre-1883 Krakatau Island. Caldera collapse during the catastrophic 1883 eruption destroyed Danan and Perbuwatan, and left only a remnant of Rakata. This eruption caused more than 36,000 fatalities, most as a result of tsunamis that swept the adjacent coastlines of Sumatra and Java. Pyroclastic surges traveled 40 km across the Sunda Strait and reached the Sumatra coast. After a quiescence of less than a half century, the post-collapse cone of Anak Krakatau (Child of Krakatau) was constructed within the 1883 caldera at a point between the former Danan and Perbuwatan cones. Anak Krakatau has been the site of frequent eruptions since 1927.
Information Contacts: Pusat Vulkanologi dan Mitigasi Bencana Geologi (PVMBG, also known as Indonesian Center for Volcanology and Geological Hazard Mitigation, CVGHM), Jalan Diponegoro 57, Bandung 40122, Indonesia (URL: http://www.vsi.esdm.go.id/); MAGMA Indonesia, Kementerian Energi dan Sumber Daya Mineral (URL: https://magma.esdm.go.id/v1); Darwin Volcanic Ash Advisory Centre (VAAC), Bureau of Meteorology, Northern Territory Regional Office, PO Box 40050, Casuarina, NT 0811, Australia (URL: http://www.bom.gov.au/info/vaac/); MIROVA (Middle InfraRed Observation of Volcanic Activity), a collaborative project between the Universities of Turin and Florence (Italy) supported by the Centre for Volcanic Risk of the Italian Civil Protection Department (URL: http://www.mirovaweb.it/); Copernicus Browser, Copernicus Data Space Ecosystem, European Space Agency (URL: https://dataspace.copernicus.eu/browser/).
Stromboli
Italy
38.789°N, 15.213°E; summit elev. 924 m
All times are local (unless otherwise noted)
Strombolian explosions and lava flows continue during January-April 2023
Stromboli, located in Italy, has exhibited nearly constant lava fountains for the past 2,000 years; recorded eruptions date back to 350 BCE. Eruptive activity occurs at the summit from multiple vents, which include a north crater area (N area) and a central-southern crater (CS area) on a terrace known as the ‘terrazza craterica’ at the head of the Sciara del Fuoco, a large scarp that runs from the summit down the NW side of the volcano-island. Activity typically consists of Strombolian explosions, incandescent ejecta, lava flows, and pyroclastic flows. Thermal and visual monitoring cameras are located on the nearby Pizzo Sopra La Fossa, above the terrazza craterica, and at multiple flank locations. The current eruption period has been ongoing since 1934 and recent activity has consisted of frequent Strombolian explosions and lava flows (BGVN 48:02). This report updates activity during January through April 2023 primarily characterized by Strombolian explosions and lava flows based on reports from Italy's Istituto Nazionale di Geofisica e Vulcanologia (INGV) and various satellite data.
Frequent explosive activity continued throughout the reporting period, generally in the low-to-medium range, based on the number of hourly explosions in the summit crater (figure 253, table 16). Intermittent thermal activity was recorded by the MIROVA (Middle InfraRed Observation of Volcanic Activity) analysis of MODIS satellite data (figure 254). According to data collected by the MODVOLC thermal algorithm, a total of 9 thermal alerts were detected: one on 2 January 2023, one on 1 February, five on 24 March, and two on 26 March. The stronger pulses of thermal activity likely reflected lava flow events. Infrared satellite imagery captured relatively strong thermal hotspots at the two active summit craters on clear weather days, showing an especially strong event on 8 March (figure 255).
Table 16. Summary of type, frequency, and intensity of explosive activity at Stromboli by month during January-April 2023; information from webcam observations. Courtesy of INGV weekly reports.
| Month |
Explosive Activity |
| Jan 2023 |
Typical Strombolian activity with spattering and lava overflows in the N crater area. Explosions were reported from 4 vents in the N area and 1-2 vents in the CS area. The average hourly frequency of explosions was low-to-medium (1-12 events/hour). The intensity of the explosions varied from low (less than 80 m high) to medium (less than 150 m high) in the N crater area and up to high (greater than 150 m high) in the CS crater area. |
| Feb 2023 |
Typical Strombolian activity with spattering in the N crater area. Explosions were reported from 2-3 vents in the N area and 1-4 vents in the CS area. The average hourly frequency of explosions was low-to-medium (1-14 events/hour). The intensity of the explosions varied from low (less than 80 m high) to medium (less than 150 m high) in the N crater area and up to high (greater than 150 m high) in the CS crater area. |
| Mar 2023 |
Typical Strombolian activity with spattering and lava overflows in the N crater area. Explosions were reported from 2-3 vents in the N area and 2-4 vents in the CS area. The average hourly frequency of explosions was low-to-medium (1-18 events/hour). The intensity of the explosions varied from low (less than 80 m high) to medium (less than 150 m high) in the N crater area and up to high (greater than 150 m high) in the CS crater area. |
| Apr 2023 |
Typical Strombolian activity. Explosions were reported from 2 vents in the N area and 2-3 vents in the CS area. The average hourly frequency of explosions was low-to-high (1-16 events/hour). The intensity of the explosions varied from low (less than 80 m high) to medium (less than 150 m high) in both the N and CS crater areas. |
Activity during January-February 2023. Strombolian explosions were reported in the N crater area, as well as lava effusion. Explosive activity in the N crater area ejected coarse material (bombs and lapilli). Intense spattering was observed in both the N1 and N2 craters. In the CS crater area, explosions generally ejected fine material (ash), sometimes to heights greater than 250 m. The intensity of the explosions was characterized as low-to-medium in the N crater and medium-to-high in the CS crater. After intense spattering activity from the N crater area, a lava overflow began at 2136 on 2 January that flowed part way down the Sciara del Fuoco, possibly moving down the drainage that formed in October, out of view from webcams. The flow remained active for a couple of hours before stopping and beginning to cool. A second lava flow was reported at 0224 on 4 January that similarly remained active for a few hours before stopping and cooling. Intense spattering was observed on 11 and 13 January from the N1 crater. After intense spattering activity at the N2 crater at 1052 on 17 January another lava flow started to flow into the upper part of the Sciara del Fuoco (figure 256), dividing into two: one that traveled in the direction of the drainage formed in October, and the other one moving parallel to the point of emission. By the afternoon, the rate of the flow began to decrease, and at 1900 it started to cool. A lava flow was reported at 1519 on 24 January following intense spattering in the N2 area, which began to flow into the upper part of the Sciara del Fuoco. By the morning of 25 January, the lava flow had begun to cool. During 27 January the frequency of eruption in the CS crater area increased to 6-7 events/hour compared to the typical 1-7 events/hour; the following two days showed a decrease in frequency to less than 1 event/hour. Starting at 1007 on 30 January a high-energy explosive sequence was produced by vents in the CS crater area. The sequence began with an initial energetic pulse that lasted 45 seconds, ejecting predominantly coarse products 300 m above the crater that fell in an ESE direction. Subsequent and less intense explosions ejected material 100 m above the crater. The total duration of this event lasted approximately two minutes. During 31 January through 6, 13, and 24 February spattering activity was particularly intense for short periods in the N2 crater.
An explosive sequence was reported on 16 February that was characterized by a major explosion in the CS crater area (figure 257). The sequence began at 1817 near the S2 crater that ejected material radially. A few seconds later, lava fountains were observed in the central part of the crater. Three explosions of medium intensity (material was ejected less than 150 m high) were recorded at the S2 crater. The first part of this sequence lasted approximately one minute, according to INGV, and material rose 300 m above the crater and then was deposited along the Sciara del Fuoco. The second phase began at 1818 at the S1 crater; it lasted seven seconds and material was ejected 150 m above the crater. Another event 20 seconds later lasted 12 seconds, also ejecting material 150 m above the crater. The sequence ended with at least three explosions of mostly fine material from the S1 crater. The total duration of this sequence was about two minutes.
Short, intense spattering activity was noted above the N1 crater on 27 and 28 February. A lava overflow was first reported at 0657 from the N2 crater on 27 February that flowed into the October 2022 drainage. By 1900 the flow had stopped. A second lava overflow also in the N crater area occurred at 2149, which overlapped the first flow and then stopped by 0150 on 28 February. Material detached from both the lava overflows rolled down the Sciara del Fuoco, some of which was visible in webcam images.
Activity during March-April 2023. Strombolian activity continued with spattering activity and lava overflows in the N crater area during March. Explosive activity at the N crater area varied from low (less than 80 m high) to medium (less than 150 m high) and ejected coarse material, such as bombs and lapilli. Spattering was observed above the N1 crater, while explosive activity at the CS crater area varied from medium to high (greater than 150 m high) and ejected coarse material. Intense spattering activity was observed for short periods on 6 March above the N1 crater. At approximately 0610 a lava overflow was reported around the N2 crater on 8 March, which then flowed into the October 2022 drainage. By 1700 the flow started to cool. A second overflow began at 1712 on 9 March and overlapped the previous flow. It had stopped by 2100. Material from both flows was deposited along the Sciara del Fuoco, though much of the activity was not visible in webcam images. On 11 March a lava overflow was observed at 0215 that overlapped the two previous flows in the October 2022 drainage. By late afternoon on 12 March, it had stopped.
During a field excursion on 16 March, scientists noted that a vent in the central crater area was degassing. Another vent showed occasional Strombolian activity that emitted ash and lapilli. During 1200-1430 low-to-medium intense activity was reported; the N1 crater emitted ash emissions and the N2 crater emitted both ash and coarse material. Some explosions also occurred in the CS crater area that ejected coarse material. The C crater in the CS crater area occasionally showed gas jetting and low intensity explosions on 17 and 22 March; no activity was observed at the S1 crater. Intense, longer periods of spattering were reported in the N1 crater on 19, 24, and 25 March. Around 2242 on 23 March a lava overflow began from the N1 crater that, after about an hour, began moving down the October 2022 drainage and flow along the Sciara del Fuoco (figure 258). Between 0200 and 0400 on 26 March the flow rate increased, which generated avalanches of material from collapses at the advancing flow front. By early afternoon, the flow began to cool. On 25 March at 1548 an explosive sequence began from one of the vents at S2 in the CS crater area (figure 258). Fine ash mixed with coarse material was ejected 300 m above the crater rim and drifted SSE. Some modest explosions around Vent C were detected at 1549 on 25 March, which included an explosion at 1551 that ejected coarse material. The entire explosive sequence lasted approximately three minutes.
During April explosions persisted in both the N and CS crater areas. Fine material was ejected less than 80 m above the N crater rim until 6 April, followed by ejection of coarser material. Fine material was also ejected less than 80 m above the CS crater rim. The C and S2 crater did not show significant eruptive activity. On 7 April an explosive sequence was detected in the CS crater area at 1203 (figure 259). The first explosion lasted approximately 18 seconds and ejected material 400 m above the crater rim, depositing pyroclastic material in the upper part of the Sciara del Fuoco. At 1204 a second, less intense explosion lasted approximately four seconds and deposited pyroclastic products outside the crater area and near Pizzo Sopra La Fossa. A third explosion at 1205 was mainly composed of ash that rose about 150 m above the crater and lasted roughly 20 seconds. A fourth explosion occurred at 1205 about 28 seconds after the third explosion and ejected a mixture of coarse and fine material about 200 m above the crater; the explosion lasted roughly seven seconds. Overall, the entire explosive sequence lasted about two minutes and 20 seconds. After the explosive sequence on 7 April, explosions in both the N and CS crater areas ejected material as high as 150 m above the crater.
On 21 April research scientists from INGV made field observations in the summit area of Stromboli, and some lapilli samples were collected. In the N crater area near the N1 crater, a small cone was observed with at least two active vents, one of which was characterized by Strombolian explosions. The other vent produced explosions that ejected ash and chunks of cooled lava. At the N2 crater at least one vent was active and frequently emitted ash. In the CS crater area, a small cone contained 2-3 degassing vents and a smaller, possible fissure area also showed signs of degassing close to the Pizzo Sopra La Fossa. In the S part of the crater, three vents were active: a small hornito was characterized by modest and rare explosions, a vent that intermittently produced weak Strombolian explosions, and a vent at the end of the terrace that produced frequent ash emissions. Near the S1 crater there was a hornito that generally emitted weak gas-and-steam emissions, sometimes associated with “gas rings”. On 22 April another field inspection was carried out that reported two large sliding surfaces on the Sciara del Fuoco that showed where blocks frequently descended toward the sea. A thermal anomaly was detected at 0150 on 29 April.
Geologic Background. Spectacular incandescent nighttime explosions at Stromboli have long attracted visitors to the "Lighthouse of the Mediterranean" in the NE Aeolian Islands. This volcano has lent its name to the frequent mild explosive activity that has characterized its eruptions throughout much of historical time. The small island is the emergent summit of a volcano that grew in two main eruptive cycles, the last of which formed the western portion of the island. The Neostromboli eruptive period took place between about 13,000 and 5,000 years ago. The active summit vents are located at the head of the Sciara del Fuoco, a prominent scarp that formed about 5,000 years ago due to a series of slope failures which extends to below sea level. The modern volcano has been constructed within this scarp, which funnels pyroclastic ejecta and lava flows to the NW. Essentially continuous mild Strombolian explosions, sometimes accompanied by lava flows, have been recorded for more than a millennium.
Information Contacts: Istituto Nazionale di Geofisica e Vulcanologia (INGV), Sezione di Catania, Piazza Roma 2, 95123 Catania, Italy, (URL: http://www.ct.ingv.it/en/); MIROVA (Middle InfraRed Observation of Volcanic Activity), a collaborative project between the Universities of Turin and Florence (Italy) supported by the Centre for Volcanic Risk of the Italian Civil Protection Department (URL: http://www.mirovaweb.it/); Hawai'i Institute of Geophysics and Planetology (HIGP) - MODVOLC Thermal Alerts System, School of Ocean and Earth Science and Technology (SOEST), Univ. of Hawai'i, 2525 Correa Road, Honolulu, HI 96822, USA (URL: http://modis.higp.hawaii.edu/); Copernicus Browser, Copernicus Data Space Ecosystem, European Space Agency (URL: https://dataspace.copernicus.eu/browser/).
Nishinoshima (Japan) — July 2023 Cite this Report
Nishinoshima
Japan
27.247°N, 140.874°E; summit elev. 100 m
All times are local (unless otherwise noted)
Small ash plumes and fumarolic activity during November 2022 through April 2023
Nishinoshima is a small island located about 1,000 km S of Tokyo in the Ogasawara Arc in Japan. The island is the summit of a massive submarine volcano that has prominent peaks to the S, W, and NE. Eruptions date back to 1973; the most recent eruption period began in October 2022 and was characterized by ash plumes and fumarolic activity (BGVN 47:12). This report describes ash plumes and fumarolic activity during November 2022 through April 2023 based on monthly reports from the Japan Meteorological Agency (JMA) monthly reports and satellite data.
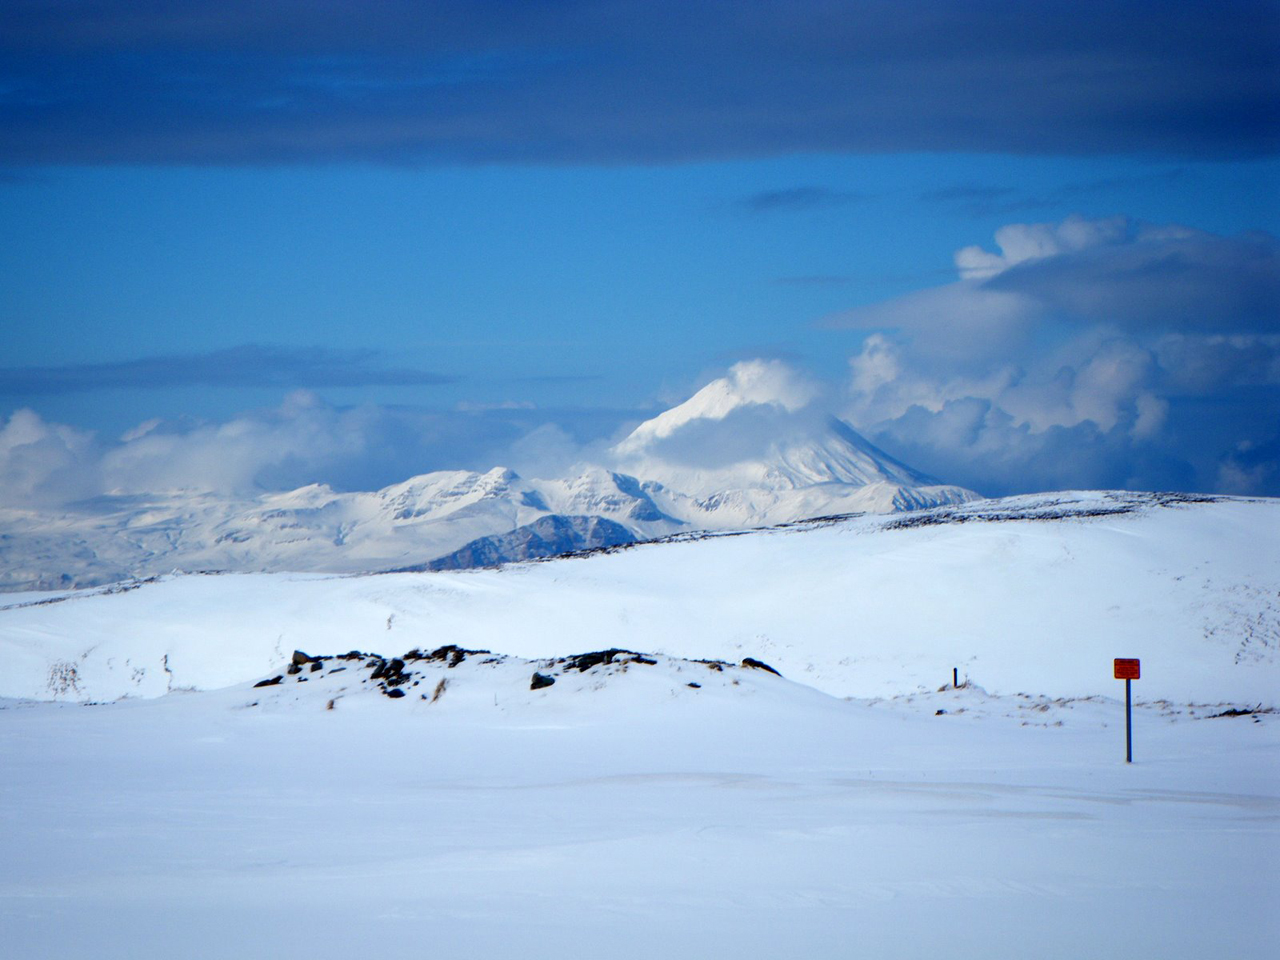
The most recent eruptive activity prior to the reporting internal occurred on 12 October 2022, when an ash plume rose 3.5 km above the crater rim. An aerial observation conducted by the Japan Coast Guard (JCG) on 25 November reported that white fumaroles rose approximately 200 m above the central crater of a pyroclastic cone (figure 119), and multiple plumes were observed on the ESE flank of the cone. Discolored water ranging from reddish-brown to brown and yellowish-green were visible around the perimeter of the island (figure 119). No significant activity was reported in December.
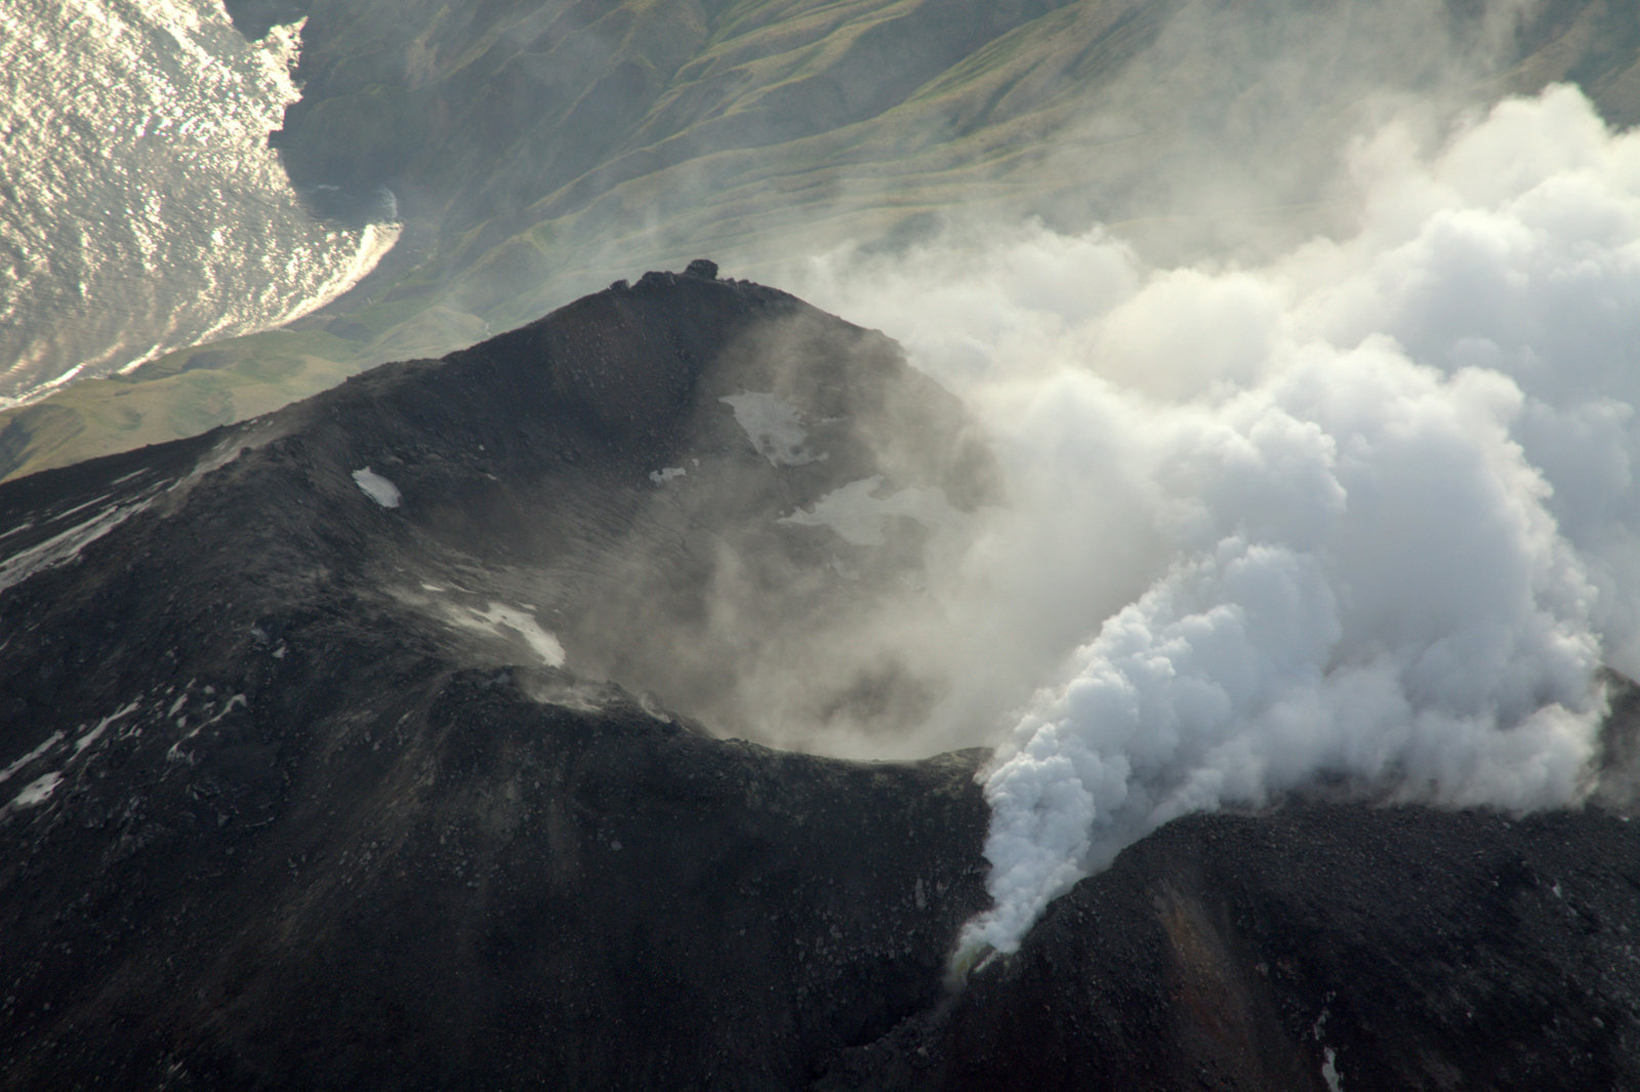
During an overflight conducted by JCG on 25 January 2023 intermittent activity and small, blackish-gray plumes rose 900 m above the central part of the crater were observed (figure 120). The fumarolic zone of the E flank and base of the cone had expanded and emissions had intensified. Dark brown discolored water was visible around the perimeter of the island.
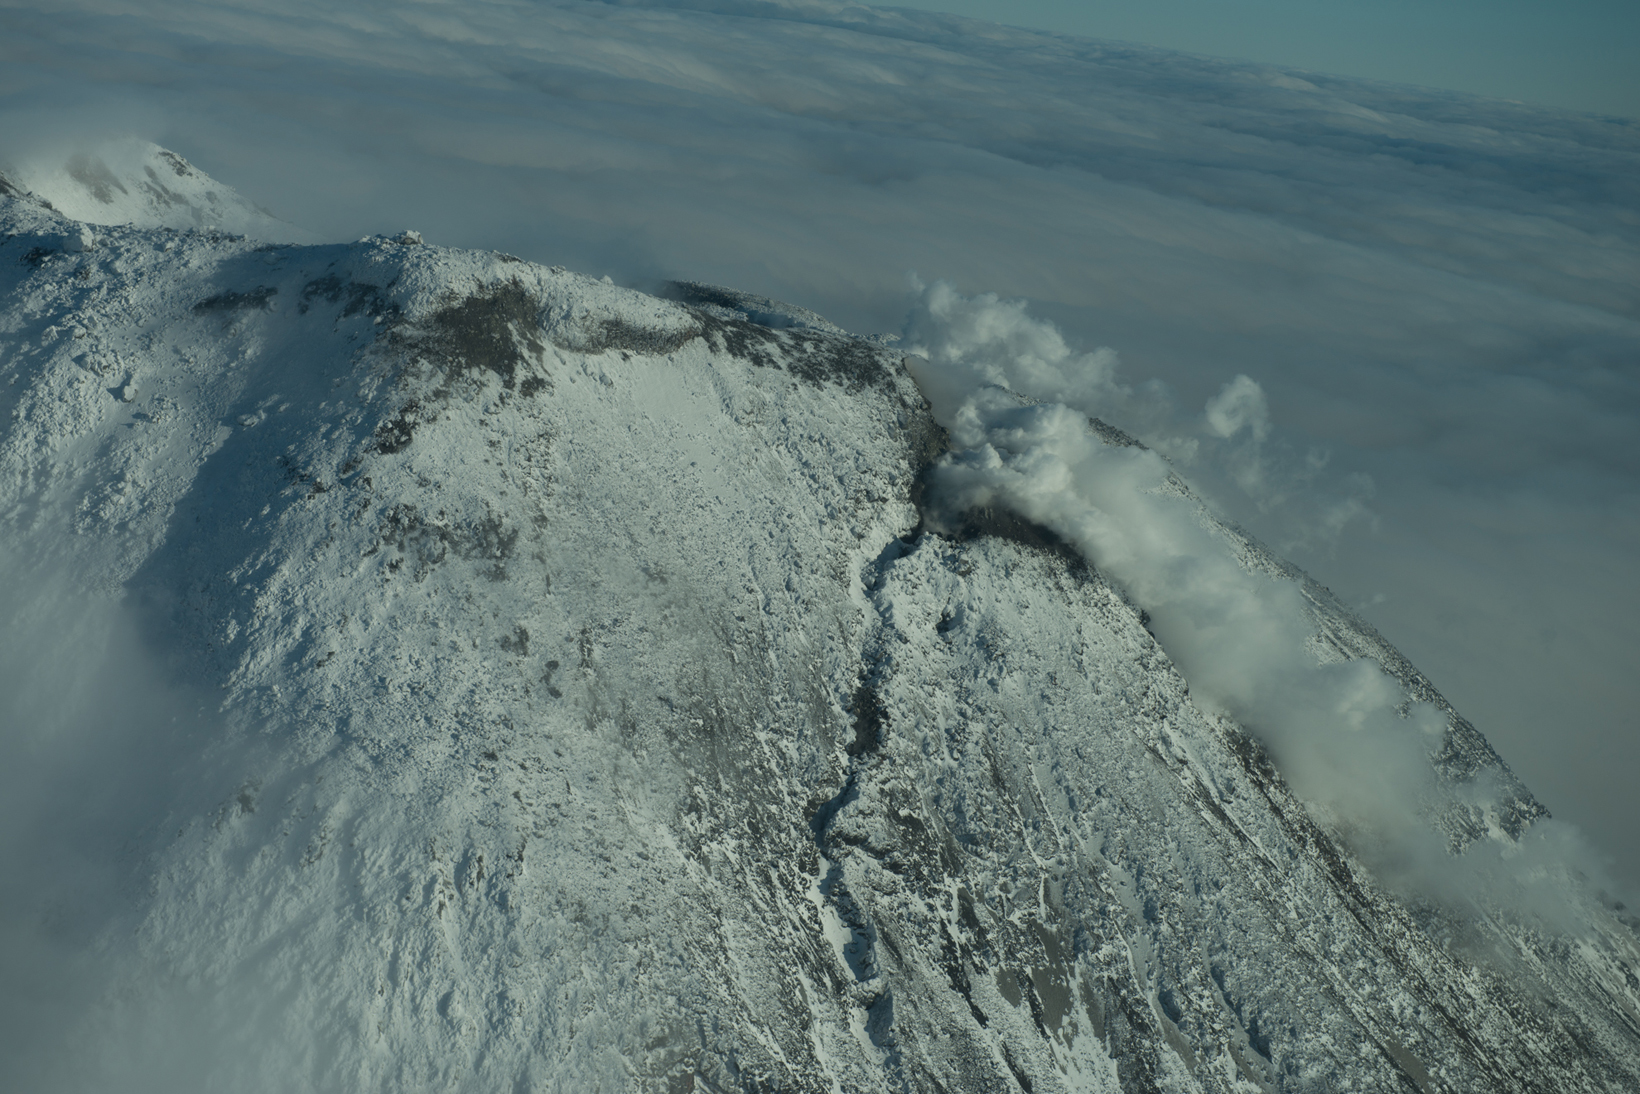
No significant activity was reported during February through March. Ash plumes at 1050 and 1420 on 11 April rose 1.9 km above the crater rim and drifted NW and N. These were the first ash plumes observed since 12 October 2022. On 14 April JCG carried out an overflight and reported that no further eruptive activity was visible, although white gas-and-steam plumes were visible from the central crater and rose 900 m high (figure 121). Brownish and yellow-green discolored water surrounded the island.
Intermittent low-to-moderate power thermal anomalies were recorded in the MIROVA graph (Middle InfraRed Observation of Volcanic Activity) during November 2022 through April 2023 (figure 123). A cluster of six to eight anomalies were detected during November while a smaller number were detected during the following months: two to three during December, one during mid-January 2023, one during February, five during March, and two during April. Thermal activity was also reflected in infrared satellite data at the summit crater, accompanied by occasional gas-and-steam plumes (figure 124).
Geologic Background. The small island of Nishinoshima was enlarged when several new islands coalesced during an eruption in 1973-74. Multiple eruptions that began in 2013 completely covered the previous exposed surface and continued to enlarge the island. The island is the summit of a massive submarine volcano that has prominent peaks to the S, W, and NE. The summit of the southern cone rises to within 214 m of the ocean surface 9 km SSE.
Information Contacts: Japan Meteorological Agency (JMA), 1-3-4 Otemachi, Chiyoda-ku, Tokyo 100-8122, Japan (URL: http://www.jma.go.jp/jma/indexe.html); MIROVA (Middle InfraRed Observation of Volcanic Activity), a collaborative project between the Universities of Turin and Florence (Italy) supported by the Centre for Volcanic Risk of the Italian Civil Protection Department (URL: http://www.mirovaweb.it/); Copernicus Browser, Copernicus Data Space Ecosystem, European Space Agency (URL: https://dataspace.copernicus.eu/browser/).
Karangetang (Indonesia) — July 2023 Cite this Report
Karangetang
Indonesia
2.781°N, 125.407°E; summit elev. 1797 m
All times are local (unless otherwise noted)
Lava flows, incandescent avalanches, and ash plumes during January-June 2023
Karangetang (also known as Api Siau), at the northern end of the island of Siau, Indonesia, contains five summit craters along a N-S line. More than 40 eruptions have been recorded since 1675; recent eruptions have included frequent explosive activity, sometimes accompanied by pyroclastic flows and lahars. Lava dome growth has occurred in the summit craters and collapses of lava flow fronts have produced pyroclastic flows. The two active summit craters are Kawah Dua (the N crater) and Kawah Utama (the S crater, also referred to as the “Main Crater”). The most recent eruption began in late November 2018 and has more recently consisted of weak thermal activity and gas-and-steam emissions (BGVN 48:01). This report updates activity characterized by lava flows, incandescent avalanches, and ash plumes during January through June 2023 using reports from Pusat Vulkanologi dan Mitigasi Bencana Geologi (PVMBG, also known as CVGHM, or the Center of Volcanology and Geological Hazard Mitigation), MAGMA Indonesia, the Darwin VAAC (Volcano Ash Advisory Center), and satellite data.
Activity during January was relatively low and mainly consisted of white gas-and-steam emissions that rose 25-150 m above Main Crater (S crater) and drifted in different directions. Incandescence was visible from the lava dome in Kawah Dua (the N crater). Weather conditions often prevented clear views of the summit. On 18 January the number of seismic signals that indicated avalanches of material began to increase. In addition, there were a total of 71 earthquakes detected during the month.
Activity continued to increase during the first week of February. Material from Main Crater traveled as far as 800 m down the Batuawang (S) and Batang (W) drainages and as far as 1 km W down the Beha (W) drainage on 4 February. On 6 February 43 earthquake events were recorded, and on 7 February, 62 events were recorded. White gas-and-steam emissions rose 25-250 m above both summit craters throughout the month. PVMBG reported an eruption began during the evening of 8 February around 1700. Photos showed incandescent material at Main Crater. Incandescent material had also descended the flank in at least two unconfirmed directions as far as 2 km from Main Crater, accompanied by ash plumes (figure 60). As a result, PVMBG increased the Volcano Alert Level (VAL) to 3 (the second highest level on a 1-4 scale).
Occasional nighttime webcam images showed three main incandescent lava flows of differing lengths traveling down the S, SW, and W flanks (figure 61). Incandescent rocks were visible on the upper flanks, possibly from ejected or collapsed material from the crater, and incandescence was the most intense at the summit. Based on analyses of satellite imagery and weather models, the Darwin VAAC reported that daily ash plumes during 16-20 February rose to 2.1-3 km altitude and drifted NNE, E, and SE. BNPB reported on 16 February that as many as 77 people were evacuated and relocated to the East Siau Museum. A webcam image taken at 2156 on 17 February possibly showed incandescent material descending the SE flank. Ash plumes rose to 2.1 km altitude and drifted SE during 22-23 February, according to the Darwin VAAC.
Incandescent avalanches of material and summit incandescence at Main Crater continued during March. White gas-and-steam emissions during March generally rose 25-150 m above the summit crater; on 31 March gas-and-steam emissions rose 200-400 m high. An ash plume rose to 2.4 km altitude and drifted S at 1710 on 9 March and a large thermal anomaly was visible in images taken at 0550 and 0930 on 10 March. Incandescent material was visible at the summit and on the flanks based on webcam images taken at 0007 and 2345 on 16 March, at 1828 on 17 March, at 1940 on 18 March, at 2311 on 19 March, and at 2351 on 20 March. Incandescence was most intense on 18 and 20 March and webcam images showed possible Strombolian explosions (figure 62). An ash plume rose to 2.4 km altitude and drifted SW on 18 March, accompanied by a thermal anomaly.
Summit crater incandescence at Main Crater and on the flanks persisted during April. Incandescent material at the S crater and on the flanks was reported at 0016 on 1 April. The lava flows had stopped by 1 April according to PVMBG, although incandescence was still visible up to 10 m high. Seismic signals indicating effusion decreased and by 6 April they were no longer detected. Incandescence was visible from both summit craters. On 26 April the VAL was lowered to 2 (the second lowest level on a 1-4 scale). White gas-and-steam emissions rose 25-200 m above the summit crater.
During May white gas-and-steam emissions generally rose 50-250 m above the summit, though it was often cloudy, which prevented clear views; on 21 May gas-and-steam emissions rose 50-400 m high. Nighttime N summit crater incandescence rose 10-25 m above the lava dome, and less intense incandescence was noted above Main Crater, which reached about 10 m above the dome. Sounds of falling rocks at Main Crater were heard on 15 May and the seismic network recorded 32 rockfall events in the crater on 17 May. Avalanches traveled as far as 1.5 km down the SW and S flanks, accompanied by rumbling sounds on 18 May. Incandescent material descending the flanks was captured in a webcam image at 2025 on 19 May (figure 63) and on 29 May; summit crater incandescence was observed in webcam images at 2332 on 26 May and at 2304 on 29 May. On 19 May the VAL was again raised to 3.
Occasional Main Crater incandescence was reported during June, as well as incandescent material on the flanks. White gas-and-steam emissions rose 10-200 m above the summit crater. Ash plumes rose to 2.1 km altitude and drifted SE and E during 2-4 June, according to the Darwin VAAC. Material on the flanks of Main Crater were observed at 2225 on 7 June, at 2051 on 9 June, at 0007 on 17 June, and at 0440 on 18 June. Webcam images taken on 21, 25, and 27 June showed incandescence at Main Crater and from material on the flanks.
MIROVA (Middle InfraRed Observation of Volcanic Activity) analysis of MODIS satellite data showed strong thermal activity during mid-February through March and mid-May through June, which represented incandescent avalanches and lava flows (figure 64). During April through mid-May the power of the anomalies decreased but frequent anomalies were still detected. Brief gaps in activity occurred during late March through early April and during mid-June. Infrared satellite images showed strong lava flows mainly affecting the SW and S flanks, accompanied by gas-and-steam emissions (figure 65). According to data recorded by the MODVOLC thermal algorithm, there were a total of 79 thermal hotspots detected: 28 during February, 24 during March, one during April, five during May, and 21 during June.
Geologic Background. Karangetang (Api Siau) volcano lies at the northern end of the island of Siau, about 125 km NNE of the NE-most point of Sulawesi. The stratovolcano contains five summit craters along a N-S line. It is one of Indonesia's most active volcanoes, with more than 40 eruptions recorded since 1675 and many additional small eruptions that were not documented (Neumann van Padang, 1951). Twentieth-century eruptions have included frequent explosive activity sometimes accompanied by pyroclastic flows and lahars. Lava dome growth has occurred in the summit craters; collapse of lava flow fronts have produced pyroclastic flows.
Information Contacts: Pusat Vulkanologi dan Mitigasi Bencana Geologi (PVMBG, also known as Indonesian Center for Volcanology and Geological Hazard Mitigation, CVGHM), Jalan Diponegoro 57, Bandung 40122, Indonesia (URL: http://www.vsi.esdm.go.id/); MAGMA Indonesia, Kementerian Energi dan Sumber Daya Mineral (URL: https://magma.esdm.go.id/v1); Badan Nasional Penanggulangan Bencana (BNPB), National Disaster Management Agency, Graha BNPB - Jl. Scout Kav.38, East Jakarta 13120, Indonesia (URL: http://www.bnpb.go.id/); Darwin Volcanic Ash Advisory Centre (VAAC), Bureau of Meteorology, Northern Territory Regional Office, PO Box 40050, Casuarina, NT 0811, Australia (URL: http://www.bom.gov.au/info/vaac/); MIROVA (Middle InfraRed Observation of Volcanic Activity), a collaborative project between the Universities of Turin and Florence (Italy) supported by the Centre for Volcanic Risk of the Italian Civil Protection Department (URL: http://www.mirovaweb.it/); Hawai'i Institute of Geophysics and Planetology (HIGP) - MODVOLC Thermal Alerts System, School of Ocean and Earth Science and Technology (SOEST), Univ. of Hawai'i, 2525 Correa Road, Honolulu, HI 96822, USA (URL: http://modis.higp.hawaii.edu/); Copernicus Browser, Copernicus Data Space Ecosystem, European Space Agency (URL: https://dataspace.copernicus.eu/browser/); IDN Times, Jl. Jend. Gatot Subroto Kav. 27 3rd Floor Kuningan, Jakarta, Indonesia 12950, Status of Karangetang Volcano in Sitaro Islands Increases (URL: https://sulsel.idntimes.com/news/indonesia/savi/status-gunung-api-karangetang-di-kepulauan-sitaro-meningkat?page=all).
Ahyi (United States) — July 2023 Cite this Report
Ahyi
United States
20.42°N, 145.03°E; summit elev. -75 m
All times are local (unless otherwise noted)
Intermittent hydroacoustic signals and discolored plumes during November 2022-June 2023
Ahyi seamount is a large, conical submarine volcano that rises to within 75 m of the ocean surface about 18 km SE of the island of Farallon de Pajaros in the Northern Marianas. The remote location of the seamount has made eruptions difficult to document, but seismic stations installed in the region confirmed an eruption in the vicinity in 2001. No new activity was detected until April-May 2014 when an eruption was detected by NOAA (National Oceanic and Atmospheric Administration) divers, hydroacoustic sensors, and seismic stations (BGVN 42:04). New activity was first detected on 15 November by hydroacoustic sensors that were consistent with submarine volcanic activity. This report covers activity during November 2022 through June 2023 based on daily and weekly reports from the US Geological Survey.
Starting in mid-October, hydroacoustic sensors at Wake Island (2.2 km E) recorded signals consistent with submarine volcanic activity, according to a report from the USGS issued on 15 November 2022. A combined analysis of the hydroacoustic signals and seismic stations located at Guam and Chichijima Island, Japan, suggested that the source of this activity was at or near the Ahyi seamount. After a re-analysis of a satellite image of the area that was captured on 6 November, USGS confirmed that there was no evidence of discoloration at the ocean surface. Few hydroacoustic and seismic signals continued through November, including on 18 November, which USGS suggested signified a decline or pause in unrest. A VONA (Volcano Observatory Notice for Aviation) reported that a discolored water plume was persistently visible in satellite data starting on 18 November (figure 6). Though clouds often obscured clear views of the volcano, another discolored water plume was captured in a satellite image on 26 November. The Aviation Color Code (ACC) was raised to Yellow (the second lowest level on a four-color scale) and the Volcano Alert Level (VAL) was raised to Advisory (the second lowest level on a four-level scale) on 29 November.
During December, occasional detections were recorded on the Wake Island hydrophone sensors and discolored water over the seamount remained visible. During 2-7, 10-12, and 16-31 December possible explosion signals were detected. A small area of discolored water was observed in high-resolution Sentinel-2 satellite images during 1-6 December (figure 7). High-resolution satellite images recorded discolored water plumes on 13 December that originated from the summit region; no observations indicated that activity breached the ocean surface. A possible underwater plume was visible in satellite images on 18 December, and during 19-20 December a definite but diffuse underwater plume located SSE from the main vent was reported. An underwater plume was visible in a satellite image taken on 26 December (figure 7).
Hydrophone sensors continued to detect signals consistent with possible explosions during 1-8 January 2023. USGS reported that the number of detections decreased during 4-5 January. The hydrophone sensors experienced a data outage that started at 0118 on 8 January and continued through 10 January, though according to USGS, possible explosions were recorded prior to the data outage and likely continued during the outage. A discolored water plume originating from the summit region was detected in a partly cloudy satellite image on 8 January. On 11-12 and 15-17 January possible explosion signals were recorded again. One small signal was detected during 22-23 January and several signals were recorded on 25 and 31 January. During 27-31 January a plume of discolored water was observed above the seamount in satellite imagery (figure 8).
Low levels of activity continued during February and March, based on data from pressure sensors on Wake Island. During 1 and 4-6 February activity was reported, and a submarine plume was observed on 4 February (figure 8). Possible explosion signals were detected during 7-8, 10, 13-14, and 24 February. During 1-2 and 3-5 March a plume of discolored water was observed in satellite imagery (figure 8). Almost continuous hydroacoustic signals were detected in remote pressure sensor data on Wake Island 2,270 km E from the volcano during 7-13 March. During 12-13 March water discoloration around the seamount was observed in satellite imagery, despite cloudy weather. By 14 March discolored water extended about 35 km, but no direction was noted. USGS reported that the continuous hydroacoustic signals detected during 13-14 March stopped abruptly on 14 March and no new detections were observed. Three 30 second hydroacoustic detections were reported during 17-19 March, but no activity was visible due to cloudy weather. A data outage was reported during 21-22 March, making pressure sensor data unavailable; a discolored water plume was, however, visible in satellite data. A possible underwater explosion signal was detected by pressure sensors at Wake Island on 26, 29, and 31 March, though the cause and origin of these events were unclear.
Similar low activity continued during April, May, and June. Several signals were detected during 1-3 April in pressure sensors at Wake Island. USGS suggested that these may be related to underwater explosions or earthquakes at the volcano, but no underwater plumes were visible in clear satellite images. The pressure sensors had data outages during 12-13 April and no data were recorded; no underwater plumes were visible in satellite images, although cloudy weather obscured most clear views. Eruptive activity was reported starting at 2210 on 21 May. On 22 May a discolored water plume that extended 4 km was visible in satellite images, though no direction was recorded. During 23-24 May some signals were detected by the underwater pressure sensors. Possible hydroacoustic signals were detected during 2-3 and 6-8 June. Multiple hydroacoustic signals were detected during 9-11 and 16-17 June, although no activity was visible in satellite images. One hydroacoustic signal was detected during 23-24 June, but there was some uncertainty about its association with volcanic activity. A single possible hydroacoustic signal was detected during 30 June to 1 July.
Geologic Background. Ahyi seamount is a large conical submarine volcano that rises to within 75 m of the ocean surface ~18 km SE of the island of Farallon de Pajaros in the northern Marianas. Water discoloration has been observed there, and in 1979 the crew of a fishing boat felt shocks over the summit area, followed by upwelling of sulfur-bearing water. On 24-25 April 2001 an explosive eruption was detected seismically by a station on Rangiroa Atoll, Tuamotu Archipelago. The event was well constrained (+/- 15 km) at a location near the southern base of Ahyi. An eruption in April-May 2014 was detected by NOAA divers, hydroacoustic sensors, and seismic stations.
Information Contacts: US Geological Survey, Volcano Hazards Program (USGS-VHP), 12201 Sunrise Valley Drive, Reston, VA, USA, https://volcanoes.usgs.gov/index.html; Copernicus Browser, Copernicus Data Space Ecosystem, European Space Agency (URL: https://dataspace.copernicus.eu/browser/).
Kadovar (Papua New Guinea) — June 2023 Cite this Report
Kadovar
Papua New Guinea
3.608°S, 144.588°E; summit elev. 365 m
All times are local (unless otherwise noted)
An ash plume and weak thermal anomaly during May 2023
Kadovar is a 2-km-wide island that is the emergent summit of a Bismarck Sea stratovolcano. It lies off the coast of New Guinea, about 25 km N of the mouth of the Sepik River. Prior to an eruption that began in 2018, a lava dome formed the high point of the volcano, filling an arcuate landslide scarp open to the S. Submarine debris-avalanche deposits occur to the S of the island. The current eruption began in January 2018 and has comprised lava effusion from vents at the summit and at the E coast; more recent activity has consisted of ash plumes, weak thermal activity, and gas-and-steam plumes (BGVN 48:02). This report covers activity during February through May 2023 using information from the Darwin Volcanic Ash Advisory Center (VAAC) and satellite data.
Activity during the reporting period was relatively low and mainly consisted of white gas-and-steam plumes that were visible in natural color satellite images on clear weather days (figure 67). According to a Darwin VAAC report, at 2040 on 6 May an ash plume rose to 4.6 km altitude and drifted W; by 2300 the plume had dissipated. MODIS satellite instruments using the MODVOLC thermal algorithm detected a single thermal hotspot on the SE side of the island on 7 May. Weak thermal activity was also detected in a satellite image on the E side of the island on 14 May, accompanied by a white gas-and-steam plume that drifted SE (figure 68).
Geologic Background. The 2-km-wide island of Kadovar is the emergent summit of a Bismarck Sea stratovolcano of Holocene age. It is part of the Schouten Islands, and lies off the coast of New Guinea, about 25 km N of the mouth of the Sepik River. Prior to an eruption that began in 2018, a lava dome formed the high point of the andesitic volcano, filling an arcuate landslide scarp open to the south; submarine debris-avalanche deposits occur in that direction. Thick lava flows with columnar jointing forms low cliffs along the coast. The youthful island lacks fringing or offshore reefs. A period of heightened thermal phenomena took place in 1976. An eruption began in January 2018 that included lava effusion from vents at the summit and at the E coast.
Information Contacts: Darwin Volcanic Ash Advisory Centre (VAAC), Bureau of Meteorology, Northern Territory Regional Office, PO Box 40050, Casuarina, NT 0811, Australia (URL: http://www.bom.gov.au/info/vaac/); Hawai'i Institute of Geophysics and Planetology (HIGP) - MODVOLC Thermal Alerts System, School of Ocean and Earth Science and Technology (SOEST), Univ. of Hawai'i, 2525 Correa Road, Honolulu, HI 96822, USA (URL: http://modis.higp.hawaii.edu/); Copernicus Browser, Copernicus Data Space Ecosystem, European Space Agency (URL: https://dataspace.copernicus.eu/browser/).
San Miguel (El Salvador) — June 2023 Cite this Report
San Miguel
El Salvador
13.434°N, 88.269°W; summit elev. 2130 m
All times are local (unless otherwise noted)
Small gas-and-ash explosions during March and May 2023
San Miguel in El Salvador is a broad, deep crater complex that has been frequently modified by eruptions recorded since the early 16th century and consists of the summit known locally as Chaparrastique. Flank eruptions have produced lava flows that extended to the N, NE, and SE during the 17-19th centuries. The most recent activity has consisted of minor ash eruptions from the summit crater. The current eruption period began in November 2022 and has been characterized by frequent phreatic explosions, gas-and-ash emissions, and sulfur dioxide plumes (BGVN 47:12). This report describes small gas-and-ash explosions during December 2022 through May 2023 based on special reports from the Ministero de Medio Ambiente y Recursos Naturales (MARN).
Activity has been relatively low since the last recorded explosions on 29 November 2022. Seismicity recorded by the San Miguel Volcano Station (VSM) located on the N flank at 1.7 km elevation had decreased by 7 December. Sulfur dioxide gas measurements taken with DOAS (Differential Optical Absorption Spectroscopy) mobile equipment were below typical previously recorded values: 300 tons per day (t/d). During December, small explosions were recorded by the seismic network and manifested as gas-and-steam emissions.
Gas-and-ash explosions in the crater occurred during January 2023, which were recorded by the seismic network. Sulfur dioxide values remained low, between 300-400 t/d through 10 March. At 0817 on 14 January a gas-and-ash emission was visible in webcam images, rising just above the crater rim. Some mornings during February, small gas-and-steam plumes were visible in the crater. On 7 March at 2252 MARN noted an increase in degassing from the central crater; gas emissions were constantly observed through the early morning hours on 8 March. During the early morning of 8 March through the afternoon on 9 March, 12 emissions were registered, some accompanied by ash. The last gas-and-ash emission was recorded at 1210 on 9 March; very fine ashfall was reported in El Tránsito (10 km S), La Morita (6 km W), and La Piedrita (3 km W). The smell of sulfur was reported in Piedra Azul (5 km SW). On 16 March MARN reported that gas-and-steam emissions decreased.
Low degassing and very low seismicity were reported during April; no explosions have been detected between 9 March and 27 May. The sulfur dioxide emissions remained between 350-400 t/d; during 13-20 April sulfur dioxide values fluctuated between 30-300 t/d. Activity remained low through most of May; on 23 May seismicity increased. An explosion was detected at 1647 on 27 May generated a gas-and-ash plume that rose 700 m high (figure 32); a decrease in seismicity and gas emissions followed. The DOAS station installed on the W flank recorded sulfur dioxide values that reached 400 t/d on 27 May; subsequent measurements showed a decrease to 268 t/d on 28 May and 100 t/d on 29 May.
Geologic Background. The symmetrical cone of San Miguel, one of the most active volcanoes in El Salvador, rises from near sea level to form one of the country's most prominent landmarks. A broad, deep, crater complex that has been frequently modified by eruptions recorded since the early 16th century caps the truncated unvegetated summit, also known locally as Chaparrastique. Flanks eruptions of the basaltic-andesitic volcano have produced many lava flows, including several during the 17th-19th centuries that extended to the N, NE, and SE. The SE-flank flows are the largest and form broad, sparsely vegetated lava fields crossed by highways and a railroad skirting the base of the volcano. Flank vent locations have migrated higher on the edifice during historical time, and the most recent activity has consisted of minor ash eruptions from the summit crater.
Information Contacts: Ministero de Medio Ambiente y Recursos Naturales (MARN), Km. 5½ Carretera a Nueva San Salvador, Avenida las Mercedes, San Salvador, El Salvador (URL: http://www.snet.gob.sv/ver/vulcanologia).
Semisopochnoi (United States) — June 2023 Cite this Report
Semisopochnoi
United States
51.93°N, 179.58°E; summit elev. 1221 m
All times are local (unless otherwise noted)
Occasional explosions, ash deposits, and gas-and-steam plumes during December 2022-May 2023
Semisopochnoi is located in the western Aleutians, is 20-km-wide at sea level, and contains an 8-km-wide caldera. The three-peaked Mount Young (formerly Cerberus) was constructed within the caldera during the Holocene. Each of these peaks contains a summit crater; the lava flows on the N flank appear younger than those on the S side. The current eruption period began in early February 2021 and has more recently consisted of intermittent explosions and ash emissions (BGVN 47:12). This report updates activity during December 2022 through May 2023 using daily, weekly, and special reports from the Alaska Volcano Observatory (AVO). AVO monitors the volcano using local seismic and infrasound sensors, satellite data, web cameras, and remote infrasound and lightning networks.
Activity during most of December 2022 was relatively quiet; according to AVO no eruptive or explosive activity was observed since 7 November 2022. Intermittent tremor and occasional small earthquakes were observed in geophysical data. Continuous gas-and-steam emissions were observed from the N crater of Mount Young in webcam images on clear weather days (figure 25). On 24 December, there was a slight increase in earthquake activity and several small possible explosion signals were detected in infrasound data. Eruptive activity resumed on 27 December at the N crater of Mount Young; AVO issued a Volcano Activity Notice (VAN) that reported minor ash deposits on the flanks of Mount Young that extended as far as 1 km from the vent, according to webcam images taken during 27-28 December (figure 26). No ash plumes were observed in webcam or satellite imagery, but a persistent gas-and-steam plume that might have contained some ash rose to 1.5 km altitude. As a result, AVO raised the Aviation Color Code (ACC) to Orange (the second highest level on a four-color scale) and the Volcano Alert Level (VAL) to Watch (the second highest level on a four-level scale). Possible explosions were detected during 21 December 2022 through 1 January 2023 and seismic tremor was recorded during 30-31 December.
During January 2023 eruptive activity continued at the active N crater of Mount Young. Minor ash deposits were observed on the flanks, extending about 2 km SSW, based on webcam images from 1 and 3 January. A possible explosion occurred during 1-2 January based on elevated seismicity recorded on local seismometers and an infrasound signal recorded minutes later by an array at Adak. Though no ash plumes were observed in webcam or satellite imagery, a persistent gas-and-steam plume rose to 1.5 km altitude that might have carried minor traces of ash. Ash deposits were accompanied by periods of elevated seismicity and infrasound signals from the local geophysical network, which AVO reported were likely due to weak explosive activity. Low-level explosive activity was also detected during 2-3 January, with minor gas-and-steam emissions and a new ash deposit that was visible in webcam images. Low-level explosive activity was detected in geophysical data during 4-5 January, with elevated seismicity and infrasound signals observed on local stations. Volcanic tremor was detected during 7-9 January and very weak explosive activity was detected in seismic and infrasound data on 9 January. Weak seismic and infrasound signals were recorded on 17 January, which indicated minor explosive activity, but no ash emissions were observed in clear webcam images; a gas-and-steam plume continued to rise to 1.5 km altitude. During 29-30 January, ash deposits near the summit were observed on fresh snow, according to webcam images.
The active N cone at Mount Young continued to produce a gas-and-steam plume during February, but no ash emissions or explosive events were detected. Seismicity remained elevated with faint tremor during early February. Gas-and-steam emissions from the N crater were observed in clear webcam images on 11-13 and 16 February; no explosive activity was detected in seismic, infrasound, or satellite data. Seismicity has also decreased, with no significant seismic tremor observed since 25 January. Therefore, the ACC was lowered to Yellow (the second lowest level on a four-color scale) and the VAL was lowered to Advisory (the second lowest level on a four-color scale) on 22 February.
Gas-and-steam emissions persisted during March from the N cone of Mount Young, based on clear webcam images. A few brief episodes of weak tremor were detected in seismic data, although seismicity decreased over the month. A gas-and-steam plume detected in satellite data extended 150 km on 18 March. Low-level ash emissions from the N cone at Mount Young were observed in several webcam images during 18-19 March, in addition to small explosions and volcanic tremor. The ACC was raised to Orange and the VAL increased to Watch on 19 March. A small explosion was detected in seismic and infrasound data on 21 March.
Low-level unrest continued during April, although cloudy weather often obscured views of the summit; periods of seismic tremor and local earthquakes were recorded. During 3-4 April a gas-and-steam plume was visible traveling more than 200 km overnight; no ash was evident in the plume, according to AVO. A gas-and-steam plume was observed during 4-6 April that extended 400 km but did not seem to contain ash. Small explosions were detected in seismic and infrasound data on 5 April. Occasional clear webcam images showed continuing gas-and-steam emissions rose from Mount Young, but no ash deposits were observed on the snow. On 19 April small explosions and tremor were detected in seismic and infrasound data. A period of seismic tremor was detected during 22-25 April, with possible weak explosions on 25 April. Ash deposits were visible near the crater rim, but it was unclear if these deposits were recent or due to older deposits.
Occasional small earthquakes were recorded during May, but there were no signs of explosive activity seen in geophysical data. Gas-and-steam emissions continued from the N crater of Mount Young, based on webcam images, and seismicity remained slightly elevated. A new, light ash deposit was visible during the morning of 5 May on fresh snow on the NW flank of Mount Young. During 10 May periods of volcanic tremor were observed. The ACC was lowered to Yellow and the VAL to Advisory on 17 May due to no additional evidence of activity.
Geologic Background. Semisopochnoi, the largest subaerial volcano of the western Aleutians, is 20 km wide at sea level and contains an 8-km-wide caldera. It formed as a result of collapse of a low-angle, dominantly basaltic volcano following the eruption of a large volume of dacitic pumice. The high point of the island is Anvil Peak, a double-peaked late-Pleistocene cone that forms much of the island's northern part. The three-peaked Mount Cerberus (renamed Mount Young in 2023) was constructed within the caldera during the Holocene. Each of the peaks contains a summit crater; lava flows on the N flank appear younger than those on the south side. Other post-caldera volcanoes include the symmetrical Sugarloaf Peak SSE of the caldera and Lakeshore Cone, a small cinder cone at the edge of Fenner Lake in the NE part of the caldera. Most documented eruptions have originated from Young, although Coats (1950) considered that both Sugarloaf and Lakeshore Cone could have been recently active.
Information Contacts: Alaska Volcano Observatory (AVO), a cooperative program of a) U.S. Geological Survey, 4200 University Drive, Anchorage, AK 99508-4667 USA (URL: https://avo.alaska.edu/), b) Geophysical Institute, University of Alaska, PO Box 757320, Fairbanks, AK 99775-7320, USA, and c) Alaska Division of Geological & Geophysical Surveys, 794 University Ave., Suite 200, Fairbanks, AK 99709, USA (URL: http://dggs.alaska.gov/).
Ebeko
Russia
50.686°N, 156.014°E; summit elev. 1103 m
All times are local (unless otherwise noted)
Continued explosions, ash plumes, and ashfall during October 2022-May 2023
Ebeko, located on the N end of Paramushir Island in the Kuril Islands, consists of three summit craters along a SSW-NNE line at the northern end of a complex of five volcanic cones. Eruptions date back to the late 18th century and have been characterized as small-to-moderate explosions from the summit crater, accompanied by intense fumarolic activity. The current eruption period began in June 2022 and has recently consisted of frequent explosions, ash plumes, and thermal activity (BGVN 47:10). This report covers similar activity during October 2022 through May 2023, based on information from the Kamchatka Volcanic Eruptions Response Team (KVERT) and satellite data.
Activity during October consisted of explosive activity, ash plumes, and occasional thermal anomalies. Visual data by volcanologists from Severo-Kurilsk showed explosions producing ash clouds up to 2.1-3 km altitude which drifted E, N, NE, and SE during 1-8, 10, 16, and 18 October. KVERT issued several Volcano Observatory Notices for Aviation (VONA) on 7, 13-15, and 27 October 2022, stating that explosions generated ash plumes that rose to 2.3-4 km altitude and drifted 5 km E, NE, and SE. Ashfall was reported in Severo-Kurilsk (Paramushir Island, about 7 km E) on 7 and 13 October. Satellite data showed a thermal anomaly over the volcano on 15-16 October. Visual data showed ash plumes rising to 2.5-3.6 km altitude on 22, 25-29, and 31 October and moving NE due to constant explosions.
Similar activity continued during November, with explosions, ash plumes, and ashfall occurring. KVERT issued VONAs on 1-2, 4, 6-7, 9, 13, and 16 November that reported explosions and resulting ash plumes that rose to 1.7-3.6 km altitude and drifted 3-5 km SE, ESE, E, and NE. On 1 November ash plumes extended as far as 110 km SE. On 5, 8, 12, and 24-25 November explosions and ash plumes rose to 2-3.1 km altitude and drifted N and E. Ashfall was observed in Severo-Kurilsk on 7 and 16 November. A thermal anomaly was visible during 1-4, 16, and 20 November. Explosions during 26 November rose as high as 2.7 km altitude and drifted NE (figure 45).
Explosions and ash plumes continued to occur in December. During 1-2 and 4 December volcanologists from Severo-Kurilsk observed explosions that sent ash to 1.9-2.5 km altitude and drifted NE and SE (figure 46). VONAs were issued on 5, 9, and 16 December reporting that explosions generated ash plumes rising to 1.9 km, 2.6 km, and 2.4 km altitude and drifted 5 km SE, E, and NE, respectively. A thermal anomaly was visible in satellite imagery on 16 December. On 18 and 27-28 December explosions produced ash plumes that rose to 2.5 km altitude and drifted NE and SE. On 31 December an ash plume rose to 2 km altitude and drifted NE.
Explosions continued during January 2023, based on visual observations by volcanologists from Severo-Kurilsk. During 1-7 January explosions generated ash plumes that rose to 4 km altitude and drifted NE, E, W, and SE. According to VONAs issued by KVERT on 2, 4, 10, and 23 January, explosions produced ash plumes that rose to 2-4 km altitude and drifted 5 km N, NE, E, and ENE; the ash plume that rose to 4 km altitude occurred on 10 January (figure 47). Satellite data showed a thermal anomaly during 3-4, 10, 13, 16, 21, 22, and 31 January. KVERT reported that an ash cloud on 4 January moved 12 km NE. On 6 and 9-11 January explosions sent ash plumes to 4.5 km altitude and drifted W and ESE. On 13 January an ash plume rose to 3 km altitude and drifted SE. During 20-24 January ash plumes from explosions rose to 3.7 km altitude and drifted SE, N, and NE. On 21 January the ash plume drifted as far as 40 km NE. During 28-29 and 31 January and 1 February ash plumes rose to 4 km altitude and drifted NE.
During February, explosions, ash plumes, and ashfall were reported. During 1, 4-5 and 7-8 February explosions generated ash plumes that rose to 4.5 km altitude and drifted E and NE; ashfall was observed on 5 and 8 February. On 6 February an explosion produced an ash plume that rose to 3 km altitude and drifted 7 km E, causing ashfall in Severo-Kurilsk. A thermal anomaly was visible in satellite data on 8, 9, 13, and 21 February. Explosions on 9 and 12-13 February produced ash plumes that rose to 4 km altitude and drifted E and NE; the ash cloud on 12 February extended as far as 45 km E. On 22 February explosions sent ash to 3 km altitude that drifted E. During 24 and 26-27 February ash plumes rose to 4 km altitude and drifted E. On 28 February an explosion sent ash to 2.5-3 km altitude and drifted 5 km E; ashfall was observed in Severo-Kurilsk.
Activity continued during March; visual observations showed that explosions generated ash plumes that rose to 3.6 km altitude on 3, 5-7, and 9-12 March and drifted E, NE, and NW. Thermal anomalies were visible on 10, 13, and 29-30 March in satellite imagery. On 18, 21-23, 26, and 29-30 March explosions produced ash plumes that rose to 2.8 km altitude and drifted NE and E; the ash plumes during 22-23 March extended up to 76 km E. A VONA issued on 21 March reported an explosion that produced an ash plume that rose to 2.8 km altitude and drifted 5 km E. Another VONA issued on 23 March reported that satellite data showed an ash plume rising to 3 km altitude and drifted 14 km E.
Explosions during April continued to generate ash plumes. On 1 and 4 April an ash plume rose to 2.8-3.5 km altitude and drifted SE and NE. A thermal anomaly was visible in satellite imagery during 1-6 April. Satellite data showed ash plumes and clouds rising to 2-3 km altitude and drifting up to 12 km SW and E on 3 and 6 April (figure 48). KVERT issued VONAs on 3, 5, 14, 16 April describing explosions that produced ash plumes rising to 3 km, 3.5 km, 3.5 km, and 3 km altitude and drifting 5 km S, 5 km NE and SE, 72 km NNE, and 5 km NE, respectively. According to satellite data, the resulting ash cloud from the explosion on 14 April was 25 x 7 km in size and drifted 72-104 km NNE during 14-15 April. According to visual data by volcanologists from Severo-Kurilsk explosions sent ash up to 3.5 km altitude that drifted NE and E during 15-16, 22, 25-26, and 29 April.
The explosive eruption continued during May. Explosions during 3-4, 6-7, and 9-10 May generated ash plumes that rose to 4 km altitude and drifted SW and E. Satellite data showed a thermal anomaly on 3, 9, 13-14, and 24 May. During 12-16, 23-25, and 27-28 May ash plumes rose to 3.5 km altitude and drifted in different directions due to explosions. Two VONA notices were issued on 16 and 25 May, describing explosions that generated ash plumes rising to 3 km and 3.5 km altitude, respectively and extending 5 km E. The ash cloud on 25 May drifted 75 km SE.
Thermal activity in the summit crater, occasionally accompanied by ash plumes and ash deposits on the SE and E flanks due to frequent explosions, were visible in infrared and true color satellite images (figure 49).
Geologic Background. The flat-topped summit of the central cone of Ebeko volcano, one of the most active in the Kuril Islands, occupies the northern end of Paramushir Island. Three summit craters located along a SSW-NNE line form Ebeko volcano proper, at the northern end of a complex of five volcanic cones. Blocky lava flows extend west from Ebeko and SE from the neighboring Nezametnyi cone. The eastern part of the southern crater contains strong solfataras and a large boiling spring. The central crater is filled by a lake about 20 m deep whose shores are lined with steaming solfataras; the northern crater lies across a narrow, low barrier from the central crater and contains a small, cold crescentic lake. Historical activity, recorded since the late-18th century, has been restricted to small-to-moderate explosive eruptions from the summit craters. Intense fumarolic activity occurs in the summit craters, on the outer flanks of the cone, and in lateral explosion craters.
Information Contacts: Kamchatka Volcanic Eruptions Response Team (KVERT), Far Eastern Branch, Russian Academy of Sciences, 9 Piip Blvd., Petropavlovsk-Kamchatsky, 683006, Russia (URL: http://www.kscnet.ru/ivs/kvert/); MIROVA (Middle InfraRed Observation of Volcanic Activity), a collaborative project between the Universities of Turin and Florence (Italy) supported by the Centre for Volcanic Risk of the Italian Civil Protection Department (URL: http://www.mirovaweb.it/); Copernicus Browser, Copernicus Data Space Ecosystem, European Space Agency (URL: https://dataspace.copernicus.eu/browser/).
Home Reef
Tonga
18.992°S, 174.775°W; summit elev. -10 m
All times are local (unless otherwise noted)
Discolored plumes continued during November 2022-April 2023
Home Reef is a submarine volcano located in the central Tonga islands between Lateiki (Metis Shoal) and Late Island. The first recorded eruption occurred in the mid-19th century, when an ephemeral island formed. An eruption in 1984 produced a 12-km-high eruption plume, a large volume of floating pumice, and an ephemeral island 500 x 1,500 m wide, with cliffs 30-50 m high that enclosed a water-filled crater. Another island-forming eruption in 2006 produced widespread pumice rafts that drifted as far as Australia; by 2008 the island had eroded below sea level. The previous eruption occurred during October 2022 and was characterized by a new island-forming eruption, lava effusion, ash plumes, discolored water, and gas-and-steam plumes (BGVN 47:11). This report covers discolored water plumes during November 2022 through April 2023 using satellite data.
Discolored plumes continued during the reporting period and were observed in true color satellite images on clear weather days. Satellite images show light green-yellow discolored water extending W on 8 and 28 November 2022 (figure 31), and SW on 18 November. Light green-yellow plumes extended W on 3 December, S on 13 December, SW on 18 December, and W and S on 23 December (figure 31). On 12 January 2023 discolored green-yellow plumes extended to the NE, E, SE, and N. The plume moved SE on 17 January and NW on 22 January. Faint discolored water in February was visible moving NE on 1 February. A discolored plume extended NW on 8 and 28 March and NW on 13 March (figure 31). During April, clear weather showed green-blue discolored plumes moving S on 2 April, W on 7 April, and NE and S on 12 April. A strong green-yellow discolored plume extended E and NE on 22 April for several kilometers (figure 31).
Geologic Background. Home Reef, a submarine volcano midway between Metis Shoal and Late Island in the central Tonga islands, was first reported active in the mid-19th century, when an ephemeral island formed. An eruption in 1984 produced a 12-km-high eruption plume, large amounts of floating pumice, and an ephemeral 500 x 1,500 m island, with cliffs 30-50 m high that enclosed a water-filled crater. In 2006 an island-forming eruption produced widespread dacitic pumice rafts that drifted as far as Australia. Another island was built during a September-October 2022 eruption.
Information Contacts: Copernicus Browser, Copernicus Data Space Ecosystem, European Space Agency (URL: https://dataspace.copernicus.eu/browser/).
Ambae
Vanuatu
15.389°S, 167.835°E; summit elev. 1496 m
All times are local (unless otherwise noted)
New lava flow, ash plumes, and sulfur dioxide plumes during February-May 2023
Ambae, also known as Aoba, is a large basaltic shield volcano in Vanuatu. A broad pyroclastic cone containing three crater lakes (Manaro Ngoru, Voui, and Manaro Lakua) is located at the summit within the youngest of at least two nested calderas. Periodic phreatic and pyroclastic explosions have been reported since the 16th century. A large eruption more than 400 years ago resulted in a volcanic cone within the summit crater that is now filled by Lake Voui; the similarly sized Lake Manaro fills the western third of the caldera. The previous eruption ended in August 2022 that was characterized by gas-and-steam and ash emissions and explosions of wet tephra (BGVN 47:10). This report covers a new eruption during February through May 2023 that consisted of a new lava flow, ash plumes, and sulfur dioxide emissions, using information from the Vanuatu Meteorology and Geo-Hazards Department (VMGD) and satellite data.
During the reporting period, the Alert Level remained at a 2 (on a scale of 0-5), which has been in place since December 2021. Activity during October 2022 through March 2023 remained relatively low and mostly consisted of gas-and-steam emissions in Lake Voui. VMGD reported that at 1300 on 15 November a satellite image captured a strong amount of sulfur dioxide rising above the volcano (figure 99), and that seismicity slightly increased. The southern and northern part of the island reported a strong sulfur dioxide smell and heard explosions. On 20 February 2023 a gas-and-ash plume rose 1.3 km above the summit and drifted SSW, according to a webcam image (figure 100). Gas-and-steam and possibly ash emissions continued on 23 February and volcanic earthquakes were recorded by the seismic network.
During April, volcanic earthquakes and gas-and-steam and ash emissions were reported from the cone in Lake Voui. VMGD reported that activity increased during 5-7 April; high gas-and-steam and ash plumes were visible, accompanied by nighttime incandescence. According to a Wellington VAAC report, a low-level ash plume rose as high as 2.5 km above the summit and drifted W and SW on 5 April, based on satellite imagery. Reports in Saratamata stated that a dark ash plume drifted to the WSW, but no loud explosion was heard. Webcam images from 2100 showed incandescence above the crater and reflected in the clouds. According to an aerial survey, field observations, and satellite data, water was no longer present in the lake. A lava flow was reported effusing from the vent and traveling N into the dry Lake Voui, which lasted three days. The next morning at 0745 on 6 April a gas-and-steam and ash plume rose 5.4 km above the summit and drifted ESE, based on information from VMGD (figure 101). The Wellington VAAC also reported that light ashfall was observed on the island. Intermittent gas-and-steam and ash emissions were visible on 7 April, some of which rose to an estimated 3 km above the summit and drifted E. Webcam images during 0107-0730 on 7 April showed continuing ash emissions. A gas-and-steam and ash plume rose 695 m above the summit crater at 0730 on 19 April and drifted ESE, based on a webcam image (figure 102).
According to visual and infrared satellite data, water was visible in Lake Voui as late as 24 March 2023 (figure 103). The vent in the caldera showed a gas-and-steam plume drifted SE. On 3 April thermal activity was first detected, accompanied by a gas-and-ash plume that drifted W (figure 103). The lava flow moved N within the dry lake and was shown cooling by 8 April. By 23 April much of the water in the lake had returned. Occasional sulfur dioxide plumes were detected by the TROPOMI instrument on the Sentinel-5P satellite that exceeded 2 Dobson Units (DU) and drifted in different directions (figure 104).
Geologic Background. The island of Ambae, also known as Aoba, is a massive 2,500 km3 basaltic shield that is the most voluminous volcano of the New Hebrides archipelago. A pronounced NE-SW-trending rift zone with numerous scoria cones gives the 16 x 38 km island an elongated form. A broad pyroclastic cone containing three crater lakes (Manaro Ngoru, Voui, and Manaro Lakua) is located at the summit within the youngest of at least two nested calderas, the largest of which is 6 km in diameter. That large central edifice is also called Manaro Voui or Lombenben volcano. Post-caldera explosive eruptions formed the summit craters about 360 years ago. A tuff cone was constructed within Lake Voui (or Vui) about 60 years later. The latest known flank eruption, about 300 years ago, destroyed the population of the Nduindui area near the western coast.
Information Contacts: Geo-Hazards Division, Vanuatu Meteorology and Geo-Hazards Department (VMGD), Ministry of Climate Change Adaptation, Meteorology, Geo-Hazards, Energy, Environment and Disaster Management, Private Mail Bag 9054, Lini Highway, Port Vila, Vanuatu (URL: http://www.vmgd.gov.vu/, https://www.facebook.com/VanuatuGeohazardsObservatory/); Wellington Volcanic Ash Advisory Centre (VAAC), Meteorological Service of New Zealand Ltd (MetService), PO Box 722, Wellington, New Zealand (URL: http://www.metservice.com/vaac/, http://www.ssd.noaa.gov/VAAC/OTH/NZ/messages.html); MIROVA (Middle InfraRed Observation of Volcanic Activity), a collaborative project between the Universities of Turin and Florence (Italy) supported by the Centre for Volcanic Risk of the Italian Civil Protection Department (URL: http://www.mirovaweb.it/); Global Sulfur Dioxide Monitoring Page, Atmospheric Chemistry and Dynamics Laboratory, NASA Goddard Space Flight Center (NASA/GSFC), 8800 Greenbelt Road, Goddard, Maryland, USA (URL: https://so2.gsfc.nasa.gov/); Copernicus Browser, Copernicus Data Space Ecosystem, European Space Agency (URL: https://dataspace.copernicus.eu/browser/).
Search Bulletin Archive by Publication Date
Select a month and year from the drop-downs and click "Show Issue" to have that issue displayed in this tab.
The default month and year is the latest issue available.
Bulletin of the Global Volcanism Network - Volume 38, Number 03 (March 2013)
Managing Editor: Richard Wunderman
Azufral (Colombia)
Expanded monitoring efforts and explosive hydrothermal event in July 2009
Diables, Morne aux (Dominica)
Earthquake swarm began in mid-2009
Fujisan (Japan)
2000-2001 epicenter migration; deep magma; 2011 M 6 aftershock at volcano
Galeras (Colombia)
Ash emissions and elevated seismicity during May 2012-March 2013
Kanaga (United States)
18 February 2012 eruption; new fissure
Lokon-Empung (Indonesia)
Eruptions continue into early 2013
Nikko-Shiranesan (Japan)
Felt earthquakes nearby during April-September 2011
Niuatahi (Tonga)
New research data collected from submarine volcano
Tungurahua (Ecuador)
Return of explosions and earthquakes through at least October 2010
Azufral
Colombia
1.08°N, 77.68°W; summit elev. 4070 m
All times are local (unless otherwise noted)
Expanded monitoring efforts and explosive hydrothermal event in July 2009
Previously reported activity from Azufral included seismic swarms in 1971 (CSLP 43-71) and fluctuating conditions within the crater lake, Laguna Verde during July-August 1990 (BGVN 15:08) (figure 1). In this report, we highlight explosive hydrothermal activity that occurred during July-August 2009. We also provide observations of Azufral's hydrothermal and fumarolic activity and review monitoring efforts that expanded since 2005.
Fumarolic activity within Azufral's largest crater had long been observed by Colombia's earliest inhabitants and investigators including Alexander von Humboldt in the 1800s (Yudilevich Levy, 2004). In one of his many journals, Diario VII "Viaje de Pasto a Quito," this naturalist noted the rugged morphology of the edifice, describing it as a volcano that had broken apart; similar in appearance to Sotará, a volcano he had already visited. At the time of his visit in December 1801, there were significant deposits of sulfur and strong gas emissions within the crater, particularly around the largest crater lake (he noted that there were several craters in the complex, the largest now known as Laguna Verde).
"Una de estas bocas es una charca hirviente de azufre, parecida al de Puracé, de furioso estrépito. Los vapores de azufre se escapan, además, de la tierra húmeda arcillosa y arrojan el lodo a lo alto, como si fuesen cañones." (Yudilevich Levy, 2004, p. 74).
With the assistance of Rüdiger Escobar-Wolf (Michigan Technological University), we translated the above passage as follows. Note that the works of von Humboldt were originally written in German.
"One of the depressions [of Azufral] contains a pond boiling and churning with sulfur, similar in appearance and furiously loud noises to the one at Puracé volcano. Sulfur vapors were also escaping from the clayey, humid earth, throwing the mud high in the air as if fired from cannons."
Local inhabitants shared their observations with von Humboldt, mentioning ash plumes (termed "polvo" in the diary), mud explosions, boiling water, and flames (sometimes starting brush fires) (Yudilevich Levy, 2004).
Explosive volcanic activity at Azufral had not been observed recently (a hydrothermal event was observed in July 2009, see the subsection below), but the geologic record has preserved evidence of large-scale eruptions dating from 2,095-950 BC (Siebert and others, 2010). In the January 2009 Technical Bulletin, the Servicio Geológico Colombiano (SGC) described Azufral as one of the most explosive volcanoes in Colombia due to its extensive pyroclastic and surge deposits.
Research by Hall and Mothes (2008) assessed Holocene volcanism and its impact on pre-Columbian indigenous cultures within the Interandean Valley. They synthesized the region's pyroclastic deposits (including source locations and event magnitudes) and highlighted the wide distribution of Azufral's deposits (figure 2). They argued that despite the extensive lahar and debris avalanche deposits within the valley, "the greatest impact upon mankind was probably not these short-lived violent events, but rather the burying of settlements and agricultural fields by ash fallout, the effect of which may have lasted hundreds of years. Ash fall layers are observed in pre-Columbian cultural horizons in the soil profile, occurring in the Interandean Valley, the lower flanks of the Andes, and along Ecuador's Pacific coast..."
Monitoring efforts 2005-2013. The base of operations for monitoring Azufral has been located in Pasto (~48 km ENE of Azufral) since ~2005. Over time, the Servicio Geológico Colombiano (SGC), formerly known as Instituto Colombiano de Geología y Minería (INGEOMINAS), expanded monitoring capabilities at Azufral through instrumentation and field investigations (table 1, figure 3).
Table 1. Azufral's monitoring network in March 2013 included EDM, seismometers, tiltmeters, a video camera, and a wind station. Figure 3, below, shows a map of various sites. Courtesy of SGC.
| Station Description |
Instrument Location(s) |
| Electronic Distance Meter (EDM) survey stations |
12 reflectors; 4 base stations (see figure 14) |
| Seismic stations (telemetered) |
Chaitán, ~4 km ENE (broadband); Laguna, 0.5 km SW (broadband); La Roca, 1.2 km E (short period) |
| Electronic tilt station (telemetered) |
Chaitán, ~4 km ENE; La Roca, 1.2 km E |
| Web camera (telemetered) |
Laguna, 0.5 km SW |
| Weather station (wind and precipitation) |
La Roca, 1.2 km E |
Aerial observations had been conducted since 2005 focusing primarily on the lake's characteristics such as color, water level, and shoreline morphology. Overflights with a thermal camera were conducted during 2007-2011; during that time period, the maximum surface temperatures ranged from 22.5-38°C.
Changes in the lake level were observed based on repeat aerial photos; in particular, between 5 December 2006 and 23 August 2009, Laguna Verde had a noticeably narrower shoreline, suggesting that the lake volume had increased.
Field investigations established baselines for lake chemistry, diffuse radon gas emissions, SO2 flux within the crater, thermal emissions from fumarolic sites, EDM measurements, and the geochemistry of four local hot springs (figure 4).
During 2007-2008, SGC expanded the monitoring network by installing telemetered seismic stations and tiltmeters (figure 5). In the second quarter of 2008, the first monitoring stations were installed at Azufral; this timing coincided with monitoring developments at the neighboring volcanoes Doña Juana and Cumbal (volcanoes also managed by the Pasto Volcanological and Seismological Observatory, OVSP).
Seismicity 2009-2011. When Azufral's seismic stations came online in 2009, SGC began characterizing seismicity as volcano-tectonic (VT), long period (LPS), hybrid (HYB), tremor (TRE), tornillo (TOR), and unclassified (VOL). The VOL category, sometimes noted as "VC" in their reports, includes earthquakes from the region of Azufral that do not correspond with the other classes. SGC stated that these events will be analyzed in more detail after more baseline data is collected. This category was also applied to seismic analyses of Cumbal and Doña Juana, volcanos that were instrumented around the same time.
Unclassified seismicity (VOL) dominated the records through 2011, however, as SGC established baseline data, events falling in this category generally decreased over time. Total seismicity was also decreasing. During 2010-2011, tremor (TRE) and hybrid (HYB) events became sporadic to nonexistent.
During 5-6 February 2010, a seismic swarm was detected (figure 6). During January 2010-March 2013, this was the only swarm noted in the SGC Technical Bulletins. In early February 2010, two seismic stations were operating; Chaitán and La Roca. Unlike the Chaitán station, La Roca had broadband capabilities. "Broadband, high-dynamic-range seismometers are particularly important because existing instruments always saturate for large eruptions, and because energy at long periods (>>1 s) is simply not seen on standard short-period seismometers" (McNutt, 2000).
During April 2010, the highest number of earthquakes was detected (493 events); most of those events were VOL and LPS (table 2). Seismicity also increased in September (228 events); however, they were primarily VOL earthquakes.
Table 2. Azufral's seismicity from December 2009 to December 2011. No tornillo events were detected during this time period. For most of 2009, seismic station Chaitán was not fully functional. Abbreviations explained in text; "--" indicates intervals when the category was not included in the Technical Bulletins. Courtesy of SGC.
| Month |
VT |
LPS |
HYB |
TRE |
VOL |
Total |
| Dec 2009 |
68 |
15 |
1 |
23 |
-- |
107 |
| Jan 2010 |
2 |
3 |
0 |
3 |
0 |
8 |
| Feb 2010 |
47 |
125 |
2 |
48 |
95 |
317 |
| Mar 2010 |
20 |
25 |
0 |
18 |
80 |
143 |
| Apr 2010 |
28 |
125 |
1 |
34 |
305 |
493 |
| May 2010 |
23 |
45 |
0 |
14 |
97 |
179 |
| Jun 2010 |
18 |
21 |
0 |
2 |
140 |
181 |
| Jul 2010 |
36 |
29 |
0 |
15 |
119 |
199 |
| Aug 2010 |
11 |
9 |
0 |
0 |
83 |
103 |
| Sep 2010 |
12 |
6 |
0 |
-- |
210 |
228 |
| Oct 2010 |
23 |
17 |
0 |
-- |
179 |
219 |
| Nov 2010 |
21 |
11 |
0 |
-- |
72 |
104 |
| Dec 2010 |
26 |
3 |
0 |
-- |
93 |
122 |
| Jan 2011 |
32 |
21 |
0 |
-- |
93 |
146 |
| Feb 2011 |
30 |
2 |
0 |
-- |
109 |
141 |
| Mar 2011 |
14 |
23 |
0 |
-- |
68 |
105 |
| Apr 2011 |
29 |
20 |
0 |
-- |
86 |
135 |
| May 2011 |
11 |
1 |
0 |
-- |
40 |
52 |
| Jun 2011 |
18 |
9 |
1 |
-- |
30 |
58 |
| Jul 2011 |
20 |
3 |
0 |
-- |
21 |
44 |
| Aug 2011 |
4 |
0 |
0 |
-- |
10 |
14 |
| Sep 2011 |
4 |
1 |
0 |
-- |
14 |
19 |
| Oct 2011 |
8 |
2 |
1 |
-- |
12 |
23 |
| Nov 2011 |
12 |
7 |
3 |
-- |
33 |
55 |
| Dec 2011 |
13 |
-- |
-- |
-- |
22 |
35 |
Overall 2011 seismicity averaged ~69 events per day (table 2). Earthquakes occurred more frequently earlier in the year; during January-May they averaged 116 events per month compared with 35 per month during June-December.
On 20 July 2011 at 0353, an earthquake was felt by local populations, particularly in the town of El Panamal (~5 km SW). The event was an ML 3 at 12.8 km depth (measured relative to the summit) and epicenter at 9.5 km SW. This was the only located earthquake that month; at that time, two seismic stations were operating (Chaitán and La Roca).
Seismicity in 2012-2013. In 2012, 5-45 VT earthquakes were recorded per month and 1-19 were located (table 3). At 19:41 on 4 May 2012, an earthquake was felt by local populations in Túquerres, San Roque, and Sapuyes (for town locations, see figure 3). It was an ML 3.3 with an epicenter ~12.2 km of Azufral at a depth of 8.64 km. The maximum intensity of shaking was III on the Modified Mercalli scale.
Table 3. Seismicity at Azufral from January 2012 through April 2013. Note that depths of events are measured relative to the established summit elevation (4,070 m elevation). Courtesy of SGC.
| Month |
VT |
VT Located |
VT ML |
VT Depths |
VT Epicenter |
VOL |
Total |
| Jan 2012 |
19 |
-- |
-- |
-- |
-- |
15 |
34 |
| Feb 2012 |
45 |
-- |
-- |
-- |
-- |
20 |
65 |
| Mar 2012 |
10 |
-- |
-- |
-- |
-- |
5 |
15 |
| Apr 2012 |
20 |
-- |
-- |
-- |
-- |
3 |
23 |
| May 2012 |
14 |
2 |
3.3; 1.7 |
8.6 km; 7.4 km |
12.2 km E; 6 km NW |
1 |
15 |
| Jun 2012 |
6 |
-- |
-- |
-- |
-- |
1 |
7 |
| Jul 2012 |
5 |
1 |
1.4 |
15 km |
3.4 km NE |
2 |
7 |
| Aug 2012 |
7 |
-- |
-- |
-- |
-- |
0 |
7 |
| Sep 2012 |
9 |
2 |
2.1; 2.9 |
~6 km; ~14 km |
10 km SE; 14 km E |
0 |
9 |
| Oct 2012 |
42 |
19 |
0.5-2.1 |
< 16 km |
1.5-15 km E |
8 |
50 |
| Nov 2012 |
22 |
2 |
0.6-0.7 |
< 2 km |
4 km NE; 11 km NE |
5 |
27 |
| Dec 2012 |
24 |
1 |
0.8 |
16 km |
10.4 km NE |
50 |
74 |
| Jan 2013 |
15 |
1 |
1.1 |
4.7 km |
2.5 km N |
9 |
24 |
| Feb 2013 |
15 |
6 |
0.3-1.9 |
2.5-15 km |
< 1-< 11 km |
6 |
21 |
| Mar 2013 |
16 |
2 |
< 1.3 |
5.4 km; 7.3 km |
7 km S; 3.5 km N |
0 |
16 |
| Apr 2013 |
39 |
26 |
< 2.1 |
< 11 km |
4-10 km dispersed |
15 |
54 |
During 2012, the largest number of located earthquakes occurred in October 2012. Located earthquakes peaked later in April 2013. Of the 39 VT detected, 26 of these earthquakes were located, primarily in a scattered cluster ~8 km NW of the summit (figure 7).
Field observations in 2008 and mid-2009. During geophysical campaigns carried out in 2008 by SGC (then INGEOMINAS), fumarolic activity was observed from one of its domes, Domo Pequeño, in an area lacking vegetation. That location was also known for sulfur deposits, causing the surface to appear greenish-yellow; sulfur odors could were also detected. Bubbles in Laguna Verde were also apparent, rising from deep in Laguna Verde.
Aerial photos taken on 13 April 2009 showed clear views of the pale dome rock and bright green lake. A visit on 23 June 2009, revealed a zone of cloudy water in the green lake; low-level fumarolic activity was also observed (figure 8).
Hydrothermal explosion in July 2009. SGC technicians had visited Azufral on 12 July 2009 to take water samples for analysis, but a group of scientists visiting on 18 July were surprised by a sudden change within the crater. They discovered a new deposit, 8-10 m long extending from the fumarolic region known as La Playa; the deposits were described as hot and they had extended into the lake. The SGC surmised that the activity must have occurred between the 13 and 18 July 2009. The group determined that this was an eruptive process likely of hydrothermal origin. The visiting scientists (from Fundación Ambiental Andes) reported observations including fresh-looking cracks and several slope failures which had allowed hot fluids to escape; those areas continued to steam during their visit (figure 9).
In looking for monitoring signals during 13-18 July, SGC found that seismic and tilt data lacked clear elevated activity in July 2009; there were few earthquakes and mainly minor changes detected by the tilt instruments at Chaitán). Looking in more detail, the tilt station recorded some variations during 12-23 July, particularly from the X component (radial to the crater lake) (figure 10). A total decrease of 45 µrad was recorded while the Y component (tangential to the crater lake) was relatively stable with a slight increase of ~10 µrad and temperatures were between 6.5 and 9°C.
August 2009 field investigations. On 3 August, a local observer noted unusual activity while walking along the higher peaks of Azufral; he stated that he saw "material being set on fire in the beach of Azufral and there were gases smelling like sulfur." A local landowner also explained that hot springs could be found ~6.5 km away at a site called Tutachag; these springs had persisted for several months. SGC alerted the local disaster prevention representative (Comité Regional de Prevención y Atención de Desastres de Nariño, CREPAD-N) after receiving the report of these observations; the CREPAD-N is responsible for communicating with local residents and visitors who frequent sites around Azufral.
During field investigations on 18 August, SGC staff learned from an additional local inhabitant (from the town of San Roque Alto) that, while walking the road to La Palma early in the morning of 3 August, he thought there was a fire on La Playa, possibly started by tourists. The fire was blue and red (although mostly blue) and gray smoke was rising, sometimes dense gray; he also noted sulfur odors.
After reviewing the seismicity during the first week of August 2009, SGC staff noted small events had been detected by the Chaitán station. At that time, seismic monitoring was not robust enough to provide earthquake locations, but the records determined that low pulses of spasmodic tremor had occurred in the range of 6-12 Hz and 12-18 Hz, lasting up to 4 minutes. LP events were also apparent in the record.
On 19 August, visiting scientists noted increased bubbling from more locations within Laguna Verde; primarily around the N shore of the lake. Few emissions were observed from the La Playa area; however, they noted intermittent sulfur odors while they conducted fieldwork.
SGC scientists traversed the NE shoreline with a FLIR (Forward Looking Infrared) thermal camera. The temperatures reached a maximum of 57.9°C along the N shore of La Playa (figure 11). Maximum temperatures corresponded with known locations of past hydrothermal activity.
On 19 August, SGC scientists measured SO2 emissions along a traverse with Mobile DOAS. The team followed ~50 m of the shore and calculated an average flux of 0.5 tons per day, a value considered relatively low. They noted that the wind was from the N at 2.5 m/s.
Samples of the deposits attributed to the 13-18 July event on La Playa were distinctively cemented and possibly rich in silica and alteration minerals (figure 12). The SGC scientists collected samples for lab analysis including x-ray diffraction (XRD). Two samples were analyzed at SGC laboratory in Cali where XRD determined abundant (>40%) sulfur was present; amorphous silica (opal) was sparse (3-10%) and trace quantities (
On 30 August an experiment was conducted with small fragments of this material. In a lab setting, SGC scientists demonstrated that the material was flammable and produced heat and sulfur odors that stung the eyes and nose; red and blue flames were also observed immediately when the fragments encountered an open flame (tested with a lighted match). After a few seconds of exposure to an open flame, the samples melted and immediately crumbled into an inert, brittle solid. This demonstration may explain the explosive phenomena that local inhabitants observed on 3 August 2009.
Aerial observations during August-December 2009. During 11 and 19 September, the FAC facilitated observations of Azufral. Photographs and thermal imagery revealed few changes. The highest temperatures detected were in range of 25 to 30°C. The largest region of thermal anomalies was located on the opposite shore from La Playa (figure 13), a region where dacitic domes have been known to emit steam and have sulfur deposits.
A return trip to Azufral during 7-11 December 2009 determined that some emissions were visibly rising from the dome located on the E side of Laguna Verde (figure 14). A maximum temperature measured from the dome was 85°C. SGC scientists also measured concentrations of CO2 higher than 10,000 ppm from fumarolic sites.
Emission sites were also revisited along La Playa on 9 December. Temperatures measured with a thermocouple were in the range of 65-84°C. Those temperatures were measured at locations that had elevated temperatures when last measured with a FLIR. CO2 emissions from these zones reached 3,200 ppm.
2010-2012 monitoring highlights. Routine monitoring from January 2010 to 2012 included sampling Laguna Verde at several locations as well as sampling the local hotsprings (figure 4). By October 2010, a baseline of geochemical data was developed by SGC and the four distal hot springs were evaluated and characterized as primarily mature-to-peripheral water (figure 15).
Monitoring temperatures from Laguna Verde and selected sites also continued during 2010-2012. SGC scientists frequently conducted traverses along the shore with a thermocouple and established baseline temperature data (figure 16).
During field campaigns, SCG staff noted variable emissions from fumarolic sites, clustering of bubbles within Laguna Verde, and also changes in the lake level. To aid visual monitoring, a web camera was installed within the crater of Azufral on 24 November 2012 (figure 17). The camera was positioned to include a wide view of Domo Pequeño (a regular source of steam emissions) and La Playa (the location of the hydrothermal event in July 2009).
References. Hall, M.L and Mothes, P.A., 2008. Volcanic impediments in the progressive development of pre-Columbian civilizations in the Ecuadorian Andes, Journal of Volcanology and Geothermal Research, 176, 344-355.
McNutt, S.R., 2000, Volcanic seismicity. In: Sigurdsson, H., ed., Encyclopedia of volcanoes. New York, Academic Press, p. 1,015-1,033.
Siebert, L., Simkin, T., Kimberly, P., 2010, Volcanoes of the World, 3rd edn. University of California Press, Berkeley.
Yudilevich Levy, D., 2004, Mi viaje por el camino del Inca (1801-1802): Antología, 1a. ed., Editorial Universitaria, S.A., Santiago, Chile [in Spanish].
Geologic Background. Azufral stratovolcano in southern Colombia, also known as Azufral de Túquerres, is truncated by a 2.5 x 3 km caldera containing a Holocene rhyodacitic lava-dome complex. A crescent-shaped lake, Laguna Verde, occupies the NW side of the caldera. Nearly a dozen lava domes are present, the latest of which were formed about 3600 years ago and have active fumaroles. Azufral rocks are more silicic than those of nearby Colombian volcanoes; an apron of rhyodacitic pyroclastic-flow deposits rings the volcano. The last known eruption took place about 1000 years ago.
Information Contacts: Servicio Geológico Colombiano (SGC), Observatorio Vulcanológico y Sismológico de Pasto, Pasto, Colombia (URL: http://www.SGC.gov.co/Pasto.aspx); Patricia Ponce Villarreal, Servicio Geológico Colombiano (SGC), Observatorio Vulcanológico y Sismológico de Pasto, Pasto, Colombia (URL: http://www.SGC.gov.co/Pasto.aspx); Rüdiger Escobar-Wolf, Michigan Technological University, Department of Geological and Mining Engineering and Science, Houghton, MI, USA (URL: http://www.mtu.edu/geo/).
Morne aux Diables (Dominica) — March 2013 Cite this Report
Morne aux Diables
Dominica
15.612°N, 61.43°W; summit elev. 861 m
All times are local (unless otherwise noted)
Earthquake swarm began in mid-2009
Morne aux Diables is the northermost of the nine volcanic centers on the island of Dominica (Lindsay and others, 2005) (figure 1). The complex (figures 2 and 3) is comprised of five intact andesitic crystal rich lava domes that form a central depression. Within the depression, a 'Cold Soufrière' is evident with hydrothermally altered rocks and many small bubbling pools. No historical eruptions are known, although the volcano has a youthful appearance, and activity at flank domes likely continued into the late Pleistocene and Holocene (Lindsay and others, 2005). Robert Watts, at the University of the West Indies (UWI) Seismic Research Centre, reported that the volcano remains quiet, though with noteworthy seismicity in 2009 and 2010.
Watts, and Lindsay and others (2005), reported that in 2002 SeaBeam bathymetry highlighted a double peaked lava dome (known informally as Twin Peaks) on the sea floor a few kilometers off the northern coastline of Dominica. The summit of the higher dome (at 15.671?N, 61.476?W) was 153 m below sea level. This northern coastline terminating the N end of the Morne aux Diables complex forms a linear cliff that may represent a fault.
Seismic swarm during 2009-2010. The most common area of seismicity, as noted by Watts and others (2012a and 2012b), has been in the SE sector of Dominica. In the north there were spurts in activity in 1841, 1893, 2000, and a particularly intense week-long burst of more than 500 earthquakes in 2003. Following six years of low-level activity, a nearly continuous series of earthquakes was recorded beneath the central area of Morne aux Diables beginning in June 2009. The seismic swarm continued through at least 2010 with variations in activity that are consistent with volcano-tectonic (VT) activity.
The VT series reached a peak in December 2009, with many events felt by villagers on the flanks of the volcano, but earthquake activity afterwards gradually been diminishing. Beginning in December 2010, VT earthquakes exhibited a gradual shallowing with time (a few approaching 1 km depth), indicating that they are related to a vertical re adjustment of the stresses below the volcano, most likely caused by magma movement (Watts and others, 2012b).
References. Lindsay, J.M., Smith, A.L., Roobol, M.J., and Stasiuk, M.V., 2005, Dominica in Lindsay, J.M., Robertson, R.E.A., Shepherd, J.B. and Ali, S. (eds), Volcanic Hazard Atlas of the Lesser Antilles, Seismic Research Centre, The University of the West Indies, Trinidad & Tobago, West Indies, p. 1-48.
Roobol, M.J., and Smith, A.L., 2004a. Volcanology of Saba and St. Eustatius, northern Lesser Antilles, Amsterdam: Royal Netherlands Academy of Arts and Letters, 320 p.
Roobol, M.J., and Smith, A.L., 2004b, Geologic map of Dominica, West Indies (URL: http://www.caribbeanvolcanoes.com/dominica/content/dominicamap.pdf).
Watts, R.B., Robertson, R.E., Abraham, W., Cole, P., de Roche, T., Edwards, S., Higgins, M., Johnson, M., Joseph, E.P., Latchman, J., Lynch, L., Nisha, N., Ramsingh, C., and Stewart, R.C., 2012a , Elevated seismic activity beneath the slumbering Morne aux Diables volcano, Northern Dominica and the monitoring role of the Seismic Research Center, poster presentation at the 2012 American Geophyhsical Union Fall Meeting, San Francisco, CA.
Watts, R., Robertson, R., Abraham, W., Cole, P., Corriette, D., de Roche, T., Edwards, S., Higgins, M., Issacs, N., Johnson, M., Joseph, E., Latchman, J., Lynch, L., Nisha, N., Phillip, B., Ramsingh, C., and Stewart, R., 2012b, Elevated seismic activity beneath the slumbering Morne aux Diables volcano, northern Dominica, poster on UWISRC web (URL: http://www.uwiseismic.com/Downloads/Dominica_activity_Poster_Watts.pdf).
Geologic Background. The lava dome complex of Morne aux Diables (Devils' Peak) forms the northern tip of the island of Dominica. Several nested craters and a 90-m-high, 335-m-wide lava dome are located within a larger 1.2-km-wide crater. The complex overall includes seven andesitic lava domes with a central depression where a cold soufriere is located. A chain of lava domes, two of which form a peninsula on the SW flank, form an E-W belt across the S flank. Bathymetry shows a double-peaked lava dome (known informally as Twin Peaks) off the northern coast, truncated by a 4-km-long fault-bounded cliff. No eruptions are known in historical time, although the volcano has a youthful appearance and activity at flank domes likely continued into the late-Pleistocene and Holocene. The youngest (NW) summit crater contains an active thermal area with bubbling springs. Severe earthquake swarms in 1841 and 1893 were associated with either Morne aux Diables or Morne Diablotins to the south. Shallow volcano-tectonic seismicity was detected as recently as February 2010.
Information Contacts: Robert B. Watts, The University of the West Indies (UWI) Seismic Research Centre, St. Augustine, Trinidad & Tobago, West Indies (URL: http://www.uwiseismic.com/).
Fujisan
Japan
35.361°N, 138.728°E; summit elev. 3776 m
All times are local (unless otherwise noted)
2000-2001 epicenter migration; deep magma; 2011 M 6 aftershock at volcano
Fuji remains non-eruptive. Fujita and others (2013) investigate the likelihood that Fuji may erupt due to the 2011 E Shizuoka earthquake (M 6) centered on the volcano. Our previous reports of February 2001 (BGVN 26:02) and September 2001 (BGVN 26:09) described the 2000-2001 deep low-frequency (DLF) earthquake swarm under Fuji. In the first section below, we summarize work by Ukawa (2005) and Nakashimi and others (2004) who provide further details and analysis of DLF swarm activity, and discuss midcrustal, low-frequency earthquakes (MLFs) recorded during 1998-2003. Discussion in those papers noted likely molten material at depth below the volcano.
The next section reports the stress-field and pressure changes to Fuji's magmatic system due to the 11 March 2011 Tohoko megathrust, an MW 9 earthquake, which created the tsunami that devastated parts of costal NE Honshu including the Fukushima nuclear power plant. In addition, an MW 5.9 aftershock was centered below Fuji. Fujita and others (2013) assessed the possibility that the stress-field and pressure changes could enable magma to escape to the surface. Although they concluded that preexisting faults could rupture the chamber walls, the changes were seemingly insufficient to do so, suggesting no eruption was imminent.
Background. During the early 1980s, the National Research Institute for Earth Science and Disaster Prevention (NIED) installed the Kanto-Tokai seismic network in central Japan (figure 2). Later refinements included adding stations SSN and SHJ (not shown), and in the 1990s, stations, FJN, FJY, FJS and FJH, each with three component seismometers and two component tiltmeters at the bottom of 200-m-deep boreholes. In April 1995, Mt Fuji seismic data recording began using the constellation of stations.
The Fuji DLF earthquake epicenters were located using 1987 to 2001 data from the early 1980 Kanto-Tokai seismic network and later data taken at the four Fuji stations installed in 1990 (figure 3). Nakamichi and others (2005) reexamined epicenter locations of Ukawa (2004). JMA updated safety and evacuation plans.
DLFs during 2000-2001. Ukawa (2005) examined the 2000-2001 DLF swarm beneath Fuji. The typical activity here since the early 1980s was 10-20 earthquakes a year at midcrustal depth described as burst-like activity lasting from several minutes to 30 minutes.
The cumulative occurrence of DLF earthquakes their associated cumulative wave energy are plotted in figure FUJ2. The cumulative number rate, or the slope of the curve, is almost constant between 1980-1995, followed by several small slope changes before the later months of 2000 due to the improvements in the seismic network and the new data processing system. The sharp increase in 2000-2001 is far larger than the increase due to the enlarged seismic network. In total, 286 events were identified during the eight months from October 2000 to May 2001. The wave energy increased to approximately twice the average recorded during the prior years.
Regarding Fuji, Ukawa (2005) notes, "On the basis of the DLF earthquake observations by the NIED seismic network, we investigated the temporal change of their occurrence rate from 1980 to 2003 and the hypocenter locations from 1987 to May 2001. The occurrence rate and the seismic wave energy release rate show an abrupt increase from October 2000 to May 2001, suggesting a change in the environment. ...Relocation of hypocenters of the DLF earthquakes indicates that hypocenters of the DLF earthquakes cluster mainly in an elongated region measuring 5 km along the long axis in a NW-SE direction, the center of which is located about 3 km NE from the summit. In addition to the main cluster, hypocenters extend to the southwest from the summit. During the swarm activity in 2000 to 2001, activity in the primary hypocenter region on the northeastern side of Mount Fuji increased greatly. The focal depths of well located DLF events range from 10 to 20 km. The sharp increase of DLF earthquake activity at Mount Fuji began soon after magma discharge and intrusion events in the Miyake-jima and Kozu-shima region in July and August 2000. These events may have modified the state of the deep magmatic system beneath Mount Fuji, thus triggering the DLF earthquake swarm."
Figure 4 shows the three volcanoes mentioned above: Fuji, Miyake-jima, and Kozu-shima. Several more volcanoes also of Holocene age did not erupt.
MLF earthquakes during 1998-2003. Nakamichi and others (2004) revisited Fuji MLF data, that like the DLFs of 2000-2001, they also clustered near the summit. "We have determined the hypocenter locations of MLFs using the hypoDD program [a double-difference algorithm; Waldhauser and Ellsworth, 2000] and repicked arrival times from the seismic networks of ERI, JMA and NIED in and around Mt. Fuji between 1998 and 2003 including the active periods from September 2000 to May 2001, [figure 5]".
The authors summarized their results as follows: "(1) Hypocenters of MLFs define an ellipsoidal volume, 5 km in diameter ranging from 11 to 16 km in focal depth. (2) This volume is centered at 3 km NE of the summit and its long axis is trending NW. This orientation coincides with the major axis of tectonic compression around Mt. Fuji. (3) The center of the MLF epicenters migrated upward and 2-3 km from SE to NW in 1998-2001."
Nakamichi and others, (2004) continue, "We interpret that the hypocentral migration of MLFs reflects magma movement associated with a NW-SE oriented dike beneath Mt. Fuji, figure 6. The relative error ranges of the hypocenters relocated here are from 100 to 500 m horizontally and from 200 to 700 m vertically. No elongated structure in the direction of the observed NW- SE strike is observed in the simulations, indicating that the observed strike is not an artifact of the relocation procedure [seen in Figure 6b along the plane A-A']. The extent of this depth range is also supported by the spread in S-P readings for individual earthquakes. S-P arrival time differences for well-recorded MLFs at station KMR range from 1.9 to 2.4 s, verifying that MLFs beneath Mt. Fuji span a depth range of at least 4 km, and are not confined to a very small volume."
The MLFs also shifted with time. The spatial and temporal variations of MLF hypocenters plotted on figure 7. Nakamichi and others (2004) observed focal depths of MLFs in 1998- 1999 that were 12-16 km deep and "seemed to move deeper gradually."
Two key points from Nakamichi and others (2004) were (1) the MLF processing indicated that the hypocenters migrated 2-3 km upward during 1998-2001, and (2) they interpreted the MLF hypocenter migration as reflecting magma movement associated with a NW-trending dike beneath Fuji.
2011 Fuji stress change after the MW 9 Tohoko earthquake. Fujita and others (2013) studied the Tohoko earthquake and aftershocks in order to see whether the changes in the stress field and pressure changes would cause the known active magma system to erupt. The Tohoku earthquake, MW~9, struck on 11 Mar 2011. Extension occurred over a wide region of the Japanese mainland (Fujita and others, 2013). Aftershocks included those at N Nagano (MW 6.3) on 12 March, at E Shizoka (MW 5.9) on 15 March, and at N Ibaraki (MW 5.8) on 19 March, figure 8. The E Shizuoka aftershock struck beneath Fuji's S flank above its magma system. Fujita and others (2013) selected parameters of the two highest magnitude Tohoko earthquakes from Ozawa et al. (2011) plus the E. Shizuoka earthquake to investigate the change below Fuji. Using seismic data and later modeling they found the change in static pressure below Fuji insufficient to cause an eruption.
The fault parameters of the Tohoko earthquakes (Table 3) were estimated by Ozawa and others (2011). With regard to the E Shizouka earthquake, Fujita and others (2013) determined the East Shizuoka source fault using the method of Ueda and others (2005) and "determined the best-fit fault model to be almost strike-slip with some reverse components, located a few kilometers south of the summit trending from depths of 7-12 km." Note that on table 3 the "Depth (top)" value of 7 km locates the top of the fault.
Table 3. Fault parameters computed for two of the strongest Tohoku earthquakes and the E Shizuoka aftershock. Tohoku parameters are from Ozawa and others (2011); those for the E Shizuoka were obtained by applying the method of Ueda and others (2005). Taken from Fujita and others (2013).
| Parameters |
Tohoku 1 |
Tohoku 2 |
East Shizuoka |
| Latitude |
38.80°N |
37.33°N |
35.3161°N |
| Longitude |
144.00°E |
142.80°E |
138.7130°E |
| Depth (top), km |
5.1 |
17 |
7 |
| Length, km |
186 |
194 |
6 |
| Width, km |
129 |
88 |
8 |
| Strike, degrees |
203 |
203 |
24 |
| Dip, degrees |
16 |
15 |
80 |
| Rake, degrees |
101 |
83 |
20 |
| Dislocation, m |
24.7 |
6.1 |
0.86 |
| Magnitude |
8.8 |
8.3 |
6.0 |
Figure 9 shows the distribution of hypocenters of both tectonic (blue) and DLP (red) earthquakes during 1996-2011. Tectonic earthquakes occurring during 1996-2011 (blue circles) cluster to the S at ~5-15 km depth and NE from ~17 km deep to below the 25 km scale limit with little temporal change in number until a detectable rate rise in early 2011. Hypocenters of DLFs occurring during 1996-2011 (red circles) cluster nearest the crater N at ~10-15 km depth with little temporal change in number until a detectable rate rise in early 2011. The largest event shown, the E Shizuoka tectonic earthquake (15 March 2011) occurred on the S flank of Mount Fuji at a depth of 12 km (table 3 lists the top of the fault at 7 km). Remote aftershocks were centered a few kilometers N of the summit. Taken from Fujita and others (2013).
The relocated hypocenters computed by Fujita and others (2013) compared to the hypocenters of the same events routinely obtained by NIED (Ukawa, 2001), showed improvement in location accuracy (figure 10). The hypocenters by NIED are distributed in a larger volume and not along a particular plane while in this study they are much more concentrated and trending NNE. As seen on figure FUJ 9, Fujita and others (2013) noted "The dislocation was 86 cm toward the NNE with a strike of 240, dip of 800, and rake of 200." Aftershocks of the E Shizouka earthquake also occurred along this fault."
The static stress change caused by the E Shizouka earthquake was on the order of 0.1-1 MPa, or 0.2%, at the boundary of the magma reservoir, which was theoretically sufficient to trigger an eruption (Walter and others 1997; Walter and others 2009).
The deformation of Fuji's magma system was based on finite-element modeling of the Japanese mainland and Fuji seismic tomography. At Fuji, the stress changes to the magma reservoir were on the order of 0.001-0.01 MPa for the Tohoku earthquake and 0.1-1 MPa for the East Shizuoka earthquake (Fujita and others, 2013). Were these static stress changes sufficient to promote new fractures at the magma reservoir wall and magma injection? Fujita and others, 2013 maintain, "This is less than the magnitude required to break new faults but could trigger some perturbation in unstable faults or in the hydrothermal and magmatic systems. However, the magma beneath Mount Fuji does not seem to have enough potential to erupt at this moment".
References. Fujita, E., Kozono, T., Ueda, H., Kohno, Y., Yoshioka, S., Toda, N., Kikuchi, A., and Ida, Y. 2013, Stress field change around the Mount Fuji volcano magma system caused by the Tohoku megathrust earthquake, Japan. Bulletin of Volcanology, 75(1), 1-14.
Koyama M., 2002, Mechanical coupling between volcanic unrests and large earthquakes: a review of examples and mechanics. J Geogr 111:222-232, in Japanese with English abstract.
Koyama M., 2007, Database of eruptions and other activities of Fuji Volcano, Japan, based on historical records since AD 781. Yamanashi Institute of Environmental Sciences, Fuji Volcano, pp 119- 136, in Japanese with English abstract.
Nakamichi H., Ukawa, M., Sakai S., 2004, Precise hypocenter locations of midcrustal low-frequency earthquakes beneath Mt. Fuji, Japan, Earth, Planets and Space, 56, e37-e4.
Nakamichi, H., Hamaguchi , H. Tanaka S., Ueki S., Nishimura T., Hasegawa A., 2003, Source mechanisms of deep and intermediate-depth low frequency earthquakes beneath Iwate volcano, northeastern Japan, Geophysical Journal International, 154, 811-828.
Nishimura T., Ozawa S., Murakami M., Sagiya T., Tada T., Kaidzu M., Ukawa M., 2001, Crustal deformation caused by magma migration in the northern Izu Islands, Japan. Geophysical Research Letters 28:3745-3748.
Ozawa S., Nishimura T., Suito H., Kobayashi T., Tobita M., Imakiire T., 2011, Coseismic and postseismic slip of the 2011 magnitude-9 Tohoku-Oki earthquake. Nature 475:373-377.
Ueda H., Fujita E., Ukawa M., Yamamoto E., Irawan M., Kimata F., 2005, Magma intrusion and discharge process at the initial stage of the 2000 activity of Miyakejima, Central Japan, inferred from tilt and GPS data. Geophysical Journal International 161:891-906.
Ukawa, M., 2005, Deep low-frequency earthquake swarm in the mid crust beneath Mount Fuji (Japan) in 2000 and 2001, Bulletin of Volcanology, 68 (2005), pp. 47-56.
Waldhauser, F. and W. L. Ellsworth, 2000, A double-difference earthquake location algorithm: Method and application to the northern Hayward fault, California, Bull. Seismol. Soc. Am., 90, 1353-1368.
Walter T., 2007, How a tectonic earthquake may wake up volcanoes: stress transfer during the 1996 earthquake-eruption sequence at the Karymsky Volcanic Group, Kamchatka. Earth and Planetary Science Letters 264:347-359.
Walter T., Amelung F., 2007, Volcanic eruptions following M≥9 megathrust earthquakes: implications for the Sumatra-Andaman volcanoes. Geology 35:539-542.
Walter, T., Wang, R., Zimmer, M., Grosser, H., Luhr, B., and Ratdomopurubo, A., 2007, Volcanic activity influenced by tectonic earthquake: static and dynamic stress triggering at Mt. Merapi. Geophysical Research Letters 34:L05304.
Walter, T., Wang, R., Acocella, V., Neri, M., Grosser, H., and Zschau, J., 2009, Simultaneous magma and gas eruptions at three volcanoes in southern Italy: an earthquake trigger? Geology 37:251-254.
Geologic Background. The conical form of Fujisan, Japan's highest and most noted volcano, belies its complex origin. The modern postglacial stratovolcano is constructed above a group of overlapping volcanoes, remnants of which form irregularities on Fuji's profile. Growth of the Younger Fuji volcano began with a period of voluminous lava flows from 11,000 to 8000 years before present (BP), accounting for four-fifths of the volume of the Younger Fuji volcano. Minor explosive eruptions dominated activity from 8000 to 4500 BP, with another period of major lava flows occurring from 4500 to 3000 BP. Subsequently, intermittent major explosive eruptions occurred, with subordinate lava flows and small pyroclastic flows. Summit eruptions dominated from 3000 to 2000 BP, after which flank vents were active. The extensive basaltic lava flows from the summit and some of the more than 100 flank cones and vents blocked drainages against the Tertiary Misaka Mountains on the north side of the volcano, forming the Fuji Five Lakes, popular resort destinations. The last confirmed eruption of this dominantly basaltic volcano in 1707 was Fuji's largest during historical time. It deposited ash on Edo (Tokyo) and formed a large new crater on the east flank.
Information Contacts: National Research Institute for Earth Science and Disaster Prevention (NIED), 3-1 Tennodai, Tsukuba-shi, Ibaraki-ken, 305, Japan (URL: http://www.bosai.go.jp); Japan Meteorological Agency (JMA), Volcanological Division, 1-3-4 Ote-machi, Chiyoda-ku, Tokyo 100, Japan (URL: http://www.jma.go.jp/); Volcano Research Center, Earthquake Research Institute (ERI), University of Tokyo, Yayoi 1-1-1, Bunkyo-ku, Tokyo 113-0032, Japan (URL: http://www.eri.u-tokyo.ac.jp/VRC/index_E.html).
Galeras
Colombia
1.22°N, 77.37°W; summit elev. 4276 m
All times are local (unless otherwise noted)
Ash emissions and elevated seismicity during May 2012-March 2013
The elevated activity previously covered in May 2012 (BGVN 37:04) continued through March 2013. This report describes the ash events and monitoring efforts during that time as well as trends in seismic, gas, and geodetic data. The Servicio Geológico Colombiano (SGC) maintained Alert Level III (Yellow; "changes in the behavior of volcanic activity") during this 11-month reporting period.
From the observatory based in Pasto (~10 km E of Galeras's summit), the SGC (formerly known as Instituto Colombiano de Geología y Minería "INGEOMINAS") maintained an extensive monitoring network (table 11). During May 2012-March 2013, they highlighted the following events in their monthly activity reports (available online): ash plumes, ashfall, elevated seismicity (including swarms), SO2 emissions, and sulfur odors detected by observers near the volcano.
Table 11. The SGC network for monitoring Galeras included more than 50 instruments during May 2012-March 2013; the newest station, added in March 2013, is an additional magnetic and self-potential monitoring station. Courtesy of SGC.
| Instrument Description |
Quantity |
Instrument Location(s) |
| Radon gas sensors (diffuse soil emissions) |
20 |
Two transects covering the E (Galeras Line) and N (Barranco Line) sectors |
| Seismic stations (seven short period and five broadband; telemetered) |
12 |
See Figure 116 in BGVN 37:04 |
| Electronic tilt stations (telemetered) |
8 |
See Figure 116 in BGVN 37:04 and figure 9 |
| DOAS stations; three ScanDOAS (telemetered) and one portable MiniDOAS (NOVAC Program) |
4 |
Santa Bá, Alto Jimenez, Alto Tinajillas (figure 116 in BGVN 37:04 and figure 6) |
| GPS stations (telemetered) |
4 |
Cráter, Cóndor, Barranco, (Mapachio stopped in Aug. 2012), San Cavetano (figure 116 in BGVN 37:04 and figure 9) |
| Infrasound stations |
3 |
Seismic stations Cráter-2, Cóndor, and Calabozo (figure 116 in BGVN 37:04) |
| Video cameras |
3 |
Two in towns (Pasto and Consacá in figure 6) and one at seismic station Barranco Alto (figure 116 in BGVN 37:04) |
| Flood monitoring stations |
2 |
Watershed of Mijitayo (figure 6) (including geophone and flood gauges; telemetered) |
| Magnetic and self-potential systems |
2 |
Stations Frailejónes and Barranco (added in March 2013; figure 116 in BGVN 37:04) |
| Wind station (speed and direction; telemetered) |
1 |
Seismic station Cráter-2 (figure 116 in BGVN 37:04) |
May 2012 seismicity and ash emissions. Compared with previous activity (see table 13 in BGVN 37:04), seismicity at Galeras increased in May in terms of energy released as well as the number of events and tremor duration (table 12). During 9-10 May, a swarm of 49 volcano-tectonic (VT) earthquakes was detected.
Table 12. Seismicity at Galeras during May 2012-March 2013. Earthquake counts for four types of events: volcano-tectonic (VT), long-period (LP), tremor (TRE), and hybrid (HYB); events labeled "Unclassified" were described by SGC as earthquakes that did not correspond to the current categories. Tornillos did not occur during this reporting period. Courtesy of SGC.
| Month |
VT |
LP |
TRE |
HYB |
Tremor Duration (min) |
Range ML (VT) |
Depths (km) |
Hypocenters Located |
Unclassified |
| May 2012 |
29 |
67 |
347 |
5 |
1944 |
-0.2-2 |
0-14.5 |
95 |
2343 |
| Jun 2012 |
21 |
285 |
353 |
3 |
1746 |
-0.2-1.8 |
1.4-13 |
70 |
1621 |
| Jul 2012 |
17 |
276 |
233 |
1 |
986 |
0-2.5 |
0-15 |
43 |
1808 |
| Aug 2012 |
8 |
163 |
181 |
2 |
525 |
-0.4-2.5 |
0.1-18 |
36 |
1413 |
| Sep 2012 |
10 |
225 |
188 |
8 |
575 |
-0.1-2.2 |
1.8-10.8 |
30 |
1574 |
| Oct 2012 |
17 |
149 |
310 |
6 |
1113 |
-0.2-2.3 |
0.2-13.7 |
58 |
2323 |
| Nov 2012 |
6 |
64 |
246 |
9 |
931 |
-0.5-1.6 |
0-13.2 |
33 |
2335 |
| Dec 2012 |
22 |
54 |
202 |
3 |
2828 |
-0.2-1.7 |
0.2-16 |
48 |
1771 |
| Jan 2013 |
18 |
101 |
292 |
12 |
4223 |
-0.5-1.7 |
0-16 |
53 |
1827 |
| Feb 2013 |
13 |
91 |
282 |
4 |
6131 |
-0.1-1.5 |
0.8-15 |
35 |
1775 |
| Mar 2013 |
16 |
84 |
231 |
15 |
705 |
-0.1-3.1 |
0-11 |
44 |
2300 |
Figure 123 plots 95 VT and hybrid earthquakes and reveals two primary clusters of epicenters, close to the crater and a deeper one ~14 km SW of the active cone. The most distant earthquakes were dispersed in the region and had depths between 4-14.5 km (measured relative to the summit).
On 13 May 2012, SGC noted a change in volcanic activity when tremor occurred associated with gas and ash emissions. Ash rose in small pulses and was deposited at high elevations on the edifice and toward the NW in prevailing winds. During clear conditions on 17 May, an ash plume was observed rising from the crater to ~200 m above the summit.
Clouds obscured visibility on 28 May, but on other days during 22-29 May SGC observers saw ash plumes rising 800 m above the crater. According to the Cruz Roja Departamento Nariño, ashfall was reported in Santa Bárbara (~8 km NNW) during the week of 22 May.
June-July 2012 seismicity and plume activity. Elevated seismicity continued through June, primarily comprised of tremor and long-period (LP) events. In July, seismicity decreased (both in the number of events, table 12, and the energy released) although a swarm of LP events occurred on 15 July.
Gas emissions were frequently observed during the first week of June in images captured by the network of video cameras. Ash emissions rose from the central crater on 2 June, and on 5 June plumes rose 1 km and drifted W. The Washington Volcanic Ash Advisory Center (VAAC) released advisories during 5-6 June, but no volcanic ash or hotspots were detected by satellite instruments.
During 5, 6, and 12-19 June, cameras recorded gas-and-ash emissions; an ash plume rose 1.4 and 2.4 km above the crater on 14 and 17 June, respectively. Ashfall was reported in the towns of Sandoná, Samaniego, Mapachico (this location does not appear on all maps, see figure 116 in BGVN 37:04), and Genoy. During 19-22 and 24 June cameras recorded gas-and-ash emissions that drifted NW.
The SGC noted gas-and-ash emissions via the network of video cameras during 4-5 July. On 18 July, ashfall was also reported to the N in the Quebrada Maragato area (figure 122).
August-September 2012 seismicity and plume activity.Seismicity continued to decrease in August. In September, there were two seismic swarms but the seismic energy released for the month had decreased compared with August. The swarms (on 25 and 28 September) were shallow VT events, M
Ash plumes were frequently observed in August and SGC correlated many episodes of tremor with pulses of ash (figure 124). On 3 August a steam plume rose 1.1 km above the crater. On 4 August ash emissions were observed in the morning, and at 1519 a seven-minute-long episode of tremor was accompanied by a gas-and-ash plume that rose 1.4 km above the crater and drifted N. Ashfall was reported in Genoy. During 7-9 and 11 August gas-and-ash plumes rose 0.9-1.3 km above the crater and drifted W and S. White plumes were observed during 16 (and ash that day) and 18-21 August. Cameras around the volcano recorded emissions during 21-26 August; the emissions contained ash on 26 August.
SGC reported that, during 18-22 and 24-25 September, cameras around Galeras recorded emissions that were mostly water vapor. On 18 and 24 September the emissions contained some ash. Plumes rose to 2 km above the summit and ashfall primarily affected the summit region. A seismic swarm occurred on 28 September.
October-November 2012 seismicity and plume activity. SGC reported that seismicity increased in October and gas-and-ash emissions (up to 1.8 km above the summit) were visible during clear viewing conditions throughout the month. The duration of tremor had doubled compared to the two previous months (table 11).
Episodes of tremor associated with gas-and-ash emissions were frequently detected in October. In particular, on 19 October tremor and a significant ash plume occurred (figure 125); ash covered the NE sector of the edifice where observatory staff conducted fieldwork.
In October, epicenters of VT and HYB earthquakes were widely distributed throughout the area, up to 15 km from the edifice. Low energy and very shallow seismic swarms were detected on 25 and 26 October; there were 130 events in total. In November, seismic energy decreased but seismic swarms were detected during 8, 13-15, 19, and 28 November. These events were low-energy VT earthquakes (M less than 0.9), very shallow, and clustered beneath the central crater. Gas-and-ash emissions were recorded by the network of video cameras during 1, 7, 14, 22-23, and 29-30 November. Plumes rose to less than 1 km above the summit and ash was deposited at the highest elevations, primarily within the N and W sectors.
December 2012-March 2013 seismicity and plume activity. Tremor duration per month increased significantly during December 2012-February 2013 (2,828 to 6,131 minutes) (table 12). Seismic swarms frequently occurred in the months of December (more than 100 earthquakes), January, and March.
Six gas-and-ash emissions were observed between 17-29 December with plume heights less than 1.3 km. Ashfall occurred on the N and W sectors of the edifice.
In January 2013, nine gas-and-ash plumes were detected with the video monitoring system. Those plumes rose less than 1 km above the summit and deposited ash at the highest elevations within the N and W sectors of the edifice. On 22 January, Civil Defense reported ashfall in the area of Sandoná; the timing of that ashfall event suggested a correlation with an episode of tremor detected at 1309.
Gas-and-ash plumes occurred throughout February 2013. During more than 10 of these events, plumes rose to less than 1.5 km above the summit. A significant ash event occurred on the morning of 24 February; Civil Defense reported ashfall in the region of San Isidro (~14 km NW, figure 122).
The SGC reported gas-and-ash plumes throughout March; on five separate days (6, 7, 11, 22 and 25), the tallest plumes reached 1 km above the summit.
An M 3.1 earthquake was felt by residents on 14 March 2013 with a maximum intensity of II on the Modified Mercalli scale. The hypocenter was 5.6 km WNW from the crater at a depth of 7.78 km. Shaking was felt in the towns of Sandoná, Florida, and Consacá (figure 122).
SO2 flux during February 2012-March 2013. The SGC monitored sulfur dioxide gas emissions with a MobileDOAS and three ScanDOAS instruments. The MobileDOAS was acquired through the Network for Observation of Volcanic and Atmospheric Change (NOVAC), an international effort developed by the European Union to monitor SO2 emissions. SGC conducted 2-5 traverses each month with this instrument primarily along roads that circumnavigate the volcano.
The three ScanDOAS installations were telemetered systems located within 12 km WNW of the edifice (figure 116 in BGVN 37:04). These instruments each took measurements on a near-daily basis allowing for regular coverage when all three stations were operating.
The SGC monthly Technical Bulletins reduced these four sources of gas data in units of tons per day (figure 126) after incorporating wind speed and direction based on a local anemometer located at the Cráter station ~1 km E of the summit.
Very high SO2 was detected in March, May, and July of 2012 (up to 3,467 tons per day); relatively high levels were detected during August-October. The SGC established the following criteria for describing SO2 flux at Galeras: Low (under 500 t/d); Moderate (500-1,000 t/d); High (1,000-3,000 t/d); Very High (over 3,000 t/d). In these terms, SO2 detected during November 2012-March 2013 stood at moderate to low levels. The highest values during that time period were recorded in mid to late January (up to 1,194 t/d).
People noticed strong sulfur odors on 18 July; 1 and 6 August; 12 and 19 October; 30 November; 5 December; 25 and 28 February; and 1, 5, and 11 March. Reports were primarily from SGC staff working near the crater, but on 12 October, the staff at Galeras National Park Wildlife Sanctuary noted sulfur odors on the E side of the volcano. On 19 October the odor was present in the towns of Consacá (~13 km W) and Sandoná (~15 km NW).
May 2012-March 2013 deformation monitoring. In May, deformation recorded by most of the tilt stations was dominated by inflation in the W sector of the volcano; a zone that coincided with a cluster of earthquake epicenters during 9-10 May. Inflation continued to register in that region through March 2013. The four permanent GPS stations (Cráter, Cóndor, Barranco, and Mapachico) were operating during this time period (figure 116, BGVN 37:04). Unfortunately, the Mapachico site was vandalized on 27 August 2012 and thereafter its signal was lost.
On 31 October 2012, a new GPS station was brought online, San Cayetano, located ~4 km E (figure 127). The testing period for the new instrument continued through November. SGC did not highlight any deformation trends during December 2012-March 2013.
Geologic Background. Galeras, a stratovolcano with a large breached caldera located immediately west of the city of Pasto, is one of Colombia's most frequently active volcanoes. The dominantly andesitic complex has been active for more than 1 million years, and two major caldera collapse eruptions took place during the late Pleistocene. Long-term extensive hydrothermal alteration has contributed to large-scale edifice collapse on at least three occasions, producing debris avalanches that swept to the west and left a large open caldera inside which the modern cone has been constructed. Major explosive eruptions since the mid-Holocene have produced widespread tephra deposits and pyroclastic flows that swept all but the southern flanks. A central cone slightly lower than the caldera rim has been the site of numerous small-to-moderate eruptions since the time of the Spanish conquistadors.
Information Contacts: Servicio Geológico Colombiano (SGC), Observatorio Vulcanológico y Sismológico de Pasto, Pasto, Colombia (URL: http://www.SGC.gov.co/Pasto.aspx); Washington Volcanic Ash Advisory Center (VAAC), Satellite Analysis Branch (SAB), NOAA/NESDIS E/SP23, NOAA Science Center Room 401, 5200 Auth Rd, Camp Springs, MD 20746, USA (URL: http://www.ospo.noaa.gov/Products/atmosphere/vaac/).
Kanaga (United States) — March 2013 Cite this Report
Kanaga
United States
51.923°N, 177.168°W; summit elev. 1307 m
All times are local (unless otherwise noted)
18 February 2012 eruption; new fissure
In our last report on Kanaga, issued in 1995 (BGVN 20:08), we discussed an eruption during January through mid-October 1994. In addition to a brief explosion in February 2012, more information from the Alaska Volcano Observatory (AVO) has come to our attention, some discussing events more than a decade ago. This information suggested either renewed low level eruptions or vigorous steaming from lava cooling in the summit crater.
What follows is condensed from reports, primarily by researchers at AVO, describing the time span from 1996 to 2012. Data for 2012 is in a separate subsection. The last section looks at Kanaga seismicity in terms of located earthquakes and MC, Magnitude of Completeness, a means of looking at seismic data quality, homogeneity, and consistency, and the smallest events reliably recorded in the cataloged data (Wiemer and Wyss, 2000).
Figures 1 and 2 comprise three maps showing, respectively, the location of Kanaga Island in the Aleutian Islands, a physical map of Kanaga Island showing the location of Kanaga volcano, and a geological map of the volcano.
According to McGimsey and Neal (1997), a commercial airline crew noted a small, bluish brown cloud possibly containing some ash on 11 June 1996, "rising a few hundred feet above the summit of the volcano." Strong winds carried the cloud down the SE flank of the volcano, depositing ash that discolored the snow. The flight crew noted a sulfur odor upon descent into nearby Adak Island. A ground observer on Adak noted dark splotches on the E flank of Kanaga, but a ballistic origin for the pattern (i.e., volcanic bombs) was never confirmed. It should be noted that these observations occurred several days after an M 6 earthquake in the area, and extensive rockfalls and increased steaming had been observed at Gareloi and Kasatochi volcanoes E and W of Kanaga.
Kevin Bell, the captain of the RV Tiglax, watched Kanaga from a point off its N flank on 3 September 1996. He observed that the extent of lava flows was similar to that inferred from 1995 photographs. Small wisps of steam persisted along the upper reaches of the lava flow on the NW flank. Bell also saw material rolling down the steep flank of the volcano during the Summer and Fall of 1996.
Waythomas and others (2002) noted that ash clouds from Kanaga could interfere with the commercial airliners flying between East Asia and Alaska. Figure 3 shows a satellite image of Kanaga volcano taken 13 August 2002.
Coombs and others (2007) described subaerial evidence for large-scale prehistoric collapse at Kanaga volcanic center and conducted submarine side-scan sonar profiling N of the volcano. These data reveal a hummocky seafloor topography suggestive of landslide debris.
2012 Activity. AVO detected volcanic tremor at Kanaga from 1523 to 1527 UTC on 18 February 2012. This was followed by numerous small earthquakes at Kanaga continuing for about an hour.
A possible weak ash cloud ~8 km in length, ~39 km NE of the volcano, was detected by the Advanced Very High Resolution Radiometer (AVHRR) aboard a polar-orbiting satellite, at 1535 UTC. The plume was observed as far as ~39 km NE of the volcano.
Because of the new unrest and possible explosive activity with the likely ash cloud, AVO raised the Alert Level to Advisory and the Aviation Color Code to Yellow. Somewhat elevated seismicity continued at Kanaga on 19 February 2012, but was not detectable on 20 February. Low amplitude tremor was detected on 25 February. On 2 March, citing continued background level seismicity, AVO returned Kanaga to Normal and the Aviation Color Code to Green.
Photographs taken by a local observer on 19 February showed a small steam plume rising from Kanaga's crater (figure 4), who thought that the two dark stripes extending down the flank possibly represent fresh ash and/or flowage deposits.
Figures 5-7 show images and photographs of Kanaga taken in the weeks and months following the brief 18 February eruption. The fissure, which vented steam, developed sometime after October 2011.
Located earthquakes enable computation of MC. Table 1 shows the annual number of located earthquakes recorded by the U.S. Geological Survey (USGS) within 20 km of the Kanaga volcanic center for the years of 2004-2011. References for this table came from USGS catalogs of earthquake hypocenters at Alaskan volcanoes are cited in a separate list below. The catalog for 2012 is not yet available. The first seismic monitoring station at Kanaga was installed in September 1999.
Table 1. Number of earthquakes for various years located for the Kanaga volcano seismograph subnetwork within 20 km of the volcanic center. The column of "Other" earthquakes refers to those outside the defined categories of VT and LP (including hybrid, regional-tectonic, teleseismic, shore-ice, calibrations, other non-seismic, and cause unknown). Compiled from the U.S. Geological Survey's annual Catalog of Earthquake Hypocenters at Alaskan Volcanoes.
| Year |
Earthquakes Located |
Volcano-tectonic (VT) |
Low-frequency (LF) |
Other |
| 2004 |
32 |
30 |
2 |
0 |
| 2005 |
42 |
42 |
0 |
0 |
| 2006 |
56 |
56 |
0 |
0 |
| 2007 |
48 |
48 |
0 |
0 |
| 2008 |
478 |
403 |
0 |
75 |
| 2009 |
28 |
26 |
0 |
2 |
| 2010 |
43 |
43 |
0 |
0 |
| 2011 |
21 |
21 |
0 |
0 |
According to Dixon and others (2009), the large number of earthquakes located at Kanaga in 2008 was the result of an M ~6.6 tectonic earthquake of 2 May 2008 and its aftershocks. That publication also includes a map with stations and epicenters, cross sections with hypocenters, and a plot of depth in a time series during 2011.
The USGS annual Catalog of earthquake hypocenters at Alaskan Volcanoes include a category for each volcano entitled Magnitude of Completeness (MC), defined as the magnitude at which 90% of the data can be modeled by a power law fit (Wiemer and Wyss, 2000). Below MC, some fraction of small earthquakes are missed by the network, for reasons such as: those earthquakes were too small to be reliably recorded; geophysicists decided to exclude events below some threshold; and for aftershocks and in the midst of various kinds of overriding signal or noise, smaller earthquakes may have been too small to be detected (eg. swamped by the coda of larger events).
According to Dixon and others (2012), Mc for AVO seismograph subnetworks using data from Kanaga (6 stations) for the period March 2002-December 2011 was 1.2. In practice, this means that 1.2 was the lowest magnitude at which all earthquakes in a space time frame are reliably detected. Approximately 25 located earthquakes are needed to calculate MC.
References. Coombs, M.L., White, S.W., and Scholl, D.W., 2007, Massive edifice failure at Aleutian arc volcanoes, Earth and Planetary Science Letters, v. 256, p. 403-418.
McGimsey, R.G., and Neal, C.A., 1997, 1996 Volcanic activity in Alaska and Kamchatka: Summary of events and response or the Alaska Volcano Observatory, U.S. Geological Survey Open File Report 97 433, 34p.
Miller, T.P., Waythomas, C.F., and Nye, C.J., 2003, Preliminary geologic map of Kanaga Volcano, Alaska, U.S. Geological Survey Open File Report 03-113, 1p.
Neal, C.A., McGimsey, R.G., Dixon, J.P., Cameron, C.E., Nuzhdaev, A.A., and Chibisova, M., 2011, 2008 Volcanic activity in Alaska, Kamchatka, and the Kurile Islands: Summary of events and response of the Alaska Volcano Observatory, U.S. Geological Survey Scientific Investigations Report 2010 5243, 94 p.
Waythomas, C.F., Miller, T.P., and Nye, C. J., 2001, Geology and Late Quaternary Eruptive History of Kanaga Volcano, a Calc Alkaline Stratovolcano in the Western Aleutian Islands, in Galloway, J.P. (ed), Alaska Studies by the U.S. Geological Survey in Alaska 2001, U.S. Geological Survey Professional Paper 1678, Chapter 15, pp.181-197.
Waythomas, C.F., Miller, T.P., and Nye, C. J., 2002, Preliminary volcano hazard assessment for Kanaga Volcano, Alaska, U.S. Geological Survey Open File Report 02 397, 27 p.
Wiemer, S and Wyss, M, 2000, Minimum Magnitude of Completeness in Earthquake Catalogs: Examples from Alaska, the Western United States, and Japan, Bulletin of the Seismological Society of America, vol. 90 no. 4, pp. 859 869 (DOI: 10.1785/0119990114).
References - Catalogs of earthquake hypocenters at Alaskan Volcanoes.
Dixon, J.P., Stihler, S.D., Power, J.A., Tytgat, G., Estes, S., Prejean, S., Sánchez, J.J., Sanches, R., McNutt, S.R., and Paskievitch, J., 2005, Catalog of Earthquake Hypocenters at Alaskan Volcanoes: January 1 through December 31, 2004, U.S. Geological Survey Open File Report 2005 1312, 74p.
Dixon, J.P., Stihler, S.D., Power, J.A., Tytgat, G., Estes, S., and McNutt, S.R., 2006, Catalog of earthquake hypocenters at Alaskan volcanoes: January 1 through December 31, 2005, U.S. Geological Survey Open File Report 2006 1264, 78 p.
Dixon, J.P., Stihler, S.D., Power, J.A., and Searcy, Cheryl, 2008, Catalog of earthquake hypocenters at Alaskan volcanoes: January 1 through December 31, 2006, U.S. Geological Survey Data Series 326, 79 p.
Dixon, J.P., Stihler, S.D., and Power, J.A., 2008, Catalog of Earthquake Hypocenters at Alaskan Volcanoes: January 1 through December 31, 2007, U.S. Geological Survey Data Series 367, 82p.
Dixon, J.P., and Stihler, S.D., 2009, Catalog of earthquake hypocenters at Alaskan volcanoes: January 1 through December 31, 2008, U.S. Geological Survey Data Series 467, 86 p.
Dixon, J.P., Stihler, S.D., Power, J.A., and Searcy, Cheryl, 2010, Catalog of earthquake hypocenters at Alaskan volcanoes: January 1 through December 31, 2009, U.S. Geological Survey Data Series 531, 84 p.
Dixon, J.P., Stihler, S.D., Power, J.A., and Searcy, C.K., 2011, Catalog of earthquake hypocenters at Alaskan Volcanoes: January 1 through December 31, 2010, U.S. Geological Survey Data Series 645, 82 p.
Dixon, J.P., Stihler, S.D., Power, J.A., and Searcy, C.K., 2012, Catalog of earthquake hypocenters at Alaskan Volcanoes: January 1 through December 31, 2011, U.S. Geological Survey Data Series 730, 82 p.
Geologic Background. Symmetrical Kanaga stratovolcano is situated within the Kanaton caldera at the northern tip of Kanaga Island. The caldera rim forms a 760-m-high arcuate ridge south and east of Kanaga; a lake occupies part of the SE caldera floor. The volume of subaerial dacitic tuff is smaller than would typically be associated with caldera collapse, and deposits of a massive submarine debris avalanche associated with edifice collapse extend nearly 30 km to the NNW. Several fresh lava flows from historical or late prehistorical time descend the flanks of Kanaga, in some cases to the sea. Historical eruptions, most of which are poorly documented, have been recorded since 1763. Kanaga is also noted petrologically for ultramafic inclusions within an outcrop of alkaline basalt SW of the volcano. Fumarolic activity occurs in a circular, 200-m-wide, 60-m-deep summit crater and produces vapor plumes sometimes seen on clear days from Adak, 50 km to the east.
Information Contacts: Alaska Volcano Observatory (AVO), a joint program of theUnited States Geological Survey (USGS), theGeophysical Institute of the University of Alaska Fairbanks (UAFGI), and theState of Alaska Division of Geological and Geophysical Surveys (ADGGS), Anchorage, AK (URL: http://www.avo.alaska.edu); Christina A. Neal, USGS/AVO Anchorage, AK (URL: http://www.avo.alaska.edu); NASA Earth Observatory (URL: http://earthobservatory.nasa.gov/).
Lokon-Empung (Indonesia) — March 2013 Cite this Report
Lokon-Empung
Indonesia
1.358°N, 124.792°E; summit elev. 1580 m
All times are local (unless otherwise noted)
Eruptions continue into early 2013
This report discusses ash-bearing eruptions seen during the reporting interval, 15 September 2012 to April 2013. As described in our 2012 report (BGVN 37:05) the twin volcanoes of Lokon-Empung have remained restless since 2008, typically with small eruptions amid seismic unrest. Recent activity is based on summaries that have been posted by the Center of Volcanology and Geological Hazard Mitigation (CVGHM, also known as Pusat Vulkanologi dan Mitigosi Bencana Geologi-PVMBG). The active crater is referred to as Tompaluan, a vent that resides in the saddle between the peaks of Lokon and Empung (figure 12). An estimated 120,000 people live within 10 km of the volcano. Lokon-Empung lies 20 km S of Manado, the second largest city in Sulawesi (2010 pop. 2.27 million), a metropolis served by the Sam Ratulangi International Airport that closed for four days during Lokon's 1991 eruption (see figures 9 and 10 in BGVN 37:05). In April 2012, CVGHM raised the hazard Alert Level to 4 (on a scale of 1-4).
According to the Darwin Volcanic Ash Advisory Center (VAAC), ground based observers reported that on 15 September (2012) an ash plume from Lokon-Empung rose to an altitude of ~3 km. Satellite imagery showed the ash plume drifting 185 km SE. Another ash plume was reported on 21 September, rising to an altitude of ~3 km; however, in this case an ash plume was not identified in satellite imagery.
According to the Darwin VAAC, CVGHM reported that on 6 October an ash plume from Lokon Empung rose to an altitude of ~3.7 km; the plume altitude was determined by wind data. A thermal anomaly was also detected in satellite imagery on 6 October.
Several news sources (Examiner.com, Jakarta Globe, XINMSN News (Singapore), Jakarta Post) were amalgamated to describe the October activity. According to a news article, an eruption on 7 October 2012 ejected incandescent tephra as high as 350 m above the crater and generated an ash plume that rose ~1.5 km. The article also noted that Lokon Empung had erupted 41 times in September and 3 times on 5 October.
Government volcanologist Farid Bina reported from the volcano's monitoring post in North Sulawesi province, "The eruption on 7 October was the seventh biggest eruption since mid-September". Thunderous sounds were heard nearly 6 km away. The National Agency for Disaster Management (BNPB) said the eruption ejected debris 350 m high and produced an ash plume at least 1.5 km high that drifted NE. It wasn't clear how high the ascending ash actually reached because the mountain was engulfed in ash and heavy rain fell around its cloud covered crater. Bina said that there were no casualties or damages. The head of North Sulawesi Disaster Mitigation Agency (BPBD), Hoyke Makarawung, said that the amount of ashfall blanketing the affected areas was insignificant. BPBD reminded residents about the danger of respiratory ailments, urging those in ash-prone areas to wear masks. A 2.5-km exclusion zone around the volcano continued to be enforced during this heightened activity.
Figure 13 shows Lokon-Empung erupting on 8 October 2012. The plume rises from Tompaluan, the active vent at Lokon which lies in the saddle between the two peaks. The ash column mixed with atmospheric clouds, rising to an uncertain altitude.
Based on a Significant Meteorological Notice (SIGMET), the Darwin VAAC reported that on 11 November an ash plume from Lokon Empung rose to an altitude of ~1.5 km. The VAAC again reported that on 28 November, an eruption from Lokon Empung produced an ash plume that rose to an altitude of ~4.9 km; the plume was not however detected in satellite imagery.
On 6 December, Lokon emitted a billowing ash plume (figure 14) that produced ash that fell mostly on the SE flank. Milder activity resumed on 8 and 9 December as shown in figures 15 and 16. December's second small eruption took place on 10 December.
The eruptions seen on 6 and 10 December were typical of Lokon's recent behavior. They involved a succession of overlapping explosions resulting in sustained ash emission and the production of an ash plume. According to Darwin VAAC, these two eruptions produced ash clouds reaching ~3.4 and~ 4.3 km in altitude, respectively.
According to CVGHM there were no reports of casualties or damages during the December 2012 eruptions. Enlarging the current exclusion zone by specifying a new radius of larger size would cut the main road connecting the towns of Manado and Tomohon and thus burden a much larger population. Consequently, the Alert Level was held at "3" (out of 4) that has been in effect since July 2011. Immediate precursors to eruptions at Lokon are typically small and of short duration (minutes to hours), and eruptions may occur with very little additional warning.
In January (2013), based on ground reports, the Darwin VAAC reported ash plumes from Lokon-Empung rose to an altitude of ~2.4 km during the period 2-8 January, that report was not however confirmed by satellite imagery. The VAAC again issued a special Notice to Airmen (NOTAM) for volcanic ash during 15-16 January, again based on reports from CVGHM and the Aviation Volcanic Information site (ASHTAM - www.ashtam.co.uk). The ash plumes reportedly rose to altitudes of ~3.7 4.5 km, but satellite imagery did not confirm the ash reports.
According to news articles, Lokon Empung erupted twice on 31 January, producing an ash plume that rose 800 m above the crater after the first eruption. Seismicity had increased the day before. In another article the head of the Lokon observation post reported that eruptions from Lokon occurred daily, and specifically that nine eruptions had occurred on 2 February. The CVGHM reported that a significant explosion occurred at Lokon on 3 February which produced an ash plume which rose ~3-4 km and which drifted S and SW, but the ash plume was not detected in satellite imagery.
CVGHM observers at the Kakaskasen Volcano Observatory (KKVO) in North Sulawesi, Indonesia reported increased seismic unrest on 9 February. The character of the seismicity suggested to CVGHM that a magmatic intrusion was occurring. Lokon did erupt on 12 February. Seismicity remained elevated at Lokon and small explosions have been occurred frequently.
On 20 March, the Jakarta Post reported a new eruption at Lokon which spewed a ~2 km m high dark brown and black ash cloud from the Tompaluan crater, easily visible from Manado, the regional capital to the NE, and was heard up to 6 km distance. Farid Ruskanda Bina, head of Mount Lokon and Mount Mahawu observation post at the Bandung Geology Agency's volcanology and geological disaster mitigation center (PVMBG) reported "There was an increase in volcanic tremors which culminated in an eruption" (Antara News). Warno, an official at the observation post, added that the increases in Mount Lokon's volcanic tremors were not very significant. The frequency of the volcano's eruptions has continued to decline from previous eruptions of two to three times a week.
A series of 3 moderately large explosions occurred on 25 March that was followed by minor ash emissions. Mount Lokon erupted again from the Tompaluan crater on 26 March, again with ash plumes rising up to ~2 km above the vent. Residents heard a loud boom after the eruption. Indonesia's National and Local Board for Disaster Management and Volcanology agency warned people not to go within 2.5 km of the volcano; authorities held the situation at Alert Level 3 but, however have not advised residents to evacuate the area. There were no reports of casualties, but three villages in the area, Dalian, Wadena and Walloon were covered in ash from the eruption.
On 2 April, seismicity at Lokon increased. Based on both CVGHM and ground reports, the Darwin VAAC reported that on 3 April an eruption from Lokon Empung produced an ash plume that rose to altitudes of ~3 3.4 km and drifted SW. New explosions occurred on 4 April. Volcanic ash plumes reached 700 m above the crater and were blown to the S. Another explosion occurred on 8 April. A relatively large ash plume rose about 3 km above the crater to an altitude of ~4.5 km and drifted SW. The eruption was heard up to 6 km away. The volcano observatory recorded that the eruption was preceded by a strong increase in seismicity. After the main eruption, the volcano continued to erupt ash. Based on both web-camera views and ground reports, the Darwin VAAC reported that on 11 April an ash plume from Lokon rose to an altitude of ~4.6 km and drifted SW; but the ash plume was not confirmed by satellite imagery.
Another relatively large eruption occurred on 14 April. The explosion produced an ash plume ~4 km high, and strong vibrations were felt up to 5 km from the volcano.
KKVO is monitoring the activity closely using equipment for a volcano hazard mitigation project in Indonesia.
Geologic Background. The Lokong-Empung volcanic complex, rising above the plain of Tondano in North Sulawesi, includes four peaks and an active crater. Lokon, the highest peak, has a flat craterless top. The morphologically younger Empung cone 2 km NE has a 400-m-wide, 150-m-deep crater that erupted last in the 18th century. A ridge extending 3 km WNW from Lokon includes the Tatawiran and Tetempangan peaks. All eruptions since 1829 have originated from Tompaluan, a 150 x 250 m crater in the saddle between Lokon and Empung. These eruptions have primarily produced small-to-moderate ash plumes that sometimes damaged croplands and houses, but lava-dome growth and pyroclastic flows have also occurred.
Information Contacts: Center of Volcanology and Geological Hazard Mitigation (CVGHM), Jalan Diponegoro 5+7, Bandung 40122, Indonesia (URL: http://www.vsi.esdm.go.id/); Darwin Volcanic Ash Advisory Centre (VAAC), Bureau of Meteorology, Northern Territory Regional Office, PO Box 40050, Casuarina, NT 0811, Australia (URL: http://www.bom.gov.au/info/vaac/); The Jakarta Post (URL: http://www.thejakartapost.com/); Jakarta Globe (URL: http://jakartaglobe.id/); Kompas.com (URL: http://www.kompas.com/); Straits Times (URL: http://www.straitstimes.com); ITN News (URL: http://www.itn.co.uk/); Volcano Discovery (URL: https://www.volcanodiscovery.com/); Activolcans, VSI (webcam); Geoforum; Xinhua; NewKerala.
Nikko-Shiranesan (Japan) — March 2013 Cite this Report
Nikko-Shiranesan
Japan
36.799°N, 139.376°E; summit elev. 2578 m
All times are local (unless otherwise noted)
Felt earthquakes nearby during April-September 2011
This is our first report on Nikko-Shirane (also known as Nikko-Shiranesan). The volcano is located in the Nikko National Park in central Honshu, the main island of Japan (figures 1 and 2).
According to the Japan Meteorological Agency (JMA), after the massive 11 March 2011 MW 9.03 earthquake off the Pacific coast of Tohoku (38.297°N, 142.372°E), seismicity briefly increased 5-10 km E and SE of Nikko-Shirane at a depth of about 5 km W and NW. On 9 April 2011, an M 3.5 earthquake occurred about 5 km W of the summit, followed by several aftershocks. On JMA's earthquake intensity scale, the M 3.5 earthquake ranged from 1 (felt slightly by some people in quiet environments) to 3 (felt by most people in buildings and some people walking; many people awoken). (JMA's earthquake intensity scale is explained on their website.)
In May, two small earthquakes occurred NW of the volcano. Afterward, seismicity gradually declined through December 2011, although several additional small earthquakes through September 2011 were felt in nearby Nikko city, about 4-5 km E of the summit. No volcanic tremor or fumaroles were observed. No changes were also noted during a 2 November 2011 field survey.
The next JMA-translated report on Nikko-Shirane, in February 2013, noted that volcanic seismicity remained low. However, on 25 February an M 6.3 earthquake occurred, the hypocenter of which was 10 km NNE of the summit and 3 km below sea level. The earthquake's maximum seismic intensity on JMA's scale was 5+ in Nikko City (scale of 5 indicates that many people find it hard to move and walking is difficult). Aftershocks with maximum seismic intensities between 1 and 4 on the JMA scale continued until 28 February, when seismicity declined. This seismicity was not accompanied by volcanic tremor, fumarolic activity, crustal deformation, or any other volcanic activity.
Geologic Background. Nikko-Shiranesan is a relatively small, 2578-m-high andesitic volcano consisting of a group of four lava domes resting on a shield volcano that rises to the NW of scenic Lake Chuzenji in Nikko National Park. All historical eruptions, recorded during the 17th-20th centuries, have consisted of phreatic explosions from Shiranesan, the youngest lava dome. Viscous lava flows with prominent levees from the underlying shield volcano Keizukayama were responsible for the formation of several scenic lakes north of the volcano.
Information Contacts: Japan Meteorological Agency (JMA), Otemachi, 1 3 4, Chiyoda ku Tokyo 100 8122, Japan (URL: http://www.jma.go.jp/).
Niuatahi
Tonga
15.3675°S, 174.0028°W; summit elev. -1270 m
All times are local (unless otherwise noted)
New research data collected from submarine volcano
Richard Arculus (2012), David Butterfield (2012), and Keener and Vailea (2012) discussed the Submarine Ring of Fire Expedition 2012 of the Research Vessel R/V Revelle during 14-15 September 2012. They conducted bathymetric profiles and submersible observations of a caldera originally called 'Volcano O' in the Tonga arc (figure 1). During this cruise, the name 'Niua Tahi' was given to this extraordinarily symmetrical, circular caldera, 15 km in diameter at 1.2 to 2 km depth, by a Senior Geological Assistant aboard from the Tonga Ministry of Lands, Environment, Climate Change and Natural Resources. According to Keener and Vailea (2012), "Volcano O, was named 'Niua Tahi' during our expedition by the Ministry, which in Tongan means 'sea', with the small cone within it being named 'Motu Tahi', or 'island in the sea'."
Niua Tahi is a giant, near-circular caldera ~15 km in diameter, with a floor at a depth of about 2 km (Arculus, 2012). A young cone (Motu Tahi) in the SE sector rises 730 m above the floor to a summit at a depth of 1,270 m depth. The volcano is in the rear arc of the Tonga system, located ~40 km W of the chain of subaerial-submarine volcanic edifices that define the volcanic front of the Tonga Arc, and 25 km E of the spreading ridge of the Northeast Lau Spreading Center. The composition of the cone and surrounding floor is predominantly dacite. Towing with sea-floor cameras over the cone and various parts of the caldera resulted in the discovery of at least three sources of hydrothermal particle venting on the cone's summit and adjacent to the inner caldera walls.
During the cruise, the remotely operated vehicle (ROV) Quest 4000 (operated by MARUM, the Center for Marine Environmental Sciences at the University of Breman, Germany) traversed from W to E over the volcano summit and around the margins of the central cone. The cone contained a shallow pit surrounding what appears to be a volcanic vent, probably the site of the most recent volcanism (figures 2a and 2b). The ROV showed that the summit of the cone was mantled with a ubiquitous sulfur-rich layer that coated rugged blocks of pillow lava, lava tubes, and ash-and-blocks deposits.
The ROV images revealed the presence of a NE-trending elongated pit crater at the cone's summit emitting a plume bearing a sulfurous particulate-rich plume. Several previous observations of the water column detected similar plumes. Hot, clear water (~105°C) welled up in numerous places through the loosely agglomerated pyroclastic materials forming both the rim of the crater and flanks of the cone. The attempt to descend the ROV into the pit for a closer look was thwarted by the dense clouds of sulfurous 'smoke.' The most recent volcanic activity was likely dominated by lava and volcaniclastic debris.
References. Arculus, R., 2012 (14 September), Crossing the cone at "Volcano O," Ocean Explorer (URL: http://oceanexplorer.noaa.gov/explorations/12fire/logs/sept14/sept14.html).
Butterfield, D., 2012 (15 September), Chemistry and ecology at volcano O, Ocean Explorer (URL: http://oceanexplorer.noaa.gov/explorations/12fire/logs/sept15/sept15.html).
Keener, P., and Vailea, A., 2012 (24 September), In keeping with tradition, Ocean Explorer (URL: http://oceanexplorer.noaa.gov/explorations/12fire/logs/sept24/sept24.html).
Resing, J., and Embley, B., 2012, Mission summary, NOAA Ocean Explorer web site (URL: http://oceanexplorer.noaa.gov/explorations/12fire/logs/summary/summary.html).
Geologic Background. Niuatahi is a nearly circular caldera ~15 km in diameter, with a floor at a depth of about 2 km (Arculus, 2012); it had been preliminarily called "Volcano O." A young cone (Motu Tahi) in the SE sector rises 730 m above the floor to a summit depth of 1,270 m. The volcano is in the rear arc of the Tonga-Kermadec Arc System, ~40 km W of the chain of edifices that define the volcanic front, and 25 km E of the central ridge of the Northeast Lau Spreading Center. The composition of the cone and surrounding floor is predominantly dacite. Towing with sea floor cameras over the cone and various parts of the caldera in 2012 resulted in the discovery of at least three sources of hydrothermal particle venting on the cone's summit and adjacent to the inner caldera walls. The Tonga Ministry of Lands, Environment, Climate Change and Natural Resources named the volcano Niuatahi, which means 'sea' in Tongan, with the small cone of Motutahi meaning 'island in the sea.'
Information Contacts: Richard Arculus, Research School of Earth Sciences, The Australian National University, Canberra, Australia; Susan Merle, Oregon State University, Eugene, OR, Submarine Ring of Fire 2012 Exploration, NOAA Vents Program; Center for Marine Environmental Sciences (MARUM), University of Bremen, Bremen, Germany (URL: https://www.marum.de/); NOAA Vents Program (URL: https://www.pmel.noaa.gov/eoi/laubasin.html).
Tungurahua (Ecuador) — March 2013 Cite this Report
Tungurahua
Ecuador
1.467°S, 78.442°W; summit elev. 5023 m
All times are local (unless otherwise noted)
Return of explosions and earthquakes through at least October 2010
As noted in our last report (BGVN 34:08), activity at Tungurahua had started to decline in late June 2009, a trend that continued through mid-December 2009. This report summarizes heightened activity witnessed from 30 December 2009 to 4 February 2010, and again from 26 May to very early August 2010. Seismicity began to increase in mid-December 2009 in prelude to the above-mentioned escalation.
This report is based on reports received from and direct correspondence with staff members of the Instituto Geofísico Politécnica Nacional Casilla ("Instituto Geofísico," IG).
Seismic overview. A plot by IG presented a synthesis of seismicity (figure 45) during the interval of 1 January 2006 to 17 October 2010, and is one way to portray the long-term pace of Tungurahua's eruption. The x-axis shows time with small tick marks every 30 days, and years indicated. The y-axis shows level of seismic activity on a scale indexed to an unstated normalized peak value. During the time period plotted, the number of recorded events assessed had a maximum peak at index value of ~74%. That peak occurred around 14 July 2006 ("2006 07 14" at left on the plot).
During 2010 seismicity rose sharply in January, peaked at index values near 27%, and then descended during February into June 2010. The intervals of low seismicity in late 2009 and early 2010 are some of the lowest index values during the ~5 years displayed on this plot. The second peak during 2010 was sudden and ascended from low index values; it reached maximum values in late May 2010, approaching index values 50%. The downward arrow at the right side of the plot calls attention to the last day on the plot, 17 October 2010, when the index value stood at 11%.
The seismicity shown in figure 45 shows strong correlation with Tungurahua's behavior summarized below.
Renewed activity (and SO2 compilations). After six months of calm that included occasional diffuse emissions of vapor that rose no higher than 100 m, more intense activity resumed on 30 December 2009. On 1 January ash plumes rose to ~6 km altitude, and on 3 and 4 January they rose as high as ~9 km. Similar plume altitudes were seen at times during the rest of January and February. On 11-12 January, Strombolian outbursts ejected material ~1 km above the crater and to distances of ~1.5 km away from the vent. Ash often blew in a broadly westerly direction (see below).
Significant SO2 fluxes were measured in January 2010. On 6 January, SO2 fluxes reached a value of 3,200 metric tons/day (t/d); on 8 January, they reached 7,500 tons/day. In contrast, some recent values during the 6 month lull were between 100 and 200 tons/day.
On the broader subject of Tungurahua SO2 output, more comprehensive assessments and compilations have been captured than ever before, but the details are beyond the scope of this report. One group, NOVAC (Network for Observation of Volcanic and Atmospheric Change) established a global network of stations to measure emissions of SO2 (and BrO) by UV absorption spectroscopy by local instruments. Trained personnel working at various volcanoes and following protocols assured standard practices (DOAS, mini DOAS, Flyspec). The instruments are based at over 21 volcanoes, including Tungurahua. SO2 is also monitored from instruments on satellites (e.g. OMI, GOME 2, and SCIAMACHY). Understanding and possibly reconciling those two set of atmospheric measurements, local (ground- and aircraft-based measurements) and satellite based, has also been the subject of recent papers. Tungurahua and adjacent degassing volcanoes have played a major roles in this effort (McCormick and others, in press, Carn and others, 2008, and Arellano and others, 2008).
Figure 46 shows Tungurahua in a Strombolian eruption on or about 10 January 2010. Incandescent material fell onto the flanks.
Strong explosions were heard on the evening of 14 January. Small amounts of ash fell nearby and as far away as the Chimborazo glaciers and Guaranda (64 km SW).
The return of ongoing ash plumes initiated a variety of civil responses. In towns close in and on Tungurahua's W to SW flanks (e.g., Choglontús), roofs were inspected and where necessary, ash was removed. This measure was undertaken to prevent ash loading and potential roof collapse. Many building roofs are nearly flat, requiring ash removal with brooms and shovels.
Figure 47 shows an elementary schematic created to address the upsurge in Tungurahua's ash falls, and to broaden understanding and raise public awareness of ash fall processes and hazards from Tungurahua. It shows the progressive shift in the range of grain sizes falling out of ash plumes as they drift, in this idealized case, W to SW with plume tops rising to altitudes approaching 10 km. More complex depositional patterns may develop owing to factors like discharges to variable height, discharges containing differing grain-size distributions, and shifts in wind velocity. Assessment of ashfall often results in maps displaying the thickness or mass of these deposits on the ground (respectively, isopach and isopleth maps). Several isopach maps appear below, describing the Tungurahua's January-February 2010 upsurge in ashfall in more quantitative and technical terms.
Tungurahua's ash clouds are also closely monitored out of concern for keeping aircraft out of potentially damaging plumes, some of which extended ~150 km W of the summit during the reporting interval. Ecuador maintains a Meteorological Watch Office (MWO) in the city of Guayaquil, ~180 km SSW of the summit (figure 48; and see inset map showing Guayaquil's location on the coast in figure 25 in BGVN 30:06). The Guayaquil MWO feeds critical data, including observations made by IG at Tungurahua and satellite data they interpret about Tungurahua's plumes, to the Buenos Aires Volcanic Ash Advisory Center. Tungurahua was a frequent subject of aviation reports during the reporting interval. As seen on figure 48, Guayaquil sits just S of the ends of W-directed envelopes around the January 2010 ash clouds.
Figures 49 and 50 respectively show 1-10 and 11-31 January ash-fall deposits created by plumes that rose to the 5.4-9.1 km altitude range (up to 3 km above the crater). On these maps, the farthest measured isopach, 1 mm in thickness, was as far away as 19 km from the crater. For figure 49, the points where the thickness was measured (yellow) best constrained the deposits maximum extent on the N, NW, and W sides. For that map, ash volumes estimated using conventional approaches (Pyle, 1989; Fierstein and Nathenson, 1992; and Legros, 2000) yielded 313,000 m3 (stated in terms of vesicle-free rock; often abbreviated as DRE, dense-rock equivalent).
In figure 50, the thickest ash (1.5 cm) was mapped at the town of Cahual (~9 km WSW of the summit), and the mapped pattern suggested lobes trending both WNW and WSW. Such thickening at a spot well away from the summit is unusual but not unprecedented. Future studies considering meteorological or other data may help explain this pattern, which could have public safety implications.
IG's report for 11-31 January noted near constant ash plumes during that interval. Ash had impacted banana plantations and livestock, falling over an area of ~15,000 km2.
The ash volume estimate in DRE for 11-31 January was 806,000 m3 (figure 50). Taken with the earlier (1-10 January) estimate based on figure 49, this made the January total ~1,120,000 m3 (DRE). This is best shown to two significant figures, thus 1.1 x 10⁶ m3. In contrast, the volume for the full month of February was estimated at 1.6 x 10⁶ m3.
Figure 51, an isopach map created for the entire month of February 2010, extends farther outward than either of the two maps representing January. February's 1 mm isopach extends up to 22 km from the summit in the WNW direction. February's map also shows some thicker deposits close to the active summit crater (25 mm thickness at Cahuaji), but it reflects a longer time interval than each of the two January maps. February's elevated deposition of ash conformed with IG's Special Bulletin (No. 6), which explained that after 6 February 2010 they had seen a notable increase in the frequency and magnitude of explosions, and plumes rising 4 km above the summit. People tens of kilometers away heard blasts. Observers noted glowing blocks thrown more than 1.5 km and rolling downslope. Infrasonic microphones recorded signals suggesting four explosions of high energy during 8-9 February.
5 February ash plume dynamics. Figure 52 shows intriguing ash plume behavior on 5 February 2010, disclosing complexities infrequently discussed in the literature. At discharge, the plume rises vertically in a thrust phase that appears to be well on its way to farther ascent in a convective phase. The continued rise of earlier emissions (perhaps less energetic or perhaps in gusts of stronger wind) were thwarted by wind having sheared and carried them off. That portion of the plume appears to the right of the crater. As these earlier components progressed downwind and above the lee side of the volcano, their path descended rather than ascended. Farther downwind and away from the volcano the plume appears much broader and its top has risen higher than the original thrust phase. The presence of weather clouds like those in the background could compromise ground-based estimates of the ultimate height for the plume's top.
Geometries like this may also complicate reliable estimates of gas-flux, although scanning imaging infrared spectrometers compensate for these problems (e.g. Grutter and others, 2008). Pilots and meteorologists are familiar with these topographic wind-related effects, which they call lee waves. An acclaimed book by Pretor-Pinney (2007) discusses and provides a diagram to explain similar wind-driven topographic effects and lenticular clouds common near tall peaks.
11 February secondary pyroclastic flows. As IG reported (in their Special Bulletin Number 6), on 11 February an M 3.3 volcano-tectonic earthquake struck in vicinity of Tungurahua. Strong explosions ensued, and about 20 minutes later an ash plume rose ~4 km above the summit. About three hours later IG observers at the Tungurahua Volcano Observatory (OVT) in Guadalupe, (11 km N of the summit), photographed the paths and thermal images revealed still hot deposits from small pyroclastic flows. These flows started at the crater rim and descended several kilometers down the upper one-third of the volcano on the N and NNW flanks.
The pyroclastic flows were interpreted as secondary, generated by the gravitational instability of still-hot ejecta that had accumulated at the crater rim and adjacent areas downslope.
February rain brings destructive lahars. Special Bulletin No. 5 of 4 February 2010 contains a detailed set of notes compiled as strong rains fell and caused lahars to descend along gullies and ravines. The Ulba river (on the volcano's E to NE flanks) was strongly impacted. The lahars also closed some recently repaired roads.
At 1100 on 4 February 2010, a large amount of rock debris flowed down the Chinchín river, which flows from the S to the N along the outer NE flank as close as ~10 km from the summit crater. According to the Baños Fire Department, the lahars destroyed or damaged ~18 homes in Chinchín (16 km NE of the summit). Four people were injured (two children, two adults) and four people were missing. The lahars carried debris up to 5 m in diameter. Debris flowed over the brink of Bride's Veil waterfall, disrupting a well-known scenic attraction.
March to June activity. Although poor visibility hampered views in March, seismicity remained high and indicative of explosions with several ash emissions reaching altitudes of 8-9 km. Comparative quiet prevailed during April and the earlier parts of May, although visibility was often compromised. Early May reports noted lahars on the N, W, and S flanks.
Eruptive vigor rose again on 26 May 2010, when an eruption resulted in small (~1 km runout distance) pyroclastic flows and an ash plume that rose to 12 km altitude.
An eruption on 28 May produced a plume that rose to 15 km altitude, resulting in pumice-fall in some inhabited areas. Pyroclastic flows extended as far as 3 km down the NW, N, and SW flanks, distances insufficient to impact inhabited areas. According to news articles, residents from two towns about 8 km NW were evacuated, and ashfall at the airport in Guayaquil temporarily shut it down.
On 2 and 7 June pyroclastic flows traveled 1.5 km down the NW flank; this took place amid the early June seismic low on figure 47.
Clouds often prevented observations during June and July, but when visible, plumes again rose to altitudes of 5-8 and occasionally 9 km. Some intervals of comparative quiet also occurred (e.g., 23 June to 4 July). As had occurred during many intervals of high eruptive vigor, loud booming noises associated with explosions often caused structures to vibrate. For example, on 6 June large windows vibrated at OVT.
During 28 July-2 August steam emissions, often containing ash, 1-2 km above the crater and drifted NW or W. Minor ashfall was reported to the SW in the Choglontus area during 28-29 July.
According to IG's October report, a lull in activity began in late July and continued through all of October. Figure 47 shows that comparatively low seismicity prevailed through at least 17 October 2010.
Online book in Spanish on Tungurahua. Readers searching for background on this restless, dangerous, news-making volcano, will find it summarized in accessible terms in a compact (118 page) well-illustrated book (Le Pennec and others (2005), in Spanish; available free online as a PDF file). Topics include events from Tungurahua's geologic past, the onset of the current eruption in 1999, and approaches to monitoring. The book covers behavior as late as mid-2005. A few important recent eruptions after the book's publication included those in July and August 2006 (respectively, VEI 2 and 3) and in February 2008 (VEI 1-2).
Figure 53 features a map from the book. In the book's digital version (a PDF file), the search function will identify place names on this map, a welcome feature.
References. Arellano, S.R., Hall, M., Samaniego, P., Ruiz, A., Molina, I., Palacios, P., Yepes, H., OVTIGEPN staff, 2008. Degassing patterns of Tungurahua volcano (Ecuador) during the 1999-2006 eruptive period, inferred from remote spectroscopic measurements of SO2 emissions. J. of Volcanology and Geothermal Research 176, 151-162.
Carn, S.A., A.J. Krueger, N.A. Krotkov, S. Arellano, and K. Yang, 2008, Daily monitoring of Ecuadorian volcanic degassing from space, J. of Volcanology and Geothermal Research, 176(1), 141-150.
Grutter, M., Basaldud, R., Rivera, C., Harig, R., Junkerman, W., Caetano, E., and Delgado Granados, H., 2008, SO2 emissions from Popocatpetl volcano: emission rates and plume imaging using optical remote sensing techniques, Atmos. Chem. Phys., 8, 6655-6663.
Le Pennec. J-L, Samaniego, P, Eissen, J-P, Hall, MP, Molina, I, Robin, C, Mothes, P, Yepes, H, Ramón, P, Monzier, M, and Egred, J., 2005, Los peligros volcánicos asociados con el Tungurahua, 2nd edición, Serie: Los peligros volcánicos en el Ecuador. Corporación Editora Nacional, ISBN: 9978-84-402-3 (118 pp., in Spanish). [PDF online at http://horizon.documentation.ird.fr/exl doc/pleins_textes/divers11 12/010036187.pdf]
McCormick, B.T., M. Herzog, J. Yiang, M. Edmonds, T.A. Mather, S.A. Carn, S. Hidalgo, and B. Langmann (2013), An integrated study of SO2 emissions from Tungurahua volcano, Ecuador, Journal of Geophysical Research (under review).
Pretor Pinney, G., 2007, The Cloudspotter's Guide: The Science, History, and Culture of Clouds by Gavin, Penguin Group (USA).
Geologic Background. Tungurahua, a steep-sided andesitic-dacitic stratovolcano that towers more than 3 km above its northern base, is one of Ecuador's most active volcanoes. Three major edifices have been sequentially constructed since the mid-Pleistocene over a basement of metamorphic rocks. Tungurahua II was built within the past 14,000 years following the collapse of the initial edifice. Tungurahua II collapsed about 3,000 years ago and produced a large debris-avalanche deposit to the west. The modern glacier-capped stratovolcano (Tungurahua III) was constructed within the landslide scarp. Historical eruptions have all originated from the summit crater, accompanied by strong explosions and sometimes by pyroclastic flows and lava flows that reached populated areas at the volcano's base. Prior to a long-term eruption beginning in 1999 that caused the temporary evacuation of the city of Baños at the foot of the volcano, the last major eruption had occurred from 1916 to 1918, although minor activity continued until 1925.
Information Contacts: Instituto Geofísico (IG), Escuela Politécnica Nacional, Casilla 1701-2759, Quito, Ecuador; Jorge E. Bustillos A. (IG), Patricia A. Mothes (IG), and Buenos Aires and Washington Volcanic Ash Advisory Centers.