Recently Published Bulletin Reports
Kadovar (Papua New Guinea) An ash plume and weak thermal anomaly during May 2023
San Miguel (El Salvador) Small gas-and-ash explosions during March and May 2023
Ebeko (Russia) Continued explosions, ash plumes, and ashfall during October 2022-May 2023
Home Reef (Tonga) Discolored plumes continued during November 2022-April 2023
Semisopochnoi (United States) Occasional explosions, ash deposits, and gas-and-steam plumes during December 2022-May 2023
Ambae (Vanuatu) New lava flow, ash plumes, and sulfur dioxide plumes during February-May 2023
Ibu (Indonesia) Daily ash explosions continue, along with thermal anomalies in the crater, October 2022-May 2023
Dukono (Indonesia) Continuing ash emissions, SO2 plumes, and thermal signals during October 2022-May 2023
Sabancaya (Peru) Explosions, gas-and-ash plumes, and thermal activity persist during November 2022-April 2023
Sheveluch (Russia) Significant explosions destroyed part of the lava-dome complex during April 2023
Bezymianny (Russia) Explosions, ash plumes, lava flows, and avalanches during November 2022-April 2023
Chikurachki (Russia) New explosive eruption during late January-early February 2023
Kadovar (Papua New Guinea) — June 2023  Cite this Report
Kadovar
Papua New Guinea
3.608°S, 144.588°E; summit elev. 365 m
All times are local (unless otherwise noted)
An ash plume and weak thermal anomaly during May 2023
Kadovar is a 2-km-wide island that is the emergent summit of a Bismarck Sea stratovolcano. It lies off the coast of New Guinea, about 25 km N of the mouth of the Sepik River. Prior to an eruption that began in 2018, a lava dome formed the high point of the volcano, filling an arcuate landslide scarp open to the S. Submarine debris-avalanche deposits occur to the S of the island. The current eruption began in January 2018 and has comprised lava effusion from vents at the summit and at the E coast; more recent activity has consisted of ash plumes, weak thermal activity, and gas-and-steam plumes (BGVN 48:02). This report covers activity during February through May 2023 using information from the Darwin Volcanic Ash Advisory Center (VAAC) and satellite data.
Activity during the reporting period was relatively low and mainly consisted of white gas-and-steam plumes that were visible in natural color satellite images on clear weather days (figure 67). According to a Darwin VAAC report, at 2040 on 6 May an ash plume rose to 4.6 km altitude and drifted W; by 2300 the plume had dissipated. MODIS satellite instruments using the MODVOLC thermal algorithm detected a single thermal hotspot on the SE side of the island on 7 May. Weak thermal activity was also detected in a satellite image on the E side of the island on 14 May, accompanied by a white gas-and-steam plume that drifted SE (figure 68).
Geologic Background. The 2-km-wide island of Kadovar is the emergent summit of a Bismarck Sea stratovolcano of Holocene age. It is part of the Schouten Islands, and lies off the coast of New Guinea, about 25 km N of the mouth of the Sepik River. Prior to an eruption that began in 2018, a lava dome formed the high point of the andesitic volcano, filling an arcuate landslide scarp open to the south; submarine debris-avalanche deposits occur in that direction. Thick lava flows with columnar jointing forms low cliffs along the coast. The youthful island lacks fringing or offshore reefs. A period of heightened thermal phenomena took place in 1976. An eruption began in January 2018 that included lava effusion from vents at the summit and at the E coast.
Information Contacts: Darwin Volcanic Ash Advisory Centre (VAAC), Bureau of Meteorology, Northern Territory Regional Office, PO Box 40050, Casuarina, NT 0811, Australia (URL: http://www.bom.gov.au/info/vaac/); Hawai'i Institute of Geophysics and Planetology (HIGP) - MODVOLC Thermal Alerts System, School of Ocean and Earth Science and Technology (SOEST), Univ. of Hawai'i, 2525 Correa Road, Honolulu, HI 96822, USA (URL: http://modis.higp.hawaii.edu/); Copernicus Browser, Copernicus Data Space Ecosystem, European Space Agency (URL: https://dataspace.copernicus.eu/browser/).
San Miguel (El Salvador) — June 2023 Cite this Report
San Miguel
El Salvador
13.434°N, 88.269°W; summit elev. 2130 m
All times are local (unless otherwise noted)
Small gas-and-ash explosions during March and May 2023
San Miguel in El Salvador is a broad, deep crater complex that has been frequently modified by eruptions recorded since the early 16th century and consists of the summit known locally as Chaparrastique. Flank eruptions have produced lava flows that extended to the N, NE, and SE during the 17-19th centuries. The most recent activity has consisted of minor ash eruptions from the summit crater. The current eruption period began in November 2022 and has been characterized by frequent phreatic explosions, gas-and-ash emissions, and sulfur dioxide plumes (BGVN 47:12). This report describes small gas-and-ash explosions during December 2022 through May 2023 based on special reports from the Ministero de Medio Ambiente y Recursos Naturales (MARN).
Activity has been relatively low since the last recorded explosions on 29 November 2022. Seismicity recorded by the San Miguel Volcano Station (VSM) located on the N flank at 1.7 km elevation had decreased by 7 December. Sulfur dioxide gas measurements taken with DOAS (Differential Optical Absorption Spectroscopy) mobile equipment were below typical previously recorded values: 300 tons per day (t/d). During December, small explosions were recorded by the seismic network and manifested as gas-and-steam emissions.
Gas-and-ash explosions in the crater occurred during January 2023, which were recorded by the seismic network. Sulfur dioxide values remained low, between 300-400 t/d through 10 March. At 0817 on 14 January a gas-and-ash emission was visible in webcam images, rising just above the crater rim. Some mornings during February, small gas-and-steam plumes were visible in the crater. On 7 March at 2252 MARN noted an increase in degassing from the central crater; gas emissions were constantly observed through the early morning hours on 8 March. During the early morning of 8 March through the afternoon on 9 March, 12 emissions were registered, some accompanied by ash. The last gas-and-ash emission was recorded at 1210 on 9 March; very fine ashfall was reported in El Tránsito (10 km S), La Morita (6 km W), and La Piedrita (3 km W). The smell of sulfur was reported in Piedra Azul (5 km SW). On 16 March MARN reported that gas-and-steam emissions decreased.
Low degassing and very low seismicity were reported during April; no explosions have been detected between 9 March and 27 May. The sulfur dioxide emissions remained between 350-400 t/d; during 13-20 April sulfur dioxide values fluctuated between 30-300 t/d. Activity remained low through most of May; on 23 May seismicity increased. An explosion was detected at 1647 on 27 May generated a gas-and-ash plume that rose 700 m high (figure 32); a decrease in seismicity and gas emissions followed. The DOAS station installed on the W flank recorded sulfur dioxide values that reached 400 t/d on 27 May; subsequent measurements showed a decrease to 268 t/d on 28 May and 100 t/d on 29 May.
Geologic Background. The symmetrical cone of San Miguel, one of the most active volcanoes in El Salvador, rises from near sea level to form one of the country's most prominent landmarks. A broad, deep, crater complex that has been frequently modified by eruptions recorded since the early 16th century caps the truncated unvegetated summit, also known locally as Chaparrastique. Flanks eruptions of the basaltic-andesitic volcano have produced many lava flows, including several during the 17th-19th centuries that extended to the N, NE, and SE. The SE-flank flows are the largest and form broad, sparsely vegetated lava fields crossed by highways and a railroad skirting the base of the volcano. Flank vent locations have migrated higher on the edifice during historical time, and the most recent activity has consisted of minor ash eruptions from the summit crater.
Information Contacts: Ministero de Medio Ambiente y Recursos Naturales (MARN), Km. 5½ Carretera a Nueva San Salvador, Avenida las Mercedes, San Salvador, El Salvador (URL: http://www.snet.gob.sv/ver/vulcanologia).
Ebeko
Russia
50.686°N, 156.014°E; summit elev. 1103 m
All times are local (unless otherwise noted)
Continued explosions, ash plumes, and ashfall during October 2022-May 2023
Ebeko, located on the N end of Paramushir Island in the Kuril Islands, consists of three summit craters along a SSW-NNE line at the northern end of a complex of five volcanic cones. Eruptions date back to the late 18th century and have been characterized as small-to-moderate explosions from the summit crater, accompanied by intense fumarolic activity. The current eruption period began in June 2022 and has recently consisted of frequent explosions, ash plumes, and thermal activity (BGVN 47:10). This report covers similar activity during October 2022 through May 2023, based on information from the Kamchatka Volcanic Eruptions Response Team (KVERT) and satellite data.
Activity during October consisted of explosive activity, ash plumes, and occasional thermal anomalies. Visual data by volcanologists from Severo-Kurilsk showed explosions producing ash clouds up to 2.1-3 km altitude which drifted E, N, NE, and SE during 1-8, 10, 16, and 18 October. KVERT issued several Volcano Observatory Notices for Aviation (VONA) on 7, 13-15, and 27 October 2022, stating that explosions generated ash plumes that rose to 2.3-4 km altitude and drifted 5 km E, NE, and SE. Ashfall was reported in Severo-Kurilsk (Paramushir Island, about 7 km E) on 7 and 13 October. Satellite data showed a thermal anomaly over the volcano on 15-16 October. Visual data showed ash plumes rising to 2.5-3.6 km altitude on 22, 25-29, and 31 October and moving NE due to constant explosions.
Similar activity continued during November, with explosions, ash plumes, and ashfall occurring. KVERT issued VONAs on 1-2, 4, 6-7, 9, 13, and 16 November that reported explosions and resulting ash plumes that rose to 1.7-3.6 km altitude and drifted 3-5 km SE, ESE, E, and NE. On 1 November ash plumes extended as far as 110 km SE. On 5, 8, 12, and 24-25 November explosions and ash plumes rose to 2-3.1 km altitude and drifted N and E. Ashfall was observed in Severo-Kurilsk on 7 and 16 November. A thermal anomaly was visible during 1-4, 16, and 20 November. Explosions during 26 November rose as high as 2.7 km altitude and drifted NE (figure 45).
Explosions and ash plumes continued to occur in December. During 1-2 and 4 December volcanologists from Severo-Kurilsk observed explosions that sent ash to 1.9-2.5 km altitude and drifted NE and SE (figure 46). VONAs were issued on 5, 9, and 16 December reporting that explosions generated ash plumes rising to 1.9 km, 2.6 km, and 2.4 km altitude and drifted 5 km SE, E, and NE, respectively. A thermal anomaly was visible in satellite imagery on 16 December. On 18 and 27-28 December explosions produced ash plumes that rose to 2.5 km altitude and drifted NE and SE. On 31 December an ash plume rose to 2 km altitude and drifted NE.
Explosions continued during January 2023, based on visual observations by volcanologists from Severo-Kurilsk. During 1-7 January explosions generated ash plumes that rose to 4 km altitude and drifted NE, E, W, and SE. According to VONAs issued by KVERT on 2, 4, 10, and 23 January, explosions produced ash plumes that rose to 2-4 km altitude and drifted 5 km N, NE, E, and ENE; the ash plume that rose to 4 km altitude occurred on 10 January (figure 47). Satellite data showed a thermal anomaly during 3-4, 10, 13, 16, 21, 22, and 31 January. KVERT reported that an ash cloud on 4 January moved 12 km NE. On 6 and 9-11 January explosions sent ash plumes to 4.5 km altitude and drifted W and ESE. On 13 January an ash plume rose to 3 km altitude and drifted SE. During 20-24 January ash plumes from explosions rose to 3.7 km altitude and drifted SE, N, and NE. On 21 January the ash plume drifted as far as 40 km NE. During 28-29 and 31 January and 1 February ash plumes rose to 4 km altitude and drifted NE.
During February, explosions, ash plumes, and ashfall were reported. During 1, 4-5 and 7-8 February explosions generated ash plumes that rose to 4.5 km altitude and drifted E and NE; ashfall was observed on 5 and 8 February. On 6 February an explosion produced an ash plume that rose to 3 km altitude and drifted 7 km E, causing ashfall in Severo-Kurilsk. A thermal anomaly was visible in satellite data on 8, 9, 13, and 21 February. Explosions on 9 and 12-13 February produced ash plumes that rose to 4 km altitude and drifted E and NE; the ash cloud on 12 February extended as far as 45 km E. On 22 February explosions sent ash to 3 km altitude that drifted E. During 24 and 26-27 February ash plumes rose to 4 km altitude and drifted E. On 28 February an explosion sent ash to 2.5-3 km altitude and drifted 5 km E; ashfall was observed in Severo-Kurilsk.
Activity continued during March; visual observations showed that explosions generated ash plumes that rose to 3.6 km altitude on 3, 5-7, and 9-12 March and drifted E, NE, and NW. Thermal anomalies were visible on 10, 13, and 29-30 March in satellite imagery. On 18, 21-23, 26, and 29-30 March explosions produced ash plumes that rose to 2.8 km altitude and drifted NE and E; the ash plumes during 22-23 March extended up to 76 km E. A VONA issued on 21 March reported an explosion that produced an ash plume that rose to 2.8 km altitude and drifted 5 km E. Another VONA issued on 23 March reported that satellite data showed an ash plume rising to 3 km altitude and drifted 14 km E.
Explosions during April continued to generate ash plumes. On 1 and 4 April an ash plume rose to 2.8-3.5 km altitude and drifted SE and NE. A thermal anomaly was visible in satellite imagery during 1-6 April. Satellite data showed ash plumes and clouds rising to 2-3 km altitude and drifting up to 12 km SW and E on 3 and 6 April (figure 48). KVERT issued VONAs on 3, 5, 14, 16 April describing explosions that produced ash plumes rising to 3 km, 3.5 km, 3.5 km, and 3 km altitude and drifting 5 km S, 5 km NE and SE, 72 km NNE, and 5 km NE, respectively. According to satellite data, the resulting ash cloud from the explosion on 14 April was 25 x 7 km in size and drifted 72-104 km NNE during 14-15 April. According to visual data by volcanologists from Severo-Kurilsk explosions sent ash up to 3.5 km altitude that drifted NE and E during 15-16, 22, 25-26, and 29 April.
The explosive eruption continued during May. Explosions during 3-4, 6-7, and 9-10 May generated ash plumes that rose to 4 km altitude and drifted SW and E. Satellite data showed a thermal anomaly on 3, 9, 13-14, and 24 May. During 12-16, 23-25, and 27-28 May ash plumes rose to 3.5 km altitude and drifted in different directions due to explosions. Two VONA notices were issued on 16 and 25 May, describing explosions that generated ash plumes rising to 3 km and 3.5 km altitude, respectively and extending 5 km E. The ash cloud on 25 May drifted 75 km SE.
Thermal activity in the summit crater, occasionally accompanied by ash plumes and ash deposits on the SE and E flanks due to frequent explosions, were visible in infrared and true color satellite images (figure 49).
Geologic Background. The flat-topped summit of the central cone of Ebeko volcano, one of the most active in the Kuril Islands, occupies the northern end of Paramushir Island. Three summit craters located along a SSW-NNE line form Ebeko volcano proper, at the northern end of a complex of five volcanic cones. Blocky lava flows extend west from Ebeko and SE from the neighboring Nezametnyi cone. The eastern part of the southern crater contains strong solfataras and a large boiling spring. The central crater is filled by a lake about 20 m deep whose shores are lined with steaming solfataras; the northern crater lies across a narrow, low barrier from the central crater and contains a small, cold crescentic lake. Historical activity, recorded since the late-18th century, has been restricted to small-to-moderate explosive eruptions from the summit craters. Intense fumarolic activity occurs in the summit craters, on the outer flanks of the cone, and in lateral explosion craters.
Information Contacts: Kamchatka Volcanic Eruptions Response Team (KVERT), Far Eastern Branch, Russian Academy of Sciences, 9 Piip Blvd., Petropavlovsk-Kamchatsky, 683006, Russia (URL: http://www.kscnet.ru/ivs/kvert/); MIROVA (Middle InfraRed Observation of Volcanic Activity), a collaborative project between the Universities of Turin and Florence (Italy) supported by the Centre for Volcanic Risk of the Italian Civil Protection Department (URL: http://www.mirovaweb.it/); Copernicus Browser, Copernicus Data Space Ecosystem, European Space Agency (URL: https://dataspace.copernicus.eu/browser/).
Home Reef
Tonga
18.992°S, 174.775°W; summit elev. -10 m
All times are local (unless otherwise noted)
Discolored plumes continued during November 2022-April 2023
Home Reef is a submarine volcano located in the central Tonga islands between Lateiki (Metis Shoal) and Late Island. The first recorded eruption occurred in the mid-19th century, when an ephemeral island formed. An eruption in 1984 produced a 12-km-high eruption plume, a large volume of floating pumice, and an ephemeral island 500 x 1,500 m wide, with cliffs 30-50 m high that enclosed a water-filled crater. Another island-forming eruption in 2006 produced widespread pumice rafts that drifted as far as Australia; by 2008 the island had eroded below sea level. The previous eruption occurred during October 2022 and was characterized by a new island-forming eruption, lava effusion, ash plumes, discolored water, and gas-and-steam plumes (BGVN 47:11). This report covers discolored water plumes during November 2022 through April 2023 using satellite data.
Discolored plumes continued during the reporting period and were observed in true color satellite images on clear weather days. Satellite images show light green-yellow discolored water extending W on 8 and 28 November 2022 (figure 31), and SW on 18 November. Light green-yellow plumes extended W on 3 December, S on 13 December, SW on 18 December, and W and S on 23 December (figure 31). On 12 January 2023 discolored green-yellow plumes extended to the NE, E, SE, and N. The plume moved SE on 17 January and NW on 22 January. Faint discolored water in February was visible moving NE on 1 February. A discolored plume extended NW on 8 and 28 March and NW on 13 March (figure 31). During April, clear weather showed green-blue discolored plumes moving S on 2 April, W on 7 April, and NE and S on 12 April. A strong green-yellow discolored plume extended E and NE on 22 April for several kilometers (figure 31).
Geologic Background. Home Reef, a submarine volcano midway between Metis Shoal and Late Island in the central Tonga islands, was first reported active in the mid-19th century, when an ephemeral island formed. An eruption in 1984 produced a 12-km-high eruption plume, large amounts of floating pumice, and an ephemeral 500 x 1,500 m island, with cliffs 30-50 m high that enclosed a water-filled crater. In 2006 an island-forming eruption produced widespread dacitic pumice rafts that drifted as far as Australia. Another island was built during a September-October 2022 eruption.
Information Contacts: Copernicus Browser, Copernicus Data Space Ecosystem, European Space Agency (URL: https://dataspace.copernicus.eu/browser/).
Semisopochnoi (United States) — June 2023 Cite this Report
Semisopochnoi
United States
51.93°N, 179.58°E; summit elev. 1221 m
All times are local (unless otherwise noted)
Occasional explosions, ash deposits, and gas-and-steam plumes during December 2022-May 2023
Semisopochnoi is located in the western Aleutians, is 20-km-wide at sea level, and contains an 8-km-wide caldera. The three-peaked Mount Young (formerly Cerberus) was constructed within the caldera during the Holocene. Each of these peaks contains a summit crater; the lava flows on the N flank appear younger than those on the S side. The current eruption period began in early February 2021 and has more recently consisted of intermittent explosions and ash emissions (BGVN 47:12). This report updates activity during December 2022 through May 2023 using daily, weekly, and special reports from the Alaska Volcano Observatory (AVO). AVO monitors the volcano using local seismic and infrasound sensors, satellite data, web cameras, and remote infrasound and lightning networks.
Activity during most of December 2022 was relatively quiet; according to AVO no eruptive or explosive activity was observed since 7 November 2022. Intermittent tremor and occasional small earthquakes were observed in geophysical data. Continuous gas-and-steam emissions were observed from the N crater of Mount Young in webcam images on clear weather days (figure 25). On 24 December, there was a slight increase in earthquake activity and several small possible explosion signals were detected in infrasound data. Eruptive activity resumed on 27 December at the N crater of Mount Young; AVO issued a Volcano Activity Notice (VAN) that reported minor ash deposits on the flanks of Mount Young that extended as far as 1 km from the vent, according to webcam images taken during 27-28 December (figure 26). No ash plumes were observed in webcam or satellite imagery, but a persistent gas-and-steam plume that might have contained some ash rose to 1.5 km altitude. As a result, AVO raised the Aviation Color Code (ACC) to Orange (the second highest level on a four-color scale) and the Volcano Alert Level (VAL) to Watch (the second highest level on a four-level scale). Possible explosions were detected during 21 December 2022 through 1 January 2023 and seismic tremor was recorded during 30-31 December.
During January 2023 eruptive activity continued at the active N crater of Mount Young. Minor ash deposits were observed on the flanks, extending about 2 km SSW, based on webcam images from 1 and 3 January. A possible explosion occurred during 1-2 January based on elevated seismicity recorded on local seismometers and an infrasound signal recorded minutes later by an array at Adak. Though no ash plumes were observed in webcam or satellite imagery, a persistent gas-and-steam plume rose to 1.5 km altitude that might have carried minor traces of ash. Ash deposits were accompanied by periods of elevated seismicity and infrasound signals from the local geophysical network, which AVO reported were likely due to weak explosive activity. Low-level explosive activity was also detected during 2-3 January, with minor gas-and-steam emissions and a new ash deposit that was visible in webcam images. Low-level explosive activity was detected in geophysical data during 4-5 January, with elevated seismicity and infrasound signals observed on local stations. Volcanic tremor was detected during 7-9 January and very weak explosive activity was detected in seismic and infrasound data on 9 January. Weak seismic and infrasound signals were recorded on 17 January, which indicated minor explosive activity, but no ash emissions were observed in clear webcam images; a gas-and-steam plume continued to rise to 1.5 km altitude. During 29-30 January, ash deposits near the summit were observed on fresh snow, according to webcam images.
The active N cone at Mount Young continued to produce a gas-and-steam plume during February, but no ash emissions or explosive events were detected. Seismicity remained elevated with faint tremor during early February. Gas-and-steam emissions from the N crater were observed in clear webcam images on 11-13 and 16 February; no explosive activity was detected in seismic, infrasound, or satellite data. Seismicity has also decreased, with no significant seismic tremor observed since 25 January. Therefore, the ACC was lowered to Yellow (the second lowest level on a four-color scale) and the VAL was lowered to Advisory (the second lowest level on a four-color scale) on 22 February.
Gas-and-steam emissions persisted during March from the N cone of Mount Young, based on clear webcam images. A few brief episodes of weak tremor were detected in seismic data, although seismicity decreased over the month. A gas-and-steam plume detected in satellite data extended 150 km on 18 March. Low-level ash emissions from the N cone at Mount Young were observed in several webcam images during 18-19 March, in addition to small explosions and volcanic tremor. The ACC was raised to Orange and the VAL increased to Watch on 19 March. A small explosion was detected in seismic and infrasound data on 21 March.
Low-level unrest continued during April, although cloudy weather often obscured views of the summit; periods of seismic tremor and local earthquakes were recorded. During 3-4 April a gas-and-steam plume was visible traveling more than 200 km overnight; no ash was evident in the plume, according to AVO. A gas-and-steam plume was observed during 4-6 April that extended 400 km but did not seem to contain ash. Small explosions were detected in seismic and infrasound data on 5 April. Occasional clear webcam images showed continuing gas-and-steam emissions rose from Mount Young, but no ash deposits were observed on the snow. On 19 April small explosions and tremor were detected in seismic and infrasound data. A period of seismic tremor was detected during 22-25 April, with possible weak explosions on 25 April. Ash deposits were visible near the crater rim, but it was unclear if these deposits were recent or due to older deposits.
Occasional small earthquakes were recorded during May, but there were no signs of explosive activity seen in geophysical data. Gas-and-steam emissions continued from the N crater of Mount Young, based on webcam images, and seismicity remained slightly elevated. A new, light ash deposit was visible during the morning of 5 May on fresh snow on the NW flank of Mount Young. During 10 May periods of volcanic tremor were observed. The ACC was lowered to Yellow and the VAL to Advisory on 17 May due to no additional evidence of activity.
Geologic Background. Semisopochnoi, the largest subaerial volcano of the western Aleutians, is 20 km wide at sea level and contains an 8-km-wide caldera. It formed as a result of collapse of a low-angle, dominantly basaltic volcano following the eruption of a large volume of dacitic pumice. The high point of the island is Anvil Peak, a double-peaked late-Pleistocene cone that forms much of the island's northern part. The three-peaked Mount Cerberus (renamed Mount Young in 2023) was constructed within the caldera during the Holocene. Each of the peaks contains a summit crater; lava flows on the N flank appear younger than those on the south side. Other post-caldera volcanoes include the symmetrical Sugarloaf Peak SSE of the caldera and Lakeshore Cone, a small cinder cone at the edge of Fenner Lake in the NE part of the caldera. Most documented eruptions have originated from Young, although Coats (1950) considered that both Sugarloaf and Lakeshore Cone could have been recently active.
Information Contacts: Alaska Volcano Observatory (AVO), a cooperative program of a) U.S. Geological Survey, 4200 University Drive, Anchorage, AK 99508-4667 USA (URL: https://avo.alaska.edu/), b) Geophysical Institute, University of Alaska, PO Box 757320, Fairbanks, AK 99775-7320, USA, and c) Alaska Division of Geological & Geophysical Surveys, 794 University Ave., Suite 200, Fairbanks, AK 99709, USA (URL: http://dggs.alaska.gov/).
Ambae
Vanuatu
15.389°S, 167.835°E; summit elev. 1496 m
All times are local (unless otherwise noted)
New lava flow, ash plumes, and sulfur dioxide plumes during February-May 2023
Ambae, also known as Aoba, is a large basaltic shield volcano in Vanuatu. A broad pyroclastic cone containing three crater lakes (Manaro Ngoru, Voui, and Manaro Lakua) is located at the summit within the youngest of at least two nested calderas. Periodic phreatic and pyroclastic explosions have been reported since the 16th century. A large eruption more than 400 years ago resulted in a volcanic cone within the summit crater that is now filled by Lake Voui; the similarly sized Lake Manaro fills the western third of the caldera. The previous eruption ended in August 2022 that was characterized by gas-and-steam and ash emissions and explosions of wet tephra (BGVN 47:10). This report covers a new eruption during February through May 2023 that consisted of a new lava flow, ash plumes, and sulfur dioxide emissions, using information from the Vanuatu Meteorology and Geo-Hazards Department (VMGD) and satellite data.
During the reporting period, the Alert Level remained at a 2 (on a scale of 0-5), which has been in place since December 2021. Activity during October 2022 through March 2023 remained relatively low and mostly consisted of gas-and-steam emissions in Lake Voui. VMGD reported that at 1300 on 15 November a satellite image captured a strong amount of sulfur dioxide rising above the volcano (figure 99), and that seismicity slightly increased. The southern and northern part of the island reported a strong sulfur dioxide smell and heard explosions. On 20 February 2023 a gas-and-ash plume rose 1.3 km above the summit and drifted SSW, according to a webcam image (figure 100). Gas-and-steam and possibly ash emissions continued on 23 February and volcanic earthquakes were recorded by the seismic network.
During April, volcanic earthquakes and gas-and-steam and ash emissions were reported from the cone in Lake Voui. VMGD reported that activity increased during 5-7 April; high gas-and-steam and ash plumes were visible, accompanied by nighttime incandescence. According to a Wellington VAAC report, a low-level ash plume rose as high as 2.5 km above the summit and drifted W and SW on 5 April, based on satellite imagery. Reports in Saratamata stated that a dark ash plume drifted to the WSW, but no loud explosion was heard. Webcam images from 2100 showed incandescence above the crater and reflected in the clouds. According to an aerial survey, field observations, and satellite data, water was no longer present in the lake. A lava flow was reported effusing from the vent and traveling N into the dry Lake Voui, which lasted three days. The next morning at 0745 on 6 April a gas-and-steam and ash plume rose 5.4 km above the summit and drifted ESE, based on information from VMGD (figure 101). The Wellington VAAC also reported that light ashfall was observed on the island. Intermittent gas-and-steam and ash emissions were visible on 7 April, some of which rose to an estimated 3 km above the summit and drifted E. Webcam images during 0107-0730 on 7 April showed continuing ash emissions. A gas-and-steam and ash plume rose 695 m above the summit crater at 0730 on 19 April and drifted ESE, based on a webcam image (figure 102).
According to visual and infrared satellite data, water was visible in Lake Voui as late as 24 March 2023 (figure 103). The vent in the caldera showed a gas-and-steam plume drifted SE. On 3 April thermal activity was first detected, accompanied by a gas-and-ash plume that drifted W (figure 103). The lava flow moved N within the dry lake and was shown cooling by 8 April. By 23 April much of the water in the lake had returned. Occasional sulfur dioxide plumes were detected by the TROPOMI instrument on the Sentinel-5P satellite that exceeded 2 Dobson Units (DU) and drifted in different directions (figure 104).
Geologic Background. The island of Ambae, also known as Aoba, is a massive 2,500 km3 basaltic shield that is the most voluminous volcano of the New Hebrides archipelago. A pronounced NE-SW-trending rift zone with numerous scoria cones gives the 16 x 38 km island an elongated form. A broad pyroclastic cone containing three crater lakes (Manaro Ngoru, Voui, and Manaro Lakua) is located at the summit within the youngest of at least two nested calderas, the largest of which is 6 km in diameter. That large central edifice is also called Manaro Voui or Lombenben volcano. Post-caldera explosive eruptions formed the summit craters about 360 years ago. A tuff cone was constructed within Lake Voui (or Vui) about 60 years later. The latest known flank eruption, about 300 years ago, destroyed the population of the Nduindui area near the western coast.
Information Contacts: Geo-Hazards Division, Vanuatu Meteorology and Geo-Hazards Department (VMGD), Ministry of Climate Change Adaptation, Meteorology, Geo-Hazards, Energy, Environment and Disaster Management, Private Mail Bag 9054, Lini Highway, Port Vila, Vanuatu (URL: http://www.vmgd.gov.vu/, https://www.facebook.com/VanuatuGeohazardsObservatory/); Wellington Volcanic Ash Advisory Centre (VAAC), Meteorological Service of New Zealand Ltd (MetService), PO Box 722, Wellington, New Zealand (URL: http://www.metservice.com/vaac/, http://www.ssd.noaa.gov/VAAC/OTH/NZ/messages.html); MIROVA (Middle InfraRed Observation of Volcanic Activity), a collaborative project between the Universities of Turin and Florence (Italy) supported by the Centre for Volcanic Risk of the Italian Civil Protection Department (URL: http://www.mirovaweb.it/); Global Sulfur Dioxide Monitoring Page, Atmospheric Chemistry and Dynamics Laboratory, NASA Goddard Space Flight Center (NASA/GSFC), 8800 Greenbelt Road, Goddard, Maryland, USA (URL: https://so2.gsfc.nasa.gov/); Copernicus Browser, Copernicus Data Space Ecosystem, European Space Agency (URL: https://dataspace.copernicus.eu/browser/).
Ibu
Indonesia
1.488°N, 127.63°E; summit elev. 1325 m
All times are local (unless otherwise noted)
Daily ash explosions continue, along with thermal anomalies in the crater, October 2022-May 2023
Persistent eruptive activity since April 2008 at Ibu, a stratovolcano on Indonesian’s Halmahera Island, has consisted of daily explosive ash emissions and plumes, along with observations of thermal anomalies (BGVN 47:04). The current eruption continued during October 2022-May 2023, described below, based on advisories issued by the Pusat Vulkanologi dan Mitigasi Bencana Geologi (PVMBG, also known as Indonesian Center for Volcanology and Geological Hazard Mitigation, CVGHM), daily reports by MAGMA Indonesia (a PVMBG platform), and the Darwin Volcanic Ash Advisory Centre (VAAC), and various satellite data. The Alert Level during the reporting period remained at 2 (on a scale of 1-4), except raised briefly to 3 on 27 May, and the public was warned to stay at least 2 km away from the active crater and 3.5 km away on the N side of the volcano.
According to MAGMA Indonesia, during October 2022-May 2023, daily gray-and-white ash plumes of variable densities rose 200-1,000 m above the summit and drifted in multiple directions. On 30 October and 11 November, plumes rose a maximum of 2 km and 1.5 km above the summit, respectively (figures 42 and 43). According to the Darwin VAAC, discrete ash emissions on 13 November rose to 2.1 km altitude, or 800 m above the summit, and drifted W, and multiple ash emissions on 15 November rose 1.4 km above the summit and drifted NE. Occasional larger ash explosions through May 2023 prompted PVMBG to issue Volcano Observatory Notice for Aviation (VONA) alerts (table 6); the Aviation Color Code remained at Orange throughout this period.
Table 6. Volcano Observatory Notice for Aviation (VONA) ash plume alerts for Ibu issued by PVMBG during October 2022-May 2023. Maximum height above the summit was estimated by a ground observer. VONAs in January-May 2023 all described the ash plumes as dense.
| Date |
Time (local) |
Max height above summit |
Direction |
| 17 Oct 2022 |
0858 |
800 m |
SW |
| 18 Oct 2022 |
1425 |
800 m |
S |
| 19 Oct 2022 |
2017 |
600 m |
SW |
| 21 Oct 2022 |
0916 |
800 m |
NW |
| 16 Jan 2023 |
1959 |
600 m |
NE |
| 22 Jan 2023 |
0942 |
1,000 m |
E |
| 29 Jan 2023 |
2138 |
1,000 m |
E |
| 10 May 2023 |
0940 |
800 m |
NW |
| 10 May 2023 |
2035 |
600 m |
E |
| 21 May 2023 |
2021 |
600 m |
W |
| 21 May 2023 |
2140 |
1,000 m |
W |
| 29 May 2023 |
1342 |
800 m |
N |
| 31 May 2023 |
1011 |
1,000 m |
SW |
Sentinel-2 L1C satellite images throughout the reporting period show two, sometimes three persistent thermal anomalies in the summit crater, with the most prominent hotspot from the top of a cone within the crater. Clear views were more common during March-April 2023, when a vent and lava flows on the NE flank of the intra-crater cone could be distinguished (figure 44). White-to-grayish emissions were also observed during brief periods when weather clouds allowed clear views.
The MIROVA space-based volcano hotspot detection system recorded almost daily thermal anomalies throughout the reporting period, though cloud cover often interfered with detections. Data from imaging spectroradiometers aboard NASA’s Aqua and Terra satellites and processed using the MODVOLC algorithm (MODIS-MODVOLC) recorded hotspots on one day during October 2022 and December 2022, two days in April 2023, three days in November 2022 and May 2023, and four days in March 2023.
Geologic Background. The truncated summit of Gunung Ibu stratovolcano along the NW coast of Halmahera Island has large nested summit craters. The inner crater, 1 km wide and 400 m deep, has contained several small crater lakes. The 1.2-km-wide outer crater is breached on the N, creating a steep-walled valley. A large cone grew ENE of the summit, and a smaller one to the WSW has fed a lava flow down the W flank. A group of maars is located below the N and W flanks. The first observed and recorded eruption was a small explosion from the summit crater in 1911. Eruptive activity began again in December 1998, producing a lava dome that eventually covered much of the floor of the inner summit crater along with ongoing explosive ash emissions.
Information Contacts: Pusat Vulkanologi dan Mitigasi Bencana Geologi (PVMBG, also known as Indonesian Center for Volcanology and Geological Hazard Mitigation, CVGHM), Jalan Diponegoro 57, Bandung 40122, Indonesia (URL: http://www.vsi.esdm.go.id/); MAGMA Indonesia (Multiplatform Application for Geohazard Mitigation and Assessment in Indonesia), Kementerian Energi dan Sumber Daya Mineral (URL: https://magma.esdm.go.id/v1); Copernicus Browser, Copernicus Data Space Ecosystem, European Space Agency (URL: https://dataspace.copernicus.eu/browser/); MIROVA (Middle InfraRed Observation of Volcanic Activity), a collaborative project between the Universities of Turin and Florence (Italy) supported by the Centre for Volcanic Risk of the Italian Civil Protection Department (URL: http://www.mirovaweb.it/); Hawai'i Institute of Geophysics and Planetology (HIGP) - MODVOLC Thermal Alerts System, School of Ocean and Earth Science and Technology (SOEST), Univ. of Hawai'i, 2525 Correa Road, Honolulu, HI 96822, USA (URL: http://modis.higp.hawaii.edu/).
Dukono
Indonesia
1.6992°N, 127.8783°E; summit elev. 1273 m
All times are local (unless otherwise noted)
Continuing ash emissions, SO2 plumes, and thermal signals during October 2022-May 2023
Dukono, a remote volcano on Indonesia’s Halmahera Island, has been erupting continuously since 1933, with frequent ash explosions and sulfur dioxide plumes (BGVN 46:11, 47:10). This activity continued during October 2022 through May 2023, based on reports from the Pusat Vulkanologi dan Mitigasi Bencana Geologi (PVMBG; also known as Indonesian Center for Volcanology and Geological Hazard Mitigation, CVGHM), the Darwin Volcanic Ash Advisory Centre (VAAC), and satellite data. During this period, the Alert Level remained at 2 (on a scale of 1-4) and the public was warned to remain outside of the 2-km exclusion zone. The highest reported plume of the period reached 9.4 km above the summit on 14 November 2022.
According to MAGMA Indonesia (a platform developed by PVMBG), white, gray, or dark plumes of variable densities were observed almost every day during the reporting period, except when fog obscured the volcano (figure 33). Plumes generally rose 25-450 m above the summit, but rose as high as 700-800 m on several days, somewhat lower than the maximum heights reached earlier in 2022 when plumes reached as high as 1 km. However, the Darwin VAAC reported that on 14 November 2022, a discrete ash plume rose 9.4 km above the summit (10.7 km altitude), accompanied by a strong hotspot and a sulfur dioxide signal observed in satellite imagery; a continuous ash plume that day and through the 15th rose to 2.1-2.4 km altitude and drifted NE.
Sentinel-2 images were obscured by weather clouds almost every viewing day during the reporting period. However, the few reasonably clear images showed a hotspot and white or gray emissions and plumes. Strong SO2 plumes from Dukono were present on many days during October 2022-May 2023, as detected using the TROPOMI instrument on the Sentinel-5P satellite (figure 34).
Geologic Background. Reports from this remote volcano in northernmost Halmahera are rare, but Dukono has been one of Indonesia's most active volcanoes. More-or-less continuous explosive eruptions, sometimes accompanied by lava flows, have occurred since 1933. During a major eruption in 1550 CE, a lava flow filled in the strait between Halmahera and the N-flank Gunung Mamuya cone. This complex volcano presents a broad, low profile with multiple summit peaks and overlapping craters. Malupang Wariang, 1 km SW of the summit crater complex, contains a 700 x 570 m crater that has also been active during historical time.
Information Contacts: Pusat Vulkanologi dan Mitigasi Bencana Geologi (PVMBG, also known as Indonesian Center for Volcanology and Geological Hazard Mitigation, CVGHM), Jalan Diponegoro 57, Bandung 40122, Indonesia (URL: http://www.vsi.esdm.go.id/); MAGMA Indonesia (Multiplatform Application for Geohazard Mitigation and Assessment in Indonesia), Kementerian Energi dan Sumber Daya Mineral (URL: https://magma.esdm.go.id/v1); Darwin Volcanic Ash Advisory Centre (VAAC), Bureau of Meteorology, Northern Territory Regional Office, PO Box 40050, Casuarina, NT 0811, Australia (URL: http://www.bom.gov.au/info/vaac/); NASA Global Sulfur Dioxide Monitoring Page, Atmospheric Chemistry and Dynamics Laboratory, NASA Goddard Space Flight Center (NASA/GSFC), 8800 Greenbelt Road, Goddard, Maryland, USA (URL: https://so2.gsfc.nasa.gov/); Sentinel Hub Playground (URL: https://www.sentinel-hub.com/explore/sentinel-playground).
Sabancaya
Peru
15.787°S, 71.857°W; summit elev. 5960 m
All times are local (unless otherwise noted)
Explosions, gas-and-ash plumes, and thermal activity persist during November 2022-April 2023
Sabancaya is located in Peru, NE of Ampato and SE of Hualca Hualca. Eruptions date back to 1750 and have been characterized by explosions, phreatic activity, ash plumes, and ashfall. The current eruption period began in November 2016 and has more recently consisted of daily explosions, gas-and-ash plumes, and thermal activity (BGVN 47:11). This report updates activity during November 2022 through April 2023 using information from Instituto Geophysico del Peru (IGP) that use weekly activity reports and various satellite data.
Intermittent low-to-moderate power thermal anomalies were reported by the MIROVA project during November 2022 through April 2023 (figure 119). There were few short gaps in thermal activity during mid-December 2022, late December-to-early January 2023, late January to mid-February, and late February. According to data recorded by the MODVOLC thermal algorithm, there were a total of eight thermal hotspots: three in November 2022, three in February 2023, one in March, and one in April. On clear weather days, some of this thermal anomaly was visible in infrared satellite imagery showing the active lava dome in the summit crater (figure 120). Almost daily moderate-to-strong sulfur dioxide plumes were recorded during the reporting period by the TROPOMI instrument on the Sentinel-5P satellite (figure 121). Many of these plumes exceeded 2 Dobson Units (DU) and drifted in multiple directions.
IGP reported that moderate activity during November and December 2022 continued; during November, an average number of explosions were reported each week: 30, 33, 36, and 35, and during December, it was 32, 40, 47, 52, and 67. Gas-and-ash plumes in November rose 3-3.5 km above the summit and drifted E, NE, SE, S, N, W, and SW. During December the gas-and-ash plumes rose 2-4 km above the summit and drifted in different directions. There were 1,259 volcanic earthquakes recorded during November and 1,693 during December. Seismicity also included volcano-tectonic-type events that indicate rock fracturing events. Slight inflation was observed in the N part of the volcano near Hualca Hualca (4 km N). Thermal activity was frequently reported in the crater at the active lava dome (figure 120).
Explosive activity continued during January and February 2023. The average number of explosions were reported each week during January (51, 50, 60, and 59) and February (43, 54, 51, and 50). Gas-and-ash plumes rose 1.6-2.9 km above the summit and drifted NW, SW, and W during January and rose 1.4-2.8 above the summit and drifted W, SW, E, SE, N, S, NW, and NE during February. IGP also detected 1,881 volcanic earthquakes during January and 1,661 during February. VT-type earthquakes were also reported. Minor inflation persisted near Hualca Hualca. Satellite imagery showed continuous thermal activity in the crater at the lava dome (figure 120).
During March, the average number of explosions each week was 46, 48, 31, 35, and 22 and during April, it was 29, 41, 31, and 27. Accompanying gas-and-ash plumes rose 1.7-2.6 km above the summit crater and drifted W, SW, NW, S, and SE during March. According to a Buenos Aires Volcano Ash Advisory Center (VAAC) notice, on 22 March at 1800 through 23 March an ash plume rose to 7 km altitude and drifted NW. By 0430 an ash plume rose to 7.6 km altitude and drifted W. On 24 and 26 March continuous ash emissions rose to 7.3 km altitude and drifted SW and on 28 March ash emissions rose to 7.6 km altitude. During April, gas-and-ash plumes rose 1.6-2.5 km above the summit and drifted W, SW, S, NW, NE, and E. Frequent volcanic earthquakes were recorded, with 1,828 in March and 1,077 in April, in addition to VT-type events. Thermal activity continued to be reported in the summit crater at the lava dome (figure 120).
Geologic Background. Sabancaya, located in the saddle NE of Ampato and SE of Hualca Hualca volcanoes, is the youngest of these volcanic centers and the only one to have erupted in historical time. The oldest of the three, Nevado Hualca Hualca, is of probable late-Pliocene to early Pleistocene age. The name Sabancaya (meaning "tongue of fire" in the Quechua language) first appeared in records in 1595 CE, suggesting activity prior to that date. Holocene activity has consisted of Plinian eruptions followed by emission of voluminous andesitic and dacitic lava flows, which form an extensive apron around the volcano on all sides but the south. Records of historical eruptions date back to 1750.
Information Contacts: Instituto Geofisico del Peru (IGP), Centro Vulcanológico Nacional (CENVUL), Calle Badajoz N° 169 Urb. Mayorazgo IV Etapa, Ate, Lima 15012, Perú (URL: https://www.igp.gob.pe/servicios/centro-vulcanologico-nacional/inicio); Buenos Aires Volcanic Ash Advisory Center (VAAC), Servicio Meteorológico Nacional-Fuerza Aérea Argentina, 25 de mayo 658, Buenos Aires, Argentina (URL: http://www.smn.gov.ar/vaac/buenosaires/inicio.php); MIROVA (Middle InfraRed Observation of Volcanic Activity), a collaborative project between the Universities of Turin and Florence (Italy) supported by the Centre for Volcanic Risk of the Italian Civil Protection Department (URL: http://www.mirovaweb.it/); Hawai'i Institute of Geophysics and Planetology (HIGP) - MODVOLC Thermal Alerts System, School of Ocean and Earth Science and Technology (SOEST), Univ. of Hawai'i, 2525 Correa Road, Honolulu, HI 96822, USA (URL: http://modis.higp.hawaii.edu/); NASA Global Sulfur Dioxide Monitoring Page, Atmospheric Chemistry and Dynamics Laboratory, NASA Goddard Space Flight Center (NASA/GSFC), 8800 Greenbelt Road, Goddard MD 20771, USA (URL: https://so2.gsfc.nasa.gov/); Copernicus Browser, Copernicus Data Space Ecosystem, European Space Agency (URL: https://dataspace.copernicus.eu/browser/).
Sheveluch
Russia
56.653°N, 161.36°E; summit elev. 3283 m
All times are local (unless otherwise noted)
Significant explosions destroyed part of the lava-dome complex during April 2023
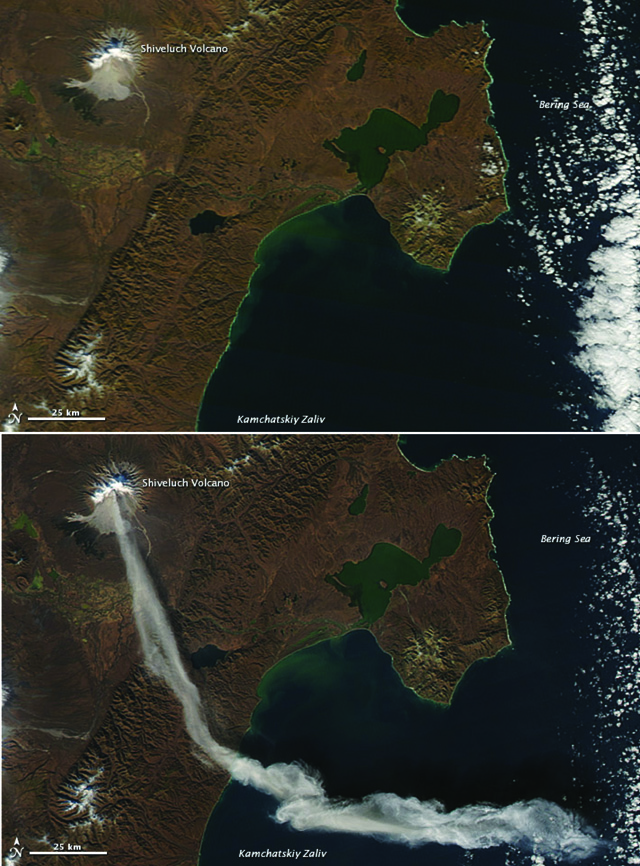
Sheveluch (also spelled Shiveluch) in Kamchatka, has had at least 60 large eruptions during the last 10,000 years. The summit is truncated by a broad 9-km-wide caldera that is breached to the S, and many lava domes occur on the outer flanks. The lava dome complex was constructed within the large open caldera. Frequent collapses of the dome complex have produced debris avalanches; the resulting deposits cover much of the caldera floor. A major south-flank collapse during a 1964 Plinian explosion produced a scarp in which a “Young Sheveluch” dome began to form in 1980. Repeated episodes of dome formation and destruction since then have produced major and minor ash plumes, pyroclastic flows, block-and-ash flows, and “whaleback domes” of spine-like extrusions in 1993 and 2020 (BGVN 45:11). The current eruption period began in August 1999 and has more recently consisted of lava dome growth, explosions, ash plumes, and avalanches (BGVN 48:01). This report covers a significant explosive eruption during early-to-mid-April 2023 that generated a 20 km altitude ash plume, produced a strong sulfur dioxide plume, and destroyed part of the lava-dome complex; activity described during January through April 2023 use information primarily from the Kamchatka Volcanic Eruptions Response Team (KVERT) and various satellite data.
Satellite data. Activity during the majority of this reporting period was characterized by continued lava dome growth, strong fumarole activity, explosions, and hot avalanches. According to the MODVOLC Thermal Alerts System, 140 hotspots were detected through the reporting period, with 33 recorded in January 2023, 29 in February, 44 in March, and 34 in April. Frequent strong thermal activity was recorded during January 2023 through April, according to the MIROVA (Middle InfraRed Observation of Volcanic Activity) graph and resulted from the continuously growing lava dome (figure 94). A slightly stronger pulse in thermal activity was detected in early-to-mid-April, which represented the significant eruption that destroyed part of the lava-dome complex. Thermal anomalies were also visible in infrared satellite imagery at the summit crater (figure 95).
During January 2023 KVERT reported continued growth of the lava dome, accompanied by strong fumarolic activity, incandescence from the lava dome, explosions, ash plumes, and avalanches. Satellite data showed a daily thermal anomaly over the volcano. Video data showed ash plumes associated with collapses at the dome that generated avalanches that in turn produced ash plumes rising to 3.5 km altitude and drifting 40 km W on 4 January and rising to 7-7.5 km altitude and drifting 15 km SW on 5 January. A gas-and-steam plume containing some ash that was associated with avalanches rose to 5-6 km altitude and extended 52-92 km W on 7 January. Explosions that same day produced ash plumes that rose to 7-7.5 km altitude and drifted 10 km W. According to a Volcano Observatory Notice for Aviation (VONA) issued at 1344 on 19 January, explosions produced an ash cloud that was 15 x 25 km in size and rose to 9.6-10 km altitude, drifting 21-25 km W; as a result, the Aviation Color Code (ACC) was raised to Red (the highest level on a four-color scale). Another VONA issued at 1635 reported that no more ash plumes were observed, and the ACC was lowered to Orange (the second highest level on a four-color scale). On 22 January an ash plume from collapses and avalanches rose to 5 km altitude and drifted 25 km NE and SW; ash plumes associated with collapses extended 70 km NE on 27 and 31 January.
Lava dome growth, fumarolic activity, dome incandescence, and occasional explosions and avalanches continued during February and March. A daily thermal anomaly was visible in satellite data. Explosions on 1 February generated ash plumes that rose to 6.3-6.5 km altitude and extended 15 km NE. Video data showed an ash cloud from avalanches rising to 5.5 km altitude and drifting 5 km SE on 2 February. Satellite data showed gas-and-steam plumes containing some ash rose to 5-5.5 km altitude and drifted 68-110 km ENE and NE on 6 February, to 4.5-5 km altitude and drifted 35 km WNW on 22 February, and to 3.7-4 km altitude and drifted 47 km NE on 28 February. Scientists from the Kamchatka Volcanological Station (KVS) went on a field excursion on 25 February to document the growing lava dome, and although it was cloudy most of the day, nighttime incandescence was visible. Satellite data showed an ash plume extending up to 118 km E during 4-5 March. Video data from 1150 showed an ash cloud from avalanches rose to 3.7-5.5 km altitude and drifted 5-10 km ENE and E on 5 March. On 11 March an ash plume drifted 62 km E. On 27 March ash plumes rose to 3.5 km altitude and drifted 100 km E. Avalanches and constant incandescence at the lava dome was focused on the E and NE slopes on 28 March. A gas-and-steam plume containing some ash rose to 3.5 km altitude and moved 40 km E on 29 March. Ash plumes on 30 March rose to 3.5-3.7 km altitude and drifted 70 km NE.
Similar activity continued during April, with lava dome growth, strong fumarolic activity, incandescence in the dome, occasional explosions, and avalanches. A thermal anomaly persisted throughout the month. During 1-4 April weak ash plumes rose to 2.5-3 km altitude and extended 13-65 km SE and E.
Activity during 11 April 2023. The Institute of Volcanology and Seismology, Far Eastern Branch, Russian Academy of Sciences (IVS FEB RAS) reported a significant increase in seismicity around 0054 on 11 April, as reported by strong explosions detected on 11 April beginning at 0110 that sent ash plumes up to 7-10 km altitude and extended 100-435 km W, WNW, NNW, WSW, and SW. According to a Tokyo VAAC report the ash plume rose to 15.8 km altitude. By 0158 the plume extended over a 75 x 100 km area. According to an IVS FEB RAS report, the eruptive column was not vertical: the initial plume at 0120 on 11 April deviated to the NNE, at 0000 on 12 April, it drifted NW, and by 1900 it drifted SW. KVS reported that significant pulses of activity occurred at around 0200, 0320, and then a stronger phase around 0600. Levin Dmitry took a video from near Békés (3 km away) at around 0600 showing a rising plume; he also reported that a pyroclastic flow traveled across the road behind him as he left the area. According to IVS FEB RAS, the pyroclastic flow traveled several kilometers SSE, stopping a few hundred meters from a bridge on the road between Klyuchi and Petropavlovsk-Kamchatsky.
Ashfall was first observed in Klyuchi (45 km SW) at 0630, and a large, black ash plume blocked light by 0700. At 0729 KVERT issued a Volcano Observatory Notice for Aviation (VONA) raising the Aviation Color Code to Red (the highest level on a four-color scale). It also stated that a large ash plume had risen to 10 km altitude and drifted 100 km W. Near-constant lightning strikes were reported in the plume and sounds like thunderclaps were heard until about 1000. According to IVS FEB RAS the cloud was 200 km long and 76 km wide by 0830, and was spreading W at altitudes of 6-12 km. In the Klyuchi Village, the layer of both ash and snow reached 8.5 cm (figure 96); ashfall was also reported in Kozyrevsk (112 km SW) at 0930, Mayskoye, Anavgay, Atlasovo, Lazo, and Esso. Residents in Klyuchi reported continued darkness and ashfall at 1100. In some areas, ashfall was 6 cm deep and some residents reported dirty water coming from their plumbing. According to IVS FEB RAS, an ash cloud at 1150 rose to 5-20 km altitude and was 400 km long and 250 km wide, extending W. A VONA issued at 1155 reported that ash had risen to 10 km and drifted 340 km NNW and 240 km WSW. According to Simon Carn (Michigan Technological University), about 0.2 Tg of sulfur dioxide in the plume was measured in a satellite image from the TROPOMI instrument on the Sentinel-5P satellite acquired at 1343 that covered an area of about 189,000 km2 (figure 97). Satellite data at 1748 showed an ash plume that rose to 8 km altitude and drifted 430 km WSW and S, according to a VONA.
Activity during 12-15 April 2023. On 12 April at 0730 satellite images showed ash plumes rose to 7-8 km altitude and extended 600 km SW, 1,050 km ESE, and 1,300-3,000 km E. By 1710 that day, the explosions weakened. According to news sources, the ash-and-gas plumes drifted E toward the Aleutian Islands and reached the Gulf of Alaska by 13 April, causing flight disruptions. More than 100 flights involving Alaska airspace were cancelled due to the plume. Satellite data showed ash plumes rising to 4-5.5 km altitude and drifted 400-415 km SE and ESE on 13 April. KVS volcanologists observed the pyroclastic flow deposits and noted that steam rose from downed, smoldering trees. They also noted that the deposits were thin with very few large fragments, which differed from previous flows. The ash clouds traveled across the Pacific Ocean. Flight cancellations were also reported in NW Canada (British Columbia) during 13-14 April. During 14-15 April ash plumes rose to 6 km altitude and drifted 700 km NW.
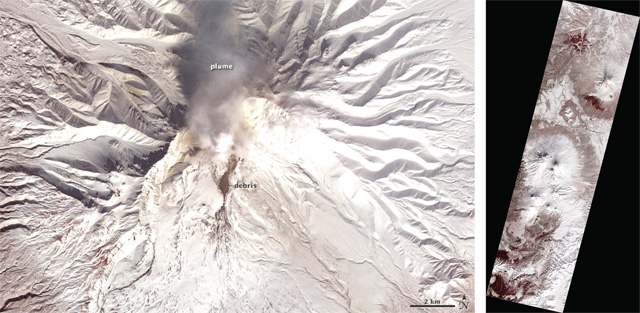
Alaskan flight schedules were mostly back to normal by 15 April, with only minor delays and far less cancellations; a few cancellations continued to be reported in Canada. Clear weather on 15 April showed that most of the previous lava-dome complex was gone and a new crater roughly 1 km in diameter was observed (figure 98); gas-and-steam emissions were rising from this crater. Evidence suggested that there had been a directed blast to the SE, and pyroclastic flows traveled more than 20 km. An ash plume rose to 4.5-5.2 km altitude and drifted 93-870 km NW on 15 April.
Activity during 16-30 April 2023. Resuspended ash was lifted by the wind from the slopes and rose to 4 km altitude and drifted 224 km NW on 17 April. KVERT reported a plume of resuspended ash from the activity during 10-13 April on 19 April that rose to 3.5-4 km altitude and drifted 146-204 km WNW. During 21-22 April a plume stretched over the Scandinavian Peninsula. A gas-and-steam plume containing some ash rose to 3-3.5 km altitude and drifted 60 km SE on 30 April. A possible new lava dome was visible on the W slope of the volcano on 29-30 April (figure 99); satellite data showed two thermal anomalies, a bright one over the existing lava dome and a weaker one over the possible new one.
References. Girina, O., Loupian, E., Horvath, A., Melnikov, D., Manevich, A., Nuzhdaev, A., Bril, A., Ozerov, A., Kramareva, L., Sorokin, A., 2023, Analysis of the development of the paroxysmal eruption of Sheveluch volcano on April 10–13, 2023, based on data from various satellite systems, ??????????? ???????? ??? ?? ???????, 20(2).
Geologic Background. The high, isolated massif of Sheveluch volcano (also spelled Shiveluch) rises above the lowlands NNE of the Kliuchevskaya volcano group. The 1,300 km3 andesitic volcano is one of Kamchatka's largest and most active volcanic structures, with at least 60 large eruptions during the Holocene. The summit of roughly 65,000-year-old Stary Shiveluch is truncated by a broad 9-km-wide late-Pleistocene caldera breached to the south. Many lava domes occur on its outer flanks. The Molodoy Shiveluch lava dome complex was constructed during the Holocene within the large open caldera; Holocene lava dome extrusion also took place on the flanks of Stary Shiveluch. Widespread tephra layers from these eruptions have provided valuable time markers for dating volcanic events in Kamchatka. Frequent collapses of dome complexes, most recently in 1964, have produced debris avalanches whose deposits cover much of the floor of the breached caldera.
Information Contacts: Kamchatka Volcanic Eruptions Response Team (KVERT), Far Eastern Branch, Russian Academy of Sciences, 9 Piip Blvd., Petropavlovsk-Kamchatsky, 683006, Russia (URL: http://www.kscnet.ru/ivs/kvert/); Institute of Volcanology and Seismology, Far Eastern Branch, Russian Academy of Sciences (IVS FEB RAS), 9 Piip Blvd., Petropavlovsk-Kamchatsky 683006, Russia (URL: http://www.kscnet.ru/ivs/eng/); Kamchatka Volcanological Station, Kamchatka Branch of Geophysical Survey, (KB GS RAS), Klyuchi, Kamchatka Krai, Russia (URL: http://volkstat.ru/); Hawai'i Institute of Geophysics and Planetology (HIGP) - MODVOLC Thermal Alerts System, School of Ocean and Earth Science and Technology (SOEST), Univ. of Hawai'i, 2525 Correa Road, Honolulu, HI 96822, USA (URL: http://modis.higp.hawaii.edu/); MIROVA (Middle InfraRed Observation of Volcanic Activity), a collaborative project between the Universities of Turin and Florence (Italy) supported by the Centre for Volcanic Risk of the Italian Civil Protection Department (URL: http://www.mirovaweb.it/); Copernicus Browser, Copernicus Data Space Ecosystem, European Space Agency (URL: https://dataspace.copernicus.eu/browser/); Kam 24 News Agency, 683032, Kamchatka Territory, Petropavlovsk-Kamchatsky, Vysotnaya St., 2A (URL: https://kam24.ru/news/main/20230411/96657.html#.Cj5Jrky6.dpuf); Simon Carn, Geological and Mining Engineering and Sciences, Michigan Technological University, 1400 Townsend Drive, Houghton, MI 49931, USA (URL: http://www.volcarno.com/, Twitter: @simoncarn).
Bezymianny
Russia
55.972°N, 160.595°E; summit elev. 2882 m
All times are local (unless otherwise noted)
Explosions, ash plumes, lava flows, and avalanches during November 2022-April 2023
Bezymianny is located on the Kamchatka Peninsula of Russia as part of the Klyuchevskoy volcano group. Historic eruptions began in 1955 and have been characterized by dome growth, explosions, pyroclastic flows, ash plumes, and ashfall. During the 1955-56 eruption a large open crater was formed by collapse of the summit and an associated lateral blast. Subsequent episodic but ongoing lava-dome growth, accompanied by intermittent explosive activity and pyroclastic flows, has largely filled the 1956 crater. The current eruption period began in December 2016 and more recent activity has consisted of strong explosions, ash plumes, and thermal activity (BGVN 47:11). This report covers activity during November 2022 through April 2023, based on weekly and daily reports from the Kamchatka Volcano Eruptions Response Team (KVERT) and satellite data.
Activity during November and March 2023 was relatively low and mostly consisted of gas-and-steam emissions, occasional small collapses that generated avalanches along the lava dome slopes, and a persistent thermal anomaly over the volcano that was observed in satellite data on clear weather days. According to the Tokyo VAAC and KVERT, an explosion produced an ash plume that rose to 6 km altitude and drifted 25 km NE at 1825 on 29 March.
Gas-and-steam emissions, collapses generating avalanches, and thermal activity continued during April. According to two Volcano Observatory Notice for Aviation (VONA) issued on 2 and 6 April (local time) ash plumes rose to 3 km and 3.5-3.8 km altitude and drifted 35 km E and 140 km E, respectively. Satellite data from KVERT showed weak ash plumes extending up to 550 km E on 2 and 5-6 April.
A VONA issued at 0843 on 7 April described an ash plume that rose to 4.5-5 km altitude and drifted 250 km ESE. Later that day at 1326 satellite data showed an ash plume that rose to 5.5-6 km altitude and drifted 150 km ESE. A satellite image from 1600 showed an ash plume extending as far as 230 km ESE; KVERT noted that ash emissions were intensifying, likely due to avalanches from the growing lava dome. The Aviation Color Code (ACC) was raised to Red (the highest level on a four-color scale). At 1520 satellite data showed an ash plume rising to 5-5.5 km altitude and drifting 230 km ESE. That same day, Kamchatka Volcanological Station (KVS) volcanologists traveled to Ambon to collect ash; they reported that a notable eruption began at 1730, and within 20 minutes a large ash plume rose to 10 km altitude and drifted NW. KVERT reported that the strong explosive phase began at 1738. Video and satellite data taken at 1738 showed an ash plume that rose to 10-12 km altitude and drifted up to 2,800 km SE and E. Explosions were clearly audible 20 km away for 90 minutes, according to KVS. Significant amounts of ash fell at the Apakhonchich station, which turned the snow gray; ash continued to fall until the morning of 8 April. In a VONA issued at 0906 on 8 April, KVERT stated that the explosive eruption had ended; ash plumes had drifted 2,000 km E. The ACC was lowered to Orange (the third highest level on a four-color scale). The KVS team saw a lava flow on the active dome once the conditions were clear that same day (figure 53). On 20 April lava dome extrusion was reported; lava flows were noted on the flanks of the dome, and according to KVERT satellite data, a thermal anomaly was observed in the area. The ACC was lowered to Yellow (the second lowest on a four-color scale).
Satellite data showed an increase in thermal activity beginning in early April 2023. A total of 31 thermal hotspots were detected by the MODVOLC thermal algorithm on 4, 5, 7, and 12 April 2023. The elevated thermal activity resulted from an increase in explosive activity and the start of an active lava flow. The MIROVA (Middle InfraRed Observation of Volcanic Activity) volcano hotspot detection system based on the analysis of MODIS data also showed a pulse in thermal activity during the same time (figure 54). Infrared satellite imagery captured a continuous thermal anomaly at the summit crater, often accompanied by white gas-and-steam emissions (figure 55). On 4 April 2023 an active lava flow was observed descending the SE flank.
Geologic Background. The modern Bezymianny, much smaller than its massive neighbors Kamen and Kliuchevskoi on the Kamchatka Peninsula, was formed about 4,700 years ago over a late-Pleistocene lava-dome complex and an edifice built about 11,000-7,000 years ago. Three periods of intensified activity have occurred during the past 3,000 years. The latest period, which was preceded by a 1,000-year quiescence, began with the dramatic 1955-56 eruption. This eruption, similar to that of St. Helens in 1980, produced a large open crater that was formed by collapse of the summit and an associated lateral blast. Subsequent episodic but ongoing lava-dome growth, accompanied by intermittent explosive activity and pyroclastic flows, has largely filled the 1956 crater.
Information Contacts: Kamchatka Volcanic Eruptions Response Team (KVERT), Far Eastern Branch, Russian Academy of Sciences, 9 Piip Blvd., Petropavlovsk-Kamchatsky, 683006, Russia (URL: http://www.kscnet.ru/ivs/kvert/); Kamchatka Volcanological Station, Kamchatka Branch of Geophysical Survey, (KB GS RAS), Klyuchi, Kamchatka Krai, Russia (URL: http://volkstat.ru/); Hawai'i Institute of Geophysics and Planetology (HIGP) - MODVOLC Thermal Alerts System, School of Ocean and Earth Science and Technology (SOEST), Univ. of Hawai'i, 2525 Correa Road, Honolulu, HI 96822, USA (URL: http://modis.higp.hawaii.edu/); MIROVA (Middle InfraRed Observation of Volcanic Activity), a collaborative project between the Universities of Turin and Florence (Italy) supported by the Centre for Volcanic Risk of the Italian Civil Protection Department (URL: http://www.mirovaweb.it/); Copernicus Browser, Copernicus Data Space Ecosystem, European Space Agency (URL: https://dataspace.copernicus.eu/browser/).
Chikurachki
Russia
50.324°N, 155.461°E; summit elev. 1781 m
All times are local (unless otherwise noted)
New explosive eruption during late January-early February 2023
Chikurachki, located on Paramushir Island in the northern Kuriles, has had Plinian eruptions during the Holocene. Lava flows have reached the sea and formed capes on the NW coast; several young lava flows are also present on the E flank beneath a scoria deposit. Reported eruptions date back to 1690, with the most recent eruption period occurring during January through October 2022, characterized by occasional explosions, ash plumes, and thermal activity (BGVN 47:11). This report covers a new eruptive period during January through February 2023 that consisted of ash explosions and ash plumes, based on information from the Kamchatka Volcanic Eruptions Response Team (KVERT) and satellite data.
According to reports from KVERT, an explosive eruption began around 0630 on 29 January. Explosions generated ash plumes that rose to 3-3.5 km altitude and drifted 6-75 km SE and E, based on satellite data. As a result, the Aviation Color Code (ACC) was raised to Orange (the second highest level on a four-color scale). At 1406 and 1720 ash plumes were identified in satellite images that rose to 4.3 km altitude and extended 70 km E. By 2320 the ash plume had dissipated. A thermal anomaly was visible at the volcano on 31 January, according to a satellite image, and an ash plume was observed drifting 66 km NE.
Occasional explosions and ash plumes continued during early February. At 0850 on 1 February an ash plume rose to 3.5 km altitude and drifted 35 km NE. Satellite data showed an ash plume that rose to 3.2-3.5 km altitude and drifted 50 km NE at 1222 later that day (figure 22). A thermal anomaly was detected over the volcano during 5-6 February and ash plumes drifted as far as 125 km SE, E, and NE. Explosive events were reported at 0330 on 6 February that produced ash plumes rising to 4-4.5 km altitude and drifting 72-90 km N, NE, and ENE. KVERT noted that the last gas-and steam plume that contained some ash was observed on 8 February and drifted 55 km NE before the explosive eruption ended. The ACC was lowered to Yellow and then Green (the lowest level on a four-color scale) on 18 February.
Geologic Background. Chikurachki, the highest volcano on Paramushir Island in the northern Kuriles, is a relatively small cone constructed on a high Pleistocene edifice. Oxidized basaltic-to-andesitic scoria deposits covering the upper part of the young cone give it a distinctive red color. Frequent basaltic Plinian eruptions have occurred during the Holocene. Lava flows have reached the sea and formed capes on the NW coast; several young lava flows are also present on the E flank beneath a scoria deposit. The Tatarinov group of six volcanic centers is located immediately to the south, and the Lomonosov cinder cone group, the source of an early Holocene lava flow that reached the saddle between it and Fuss Peak to the west, lies at the southern end of the N-S-trending Chikurachki-Tatarinov complex. In contrast to the frequently active Chikurachki, the Tatarinov centers are extensively modified by erosion and have a more complex structure. Tephrochronology gives evidence of an eruption around 1690 CE from Tatarinov, although its southern cone contains a sulfur-encrusted crater with fumaroles that were active along the margin of a crater lake until 1959.
Information Contacts: Kamchatka Volcanic Eruptions Response Team (KVERT), Far East Division, Russian Academy of Sciences, 9 Piip Blvd., Petropavlovsk-Kamchatsky, 683006, Russia (URL: http://www.kscnet.ru/ivs/); Copernicus Browser, Copernicus Data Space Ecosystem, European Space Agency (URL: https://dataspace.copernicus.eu/browser/).
Search Bulletin Archive by Publication Date
Select a month and year from the drop-downs and click "Show Issue" to have that issue displayed in this tab.
The default month and year is the latest issue available.
Bulletin of the Global Volcanism Network - Volume 38, Number 04 (April 2013)
Managing Editor: Richard Wunderman
Colima (Mexico)
Microearthquakes leading to January 2013 explosions ending 18 month calm
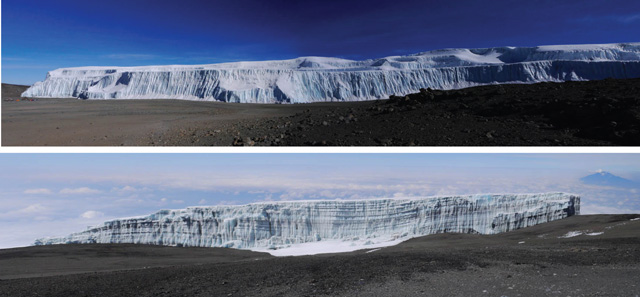
Kilimanjaro (Tanzania)
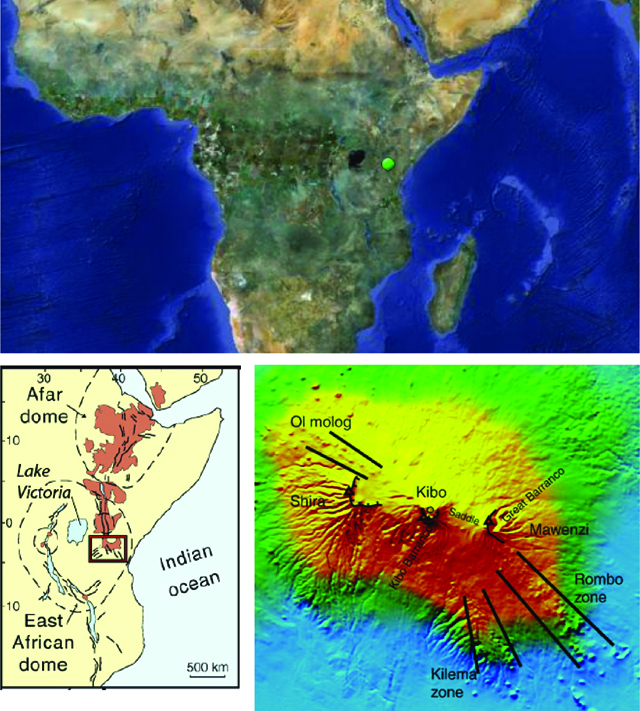
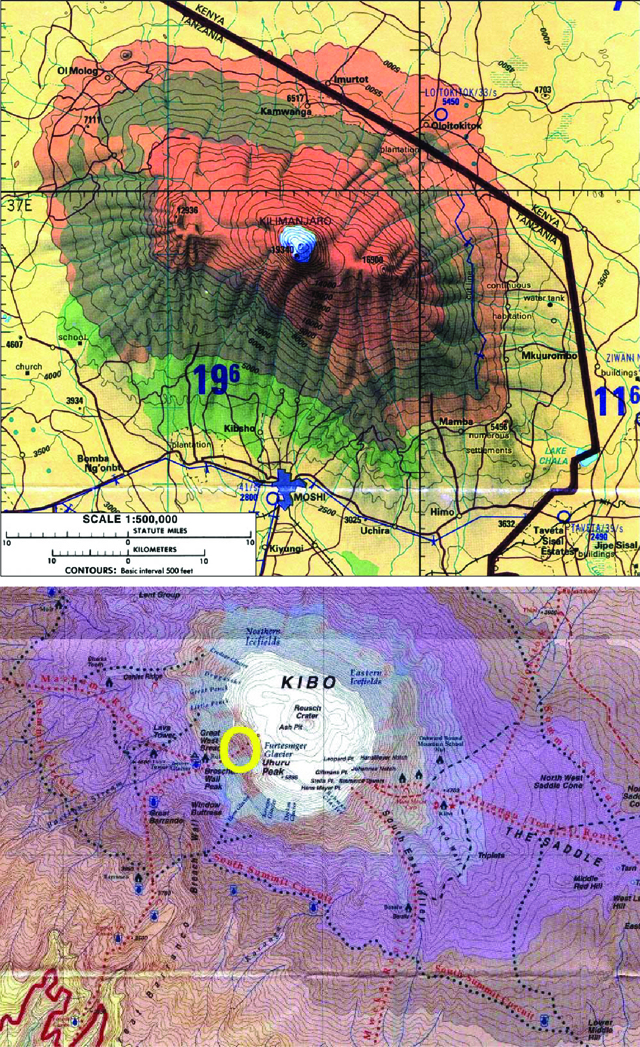
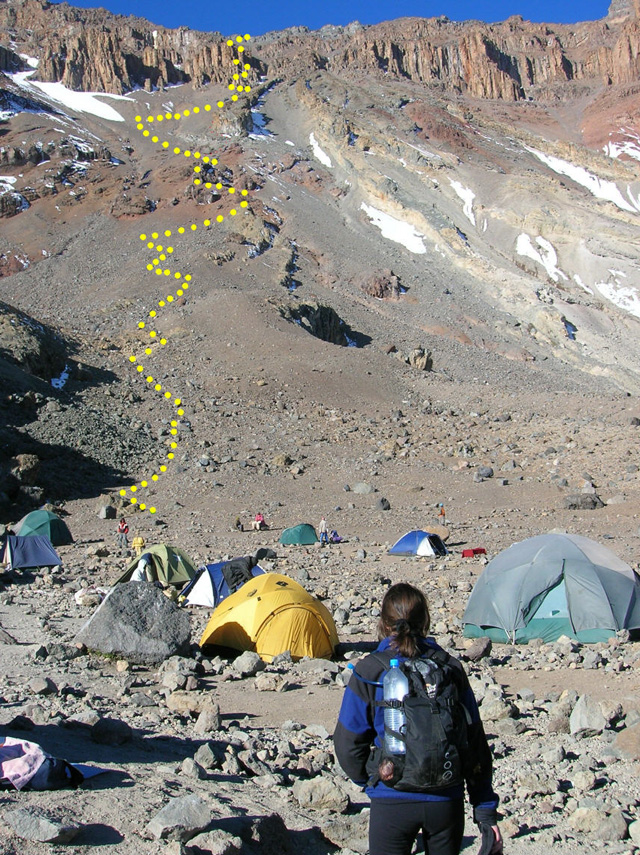
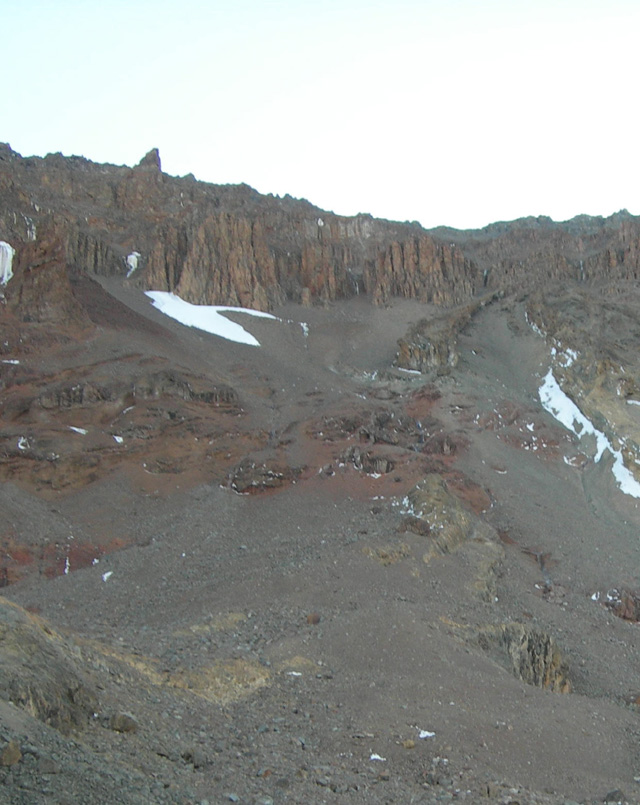
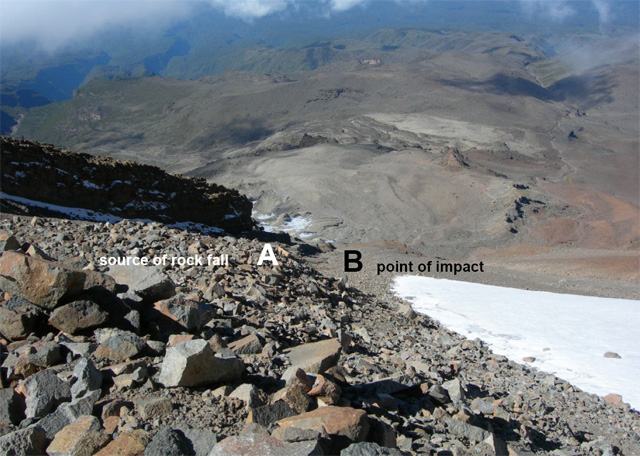
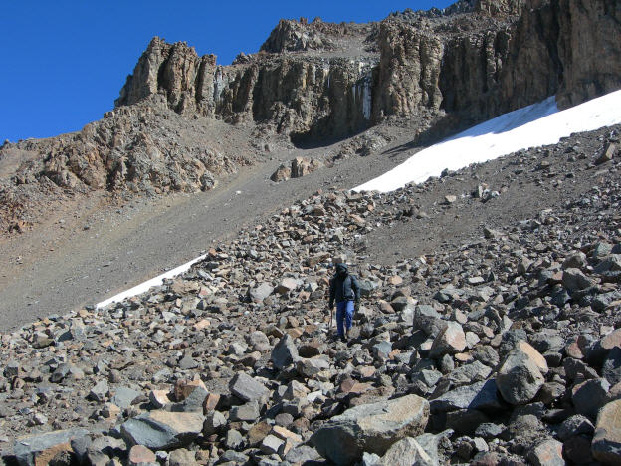
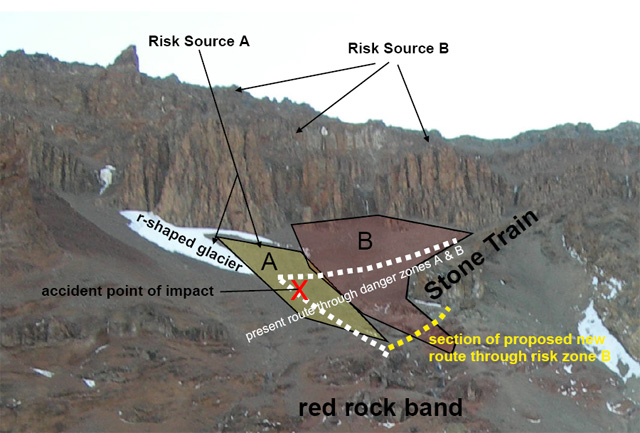
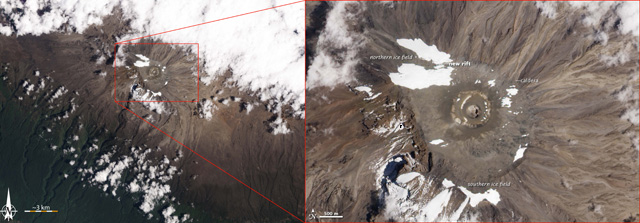
2006 rockfall takes climbers' lives; 165 my minimum age; glacial retreat; economic value
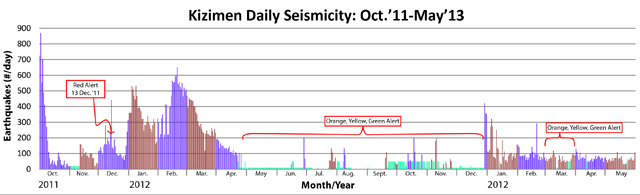
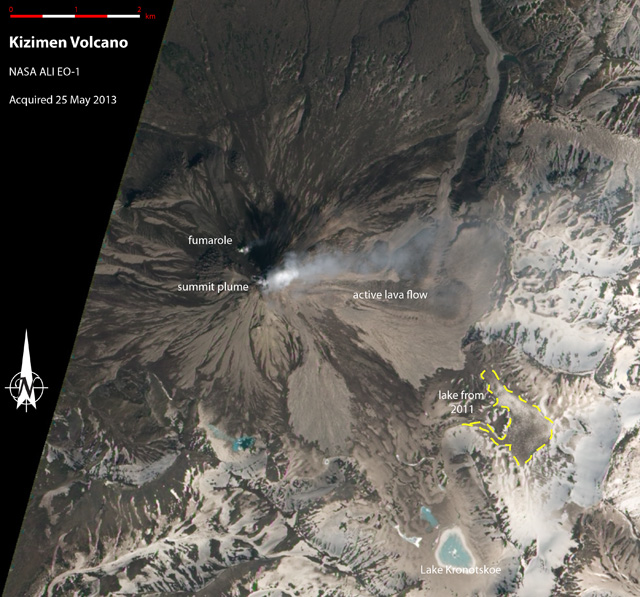
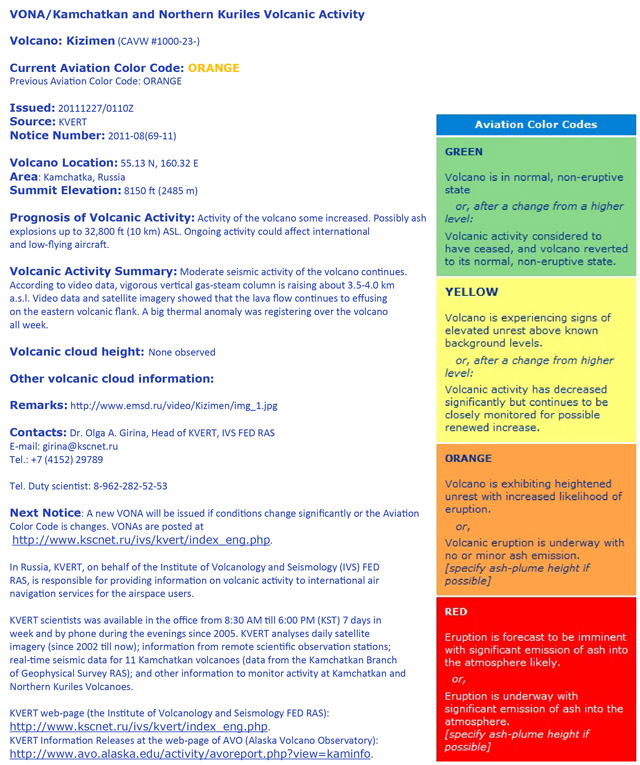
Kizimen (Russia)
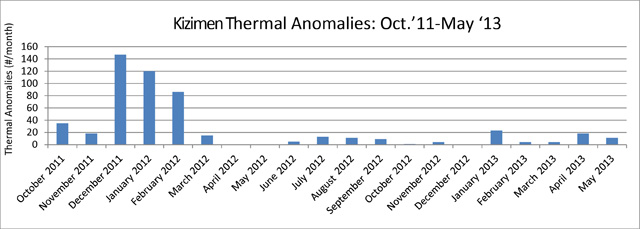
Active lava flows and ash emissions during October 2011-May 2013
Mayon (Philippines)
Mainly calm during 2009-2013; 7 May 2013 explosion kills five climbers
Seulawah Agam (Indonesia)
Alert Level raised due to increased seismicity in January 2013
Sheveluch (Russia)
Dome growth and volcanic activity continues
Sinabung (Indonesia)
Two simultaneous ash plumes from adjacent vents on 30 August 2010
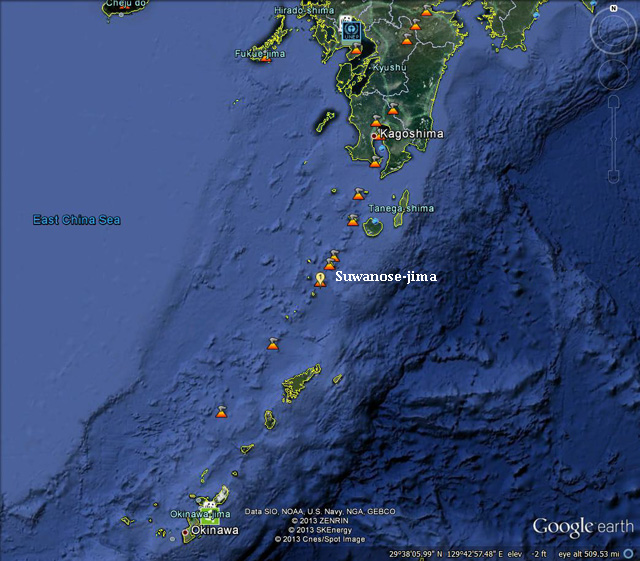
Suwanosejima (Japan)
Near continuous tremor between July 2012 and March 2013
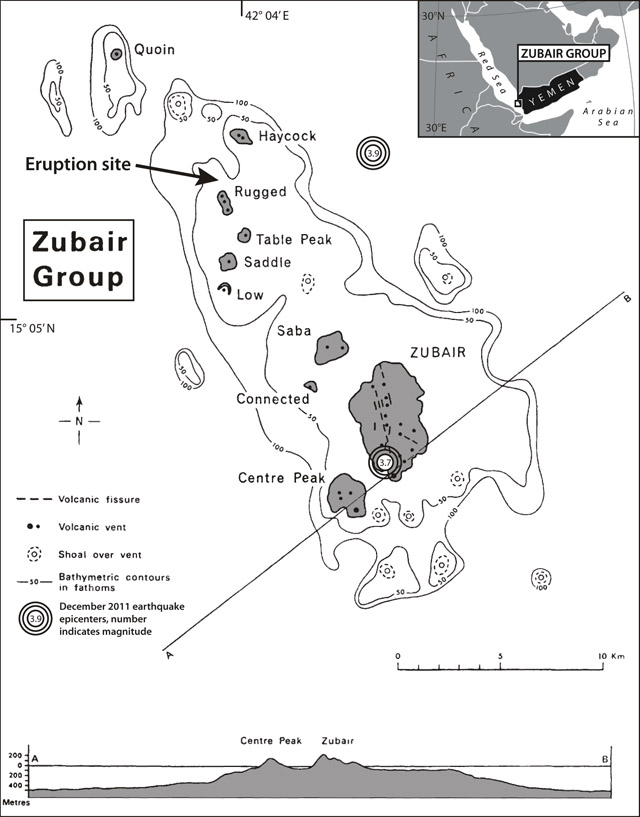
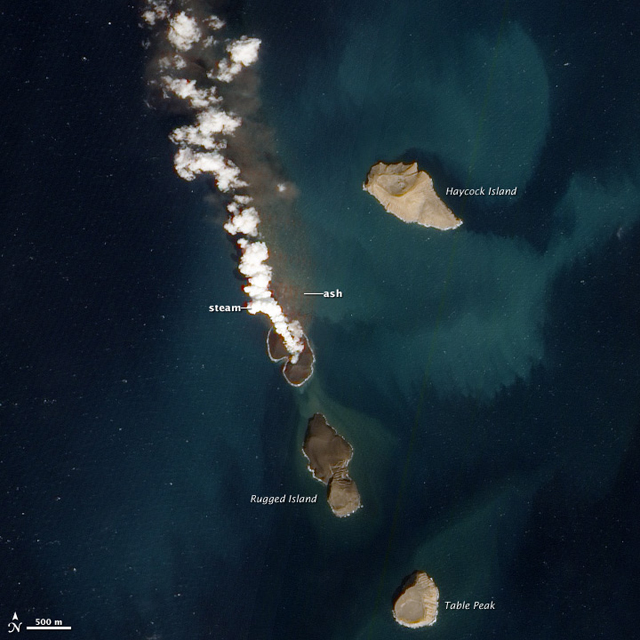
Zubair Group (Yemen)
Eruption on new island continues into January 2012
Colima
Mexico
19.514°N, 103.62°W; summit elev. 3850 m
All times are local (unless otherwise noted)
Microearthquakes leading to January 2013 explosions ending 18 month calm
One and a half years of calm at Colima volcano ended after explosive events starting on 6 January 2013. A sequence of January explosions cored out the previous dome and generated pyroclastic flows that reached 2.8 km W of the dome. As discussed in our previous report (BGVN 36:03) the 1998-2011 effusive-to-explosive eruption at Colima ended in June 2011, leaving in the crater an andesitic lava dome constructed during 2007-2011 extrusions stage (see BGVN 36:03). During the subsequent 1.5 years of calm, seismicity dropped and all visible signs of dome growth ceased.
We begin with an abstract that describes the end date of the previous eruptive 2007-2011 interval: 21 June 2011. Next we present a synthesis of a new series of eruption that started in 2013, sent to us in a report from the Colima Volcano Observatory, a report emphasizing both morphologic changes to the dome as a result of the January 2013 explosions and the seismic record associated with those explosions. We follow that submission with information from other sources including news coverage. Colima was the centerpiece at the recent Cities on Volcanoes meeting held in the city of Colima, Mexico in November 2012. At that stage the volcano still remained quiet.
2011 eruption's end date. The missing ingredient in many assessments of eruptions with declining, drawn out waning stages is often the last date of eruption prior to repose. Precise start dates are common, but end dates are not, restricting the precision of eruptive duration. Fortunately, increasing numbers of instrument- and satellite-aided techniques have emerged to help document eruption end dates. Salzer and others (2013) used satellite InSar deformation data coupled with a web camera to assess 21 June 2011 as Colima's final eruption in the 2007-2011 dome extrusion episode. They noted that "measuring deformation in the region of the crater is important to determine the rate of the ongoing eruption and the stability of the dome. The latter part of their abstract follows.
"The activity in the summit region has been recorded by a video monitoring system installed by the University of Colima volcano observatory. We have analysed the optical camera data obtained between February and June 2011 using spatial digital image correlation techniques. We show that the velocity of dome extrusion varies strongly on a daily basis, reaching up to 3m/day, and then systematically decreased over the following months. Deformation was barely above the detection threshold of 30cm/day in the weeks prior to June 21st, when a significant explosion occurred, removing part of the dome. Camera data recorded after this event does not show any displacements, possibly due to the low spatial resolution of the camera data.
"In order to analyse slower deformation processes, we have acquired TerraSAR-X data in spotlight mode for ascending and descending tracks over Colima, obtaining a high spatial resolution of up to 2 m, and a temporal resolution of up to 11 days. In combination with a high resolution digital elevation model, the InSAR data allow the detection of modifications of the dome at a resolution that is two orders of magnitude below the detection threshold of the cameras. The different temporal and spatial scales of deformation detectable by camera and radar monitoring (metre to centimetre, respectively), highlight the benefit of combining these methods to observe the full range of activites at Colima. The results reveal that explosions may occur suddenly after a period of declined dome growth."
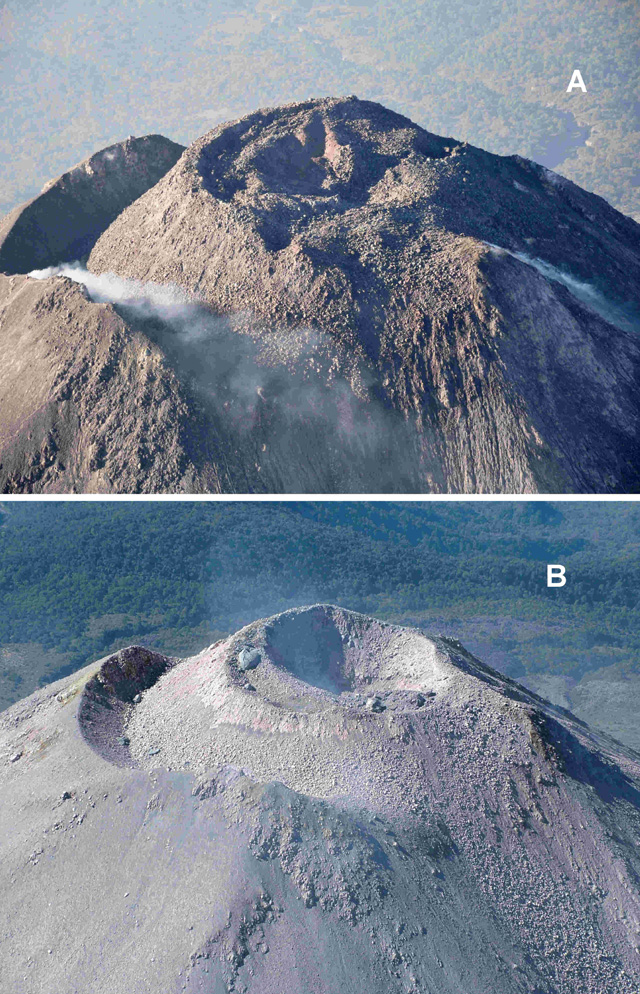
Eruptions resume in January 2013. Figure 101(A) shows the dome as seen on 9 March 2012 in the midst of the year and a half interval of quiet when all visible and available geophysical signs of dome growth remained absent. In contrast, figure 101(B) shows the scene after eruptions resumed, starting with explosions on 6 January 2013. There developed both a depression in the dome's summit and some large ejecta perched near that crater's rim. The photo was taken on 31 January after a sequence of explosive events on 6, 13, and 29 January.
The January explosions cored out and partly destroyed the 2007-2011 lava dome. Figure 101(B) shows the new crater that was formed within this old lava dome. The volume of this new crater was estimated at about 250,000 m3. During the explosions, a new lava dome began to grow in the new crater with an initial eruption of ˜0.14 m3/s. The January eruptions generated pyroclastic flows that reached 2.8 km W of the dome.
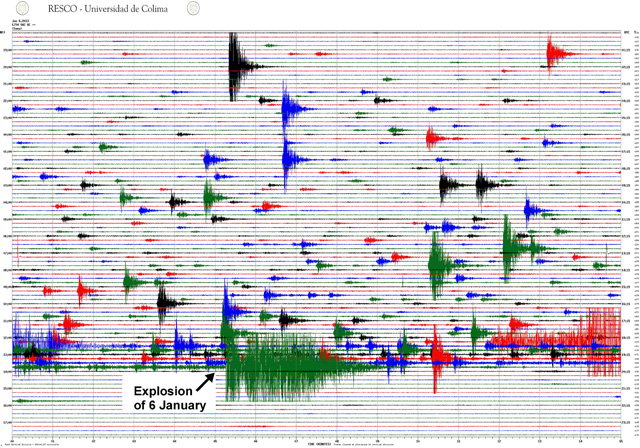
No precursory volcano-tectonic earthquakes or deformation signals were recorded prior to the January sequences. On the other hand, sequences of numerous microearthquakes (pulgas) occurred preceding the largest explosive events. This is shown in the 6 January seismic data presented in figure 102.
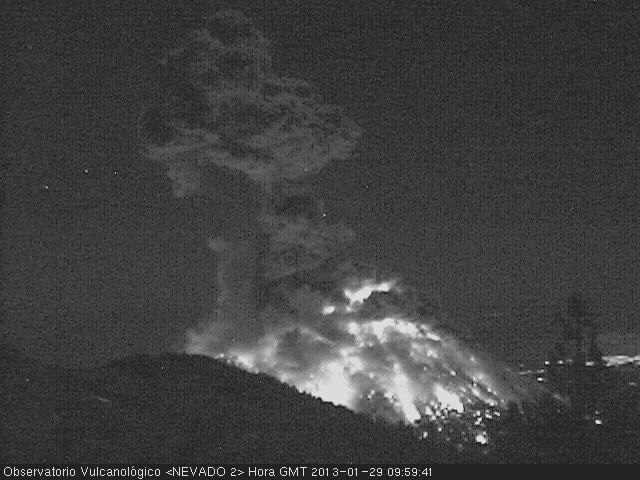
Figure 103 shows the 29 January explosion as viewed from video station Nevado installed 5.3 km N of Colima's crater.
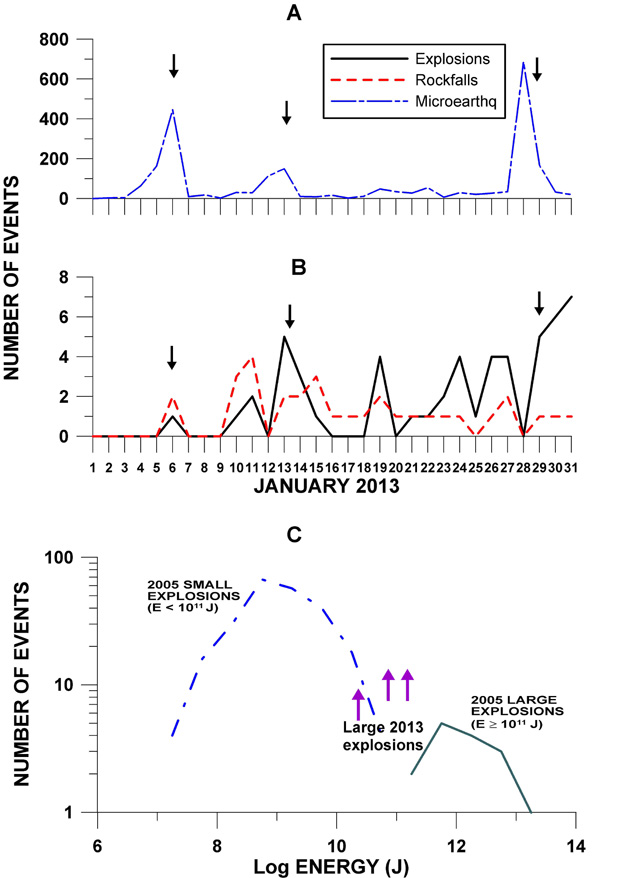
Seismic comparisons. The largest of the explosions in the January eruptive sequence can be compared from seismic records. As noted above, the associated eruptions generated small pyroclastic flows.
Table 19 shows the energy associated with each of the eruptive pulses (6, 13, and 29 January). These results were estimated from the broadband seismic record measured at a distance of 4 km from the crater using the methods described in (Zobin and others, 2009, 2010).
Table 19. Energy of Colima's three largest explosions during January 2013. Courtesy of Colima Volcano Observatory.
| Date |
Energy, J |
| 06 Jan 2013 |
7.2 x 10¹⁰ |
| 13 Jan 2013 |
2.3 x 10¹⁰ |
| 29 Jan 2013 |
1.5 x 10¹¹ |
Figure 104 provides another look at Colima seismic data during January 2013. On the upper two of the three plots (A and B), dates of the three explosions (on the 6th, 13th, and 29th) are indicated as black downward pointing arrows and the key to the seismic signals is shown. Figure 104(A) shows the number of microearthquakes, with in all three cases numbers of events increasing with approach to the explosions. For the first two eruptions, the peaks in microearthquakes coincided with the eruption. For the third microearthquake, on the 29th, counts rose rapidly and peaked prior to the eruption. The counts decreased after the eruption (figure 104(B)).
Figure 104(B) indicates that there were multiple seismically inferred explosions, on the three noted days, as well as on other days. For example, starting at left on Figure 104(B) one sees a progression from the 6th, 1 explosion; to the 10th and 11th, 1 and 2 explosions respectively. The largest number shown was associated with the arrow indicating the explosion on the 29th, 5 explosions, in a sequence escalating to 7 on the 31st (last data on the plot).
Figure 104(C) plots the energy of the three largest explosions of the January 2013 sequence (at the tips of the colored arrows aiming upwards). The two other fields on the plot show the energy distributions of small and large explosive events recorded during 2005 at Colima (Zobin and others, 2010). Thus, figure 104(C) shows that, for events assessed at Colima and in terms of seismically detected energy, the 2013 events may be considered as small to intermediate in size.
News reports. According to news articles, a scientific advisory committee reported the 6 January 2013 eruption from Colima, saying that it ejected tephra and an ash plume that rose ˜2 km above the crater. Ash fell on residents near Ciudad Guzmán, tens of kilometers NE of the volcano. Visitors were evacuated from the Nevado de Colima national park, which contains both Nevado de Colima and the active Volcan de Colima.
During the explosion of 29 January, residents up to 20 km away reported a loud noise, shaking ground, and rattling windows. Colima ejected incandescent material. According to the Washington Volcanic Ash Advisory Center (VAAC), on the 29th an ash plume rose ˜2.5 km above the crater. Based on analyses of satellite imagery, the VAAC reported that the ash plume drifted 55 km NE at an uncertain altitude to a distance of 150 km from the volcano.
References: Salzer , J, Walter , T, Legrand , D, Breton , M, and Reyes , G, 2013, Multiscale deformation monitoring at Colima Volcano using TerraSAR-X interferometry and camera observations, EGU General Assembly Conference Abstracts (2013), vol. 15, pp. 9290.
Zobin, VM, Reyes, GA, Guevara, E, 2, and Bretón, M, 2009, Scaling relationship for Vulcanian explosions derived from broadband seismic signals, J. Geophys. Res., vol. 114, B3, March 2009. DOI: 10.1029/2008JB005983.
Zobin, VM, Melnik, O E, González, M, Macedo, O and Bretón, M, 2010, Swarms of microearthquakes associated with the 2005 Vulcanian explosion sequence at Volcán de Colima, México. Geophysical Journal International, vol. 182, issue 2, pp. 808-828. doi: 10.1111/j.1365-246X.2010.04647.
Geologic Background. The Colima complex is the most prominent volcanic center of the western Mexican Volcanic Belt. It consists of two southward-younging volcanoes, Nevado de Colima (the high point of the complex) on the north and the historically active Volcán de Colima at the south. A group of late-Pleistocene cinder cones is located on the floor of the Colima graben west and east of the complex. Volcán de Colima (also known as Volcán Fuego) is a youthful stratovolcano constructed within a 5-km-wide scarp, breached to the south, that has been the source of large debris avalanches. Major slope failures have occurred repeatedly from both the Nevado and Colima cones, producing thick debris-avalanche deposits on three sides of the complex. Frequent recorded eruptions date back to the 16th century. Occasional major explosive eruptions have destroyed the summit (most recently in 1913) and left a deep, steep-sided crater that was slowly refilled and then overtopped by lava dome growth.
Information Contacts: Observatorio Vulcanologico de la Universidad de Colima (Colima Volcanological Observatory), Calle Manuel Payno, 209 Colima, Col., 28045 Mexico (URL: http://www.ucol.mex/volc/);Facultad de Ciencias, Universidad de Colima; Washington Volcanic Ash Advisory Center (VAAC), NOAA Science Center Room 401, 5200 Auth road, Camp Springs, MD 20746, USA (URL: http://www.ospo.noaa.gov/Products/atmosphere/vaac/).
Kilimanjaro (Tanzania) — April 2013 Cite this Report
Kilimanjaro
Tanzania
3.07°S, 37.35°E; summit elev. 5881 m
All times are local (unless otherwise noted)
2006 rockfall takes climbers' lives; 165 my minimum age; glacial retreat; economic value
We offer our first Bulletin report on Mount Kilimanjaro, which remains a dormant volcano. We first discuss its economic value and setting. We next mention a few of the many studies of seismically detected rockfalls at volcanoes. We next discuss a 4 January 2006 rockfall that took three climbers' lives and injured five others (Kikoti and others, 2006). An investigation looked into the accident's location and cause, improvements to the route to minimize rockfall risk, as well as further recommendations and implementation to make this approach to the summit safer. Although accidents due to rockfalls and mass wasting are common in mountainous areas, volcanoes included, this subject has not typically been a major focus of Bulletin reporting. This unusually well-documented case illustrates several approaches to mitigating similar hazards at more than just this volcano.
The next section of this report notes diminishing glacial ice on Kilimanjaro, 85% gone since 1912. The youngest age date of volcanic material on the volcano is 165,000 ± 5,000 ybp. No evidence of younger eruptions was found in studies of glacial ice on the volcano (Kimberly Casey, personal communication, June 2013).
There were several reports discussing the rockfall incident and future steps that might make the route safer. The report by Kikoti and others (2006) was issued after inspection of the Arrow Glacier area looking at various alternative routes, challenges, and recommendations and implementation.
World Heritage site and economic importance. Kilimanjaro was designated a World Heritage site in 1987. UNESCO cited Kilimanjaro as "an outstanding example of a superlative natural phenomenon" with many endangered species. Guides are required for tours and costs can range to $5,000 per person for an expedition to the summit (Py-Lieberman, 2008). Income from Kilimanjaro ecotourism is a principal source of foreign exchange for Tanzania. Income from tourism overall has grown from US $65 million in 1990 to US $725 million in 2001, and then represented roughly 10% of Tanzania's gross domestic product (World Bank/MIGA, 2002). It ranks among the world's favorite volcanoes to climb (Sigurdsson and Lopes-Gautier, 2000).
Rockfalls at volcanoes. Rockfalls represent a special kind of mass movement (mass wasting smaller than landslides) in which one or more rocks become dislodged, enters free fall, and bounces down the ground surface. The rockfalls discussed here were unusually well documented (Kikoti and others, 2006), spurring this report on a phenomena so common as to often elude mention. Rockfalls are a source of noise in seismic monitoring, sometimes masking small earthquakes at depth. Rockfall signals are often counted and reported along with various types of seismic events. Rockfall signals contribute to the average absolute amplitude of seismic signals (eg., RSAM measurements) since those measurements incorporate all the various types of seismic events, rockfall signals, and noise (Endo and Murray, 1991; Voight and others, 1998).
Rockfalls have long been thought of as a possible means of detecting larger impending mass movements and for eruption forecasting, although problems such as glaciers, seasonal melting cycles, precipitation, other noise sources, etc. complicate interpretations. Rockfalls may also be triggered by earthquakes. Regarding rockfall seismic signals at Augustine stratovolcano, DeRoin and McNutt (2012) state that "The high rate of rockfalls in 2005 constitutes a new class of precursory signal that needs to be incorporated into long-term monitoring strategies at Augustine and elsewhere." Hibert and others (2011) carried out a detailed study of rockfalls detected seismically at Piton de la Fournaise, a large shield volcano with rockfalls down steep sided caldera walls. Bulletin editors are currently unaware of past or current seismic monitoring at Kilimanjaro, short- or long-term, and if those records exist, whether rockfalls were important. The rockfall case under discussion at Kilimanjaro, release of glacial deposits down a steep slope, is very unlikely to reflect a pre-eruptive event.
Setting and area of fatal rockfalls. Kilimanjaro sits on the East African rift, a N-trending structure spanning from Mozambique at the S to the Afar and Red Sea region at the N, a distance of 3,000-4,000 km. Kilimanjaro resides in a region where the rift has branched into Eastern and Western rift segments, with Kilimanjaro on the Eastern segment (figure 1). That branching can be seen on figure 1 traversing around Lake Victoria (Lake Nyanza).
Causes of the Accident. Extensive talus resides at the intersection between the left and right arms of the r-shaped glacier (figures 5-6). Part of this unstable talus collapsed. Kikoti and others (2006) said that the dislodged material traveled 150 m down the slope, reaching a group of people at an estimated speed of ˜40 m/sec (144 km per hour) at the point where the climbers were struck (B, figure 4).
Kikoti and others (2006) thought the talus dislodged because of (a) melting ice freeing the loose material and destabilizing it on the steep slopes, and (b) strong downhill winds measured at 177 km/h. The wind speed was measured by guide George Lyimo on the morning of the accident, using a wind speed gauge wrist unit.
Lyimo survived, having left camp ˜3 hours before the accident. Based on the known conditions at the summit, the climbers would only have had on the order of 5 seconds to escape the avalanche. Besides the strong winds, the climbers also confronted snowfall and poor visibility.
Kikoti and others (2008) examined a conspicuous cavity where the recent fallen rocks were believed to have been dislodged. They estimated that 39 tons of rocks dislodged from the cavity.
Current Status of Route. The old route (figure 3) was judged unsafe due to concern over two risk zones (A and B, figure 7). Zone A hosts residual glacial deposit at the intersection of the right and left arms of the r-shaped glacier resulting in exposure to rockfall from above. Zone B includes the crater wall and rock tower, which could shed debris from above. Above this area, the remainder of the route is judged to be subject to no specific identifiable imminent threats.
Recommendations and implementation. Kikoti and others (2006) made principal recommendations, some of which follow. As partly seen on figure 7 (yellow dotted line), the proposed new route traverses the rock feature known as the 'Stone Train' largely avoiding indicated hazardous zones. The route would proceed to a handrail up the left hand edge of the Stone Train to join the rock spur adjoining the base of the crater wall at ˜5,400 m.
Many of these recommendations were adopted and a October 2008 posting on the Mt. Kilimanjaro Travel Guide (Baxter, 2008) discussed implementation, obligations of tour operators, climbers, guides and the Park to make the route safer. These ranged from immediate steps such as asking all climbing parties to depart Arrow Glacier camp no later than 5 a.m. to mid-term steps such as the issuance by tour companies of radio handsets for guides to communicate with Kilimanjaro National Park Authority (KINAPA) rescue teams. As a result, the Park was directed to take immediate steps such as erecting signboards warning visitors of rockfall dangers and put in place a rockfall protocol and ensure that all their rescue staffs are trained on how to effectively use it.
Baxter (2008) recommended investigations by further specialists (seismologists, glaciologists, geologists, meteorologists, etc.) to assess the long term future risks associated with climate change and Kilimanjaro's altering geology and glaciology. A safety patrol team was also tasked with visiting the mountain monthly or bi-monthly to survey and identify possible future risk areas in the light of the rapidly changing situation on Kilimanjaro.
Receding glaciers. Cullen and others (2013) discuss the time series of glacial retreat at Kilimanjaro during 1912 to 2011. They concluded that 85 per cent of the glacier had disappeared. Figures 8 and 9 contain satellite imagery and land-based photos presented on a NASA Earth Observatory article (Allen and others, 2012) that describes the state of summit glaciers at Kilimanjaro on 26 October 2012. Melting ice and subsequent melt-water runoff reduce confining pressure on the magmatic system. There is evidence that such reduced pressure or loading might promote the onset of volcanism (e.g., Bay and others, 2004; Pagli and Sigmundsson, 2008; Sigvaldason and others, 1992).
According to Allen and others (2012), during a 2012 expedition, scientists found that the northern ice field, which had been developing since the 1970s then had a hole wide enough to ride a bicycle through. They also were able to walk on land directly through the rift (labeled on figure 8, right).
Cullen and others (2013) said that despite Mount Kilimanjaro's location in the tropics, the dry and cold air at the top of the mountain has sustained large quantities of ice for more than 10,000 years. At points, ice has completely surrounded the crater. Studies of ice core samples show that Kilimanjaro's ice has persisted through multiple warm spells, droughts, and periods of abrupt climate change.
Fumarolic activity occurs on the volcano, particularly in Kibu crater. Tour operator Eddie Frank (Tusker Trail) has agreed to keep a log of observed changes of color and smell at fumaroles.
Age dates of eruptive products. Nonnotte and others (2008) discussed the youngest K-Ar age date for Kilimanjaro. Samples associated with the latest parasitic phase (05KI41B and 03TZ42B) yield ages of 165 ± 5 ka and 195 ± 5 ka, respectively. "The last volcanicity, around 200-150 ka, is marked by the formation of the present summit crater in Kibo and the development of linear parasitic volcanic belts, constituted by numerous Strombolian-type isolated cones on the NW and SE slopes of Kilimanjaro. These belts are likely to occur above deep-seated fractures that have guided the magma ascent, and the changes in their directions with time might be related to the rotation of recent local stress field," Nonnotte and others wrote (2008).
References: Allen, J, Simmon, R, Voiland, A., and Casey, K, 2012, Kilimanjaro's Shrinking Ice Fields, NASA Earth Observatory-Image of the day (URL: http://earthobservatory.nasa.gov/) Posted 8 November 2012; Accesssed 14 June 2013.
Baxter, P., 2008, TANAPA Western Breach Protocol—Tanzania National Parks, Obligations and Actions Regarding the Re-opening of Western Breach Route (Arrow Glacier), Mt. Kilimanjaro Travel Guide [posted 21 October 2008] (URL: http://www.mtkilimanjarologue.com/tanapa-western-breach-protocol).
Bay, RC, Bramall, N, and P Buford Price, 2004, Bipolar correlation of volcanism with millennial climate change, Proc Natl Acad Sci U S A. 2004 April 27; 101(17): 6341-6345. Published online 2004 April 19. doi: 10.1073/pnas.0400323101 PMCID: PMC404046
Cullen, N. J., Sirguey, P., Mölg, T. Kaser, G. Winkler, M. and Fitzsimons, S. J. , 2013.A century of ice retreat on Kilimanjaro: the mapping reloaded, The Cryosphere Discuss., 6, 4233-4265, doi:10.5194/tcd-6-4233-2012, 2012.
DeRoin N. and S.R. McNutt, 2012, Rockfalls at Augustine Volcano, Alaska: The Influence of Eruption Precursors and Seasonal Factors on Occurrence Patterns 1997-2009. J . Volcanol. Geotherm. Res., v. 211-212, p. 61-75
Endo, E.T. and Murray, T., 1991, Real-time seismic amplitude measurement (RSAM): a volcano monitoring and prediction tool. Bulletin of Volcanology 53.7 (1991): 533-545.
Hibert, C., A. Mangeney, G. Grandjean, and N. M. Shapiro, 2011, Slope instabilities in Dolomieu crater, Réunion Island: From seismic signals to rockfall characteristics, J. Geophys. Res., 116, F04032, doi:10.1029/2011JF002038
Kikoti, I., Nchereri, J.P., Mlay, A., Lyimo, G., Msemo, E., and Rees-Evans, J., 2006, Kilimanjaro Safety Patrol Reconnaissance Expedition, 25th-27th January 2006, An investigation to determine the cause of the Western Breach accident of 4th January 2006 and to offer recommendations for the way forward for this route [Report completed June 2006 and posted online at (URL: http://www.yumpu.com/en/document/view/7812851/western-breach-investigation-digital-copy)
Nonnotte, P, Guilloub, H, Le Guillou, B, Benoit, M, Cotten, J, Scaillet, S, 2008, Jour. of Volc. and Geoth. Res., Volume 173, Issues 1-2, 1 June 2008, pp. 99-112
Pagli, C., and Sigmundsson, F. (2008). Will present day glacier retreat increase volcanic activity? Stress induced by recent glacier retreat and its effect on magmatism at the Vatnajökull ice cap, Iceland. Geophysical Research Letters, 35(9), L09304.
Py-Lieberman, B, 2008, Life lists, Hiking Mount Kilimanjaro, A trek up the world's tallest freestanding mountain takes you through five different ecosystems and offers a stunning 19,340-foot view, Smithsonian magazine, January 2008 [online version, URL: http://www.smithsonianmag.com/specialsections/lifelists/lifelist-kilimanjaro.html]
Sigurdsson S., and Lopes-Gautier, R. 2000, Volcanoes and Tourism; Encyclopedia of Volcanoes, Academic Press, pp. 1283-1299.
Sigvaldason, G.E., Annertz, K., and Nilsson, M., 1992, Effect of glacier loading/deloading on volcanism: postglacial volcanic production rate of the Dyngjufjöll area, central Iceland. Bulletin of Volcanology 54, no. 5 (1992): 385-392.
UNESCO, date uncertain, Kilimanjaro National Park, UNESCO (URL:whc.unesco.org/en/list/403)
Geologic Background. Massive Kilimanjaro consists of three overlapping edifices along a NW-SE trend, mostly constructed during the Pleistocene, with an ice-capped summit that reaches 5,200 m above the surrounding plains. Kibo is the central stratovolcano, which has a broad elongated profile and a 2 x 3 km summit caldera. Activity at the older Shira cone, which forms the broad WNW shoulder of the complex, began during the Pliocene. The extensively dissected Pleistocene Mawenzi forms a prominent, sharp-topped peak on the ESE flank, dominated by a densely packed radial dike swarm. More than 250 cones occupy a rift zone to the NW and SE. Fumarolic activity is present within a group of nested summit craters. Widespread statements that the "most recent activity was about 200 years ago," sometimes referencing the central "ash pit" formation, are of unknown origin with no supporting evidence in geological or anthropological literature. Nonnotte et al. (2008) K-Ar dated caldera-rim group lavas in the 170-274 ka range, and placed the most recent volcanism (formation of both the present summit crater, Inner Crater group lavas, and flank cones) around 150-200 ka. Martin-Jones et al. (2020) attributed two mafic tephra deposits in Lake Chala to Kilimanjaro that were dated to about 248 and 134 ka.
Information Contacts: Eddie Frank, Tusker Trail, 924 Incline Way Suite H Incline Village, Nevada 89451-9423 USA (URL: http://www.Tusker.com); and Kimberly Casey, NASA Goddard Space Flight Center, Cryospheric Sciences Lab, Code 615, Greenbelt, MD 20771 USA (URL: http://neptune.gsfc.nasa.gov/csb/personnel/?kcasey).
Kizimen
Russia
55.131°N, 160.32°E; summit elev. 2334 m
All times are local (unless otherwise noted)
Active lava flows and ash emissions during October 2011-May 2013
Significant eruptions began at Kizimen in December 2010 (BGVN 36:10) and continued through May 2013. Our previous report highlighted frequent ash explosions, the development of a ˜2.3 km lava flow, and elevated seismicity through September 2011. In this report we continue to present data based on the monitoring efforts of the Kamchatka Branch of the Geophysical Service of the Russian Academy of Sciences (KB GS RAS) and the Kamchatka Volcanic Eruptions Response Team (KVERT).
Developments in data analysis based on Kizimen's 2010 eruption. The onset of activity in late 2010 provided opportunities for new methods of data analysis. Ji and others (2013) and Senyukov (2013) highlighted distinctive precursory activity that could successfully forecast volcanic behavior. Both investigative groups also mentioned the challenge of limited datasets for a volcanic system that recently became active without past records of geophysical data (in particular, deformation or seismic data during a time of elevated activity). The last eruption from Kizimen occurred during 1927-1928 (Siebert and others, 2010), before satellite or seismic monitoring (instrumentation was available in 1961) had begun.
The remote sensing investigation by Ji and others (2013) concluded that InSAR datasets from 2008 and 2010 measured > 6 cm of progressive surface displacement in the satellite's line-of-sight before the eruption began. While "InSAR has been demonstrated to be an important tool for investigating volcanic deformation and understanding magma supply dynamics at many of the world's volcanoes," this was the first significant deformation observed at a Kamchatka volcanic site.
The seismic study by Senyukov (2013) detailed a new method for short-term forecasting explosive eruptions. Development for this technique began with Bezymianny datasets and was followed by a successful application to the 2010 eruption of Kizimen using the correlation between height of ash emissions and the integral of absolute velocity as recorded by local seismic stations.
Elevated alert status continued through May 2013.From October 2011 through May 2013, Kamchatkan authorities maintained elevated an alert status (most frequently an Aviation Color Code of Orange) except for a few days during April-December 2012 and one day in March 2013 (figure 14). A Red level, indicating that an "eruption is underway with significant emission of ash into the atmosphere" was announced and maintained for one day in December 2011. There were several days of unassigned status during July-September 2012 primarily the result of station outages and meteorological conditions that inhibited observations which are based on satellite remote sensing, a video camera, and field visits.
Observations during October 2011-May 2013. KVERT reported in regular notifications to aviation authorities (Volcano Observatory Notification to Aviation, VONA), that lava continued to extrude from the summit of Kizimen from October 2011 through May 2012. New notices of visual confirmation of lava extrusion and ash plumes were released starting on 25 October 2012 and until the time of this report in May 2013 (figure 15).
Volcano Observatory Notification to Aviation (VONA) reports were released regularly on the KVERT website covering daily and weekly activity for Kizimen and other Kamchatka volcanoes. This reporting style was adopted by the International Civil Aviation Organization (ICAO) in 2004 "as the international warning system for volcanic ash, becoming the first 'global standardized' VALS [Volcano Alert Level Systems]. In 2006, the USGS adopted two standardized VALS, one for ground-based hazards and the other for aviation ash hazards, replacing extant VALS that had been locally developed at each observatory" (Fearnley and others, 2012; Gardner and Guffanti, 2006). At the time of this report, KVERT notifications were focused on aviation ash hazards with no additional ground-based notification system (figure 16).
Thermal anomalies from the summit. Satellite remote sensing frequently detected elevated temperatures from Kizimen during 2011-2013 (figure 17) and a local monitoring camera maintained by KB GS RAS detected nighttime incandescence during clear viewing conditions (figure 18).
Volcanic and seismic activity peaked in December 2011 and Red Aviation Color Code was announced on 13 December when more than 220 earthquakes were detected (figure 14). The next day, seismicity doubled and video observations showed hot avalanches from the E flank lava flow and occasional large pyroclastic flows. During 0620-0810 a large pyroclastic flow with co-ignimbrite clouds was observed. According to the Tokyo Volcanic Ash Advisory Center (VAAC), ash plumes rose 6.1-7.6 km a.s.l. Activity during 13-14 December generated an ash plume that extended ˜150 km E.
FED RAS scientists conducted an aerial survey on 23 December 2011 and determined Kizimen's range of surface temperatures (figure 19). During the overflight, temperatures were as high as 140°C, and a strong steam-and-gas plume was rising from the summit.
Seismicity during October 2011-May 2013. After peaking with ˜870 earthquakes on 2 October 2011, seismicity peaked again on 20 February 2012 (651 earthquakes/day) before beginning a long period of decline until June 2012 (figure 14). Possible avalanche signals were typical during this time period and explosion events frequently occurred. Seismicity also included spasmodic volcanic tremor, at times continuous, but more frequently intermittent episodes; tremor became less dominant in April and was absent in May.
During May-June 2012, seismicity rarely exceeded background levels (approximately 10 earthquakes/day). Spasmodic tremor was intermittent and rarely occurred during June-July, although an increase in tremor was detected during 24-30 July. Due to technical problems, there were data outages in July, the majority of August, and part of September. Tremor, explosions, and possible avalanche events were detected intermittently by the seismic network in August and September.
The seismic network detected intermittent explosive and rockfall events from October 2012 through December of that year. From October 2012 through May 2013, seismicity rarely exceeded 100 earthquakes/day. Several peaks in activity occurred in late December 2012 (a maximum of 422 earthquakes/day) and January 2013 (a maximum of 322 earthquakes/day). Tremor, explosions, and rockfall events became more frequent in January 2013 and February. After that, tremor became increasingly rare and was absent in May although explosion signatures were frequently-occurring throughout that time period. By May 2013, seismicity had decreased to an average of 62 earthquakes per day.
References:Fearnley, C.J., McGuire, W.J., Davies, G., and Twigg, J., 2012, Standardisation of the USGS Volcano Alert Level System (VALS): analysis and ramifications, Bulletin of Volcanology, 74: 2023-2036.
Gardner, C.A. and Guffanti, M.C., 2006, U.S. Geological Survey's Alert Notification System for Volcanic Activity. In: Fact Sheet 2006-3139. U.S. Geological Survey.
Ji, L., Lu, Z., Dzurisin, D., Senyukov, S., 2013, Pre-eruption deformation caused by dike intrusion beneath Kizimen volcano, Kamchatka, Russia, observed by InSAR, Journal of Volcanology and Geothermal Research, 256, 87-95.
Senyukov, S.L., 2013, Monitoring and Prediction of Volcanic Activity in Kamchatka from Seismological Data: 2000-2010, Journal of Volcanology and Seismology, vol. 7, no 1, 86-97.
Siebert, L., Simkin, T., Kimberly, P., 2010, Volcanoes of the World, 3rd edn. University of California Press, Berkeley.
USGS Volcano Hazards Program: Volcano Observatory Notices for Aviation (VONA), 8 June 2013, (http://volcanoes.usgs.gov/activity/vonainfo.php). Accessed 13 June 2013.
Geologic Background. Kizimen is an isolated, conical stratovolcano that is morphologically similar to St. Helens prior to its 1980 eruption. The summit consists of overlapping lava domes, and blocky lava flows descend the flanks of the volcano, which is the westernmost of a volcanic chain north of Kronotsky volcano. The 2334-m-high edifice was formed during four eruptive cycles beginning about 12,000 years ago and lasting 2000-3500 years. The largest eruptions took place about 10,000 and 8300-8400 years ago, and three periods of long-term lava dome growth have occurred. The latest eruptive cycle began about 3000 years ago with a large explosion and was followed by intermittent lava dome growth lasting about 1000 years. An explosive eruption about 1100 years ago produced a lateral blast and created a 1.0 x 0.7 km wide crater breached to the NE, inside which a small lava dome (the fourth at Kizimen) has grown. Prior to 2010, only a single explosive eruption, during 1927-28, had been recorded in historical time.
Information Contacts: Kamchatka Branch of the Geophysical Service of the Russian Academy of Sciences (KB GS RAS), Piip Ave. 9, Petropavlovsk-Kamchatsky, 683006, Russia; Kamchatka Volcanic Eruptions Response Team (KVERT), Institute of Volcanology and Seismology, Russian Academy of Sciences, Far East Division, 9 Piip Blvd., Petropavlovsk-Kamchatsky 683006, Russia (URL: http://www.kscnet.ru/ivs/); Tokyo Volcanic Ash Advisory Center (VAAC), Tokyo, Japan (URL: http://ds.data.jma.go.jp/svd/vaac/data/); MODVOLC, Hawai`i Institute of Geophysics and Planetology (HIGP), MODVOLC Thermal Alerts System, School of Ocean and Earth Science and Technology (SOEST), Univ. of Hawai`i, 2525 Correa Road, Honolulu, HI 96822, USA (URL: http://modis.higp.hawaii.edu/); Sergey Senukov, Kamchatka Branch of the Geophysical Service, Russian Academy of Sciences (KB GS RAS, Russia (URL: http://www.emsd.ru/); NASA Earth Observatory (URL: http://earthobservatory.nasa.gov/).
Mayon (Philippines) — April 2013 Cite this Report
Mayon
Philippines
13.257°N, 123.685°E; summit elev. 2462 m
All times are local (unless otherwise noted)
Mainly calm during 2009-2013; 7 May 2013 explosion kills five climbers
Mayon's emissions, often small, gas-driven, ash-bearing, and without visible magmatic components, were generally minor during 2009 through early June 2013. After erupting in late 2009, Mayon seismicity generally declined to baseline levels through 23 September 2011 (BGVN 36:09). This report summarizes seismic activity from the end of the last report into early June 2013. The summit crater released a sudden minor phreatic eruption on 7 May 2013 that would have been harmless except for the ejection of some large blocks and the presence of dozens of climbers on the nearby upper slopes; five died.
According to the Philippine Institute of Volcanology and Seismology (PHIVOLCS), small ground and tilt deformations observed since 2 March 2010 were probably due to regional faulting and not magmatic intrusion. A report published by PHIVOLCS on 27 November 2012 noted that precise leveling surveys found slight inflation of the lower N and E slopes; ground tilt changes were not fully consistent with volcanic ground deformation, but rather with incremental motion along a nearby segment of the Philippine fault zone.
That November 2013 report also noted that steaming had waned significantly by 27 November 2012. Steaming from the crater varied, but was, by November 2012, weak and occasionally wispy. The report indicated that crater incandescence had ceased since March 2012. Sulfur dioxide emissions had decreased to below baseline levels of 500 metric tons/day. As a result of diminished activity, PHIVOLCS decreased the Alert Level to 0 on 27 November 2012; however, the public was reminded not to enter the 6-km-radius Permanent Danger Zone.
The next available report on Mayon indicated that a small phreatic eruption occurred on 7 May 2013 lasting in the range of 73-146 seconds. PHIVOLCS observed that a gray-to-brown ash cloud rose 500 m above the crater and drifted WSW. Traces of ash fell in areas WNW, affecting communities up to 19 km away. The seismic network detected a single associated rockfall event. Seismicity and gas emissions remained within background levels and indicated no increase in activity. The Alert Level remained at 0.
Gas-driven explosion and fatalities on 7 May. PHIVOLCS posted a photo of the eruption taken at distance (figure 21). According to news reports, that 7 May event was fatal to climbers who had ventured to [500 m] of the summit, a point well within the 6-km-radius Permanent Danger Zone. Multiple news articles (including those in Interaksyon, The Philippine Star, Associated Press, Sunstar, and GMA Network) noted that the 7 May 2013 phreatic eruption at 0800 ejected large rocks towards climbers, killing five and injuring at least seven. A climber was quoted as saying that their team was resting when they heard a loud rumbling and then saw falling rocks "as big as a living room." A local tour operator said "It rained like hell with stones. It was sudden and there was no warning."
One of the more detailed news reports, a 7 May article by Andrei Medina and Amanda Fernandez in GMA News, said that at least two groups of climbers were on the volcano at the time of the explosion. One of those groups, 20 climbers, incurred all five fatalities. Those fatalities included 4 foreigners [Europeans] and one Filipino tour guide. The article said that (according to Bernardo Rafaelito Alejandro, head of the Office of Civil Defense in Bicol) the foreign nationals and their guide were about half a kilometer from the crater when the 0800 explosion occurred. Another group, consisting of about seven climbers on another trail suffered three injuries (all Indonesians). Other articles raised sometimes inconsistent details about the number, composure, and locations of the various groups on the volcano.
Although authorities had set the Alert Level at the lowest risk (0, at a scale reaching up to 6) at the time of the eruption, and it remained so immediately thereafter, they had previously established the Permanent Danger Zone. In accord with this information, the article said that Albay Governor Joey Salceda said that the mountain climbing activities of the two groups affected were unauthorized. He added the tourist guides also failed to secure a permit from the Albay Public Safety and Emergency Management Office (APSEMO) and the Department of Tourism." The article went further to say that Bernardo Rafaelito Alejandro, head of the Office of Civil Defense in Bicol, said there was no need to evacuate the residents near the volcano, adding such eruptions are expected from an active volcano, and evacuation only occurs during an Alert Level 3.
An 11 May article by Cet Dematera and Celso Amo in The Philippine Star noted that the bodies of the four foreign nationals had been retrieved from Mayon's slopes. Another climber on Mayon during the 7 May eruption, Boonchai Jattupornpong, had lost contact with fellow Thai climbers, but had survived for 4 days by gathering rainwater. He was found, carried out, and brought to a hospital suffering burns, cuts, and a fractured arm. The composite disaster team involved in the search, rescue, and retrieval operations after the 7 May disaster was recommended for awards and commendation, including a possible Bronze Cross medal award or equivalent, for bravery and heroism by the Albay Provincial Governments.
Rockfalls, degassing, and incandescence. On 8 May 2013, PHIVOLCS reported that two rockfalls at Mayon had been detected within the previous 24 hours. Seismicity remained within background levels and indicated no increase in overall volcanic activity.
On 31 May 2013, PHIVOLCS raised the Alert Level to 1 as a precaution because, during the previous 36-hours, a visible but weak and short-lived hydrogen sulfide (H2S) emission was observed, along with a persistent incandescence. PHIVOLCS was concerned that the incandescence might reflect a steady emission of magmatic gas. However, PHIVOLCS also noted that seismicity remained markedly low and sulfur dioxide (SO2) measurements remained below the normal level. A ground deformation survey indicated slight edifice inflation compared to a 13 February 2013 survey.
According to PHIVOLCS, white to off-white steam plumes drifted in various directions during 5-10 June. Occasionally, bluish fumes were noted. During most evenings during this period, PHIVOLCS observed incandescence from the crater, although cloud cover sometimes obscured the volcano. The seismic network recorded one volcanic earthquake during 5-6 June and another one during 9-10 June. During 6-7 June, a single rockfall signal was detected.
Geologic Background. Symmetrical Mayon, which rises above the Albay Gulf NW of Legazpi City, is the most active volcano of the Philippines. The steep upper slopes are capped by a small summit crater. Recorded eruptions since 1616 CE range from Strombolian to basaltic Plinian, with cyclical activity beginning with basaltic eruptions, followed by longer term andesitic lava flows. Eruptions occur predominately from the central conduit and have also produced lava flows that travel far down the flanks. Pyroclastic flows and mudflows have commonly swept down many of the approximately 40 ravines that radiate from the summit and have often damaged populated lowland areas. A violent eruption in 1814 killed more than 1,200 people and devastated several towns.
Information Contacts: Philippine Institute of Volcanology and Seismology (PHIVOLCS) (URL: http://www.phivolcs.dost.gov.ph); InterAksyon (URL: http://www.interaksyon.com); The Philippine Star (URL: http://www.philstar.com/); Sunstar (URL: http://www.sunstar.com.ph/).
Seulawah Agam (Indonesia) — April 2013 Cite this Report
Seulawah Agam
Indonesia
5.448°N, 95.658°E; summit elev. 1810 m
All times are local (unless otherwise noted)
Alert Level raised due to increased seismicity in January 2013
Seulawah Agam (also known as Seuleuwah Agam) volcano, one of three active stratovolcanoes in the Aceh province (>5 million inhabitants), is located at the NW tip of Sumatra. Seulawah Agam has two craters, van Heutsz (Heszt), the most active crater at an elevation of 714 m on the N flank, and Simpago on the S flank. The Indonesian Center of Volcanology and Geological Hazard Mitigation (CVGHM) reported that activity at Seulawah Agam is generally characterized by white plumes rising ˜1 m from the crater. Seulawah Agam has remained non-eruptive through at least 2 January 2013.
Historical data indicated that Seulawah Agam volcano last erupted 12-13 January 1839 on its NNE flank (van Heutsz crater). Prior to that, an eruption occurred in 1510 (˜10 years), also on its NNE flank.
During April to August 2010, the seismic data suggested increased activity overall, with marginal fluctuation. On 1 September 2010, CVGHM raised the Alert Level from I to II and restricted visitors from approaching the crater within a 3-km radius. [The 4-level Indonesian Alert Level Scale is as follows: I - Normal (green); II - Waspada or Alert (yellow); III - Siaga or Standby (orange); and IV - Awas or Aware (red).]
During October 2010-July 2011 overall activity at Seulawah Agam decreased; seismicity, water temperature, and magmatic gas emissions decreased, but pH measurements were stable and no significant changes at the surface were observed. The volcano was often shrouded in fog during this period. On 11 July 2011 the Alert Level was lowered from II to I.
Beginning on 27 December 2012 (table 3), there was an increase in deep volcanic seismicity over the course of the following week. Visual observations were often prevented due to fog, although on 2 January 2013 scientists observed a new solfatara (a natural volcanic steam vent in which sulfur gases are the dominant constituent, along with hot water vapor) that produced roaring noises and emissions which drifted ˜20 m out from van Heutsz Crater. On 3 January 2013 the Alert Level was raised from I to II; then, on 11 May 2013, the Level was lowered to I.
Table 3. Daily numbers of earthquakes measured at Seulawah Agam volcano from the week 27 Dec 2012-2 January 2013. Courtesy of CVGHM.
| Date |
Deep volcanic (VA) |
Shallow volcanic (VB) |
Local tectonic (TL) |
Long-distance tectonic (TJ) |
| 27 Dec 2012 |
4 |
1 |
3 |
-- |
| 28 Dec 2012 |
8 |
-- |
-- |
3 |
| 29 Dec 2012 |
5 |
-- |
2 |
1 |
| 30 Dec 2012 |
2 |
-- |
-- |
1 |
| 31 Dec 2012 |
14 |
-- |
3 |
3 |
| 01 Jan 2013 |
14 |
-- |
6 |
3 |
| 02 Jan 2013 |
8 |
-- |
5 |
4 |
Geologic Background. Seulawah Agam at the NW tip of Sumatra is an extensively forested volcano of Pleistocene-Holocene age constructed within the large Pleistocene Lam Teuba caldera. A smaller 8 x 6 km caldera lies within Lam Teuba caldera. The summit contains a forested, 400-m-wide crater. The active van Heutsz crater, located at 650 m on the NNE flank of Suelawah Agam, is one of several areas containing active fumarole fields. Sapper (1927) and the Catalog of Active Volcanoes of the World (CAVW) reported an explosive eruption in the early 16th century, and the CAVW also listed an eruption from the van Heutsz crater in 1839. Rock et al. (1982) found no evidence for historical eruptions. However the Volcanological Survey of Indonesia noted that although no historical eruptions have occurred from the main cone, the reported NNE-flank explosive activity may have been hydrothermal and not have involved new magmatic activity.
Information Contacts: Center of Volcanology and Geological Hazard Mitigation (CVGHM), Jalan Diponegoro No. 57, Bandung 40122, Indonesia (URL: http://proxy.vsi.esdm.go.id/index.php).
Sheveluch
Russia
56.653°N, 161.36°E; summit elev. 3283 m
All times are local (unless otherwise noted)
Dome growth and volcanic activity continues
Background. A summary of Shiveluch volcano was included in a paper by Van Manen and others (2012). It noted that the activity of Shiveluch was predominantly characterized by dome formation accompanied by strong explosions (as described by Belousov and others, 1999). After 14 years of intense fumarolic activity, Shiveluch fed a Plinian eruption accompanied by large-scale edifice failure on 11 November 1964 (Gorshkov and Dubik, 1970). Since 1964, at least 0.27 km3 of magma had been discharged from Shiveluch during three main phases: (1) 1980-1981, (2) 1993-1995 and (3) 2001-2004 (Dirksen and others, 2006). An additional phase of dome extrusion, accompanied by minor explosive activity that commenced in 2006, continued at least to January 2012. Each of these phases was associated with andesite dome growth punctuated by explosions.
A website by KVERT (Kamchatka Volcanic Eruption Response Team) (2013) shows several years of primarily ground-based photographs of plumes from Shiveluch volcano.
The Institute of Volcanology and Seismology website (2013) reported that Shiveluch is noted for its unusual rocks, close to adakites, likely indicating its position over the northern edge of the subducting Pacific plate, warmed by mantle flow (Volynets et al. 2000; Yogodzinski et al. 2001). It is one of the most prolific explosive centers of Kamchatka, with a magma discharge of ˜36x106 tons per year, an order of magnitude higher than that typical of island arc volcanoes (Melekestsev et al. 1991).
March 2011-May 2013. Our last issue on Shiveluch covered up to March 2011 (BGVN 36:04). Based on visual observations and analyses of satellite data, KVERT reported that from March 2011 through at least May 2013, explosive-extrusive-effusive eruption of the volcano continued. A viscous lava flow effused on the NW to E flanks of the lava dome, accompanied by hot avalanches, incandescence, and fumarolic activity. Satellite imagery showed a daily thermal anomaly on the lava dome when not obscured by clouds. The Aviation Color Code remained at Orange except for a few days in October 2011.
In Table 11 we include several representative cases where possible plumes (steam and/or ash) of larger sizes were documented during the last 2 years. Measurements were made by ground observers or from satellite images; in many cases, cloud cover over several weeks or months presumably excluded observations. In addition, the KVERT reports contain many unexplained time gaps for description of the plume.
Table 11. Representative cases of occurrence of reported possible plume altitude in excess of 8 km and/or plume drift greater than 100 km during the period March 2011-June 2013; "nr" = not reported. It should be noted that the distances based on observations are probably accurate to no more than ˜1-2 km. International flights were rerouted on 28-31 August 2011. The Aviation Color code was raised to Red, then lowered to Orange during 3-8 October 2011. Courtesy of KVERT and Tokyo Volcanic Ash Advisory Center (VAAC).
| Date(s) |
Plume altitude |
Plume drift (km)/direction |
Comments |
| 11-18 Mar 11 |
3.8-8 km |
312 km/W and NW |
-- |
| 18-20 Mar 11 |
5.8 km |
373 km/SE and N |
-- |
| 1-5 Apr 11 |
7.5 km |
187 km |
-- |
| 22-27 Apr 11 |
6.7 km |
153 km/N; 400 km/SE |
-- |
| 1 May 11 |
4.5 km |
124 km/NE |
-- |
| 5-7 May 11 |
3-7.5 km |
196 km/N |
-- |
| 29-31 May 11 |
7.6-10 km |
1,000 km/S-SW |
-- |
| 4-6 Jun 11 |
6.1-9.1 km |
734 km/SE |
-- |
| 15 Jun 11 |
10 km |
26 km/NW |
-- |
| 19-21 Jun 11 |
10 km |
176 km/nr |
-- |
| 23 Aug 11 |
8.2 km |
nr/nr |
-- |
| 28-31 Aug 11 |
6.1-8.6 km |
nr/E and NE |
International flights rerouted |
| 11 Sep 11 |
10.3 km |
nr/nr |
-- |
| 3-8 Oct 11 |
6-9 km |
160 km/NE |
Aviation Color Code raised to Red, then lowered to Orange |
| 13-18 Oct 11 |
8-10.5 km |
75 km/E |
-- |
| 21-25 Oct 11 |
7.1-10.6 km |
170 km/SE |
-- |
| 25-28 Mar 12 |
7 km |
192 km/E and SE |
-- |
| 29 Mar-3 Apr 12 |
6.6 km |
114 km/W,E, and NE |
-- |
| 14-18 Apr 12 |
4-7.5 km |
120 km/N, NE, and E |
-- |
| 24 Apr 12 |
10 km |
396 km/NE |
-- |
| 1 May 12 |
5 km |
270 km/NE |
-- |
| 5 May 12 |
10 km |
800 km/SE |
-- |
| 12 May 12 |
8 km |
800 km/E |
-- |
| 19-20 May 12 |
9.1-9.5 km |
410 km/SW |
-- |
| 25-30 May 12 |
9 km |
555 km/SW, SE, and E |
-- |
| 2 Jun 12 |
9.1 km |
250 km/S |
-- |
| 5-6 Jun 12 |
8-8.2 km |
nr/nr |
-- |
| 15 Jun 12 |
8.2 km |
nr/nr |
-- |
| 24 Jun 12 |
5.2-9.8 km |
nr/nr |
-- |
| 27 Jul 12 |
10.1 km |
nr/nr |
-- |
| 6-11 Apr 12 |
7.7 km |
210 km/SW and SE |
-- |
| 18-20 Sep 12 |
8 km |
2,000 km/SE |
-- |
| 4-6 Oct 12 |
6-7 km |
360 km/SE |
-- |
| 4-6 Mar 13 |
7-9 km |
200 km/SE |
-- |
| 10 Jun 13 |
7-8 km |
nr/nr |
-- |
As shown on the table, on 5 October 2011, KVERT reported that the current Aviation Color Code for Shiveluch was Red. Activity of the volcano began to increase from 3 October. Ash plumes rose up to 6.0-9.0 km on 3-5 October. According to visual data, a bright incandesce of the lava dome was observed over several hours. Satellite data showed a large thermal anomaly over the lava dome, and strong explosive events could occur in near time. On 6 October 2011, the Aviation Color Code was reduced to Orange. Explosive-extrusive eruption of the volcano continued. New lava extruded at the lava dome after strong explosions on 3-5 October, and moderate seismic activity of the volcano continued. On 5-6 October, ash plumes rose up to 4.5-5.0 km. Ash plumes drifted to the NE from the volcano. Satellite images showed that the large thermal anomaly continued over the lava dome.
A rather interesting pair of satellite images were collected on 6 October 2012 (figure 35). The first image image captured Shiveluch just before an exuption; the second, 2 hours later, showed an eruption plume drifting away from the volcano. The MODVOLC Hot Spots web site showing Modis satellite thermal alerts measured no alert during this 6 October event.
On 4 March 2013, a single explosion ejected an ash plume up to 7 km. Strong collapses of hot avalanches from the lava dome occurred on 6 March, and resulting ash plumes rose up to 5 km and extended about 200 km SE of the volcano. An explosion on 5 April observed by video generated an ash plume that rose to altitudes of 5.5-6 km (figure 36).
References: Belousov, A.B., 1995, The Shiveluch volcanic eruption of 12 November 1964-explosive eruption provoked by failure of the edifice, Journal of Volcanology and Geothermal Research, v. 66, pp. 357-365.
Belousov, A., Belousova, M., and Voight, B., 1999, Multiple edifice failures, debris avalanches and associated eruptions in the Holocene history of Shiveluch volcano, Kamchatka, Russia, Bulletin of Volcanology, v. 61, no. 5, pp. 324-342.
Dirksen, O., Humphreys, M.C.S., Pletchov, P., Melnik, O., Demyanchuk, Y., Sparks, R.S.J., and Mahony, S., 2006, The 2001-2004 dome-forming eruption of Shiveluch volcano, Kamchatka: observation, petrological investigation and numerical modelling, Journal of Volcanology and Geothermal Research, v. 155, issue 3-4, pp. 201-226.
Gorshkov, G.S. and Dubik, Y.M., 1970, Gigantic directed blast as Shiveluch volcano (Kamchatka), Bulletin of Volcanology, v. 34, no. 1, pp. 261-288.
Institute of Volcanology and Seismology, 2013, Holocene Kamchatka volcanoes - Shiveluch, Global Volcanism Program number 1000-27, Kamchatka, Russia (URL: http://www.kscnet.ru/ivs/volcanoes/holocene/main/textpage/shiveluch.htm ).
KVERT, 2013, Current activity of the volcanoes, (URL: http://www.kscnet.ru/ivs/kvert/current_eng.php?pageNum_img=1&name=Sheveluch ).
Melekestsev, I.V., Volynets, O.N., Ermakov, V.A., Kirsanova, T.P., and Masurenkov, Yu.P., 1991, Shiveluch volcano. In: Fedotov, S.A., and Masurenkov, Yu.P. (eds) Active volcanoes of Kamchatka. V. 1. Nauka, Moscow, pp 84-92 [in Russian, summary in English].
Ponomareva, V.V., Pevzne,r M.M., and Melekestsev, I.V., 1998, Large debris avalanches and associated eruptions in the Holocene eruptive history of Shiveluch volcano, Kamchatka, Russia. Bulletin of Volcanology, v. 59, no. 7, pp. 490-505.
van Manen, S.M., Blake, S., and Dehn, J., 2012, Satellite thermal infrared data of Shiveluch, Kliuchevskoi, and Karymsky, 1993-2008: effusion, explosions and the potential to forecast ash plumes, Bulletin of Volcanology, v. 74, pp. 1313-1335 (DOI 10.1007/s00445-012-0599-8).
Volynets, O.N., Babanskii, A.D., and Gol'tsman, Y.V., 2000, Variations in isotopic and trace-element composition of lavas from volcanoes of the Northern group, Kamchatka, in relation to specific features of subduction, Geochemistry International. v. 38, no. 10, pp. 974-989.
Yogodzinski, G.M., Lees, J.M., Churikova, T.G., Dorendorf, F., Woerner, G., and Volynets, O.N., 2001, Geochemical evidence for the melting of subducting oceanic lithosphere at plate edges, Nature, v. 409, 25 January, pp. 500-504.
Geologic Background. The high, isolated massif of Sheveluch volcano (also spelled Shiveluch) rises above the lowlands NNE of the Kliuchevskaya volcano group. The 1,300 km3 andesitic volcano is one of Kamchatka's largest and most active volcanic structures, with at least 60 large eruptions during the Holocene. The summit of roughly 65,000-year-old Stary Shiveluch is truncated by a broad 9-km-wide late-Pleistocene caldera breached to the south. Many lava domes occur on its outer flanks. The Molodoy Shiveluch lava dome complex was constructed during the Holocene within the large open caldera; Holocene lava dome extrusion also took place on the flanks of Stary Shiveluch. Widespread tephra layers from these eruptions have provided valuable time markers for dating volcanic events in Kamchatka. Frequent collapses of dome complexes, most recently in 1964, have produced debris avalanches whose deposits cover much of the floor of the breached caldera.
Information Contacts: Kamchatkan Volcanic Eruption Response Team (KVERT) (URL: http://www.kscnet.ru/ivs/kvert/index_eng.php); Tokyo Volcanic Ash Advisory Center (VAAC); NASA Earth Observatory (URL: http://earthobservatory.nasa.gov/NaturalHazards/view.php?id=80830).
Sinabung (Indonesia) — April 2013 Cite this Report
Sinabung
Indonesia
3.17°N, 98.392°E; summit elev. 2460 m
All times are local (unless otherwise noted)
Two simultaneous ash plumes from adjacent vents on 30 August 2010
Our previous report on Sinabung (BGVN 36:03) discussed the decreased activity following the 27 August-September 2010 eruption (BGVN 35:07). That was Sinabung's first confirmed Holocene eruption (although there was an unconfirmed eruption in 1881). The decrease in activity since that event prompted Center of Volcanology and Geological Hazard Mitigation (CVGHM) to lower the Alert Level to 3 (on a scale of 1-4) on 23 September, where it remained through at least mid-March 2011. Sinabung is the highest mountain in North Sumatra and sits 80 km NNW of the Toba caldera.
This report includes a more recently available post eruption photo (figure 3). That photo was taken from an aircraft on 13 May 2011 and posted by Johnny Siahaan on Flickr (Siahaan, 2010).
This report also includes aspects of the eruption (Siahaan, 2010) during August-September 2010 (BGVN 35:07), including video of the Mt. Sinabung. Johnny Siahaan's video of 30 August 2010 shows a scene with two separate ash plumes rising together (figure 4). The larger plume emitted laterally (almost horizontally) but convection of the hot ash and gasses bent it into the vertical well out over the flank of the volcano. The other plume was initially smaller, escaping from an adjacent but distinct area of the summit, and rising nearly vertically. The two plumes appear to merge at altitude and then bend in the wind. What looks like an older plume in the distance near the beginning of the video rose and was strongly sheared in the wind. The "look direction" of the video was not stated.
References: Siahaan, J, Image 1414, Sinabung Flickr (URL: http://www.flickr.com/photos/johnnysiahaan/5735509397/)
Siahaan, J, 30 August 2010, Mount Sinabung Eruption, YouTube video (URL: http://www.youtube.com/watch?v=dMSkvYRxLwA )
Siahaan, J, 30 August 2010, Gunung Sinabung Meletus, YouTube video (URL: http://www.youtube.com/watch?v=dMSkvYRxLwA )
Geologic Background. Gunung Sinabung is a Pleistocene-to-Holocene stratovolcano with many lava flows on its flanks. The migration of summit vents along a N-S line gives the summit crater complex an elongated form. The youngest crater of this conical andesitic-to-dacitic edifice is at the southern end of the four overlapping summit craters. The youngest deposit is a SE-flank pyroclastic flow 14C dated by Hendrasto et al. (2012) at 740-880 CE. An unconfirmed eruption was noted in 1881, and solfataric activity was seen at the summit and upper flanks in 1912. No confirmed historical eruptions were recorded prior to explosive eruptions during August-September 2010 that produced ash plumes to 5 km above the summit.
Information Contacts: Center of Volcanology and Geological Hazard Mitigation (CVGHM), Jalan Diponegoro 57, Bandung 40122, Indonesia (URL: http://vsi.esdm.go.id/).
Suwanosejima (Japan) — April 2013 Cite this Report
Suwanosejima
Japan
29.638°N, 129.714°E; summit elev. 796 m
All times are local (unless otherwise noted)
Near continuous tremor between July 2012 and March 2013
This report discusses Suwanose-jima (figure 16) during July 2012 through April 2013, an interval with generally abundant tremor, low numbers of earthquakes, weak plumes (less than 0.7 km above the crater rim), and occasional intermittent eruptions. Our previous report on Suwanose-jima discussed seismicity through June 2012 that included volcanic earthquakes and tremor, minor explosions, and plumes which occasionally deposited ash [in the residential area ~4 km SSW of the active crater, administratively part of the multi-island Toshima Village,] as late as June 2012 (BGVN 37:08).
Recent monthly reports of volcanic activity from the Japan Meteorological Agency (JMA) translated into English resumed in October 2010. Since June 2012, English-translated JMA reports on Suwanose-jima were available online every month through March 2013.
According to JMA, seismic activity at Suwanose-jima remained at low levels between July 2012 and March 2013. Although explosive eruptions have occurred repeatedly in the past, no such eruption occurred during the reporting period. However, JMA reported infrequent tiny eruptions. Volcanic tremor occurred almost continually between 28 September 2012 and March 2013. A high-sensitivity camera often detected a weak night glow during every month. No unusual ground deformation was seen in GPS observation data. Table 11 summarizes tremor activity and other information reported by JMA.
Table 11. A compilation of data on Suwanose-jima between July 2012 and March 2013. '--' indicates data not reported. A-type earthquakes are generally considered to have shallow focal depths; B-type earthquakes, deeper focal depths. An asterisk "*" in the earthquake column indicates that the number of events reported for a specific month conflicts with the number reported for that same month in the sequential monthly JMA report. Data courtesy of JMA.
| Month |
Earthquakes |
Tremor duration (hours:minutes) |
Max plume height (m above crater rim) |
Comments |
| Jul 2012 |
29 A-type events, 123 B-type events |
38:5 |
400 |
Eruption. |
| Aug 2012 |
17 A-type events, 39 B-type events (or 60 events)* |
0:0 (or 0:1)* |
300 |
No eruption. Plume on 19 Aug only. |
| Sep 2012 |
37 A-type events, 86 B-type events (or 74 events)* |
0:1 (or 67:52)* |
300-400 |
No eruption. White plumes. 11 Sep aerial observation spotted white plume above Otake crater. |
| Oct 2012 |
22 A-type events, 78 B-type events. |
705:19 |
700 |
Tiny intermittent eruptions at Otake crater. According to Tokyo VAAC, an ash plume on 3 Oct drifted SW at altitude of 3 km (i.e. 1.5 km higher than the JMA reported). Ashfall [in the village], 4 km SSW of Otake, on 2 and 5 Oct. |
| Nov 2012 |
-- |
720:0 |
500-600 |
Tiny intermittent eruptions. Tiny amount of ashfall [in the village] on 25 Nov. |
| Dec 2012 |
-- |
622:23 |
500 |
Tiny intermittent eruptions on 26th, red hot mass seen. |
| Jan 2013 |
-- |
744:0 |
500 |
White plumes. |
| Feb 2013 |
-- |
672:0 |
500 |
M 3.6 earthquake on 19 Feb with aftershocks. Tiny intermittent eruption on 3 Feb. Tiny amount of ashfall [in the village] on 3 Feb. |
| Mar 2013 |
-- |
-- |
500 |
Tremor data unavailable. |
| Apr 2013 |
-- |
-- |
700 |
Small eruption on 13 April. Tremor data unavailable. |
On 8 November 2012, a field survey at Bunka crater revealed no remarkable change in the crater's shape. Infrared images showed no significant change in the crater's temperature distribution. On 26 December 2012, an aerial observation revealed a red-hot lava mass inside Otake crater. This phenomenon has occasionally been observed in past observations.
On 19 February 2013, a M 3.6 earthquake occurred (apparently at Suwanose-jima). The earthquake's maximum seismic intensity on JMA's scale was 3 (felt indoors by most or all people, objects rattle and fall off tables, houses shake strongly and may receive slight damage). In addition, a swarm of ten earthquakes (aftershocks?) with seismic intensities of 1 or greater on JMA's scale were recorded. These earthquakes caused no significant changes in surface phenomena or tiltmeter data. Seismicity remained at low levels, with hypocenters located just beneath the Otake crater.
Geologic Background. The 8-km-long island of Suwanosejima in the northern Ryukyu Islands consists of an andesitic stratovolcano with two active summit craters. The summit is truncated by a large breached crater extending to the sea on the E flank that was formed by edifice collapse. One of Japan's most frequently active volcanoes, it was in a state of intermittent Strombolian activity from Otake, the NE summit crater, between 1949 and 1996, after which periods of inactivity lengthened. The largest recorded eruption took place in 1813-14, when thick scoria deposits covered residential areas, and the SW crater produced two lava flows that reached the western coast. At the end of the eruption the summit of Otake collapsed, forming a large debris avalanche and creating an open collapse scarp extending to the eastern coast. The island remained uninhabited for about 70 years after the 1813-1814 eruption. Lava flows reached the eastern coast of the island in 1884. Only about 50 people live on the island.
Information Contacts: Japan Meteorological Agency (JMA), Otemachi, 1-3-4, Chiyoda-ku Tokyo 100-8122, Japan (URL: http://www.jma.go.jp/); Tokyo Volcanic Ash Advisory Center (VAAC), Tokyo, Japan (URL: http://ds.data.jma.go.jp/svd/vaac/data/).
Zubair Group (Yemen) — April 2013 Cite this Report
Zubair Group
Yemen
15.05°N, 42.18°E; summit elev. 191 m
All times are local (unless otherwise noted)
Eruption on new island continues into January 2012
In BGVN 36:11 we reported on an ongoing submarine eruption in the N portion of Yemen's Zubair group of islands in the Red Sea that [produced visible activity on 18 December 2011]. A new island emerged in this vicinity and was large enough to resolve in satellite imagery by 23 December 2011. The latitude and longitude given in the header for this report is for the volcanic island of Jebel Zubair (15.05°N, 42.18°E), the largest island of the Zubair Group (figure 5). The new island emerged approximately 15.158°N, 42.101°E, or ˜10 km NW off the NW coast of Jebel Zabair. A bathymetric sketch map made in 1973 indicated a water depth of about 100 m in that area. The S end of the new island is about 500 m NNW of Rugged Island.
By 7 January 2012, the island had grown to about 530 x 710 m, and a gas-and-steam plume containing ash rose from a distinct cone (figure 6). A video from a Yemeni miliary helicopter uploaded on YouTube on 2 January 2012 showed violent explosions typical of shallow submarine eruptions. The satellite image in figure 6 shows that a new island in the Zubair Group is the source of the volcanic plume.
Natural-color images from the Enhanced Thematic Mapper Plus (ETM+) on Landsat-7 on 15 January and 15 February 2012 show the new island, but no plume rising from it or any other indication of eruption continuing.
MODVOLC, using MODIS data from the Aqua satellite, measured a 2-pixel thermal anomaly at 2235 UTC, 11 January 2012, at latitude 15.16°N, longitude 42.10°E, just S of Haycock Island. This was the only thermal alert measured in the area during the December 2011-January 2012 time period.
References: Gass, I.G., Mallick, D.I.J., and Cox, K.G., 1973, Volcanic islands of the Red Sea. Journal of the Geological Society of London, v. 129, no. 3, pp. 275-309.
Vervaeck, A., 2012 (17 January), Surtseyan eruption along the coast of Yemen forms a new island - January 15 new ALI satellite image, Earthquake newsreport web site (URL: http://earthquake-report.com/2011/12/29/surtseyan-eruption-along-the-coast-of-yemen-forms-a-new-island-today-eruption-cloud-stain); accessed 21 May 2013.
YouTube video uploaded by Naif8989889 on 2 January 2012, (http://www.youtube.com/watch?v=YoMLNEJC-Nk&feature=gu&context=G2d0c74aFUAAAAAAAAAA).
Geologic Background. The 5-km-long Jebel Zubair Island is the largest of a group of small islands and submerged shoals that rise from a shallow platform in the Red Sea rift. The platform and eruptive vents forming the islands and shoals are oriented NNW-SSE, parallel to the rift. An early explosive phase was followed by a brief period of marine erosion, then by renewed explosive activity accompanied by the extrusion of basaltic pahoehoe lava flows. This latest phase of activity occurred on the morphologically youngest islands of Zubair, Centre Peak, Saba, and Haycock. Historical explosive activity was reported from Saddle Island in the 19th century. Spatter cones and pyroclastic cones were erupted along fissures that form the low spine of Zubair Island. Eruptions that began in late 2011 built two new islands, increasing the total number in the group to 12.
Information Contacts: NASA Earth Observatory (URL: http://www.earthobservatory.gov).