Recently Published Bulletin Reports
Manam (Papua New Guinea) Few ash plumes during November-December 2022
Krakatau (Indonesia) Strombolian activity and ash plumes during November 2022-April 2023
Stromboli (Italy) Strombolian explosions and lava flows continue during January-April 2023
Nishinoshima (Japan) Small ash plumes and fumarolic activity during November 2022 through April 2023
Karangetang (Indonesia) Lava flows, incandescent avalanches, and ash plumes during January-June 2023
Ahyi (United States) Intermittent hydroacoustic signals and discolored plumes during November 2022-June 2023
Kadovar (Papua New Guinea) An ash plume and weak thermal anomaly during May 2023
San Miguel (El Salvador) Small gas-and-ash explosions during March and May 2023
Semisopochnoi (United States) Occasional explosions, ash deposits, and gas-and-steam plumes during December 2022-May 2023
Ebeko (Russia) Continued explosions, ash plumes, and ashfall during October 2022-May 2023
Home Reef (Tonga) Discolored plumes continued during November 2022-April 2023
Ambae (Vanuatu) New lava flow, ash plumes, and sulfur dioxide plumes during February-May 2023
Manam (Papua New Guinea) — July 2023  Cite this Report
Manam
Papua New Guinea
4.08°S, 145.037°E; summit elev. 1807 m
All times are local (unless otherwise noted)
Few ash plumes during November-December 2022
Manam is a 10-km-wide island that consists of two active summit craters: the Main summit crater and the South summit crater and is located 13 km off the northern coast of mainland Papua New Guinea. Frequent mild-to-moderate eruptions have been recorded since 1616. The current eruption period began during June 2014 and has more recently been characterized by intermittent ash plumes and thermal activity (BGVN 47:11). This report updates activity that occurred from November 2022 through May 2023 based on information from the Darwin Volcanic Ash Advisory Center (VAAC) and various satellite data.
Ash plumes were reported during November and December 2022 by the Darwin VAAC. On 7 November an ash plume rose to 2.1 km altitude and drifted NE based on satellite images and weather models. On 14 November an ash plume rose to 2.1 km altitude and drifted W based on RVO webcam images. On 20 November ash plumes rose to 1.8 km altitude and drifted NW. On 26 December an ash plume rose to 3 km altitude and drifted S and SSE.
Intermittent sulfur dioxide plumes were detected using the TROPOMI instrument on the Sentinel-5P satellite, some of which exceeded at least two Dobson Units (DU) and drifted in different directions (figure 93). Occasional low-to-moderate power thermal anomalies were recorded by the MIROVA (Middle InfraRed Observation of Volcanic Activity) system; less than five anomalies were recorded each month during November 2022 through May 2023 (figure 94). Two thermal hotspots were detected by the MODVOLC thermal alerts system on 10 December 2022. On clear weather days, thermal activity was also captured in infrared satellite imagery in both the Main and South summit craters, accompanied by gas-and-steam emissions (figure 95).
Geologic Background. The 10-km-wide island of Manam, lying 13 km off the northern coast of mainland Papua New Guinea, is one of the country's most active volcanoes. Four large radial valleys extend from the unvegetated summit of the conical basaltic-andesitic stratovolcano to its lower flanks. These valleys channel lava flows and pyroclastic avalanches that have sometimes reached the coast. Five small satellitic centers are located near the island's shoreline on the northern, southern, and western sides. Two summit craters are present; both are active, although most observed eruptions have originated from the southern crater, concentrating eruptive products during much of the past century into the SE valley. Frequent eruptions, typically of mild-to-moderate scale, have been recorded since 1616. Occasional larger eruptions have produced pyroclastic flows and lava flows that reached flat-lying coastal areas and entered the sea, sometimes impacting populated areas.
Information Contacts: Rabaul Volcano Observatory (RVO), Geohazards Management Division, Department of Mineral Policy and Geohazards Management (DMPGM), PO Box 3386, Kokopo, East New Britain Province, Papua New Guinea; Darwin Volcanic Ash Advisory Centre (VAAC), Bureau of Meteorology, Northern Territory Regional Office, PO Box 40050, Casuarina, NT 0811, Australia (URL: http://www.bom.gov.au/info/vaac/); MIROVA (Middle InfraRed Observation of Volcanic Activity), a collaborative project between the Universities of Turin and Florence (Italy) supported by the Centre for Volcanic Risk of the Italian Civil Protection Department (URL: http://www.mirovaweb.it/); Hawai'i Institute of Geophysics and Planetology (HIGP) - MODVOLC Thermal Alerts System, School of Ocean and Earth Science and Technology (SOEST), Univ. of Hawai'i, 2525 Correa Road, Honolulu, HI 96822, USA (URL: http://modis.higp.hawaii.edu/); NASA Global Sulfur Dioxide Monitoring Page, Atmospheric Chemistry and Dynamics Laboratory, NASA Goddard Space Flight Center (NASA/GSFC), 8800 Greenbelt Road, Goddard, Maryland, USA (URL: https://so2.gsfc.nasa.gov/); Copernicus Browser, Copernicus Data Space Ecosystem, European Space Agency (URL: https://dataspace.copernicus.eu/browser/).
Krakatau (Indonesia) — July 2023 Cite this Report
Krakatau
Indonesia
6.1009°S, 105.4233°E; summit elev. 285 m
All times are local (unless otherwise noted)
Strombolian activity and ash plumes during November 2022-April 2023
Krakatau is located in the Sunda Strait between Java and Sumatra, Indonesia. Caldera collapse during the catastrophic 1883 eruption destroyed Danan and Perbuwatan cones and left only a remnant of Rakata. The post-collapse cone of Anak Krakatau (Child of Krakatau) was constructed within the 1883 caldera at a point between the former Danan and Perbuwatan cones; it has been the site of frequent eruptions since 1927. The current eruption period began in May 2021 and has recently consisted of explosions, ash plumes, and thermal activity (BGVN 47:11). This report covers activity during November 2022 through April 2023 based on information provided by the Indonesian Center for Volcanology and Geological Hazard Mitigation, referred to as Pusat Vulkanologi dan Mitigasi Bencana Geologi (PVMBG), MAGMA Indonesia, the Darwin Volcanic Ash Advisory Center (VAAC), and several sources of satellite data.
Activity was relatively low during November and December 2022. Daily white gas-and-steam plumes rose 25-100 m above the summit and drifted in different directions. Gray ash plumes rose 200 m above the summit and drifted NE at 1047 and at 2343 on 11 November. On 14 November at 0933 ash plumes rose 300 m above the summit and drifted E. An ash plume was reported at 0935 on 15 December that rose 100 m above the summit and drifted NE. An eruptive event at 1031 later that day generated an ash plume that rose 700 m above the summit and drifted NE. A gray ash plume at 1910 rose 100 m above the summit and drifted E. Incandescent material was ejected above the vent based on an image taken at 1936.
During January 2023 daily white gas-and-steam plumes rose 25-300 m above the summit and drifted in multiple directions. Gray-to-brown ash plumes were reported at 1638 on 3 January, at 1410 and 1509 on 4 January, and at 0013 on 5 January that rose 100-750 m above the summit and drifted NE and E; the gray-to-black ash plume at 1509 on 4 January rose as high as 3 km above the summit and drifted E. Gray ash plumes were recorded at 1754, 2241, and 2325 on 11 January and at 0046 on 12 January and rose 200-300 m above the summit and drifted NE. Toward the end of January, PVMBG reported that activity had intensified; Strombolian activity was visible in webcam images taken at 0041, 0043, and 0450 on 23 January. Multiple gray ash plumes throughout the day rose 200-500 m above the summit and drifted E and SE (figure 135). Webcam images showed progressively intensifying Strombolian activity at 1919, 1958, and 2113 on 24 January; a gray ash plume at 1957 rose 300 m above the summit and drifted E (figure 135). Eruptive events at 0231 and 2256 on 25 January and at 0003 on 26 January ejected incandescent material from the vent, based on webcam images. Gray ash plumes observed during 26-27 January rose 300-500 m above the summit and drifted NE, E, and SE.
Low levels of activity were reported during February and March. Daily white gas-and-steam plumes rose 25-300 m above the summit and drifted in different directions. The Darwin VAAC reported that continuous ash emissions rose to 1.5-1.8 km altitude and drifted W and NW during 1240-1300 on 10 March, based on satellite images, weather models, and PVMBG webcams. White-and-gray ash plumes rose 500 m and 300 m above the summit and drifted SW at 1446 and 1846 on 18 March, respectively. An eruptive event was recorded at 2143, though it was not visible due to darkness. Multiple ash plumes were reported during 27-29 March that rose as high as 2.5 km above the summit and drifted NE, W, and SW (figure 136). Webcam images captured incandescent ejecta above the vent at 0415 and around the summit area at 2003 on 28 March and at 0047 above the vent on 29 March.
Daily white gas-and-steam plumes rose 25-300 m above the summit and drifted in multiple directions during April and May. White-and-gray and black plumes rose 50-300 m above the summit on 2 and 9 April. On 11 May at 1241 a gray ash plume rose 1-3 km above the summit and drifted SW. On 12 May at 0920 a gray ash plume rose 2.5 km above the summit and drifted SW and at 2320 an ash plume rose 1.5 km above the summit and drifted SW. An accompanying webcam image showed incandescent ejecta. On 13 May at 0710 a gray ash plume rose 2 km above the summit and drifted SW (figure 137).
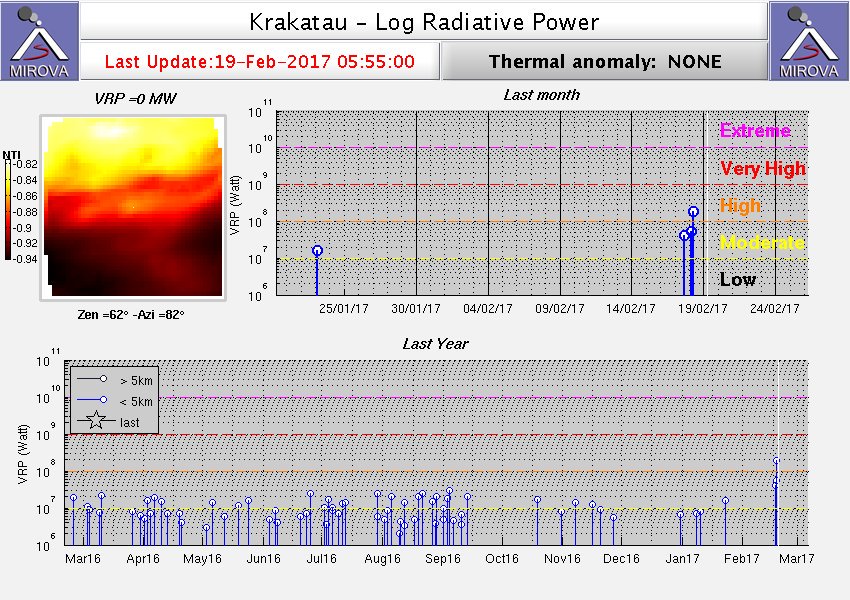
The MIROVA (Middle InfraRed Observation of Volcanic Activity) graph of MODIS thermal anomaly data showed intermittent low-to-moderate power thermal anomalies during November 2022 through April 2023 (figure 138). Some of this thermal activity was also visible in infrared satellite imagery at the crater, accompanied by gas-and-steam and ash plumes that drifted in different directions (figure 139).
Geologic Background. The renowned Krakatau (frequently mis-named as Krakatoa) volcano lies in the Sunda Strait between Java and Sumatra. Collapse of an older edifice, perhaps in 416 or 535 CE, formed a 7-km-wide caldera. Remnants of that volcano are preserved in Verlaten and Lang Islands; subsequently the Rakata, Danan, and Perbuwatan cones were formed, coalescing to create the pre-1883 Krakatau Island. Caldera collapse during the catastrophic 1883 eruption destroyed Danan and Perbuwatan, and left only a remnant of Rakata. This eruption caused more than 36,000 fatalities, most as a result of tsunamis that swept the adjacent coastlines of Sumatra and Java. Pyroclastic surges traveled 40 km across the Sunda Strait and reached the Sumatra coast. After a quiescence of less than a half century, the post-collapse cone of Anak Krakatau (Child of Krakatau) was constructed within the 1883 caldera at a point between the former Danan and Perbuwatan cones. Anak Krakatau has been the site of frequent eruptions since 1927.
Information Contacts: Pusat Vulkanologi dan Mitigasi Bencana Geologi (PVMBG, also known as Indonesian Center for Volcanology and Geological Hazard Mitigation, CVGHM), Jalan Diponegoro 57, Bandung 40122, Indonesia (URL: http://www.vsi.esdm.go.id/); MAGMA Indonesia, Kementerian Energi dan Sumber Daya Mineral (URL: https://magma.esdm.go.id/v1); Darwin Volcanic Ash Advisory Centre (VAAC), Bureau of Meteorology, Northern Territory Regional Office, PO Box 40050, Casuarina, NT 0811, Australia (URL: http://www.bom.gov.au/info/vaac/); MIROVA (Middle InfraRed Observation of Volcanic Activity), a collaborative project between the Universities of Turin and Florence (Italy) supported by the Centre for Volcanic Risk of the Italian Civil Protection Department (URL: http://www.mirovaweb.it/); Copernicus Browser, Copernicus Data Space Ecosystem, European Space Agency (URL: https://dataspace.copernicus.eu/browser/).
Stromboli
Italy
38.789°N, 15.213°E; summit elev. 924 m
All times are local (unless otherwise noted)
Strombolian explosions and lava flows continue during January-April 2023
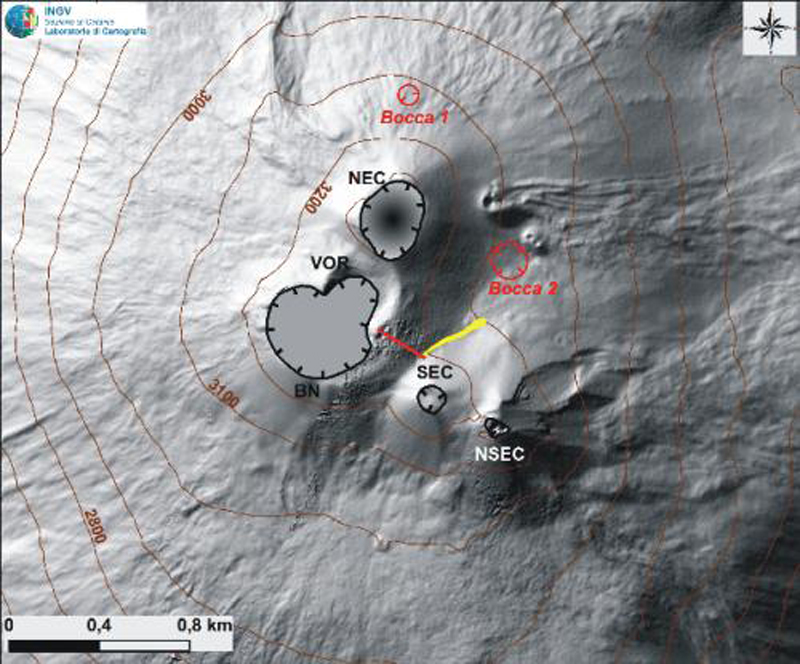
Stromboli, located in Italy, has exhibited nearly constant lava fountains for the past 2,000 years; recorded eruptions date back to 350 BCE. Eruptive activity occurs at the summit from multiple vents, which include a north crater area (N area) and a central-southern crater (CS area) on a terrace known as the ‘terrazza craterica’ at the head of the Sciara del Fuoco, a large scarp that runs from the summit down the NW side of the volcano-island. Activity typically consists of Strombolian explosions, incandescent ejecta, lava flows, and pyroclastic flows. Thermal and visual monitoring cameras are located on the nearby Pizzo Sopra La Fossa, above the terrazza craterica, and at multiple flank locations. The current eruption period has been ongoing since 1934 and recent activity has consisted of frequent Strombolian explosions and lava flows (BGVN 48:02). This report updates activity during January through April 2023 primarily characterized by Strombolian explosions and lava flows based on reports from Italy's Istituto Nazionale di Geofisica e Vulcanologia (INGV) and various satellite data.
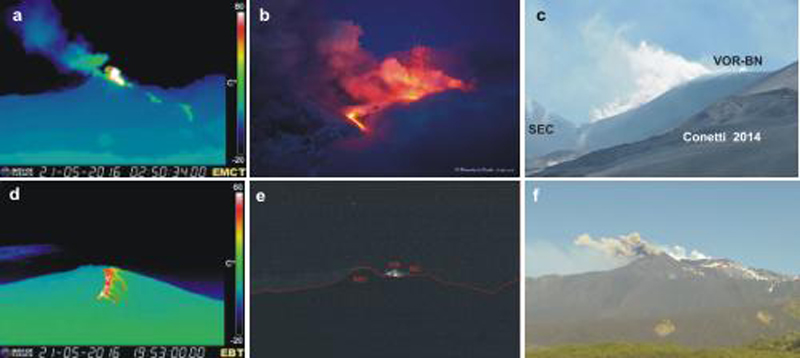
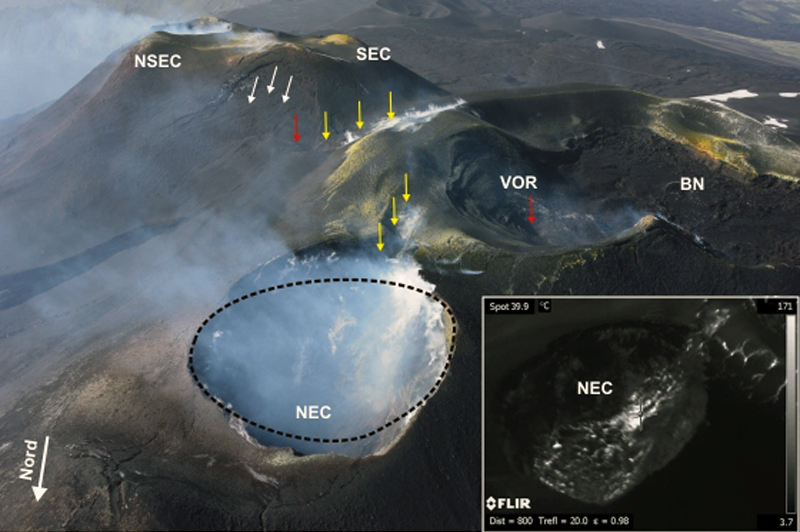
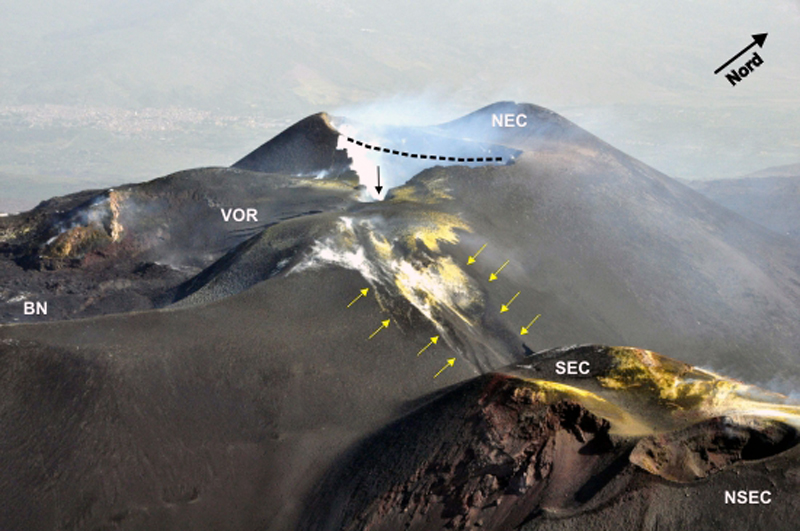
Frequent explosive activity continued throughout the reporting period, generally in the low-to-medium range, based on the number of hourly explosions in the summit crater (figure 253, table 16). Intermittent thermal activity was recorded by the MIROVA (Middle InfraRed Observation of Volcanic Activity) analysis of MODIS satellite data (figure 254). According to data collected by the MODVOLC thermal algorithm, a total of 9 thermal alerts were detected: one on 2 January 2023, one on 1 February, five on 24 March, and two on 26 March. The stronger pulses of thermal activity likely reflected lava flow events. Infrared satellite imagery captured relatively strong thermal hotspots at the two active summit craters on clear weather days, showing an especially strong event on 8 March (figure 255).
Table 16. Summary of type, frequency, and intensity of explosive activity at Stromboli by month during January-April 2023; information from webcam observations. Courtesy of INGV weekly reports.
| Month |
Explosive Activity |
| Jan 2023 |
Typical Strombolian activity with spattering and lava overflows in the N crater area. Explosions were reported from 4 vents in the N area and 1-2 vents in the CS area. The average hourly frequency of explosions was low-to-medium (1-12 events/hour). The intensity of the explosions varied from low (less than 80 m high) to medium (less than 150 m high) in the N crater area and up to high (greater than 150 m high) in the CS crater area. |
| Feb 2023 |
Typical Strombolian activity with spattering in the N crater area. Explosions were reported from 2-3 vents in the N area and 1-4 vents in the CS area. The average hourly frequency of explosions was low-to-medium (1-14 events/hour). The intensity of the explosions varied from low (less than 80 m high) to medium (less than 150 m high) in the N crater area and up to high (greater than 150 m high) in the CS crater area. |
| Mar 2023 |
Typical Strombolian activity with spattering and lava overflows in the N crater area. Explosions were reported from 2-3 vents in the N area and 2-4 vents in the CS area. The average hourly frequency of explosions was low-to-medium (1-18 events/hour). The intensity of the explosions varied from low (less than 80 m high) to medium (less than 150 m high) in the N crater area and up to high (greater than 150 m high) in the CS crater area. |
| Apr 2023 |
Typical Strombolian activity. Explosions were reported from 2 vents in the N area and 2-3 vents in the CS area. The average hourly frequency of explosions was low-to-high (1-16 events/hour). The intensity of the explosions varied from low (less than 80 m high) to medium (less than 150 m high) in both the N and CS crater areas. |
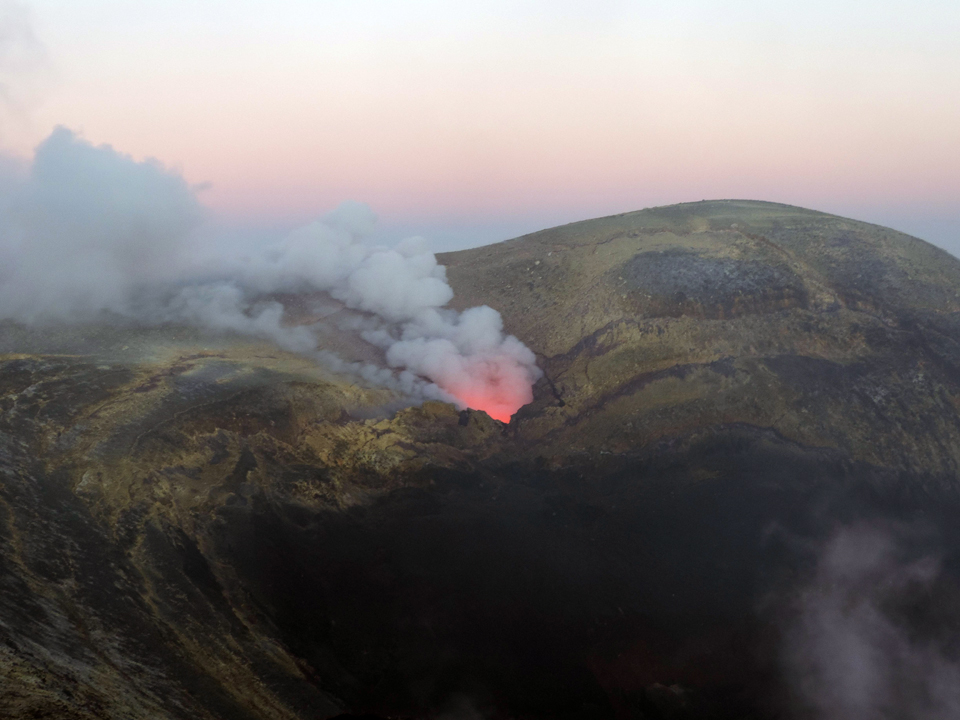
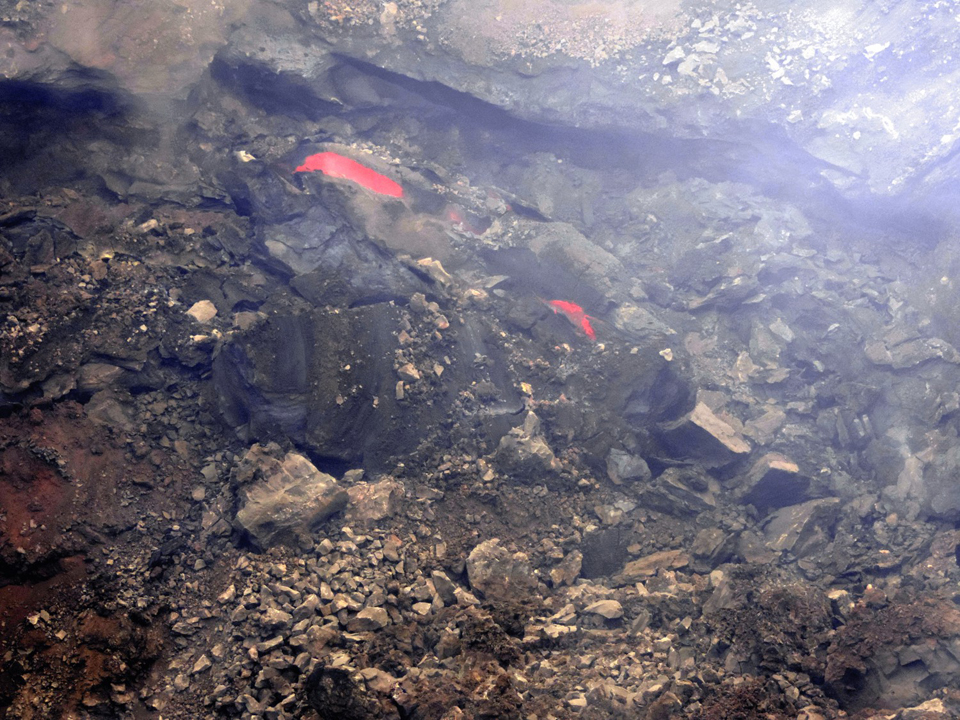
Activity during January-February 2023. Strombolian explosions were reported in the N crater area, as well as lava effusion. Explosive activity in the N crater area ejected coarse material (bombs and lapilli). Intense spattering was observed in both the N1 and N2 craters. In the CS crater area, explosions generally ejected fine material (ash), sometimes to heights greater than 250 m. The intensity of the explosions was characterized as low-to-medium in the N crater and medium-to-high in the CS crater. After intense spattering activity from the N crater area, a lava overflow began at 2136 on 2 January that flowed part way down the Sciara del Fuoco, possibly moving down the drainage that formed in October, out of view from webcams. The flow remained active for a couple of hours before stopping and beginning to cool. A second lava flow was reported at 0224 on 4 January that similarly remained active for a few hours before stopping and cooling. Intense spattering was observed on 11 and 13 January from the N1 crater. After intense spattering activity at the N2 crater at 1052 on 17 January another lava flow started to flow into the upper part of the Sciara del Fuoco (figure 256), dividing into two: one that traveled in the direction of the drainage formed in October, and the other one moving parallel to the point of emission. By the afternoon, the rate of the flow began to decrease, and at 1900 it started to cool. A lava flow was reported at 1519 on 24 January following intense spattering in the N2 area, which began to flow into the upper part of the Sciara del Fuoco. By the morning of 25 January, the lava flow had begun to cool. During 27 January the frequency of eruption in the CS crater area increased to 6-7 events/hour compared to the typical 1-7 events/hour; the following two days showed a decrease in frequency to less than 1 event/hour. Starting at 1007 on 30 January a high-energy explosive sequence was produced by vents in the CS crater area. The sequence began with an initial energetic pulse that lasted 45 seconds, ejecting predominantly coarse products 300 m above the crater that fell in an ESE direction. Subsequent and less intense explosions ejected material 100 m above the crater. The total duration of this event lasted approximately two minutes. During 31 January through 6, 13, and 24 February spattering activity was particularly intense for short periods in the N2 crater.
An explosive sequence was reported on 16 February that was characterized by a major explosion in the CS crater area (figure 257). The sequence began at 1817 near the S2 crater that ejected material radially. A few seconds later, lava fountains were observed in the central part of the crater. Three explosions of medium intensity (material was ejected less than 150 m high) were recorded at the S2 crater. The first part of this sequence lasted approximately one minute, according to INGV, and material rose 300 m above the crater and then was deposited along the Sciara del Fuoco. The second phase began at 1818 at the S1 crater; it lasted seven seconds and material was ejected 150 m above the crater. Another event 20 seconds later lasted 12 seconds, also ejecting material 150 m above the crater. The sequence ended with at least three explosions of mostly fine material from the S1 crater. The total duration of this sequence was about two minutes.
Short, intense spattering activity was noted above the N1 crater on 27 and 28 February. A lava overflow was first reported at 0657 from the N2 crater on 27 February that flowed into the October 2022 drainage. By 1900 the flow had stopped. A second lava overflow also in the N crater area occurred at 2149, which overlapped the first flow and then stopped by 0150 on 28 February. Material detached from both the lava overflows rolled down the Sciara del Fuoco, some of which was visible in webcam images.
Activity during March-April 2023. Strombolian activity continued with spattering activity and lava overflows in the N crater area during March. Explosive activity at the N crater area varied from low (less than 80 m high) to medium (less than 150 m high) and ejected coarse material, such as bombs and lapilli. Spattering was observed above the N1 crater, while explosive activity at the CS crater area varied from medium to high (greater than 150 m high) and ejected coarse material. Intense spattering activity was observed for short periods on 6 March above the N1 crater. At approximately 0610 a lava overflow was reported around the N2 crater on 8 March, which then flowed into the October 2022 drainage. By 1700 the flow started to cool. A second overflow began at 1712 on 9 March and overlapped the previous flow. It had stopped by 2100. Material from both flows was deposited along the Sciara del Fuoco, though much of the activity was not visible in webcam images. On 11 March a lava overflow was observed at 0215 that overlapped the two previous flows in the October 2022 drainage. By late afternoon on 12 March, it had stopped.
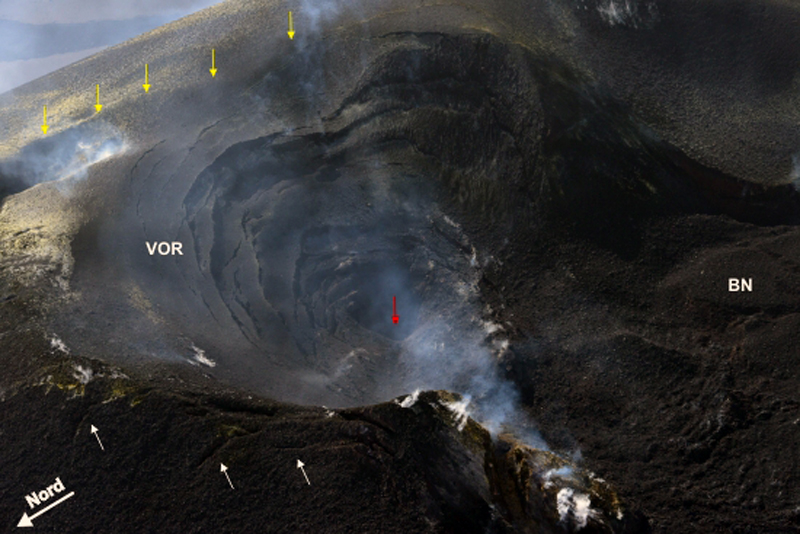
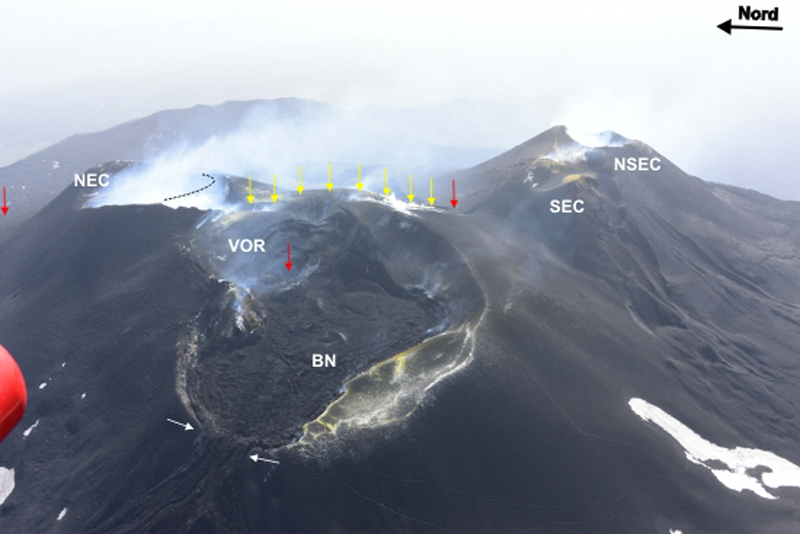
During a field excursion on 16 March, scientists noted that a vent in the central crater area was degassing. Another vent showed occasional Strombolian activity that emitted ash and lapilli. During 1200-1430 low-to-medium intense activity was reported; the N1 crater emitted ash emissions and the N2 crater emitted both ash and coarse material. Some explosions also occurred in the CS crater area that ejected coarse material. The C crater in the CS crater area occasionally showed gas jetting and low intensity explosions on 17 and 22 March; no activity was observed at the S1 crater. Intense, longer periods of spattering were reported in the N1 crater on 19, 24, and 25 March. Around 2242 on 23 March a lava overflow began from the N1 crater that, after about an hour, began moving down the October 2022 drainage and flow along the Sciara del Fuoco (figure 258). Between 0200 and 0400 on 26 March the flow rate increased, which generated avalanches of material from collapses at the advancing flow front. By early afternoon, the flow began to cool. On 25 March at 1548 an explosive sequence began from one of the vents at S2 in the CS crater area (figure 258). Fine ash mixed with coarse material was ejected 300 m above the crater rim and drifted SSE. Some modest explosions around Vent C were detected at 1549 on 25 March, which included an explosion at 1551 that ejected coarse material. The entire explosive sequence lasted approximately three minutes.
During April explosions persisted in both the N and CS crater areas. Fine material was ejected less than 80 m above the N crater rim until 6 April, followed by ejection of coarser material. Fine material was also ejected less than 80 m above the CS crater rim. The C and S2 crater did not show significant eruptive activity. On 7 April an explosive sequence was detected in the CS crater area at 1203 (figure 259). The first explosion lasted approximately 18 seconds and ejected material 400 m above the crater rim, depositing pyroclastic material in the upper part of the Sciara del Fuoco. At 1204 a second, less intense explosion lasted approximately four seconds and deposited pyroclastic products outside the crater area and near Pizzo Sopra La Fossa. A third explosion at 1205 was mainly composed of ash that rose about 150 m above the crater and lasted roughly 20 seconds. A fourth explosion occurred at 1205 about 28 seconds after the third explosion and ejected a mixture of coarse and fine material about 200 m above the crater; the explosion lasted roughly seven seconds. Overall, the entire explosive sequence lasted about two minutes and 20 seconds. After the explosive sequence on 7 April, explosions in both the N and CS crater areas ejected material as high as 150 m above the crater.
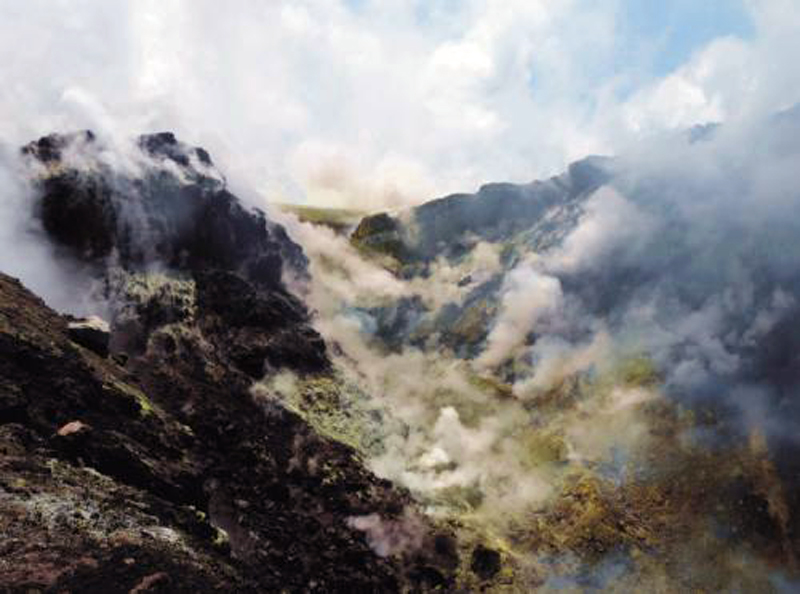
On 21 April research scientists from INGV made field observations in the summit area of Stromboli, and some lapilli samples were collected. In the N crater area near the N1 crater, a small cone was observed with at least two active vents, one of which was characterized by Strombolian explosions. The other vent produced explosions that ejected ash and chunks of cooled lava. At the N2 crater at least one vent was active and frequently emitted ash. In the CS crater area, a small cone contained 2-3 degassing vents and a smaller, possible fissure area also showed signs of degassing close to the Pizzo Sopra La Fossa. In the S part of the crater, three vents were active: a small hornito was characterized by modest and rare explosions, a vent that intermittently produced weak Strombolian explosions, and a vent at the end of the terrace that produced frequent ash emissions. Near the S1 crater there was a hornito that generally emitted weak gas-and-steam emissions, sometimes associated with “gas rings”. On 22 April another field inspection was carried out that reported two large sliding surfaces on the Sciara del Fuoco that showed where blocks frequently descended toward the sea. A thermal anomaly was detected at 0150 on 29 April.
Geologic Background. Spectacular incandescent nighttime explosions at Stromboli have long attracted visitors to the "Lighthouse of the Mediterranean" in the NE Aeolian Islands. This volcano has lent its name to the frequent mild explosive activity that has characterized its eruptions throughout much of historical time. The small island is the emergent summit of a volcano that grew in two main eruptive cycles, the last of which formed the western portion of the island. The Neostromboli eruptive period took place between about 13,000 and 5,000 years ago. The active summit vents are located at the head of the Sciara del Fuoco, a prominent scarp that formed about 5,000 years ago due to a series of slope failures which extends to below sea level. The modern volcano has been constructed within this scarp, which funnels pyroclastic ejecta and lava flows to the NW. Essentially continuous mild Strombolian explosions, sometimes accompanied by lava flows, have been recorded for more than a millennium.
Information Contacts: Istituto Nazionale di Geofisica e Vulcanologia (INGV), Sezione di Catania, Piazza Roma 2, 95123 Catania, Italy, (URL: http://www.ct.ingv.it/en/); MIROVA (Middle InfraRed Observation of Volcanic Activity), a collaborative project between the Universities of Turin and Florence (Italy) supported by the Centre for Volcanic Risk of the Italian Civil Protection Department (URL: http://www.mirovaweb.it/); Hawai'i Institute of Geophysics and Planetology (HIGP) - MODVOLC Thermal Alerts System, School of Ocean and Earth Science and Technology (SOEST), Univ. of Hawai'i, 2525 Correa Road, Honolulu, HI 96822, USA (URL: http://modis.higp.hawaii.edu/); Copernicus Browser, Copernicus Data Space Ecosystem, European Space Agency (URL: https://dataspace.copernicus.eu/browser/).
Nishinoshima (Japan) — July 2023 Cite this Report
Nishinoshima
Japan
27.247°N, 140.874°E; summit elev. 100 m
All times are local (unless otherwise noted)
Small ash plumes and fumarolic activity during November 2022 through April 2023
Nishinoshima is a small island located about 1,000 km S of Tokyo in the Ogasawara Arc in Japan. The island is the summit of a massive submarine volcano that has prominent peaks to the S, W, and NE. Eruptions date back to 1973; the most recent eruption period began in October 2022 and was characterized by ash plumes and fumarolic activity (BGVN 47:12). This report describes ash plumes and fumarolic activity during November 2022 through April 2023 based on monthly reports from the Japan Meteorological Agency (JMA) monthly reports and satellite data.
The most recent eruptive activity prior to the reporting internal occurred on 12 October 2022, when an ash plume rose 3.5 km above the crater rim. An aerial observation conducted by the Japan Coast Guard (JCG) on 25 November reported that white fumaroles rose approximately 200 m above the central crater of a pyroclastic cone (figure 119), and multiple plumes were observed on the ESE flank of the cone. Discolored water ranging from reddish-brown to brown and yellowish-green were visible around the perimeter of the island (figure 119). No significant activity was reported in December.
During an overflight conducted by JCG on 25 January 2023 intermittent activity and small, blackish-gray plumes rose 900 m above the central part of the crater were observed (figure 120). The fumarolic zone of the E flank and base of the cone had expanded and emissions had intensified. Dark brown discolored water was visible around the perimeter of the island.
No significant activity was reported during February through March. Ash plumes at 1050 and 1420 on 11 April rose 1.9 km above the crater rim and drifted NW and N. These were the first ash plumes observed since 12 October 2022. On 14 April JCG carried out an overflight and reported that no further eruptive activity was visible, although white gas-and-steam plumes were visible from the central crater and rose 900 m high (figure 121). Brownish and yellow-green discolored water surrounded the island.
Intermittent low-to-moderate power thermal anomalies were recorded in the MIROVA graph (Middle InfraRed Observation of Volcanic Activity) during November 2022 through April 2023 (figure 123). A cluster of six to eight anomalies were detected during November while a smaller number were detected during the following months: two to three during December, one during mid-January 2023, one during February, five during March, and two during April. Thermal activity was also reflected in infrared satellite data at the summit crater, accompanied by occasional gas-and-steam plumes (figure 124).
Geologic Background. The small island of Nishinoshima was enlarged when several new islands coalesced during an eruption in 1973-74. Multiple eruptions that began in 2013 completely covered the previous exposed surface and continued to enlarge the island. The island is the summit of a massive submarine volcano that has prominent peaks to the S, W, and NE. The summit of the southern cone rises to within 214 m of the ocean surface 9 km SSE.
Information Contacts: Japan Meteorological Agency (JMA), 1-3-4 Otemachi, Chiyoda-ku, Tokyo 100-8122, Japan (URL: http://www.jma.go.jp/jma/indexe.html); MIROVA (Middle InfraRed Observation of Volcanic Activity), a collaborative project between the Universities of Turin and Florence (Italy) supported by the Centre for Volcanic Risk of the Italian Civil Protection Department (URL: http://www.mirovaweb.it/); Copernicus Browser, Copernicus Data Space Ecosystem, European Space Agency (URL: https://dataspace.copernicus.eu/browser/).
Karangetang (Indonesia) — July 2023 Cite this Report
Karangetang
Indonesia
2.781°N, 125.407°E; summit elev. 1797 m
All times are local (unless otherwise noted)
Lava flows, incandescent avalanches, and ash plumes during January-June 2023
Karangetang (also known as Api Siau), at the northern end of the island of Siau, Indonesia, contains five summit craters along a N-S line. More than 40 eruptions have been recorded since 1675; recent eruptions have included frequent explosive activity, sometimes accompanied by pyroclastic flows and lahars. Lava dome growth has occurred in the summit craters and collapses of lava flow fronts have produced pyroclastic flows. The two active summit craters are Kawah Dua (the N crater) and Kawah Utama (the S crater, also referred to as the “Main Crater”). The most recent eruption began in late November 2018 and has more recently consisted of weak thermal activity and gas-and-steam emissions (BGVN 48:01). This report updates activity characterized by lava flows, incandescent avalanches, and ash plumes during January through June 2023 using reports from Pusat Vulkanologi dan Mitigasi Bencana Geologi (PVMBG, also known as CVGHM, or the Center of Volcanology and Geological Hazard Mitigation), MAGMA Indonesia, the Darwin VAAC (Volcano Ash Advisory Center), and satellite data.
Activity during January was relatively low and mainly consisted of white gas-and-steam emissions that rose 25-150 m above Main Crater (S crater) and drifted in different directions. Incandescence was visible from the lava dome in Kawah Dua (the N crater). Weather conditions often prevented clear views of the summit. On 18 January the number of seismic signals that indicated avalanches of material began to increase. In addition, there were a total of 71 earthquakes detected during the month.
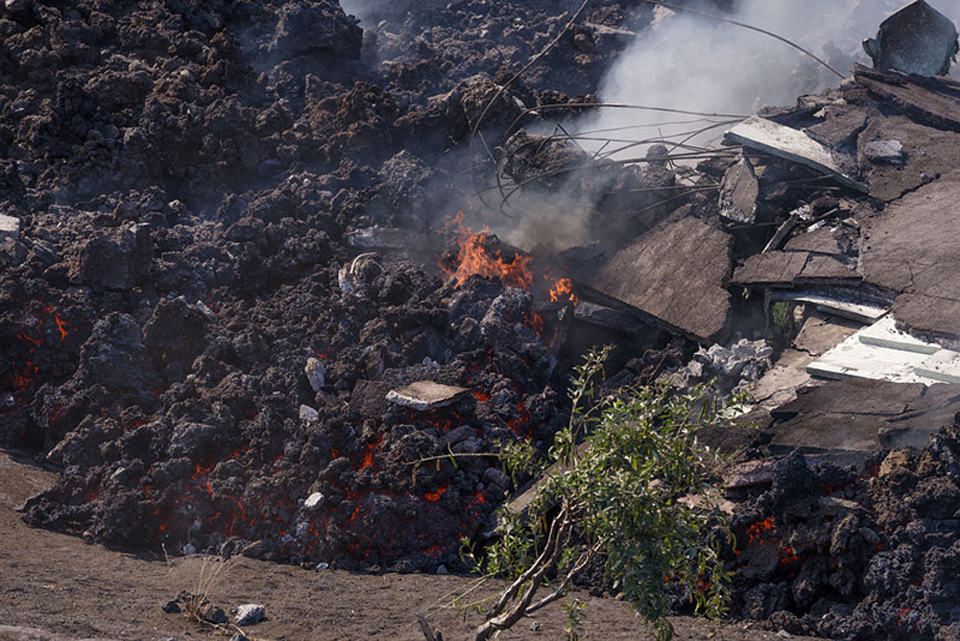
Activity continued to increase during the first week of February. Material from Main Crater traveled as far as 800 m down the Batuawang (S) and Batang (W) drainages and as far as 1 km W down the Beha (W) drainage on 4 February. On 6 February 43 earthquake events were recorded, and on 7 February, 62 events were recorded. White gas-and-steam emissions rose 25-250 m above both summit craters throughout the month. PVMBG reported an eruption began during the evening of 8 February around 1700. Photos showed incandescent material at Main Crater. Incandescent material had also descended the flank in at least two unconfirmed directions as far as 2 km from Main Crater, accompanied by ash plumes (figure 60). As a result, PVMBG increased the Volcano Alert Level (VAL) to 3 (the second highest level on a 1-4 scale).
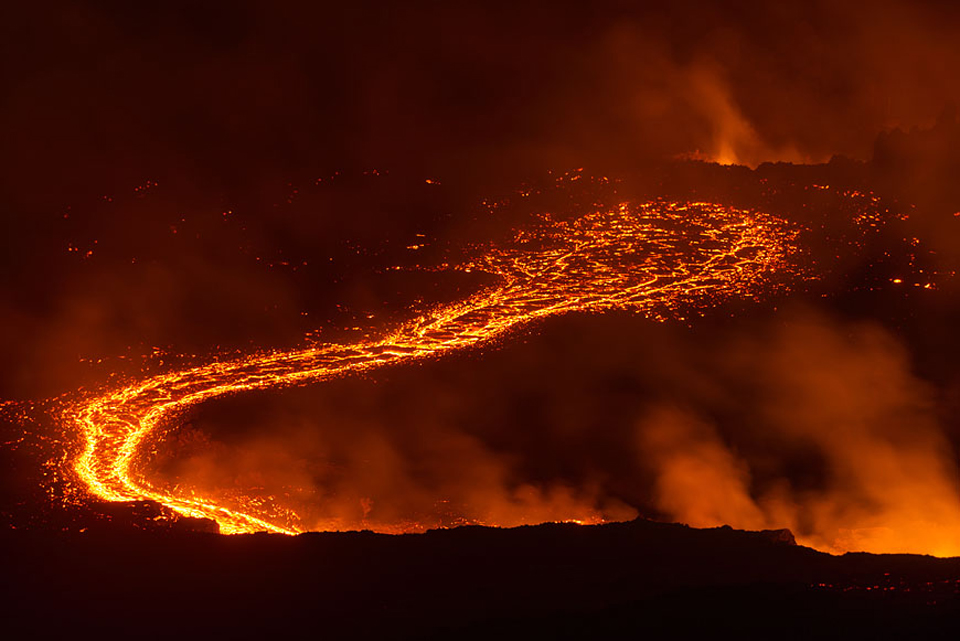
Occasional nighttime webcam images showed three main incandescent lava flows of differing lengths traveling down the S, SW, and W flanks (figure 61). Incandescent rocks were visible on the upper flanks, possibly from ejected or collapsed material from the crater, and incandescence was the most intense at the summit. Based on analyses of satellite imagery and weather models, the Darwin VAAC reported that daily ash plumes during 16-20 February rose to 2.1-3 km altitude and drifted NNE, E, and SE. BNPB reported on 16 February that as many as 77 people were evacuated and relocated to the East Siau Museum. A webcam image taken at 2156 on 17 February possibly showed incandescent material descending the SE flank. Ash plumes rose to 2.1 km altitude and drifted SE during 22-23 February, according to the Darwin VAAC.
Incandescent avalanches of material and summit incandescence at Main Crater continued during March. White gas-and-steam emissions during March generally rose 25-150 m above the summit crater; on 31 March gas-and-steam emissions rose 200-400 m high. An ash plume rose to 2.4 km altitude and drifted S at 1710 on 9 March and a large thermal anomaly was visible in images taken at 0550 and 0930 on 10 March. Incandescent material was visible at the summit and on the flanks based on webcam images taken at 0007 and 2345 on 16 March, at 1828 on 17 March, at 1940 on 18 March, at 2311 on 19 March, and at 2351 on 20 March. Incandescence was most intense on 18 and 20 March and webcam images showed possible Strombolian explosions (figure 62). An ash plume rose to 2.4 km altitude and drifted SW on 18 March, accompanied by a thermal anomaly.
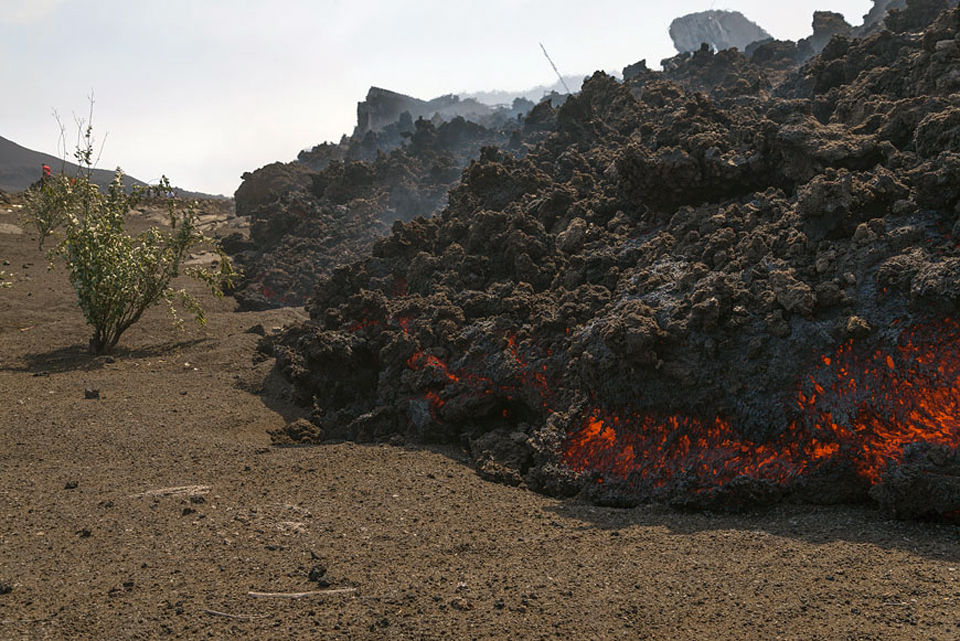
Summit crater incandescence at Main Crater and on the flanks persisted during April. Incandescent material at the S crater and on the flanks was reported at 0016 on 1 April. The lava flows had stopped by 1 April according to PVMBG, although incandescence was still visible up to 10 m high. Seismic signals indicating effusion decreased and by 6 April they were no longer detected. Incandescence was visible from both summit craters. On 26 April the VAL was lowered to 2 (the second lowest level on a 1-4 scale). White gas-and-steam emissions rose 25-200 m above the summit crater.
During May white gas-and-steam emissions generally rose 50-250 m above the summit, though it was often cloudy, which prevented clear views; on 21 May gas-and-steam emissions rose 50-400 m high. Nighttime N summit crater incandescence rose 10-25 m above the lava dome, and less intense incandescence was noted above Main Crater, which reached about 10 m above the dome. Sounds of falling rocks at Main Crater were heard on 15 May and the seismic network recorded 32 rockfall events in the crater on 17 May. Avalanches traveled as far as 1.5 km down the SW and S flanks, accompanied by rumbling sounds on 18 May. Incandescent material descending the flanks was captured in a webcam image at 2025 on 19 May (figure 63) and on 29 May; summit crater incandescence was observed in webcam images at 2332 on 26 May and at 2304 on 29 May. On 19 May the VAL was again raised to 3.
Occasional Main Crater incandescence was reported during June, as well as incandescent material on the flanks. White gas-and-steam emissions rose 10-200 m above the summit crater. Ash plumes rose to 2.1 km altitude and drifted SE and E during 2-4 June, according to the Darwin VAAC. Material on the flanks of Main Crater were observed at 2225 on 7 June, at 2051 on 9 June, at 0007 on 17 June, and at 0440 on 18 June. Webcam images taken on 21, 25, and 27 June showed incandescence at Main Crater and from material on the flanks.
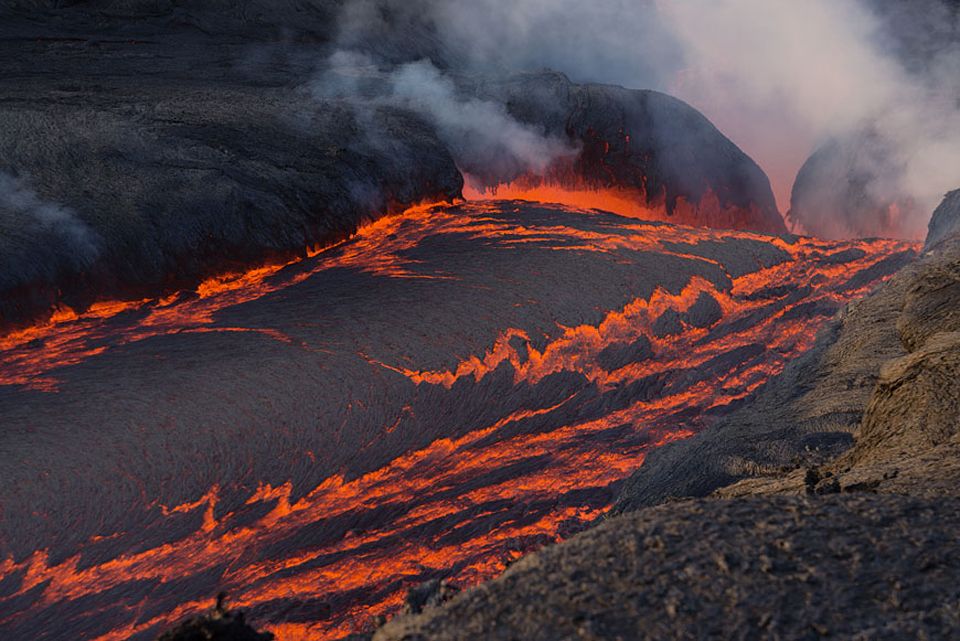
MIROVA (Middle InfraRed Observation of Volcanic Activity) analysis of MODIS satellite data showed strong thermal activity during mid-February through March and mid-May through June, which represented incandescent avalanches and lava flows (figure 64). During April through mid-May the power of the anomalies decreased but frequent anomalies were still detected. Brief gaps in activity occurred during late March through early April and during mid-June. Infrared satellite images showed strong lava flows mainly affecting the SW and S flanks, accompanied by gas-and-steam emissions (figure 65). According to data recorded by the MODVOLC thermal algorithm, there were a total of 79 thermal hotspots detected: 28 during February, 24 during March, one during April, five during May, and 21 during June.
Geologic Background. Karangetang (Api Siau) volcano lies at the northern end of the island of Siau, about 125 km NNE of the NE-most point of Sulawesi. The stratovolcano contains five summit craters along a N-S line. It is one of Indonesia's most active volcanoes, with more than 40 eruptions recorded since 1675 and many additional small eruptions that were not documented (Neumann van Padang, 1951). Twentieth-century eruptions have included frequent explosive activity sometimes accompanied by pyroclastic flows and lahars. Lava dome growth has occurred in the summit craters; collapse of lava flow fronts have produced pyroclastic flows.
Information Contacts: Pusat Vulkanologi dan Mitigasi Bencana Geologi (PVMBG, also known as Indonesian Center for Volcanology and Geological Hazard Mitigation, CVGHM), Jalan Diponegoro 57, Bandung 40122, Indonesia (URL: http://www.vsi.esdm.go.id/); MAGMA Indonesia, Kementerian Energi dan Sumber Daya Mineral (URL: https://magma.esdm.go.id/v1); Badan Nasional Penanggulangan Bencana (BNPB), National Disaster Management Agency, Graha BNPB - Jl. Scout Kav.38, East Jakarta 13120, Indonesia (URL: http://www.bnpb.go.id/); Darwin Volcanic Ash Advisory Centre (VAAC), Bureau of Meteorology, Northern Territory Regional Office, PO Box 40050, Casuarina, NT 0811, Australia (URL: http://www.bom.gov.au/info/vaac/); MIROVA (Middle InfraRed Observation of Volcanic Activity), a collaborative project between the Universities of Turin and Florence (Italy) supported by the Centre for Volcanic Risk of the Italian Civil Protection Department (URL: http://www.mirovaweb.it/); Hawai'i Institute of Geophysics and Planetology (HIGP) - MODVOLC Thermal Alerts System, School of Ocean and Earth Science and Technology (SOEST), Univ. of Hawai'i, 2525 Correa Road, Honolulu, HI 96822, USA (URL: http://modis.higp.hawaii.edu/); Copernicus Browser, Copernicus Data Space Ecosystem, European Space Agency (URL: https://dataspace.copernicus.eu/browser/); IDN Times, Jl. Jend. Gatot Subroto Kav. 27 3rd Floor Kuningan, Jakarta, Indonesia 12950, Status of Karangetang Volcano in Sitaro Islands Increases (URL: https://sulsel.idntimes.com/news/indonesia/savi/status-gunung-api-karangetang-di-kepulauan-sitaro-meningkat?page=all).
Ahyi (United States) — July 2023 Cite this Report
Ahyi
United States
20.42°N, 145.03°E; summit elev. -75 m
All times are local (unless otherwise noted)
Intermittent hydroacoustic signals and discolored plumes during November 2022-June 2023
Ahyi seamount is a large, conical submarine volcano that rises to within 75 m of the ocean surface about 18 km SE of the island of Farallon de Pajaros in the Northern Marianas. The remote location of the seamount has made eruptions difficult to document, but seismic stations installed in the region confirmed an eruption in the vicinity in 2001. No new activity was detected until April-May 2014 when an eruption was detected by NOAA (National Oceanic and Atmospheric Administration) divers, hydroacoustic sensors, and seismic stations (BGVN 42:04). New activity was first detected on 15 November by hydroacoustic sensors that were consistent with submarine volcanic activity. This report covers activity during November 2022 through June 2023 based on daily and weekly reports from the US Geological Survey.
Starting in mid-October, hydroacoustic sensors at Wake Island (2.2 km E) recorded signals consistent with submarine volcanic activity, according to a report from the USGS issued on 15 November 2022. A combined analysis of the hydroacoustic signals and seismic stations located at Guam and Chichijima Island, Japan, suggested that the source of this activity was at or near the Ahyi seamount. After a re-analysis of a satellite image of the area that was captured on 6 November, USGS confirmed that there was no evidence of discoloration at the ocean surface. Few hydroacoustic and seismic signals continued through November, including on 18 November, which USGS suggested signified a decline or pause in unrest. A VONA (Volcano Observatory Notice for Aviation) reported that a discolored water plume was persistently visible in satellite data starting on 18 November (figure 6). Though clouds often obscured clear views of the volcano, another discolored water plume was captured in a satellite image on 26 November. The Aviation Color Code (ACC) was raised to Yellow (the second lowest level on a four-color scale) and the Volcano Alert Level (VAL) was raised to Advisory (the second lowest level on a four-level scale) on 29 November.
During December, occasional detections were recorded on the Wake Island hydrophone sensors and discolored water over the seamount remained visible. During 2-7, 10-12, and 16-31 December possible explosion signals were detected. A small area of discolored water was observed in high-resolution Sentinel-2 satellite images during 1-6 December (figure 7). High-resolution satellite images recorded discolored water plumes on 13 December that originated from the summit region; no observations indicated that activity breached the ocean surface. A possible underwater plume was visible in satellite images on 18 December, and during 19-20 December a definite but diffuse underwater plume located SSE from the main vent was reported. An underwater plume was visible in a satellite image taken on 26 December (figure 7).
Hydrophone sensors continued to detect signals consistent with possible explosions during 1-8 January 2023. USGS reported that the number of detections decreased during 4-5 January. The hydrophone sensors experienced a data outage that started at 0118 on 8 January and continued through 10 January, though according to USGS, possible explosions were recorded prior to the data outage and likely continued during the outage. A discolored water plume originating from the summit region was detected in a partly cloudy satellite image on 8 January. On 11-12 and 15-17 January possible explosion signals were recorded again. One small signal was detected during 22-23 January and several signals were recorded on 25 and 31 January. During 27-31 January a plume of discolored water was observed above the seamount in satellite imagery (figure 8).
Low levels of activity continued during February and March, based on data from pressure sensors on Wake Island. During 1 and 4-6 February activity was reported, and a submarine plume was observed on 4 February (figure 8). Possible explosion signals were detected during 7-8, 10, 13-14, and 24 February. During 1-2 and 3-5 March a plume of discolored water was observed in satellite imagery (figure 8). Almost continuous hydroacoustic signals were detected in remote pressure sensor data on Wake Island 2,270 km E from the volcano during 7-13 March. During 12-13 March water discoloration around the seamount was observed in satellite imagery, despite cloudy weather. By 14 March discolored water extended about 35 km, but no direction was noted. USGS reported that the continuous hydroacoustic signals detected during 13-14 March stopped abruptly on 14 March and no new detections were observed. Three 30 second hydroacoustic detections were reported during 17-19 March, but no activity was visible due to cloudy weather. A data outage was reported during 21-22 March, making pressure sensor data unavailable; a discolored water plume was, however, visible in satellite data. A possible underwater explosion signal was detected by pressure sensors at Wake Island on 26, 29, and 31 March, though the cause and origin of these events were unclear.
Similar low activity continued during April, May, and June. Several signals were detected during 1-3 April in pressure sensors at Wake Island. USGS suggested that these may be related to underwater explosions or earthquakes at the volcano, but no underwater plumes were visible in clear satellite images. The pressure sensors had data outages during 12-13 April and no data were recorded; no underwater plumes were visible in satellite images, although cloudy weather obscured most clear views. Eruptive activity was reported starting at 2210 on 21 May. On 22 May a discolored water plume that extended 4 km was visible in satellite images, though no direction was recorded. During 23-24 May some signals were detected by the underwater pressure sensors. Possible hydroacoustic signals were detected during 2-3 and 6-8 June. Multiple hydroacoustic signals were detected during 9-11 and 16-17 June, although no activity was visible in satellite images. One hydroacoustic signal was detected during 23-24 June, but there was some uncertainty about its association with volcanic activity. A single possible hydroacoustic signal was detected during 30 June to 1 July.
Geologic Background. Ahyi seamount is a large conical submarine volcano that rises to within 75 m of the ocean surface ~18 km SE of the island of Farallon de Pajaros in the northern Marianas. Water discoloration has been observed there, and in 1979 the crew of a fishing boat felt shocks over the summit area, followed by upwelling of sulfur-bearing water. On 24-25 April 2001 an explosive eruption was detected seismically by a station on Rangiroa Atoll, Tuamotu Archipelago. The event was well constrained (+/- 15 km) at a location near the southern base of Ahyi. An eruption in April-May 2014 was detected by NOAA divers, hydroacoustic sensors, and seismic stations.
Information Contacts: US Geological Survey, Volcano Hazards Program (USGS-VHP), 12201 Sunrise Valley Drive, Reston, VA, USA, https://volcanoes.usgs.gov/index.html; Copernicus Browser, Copernicus Data Space Ecosystem, European Space Agency (URL: https://dataspace.copernicus.eu/browser/).
Kadovar (Papua New Guinea) — June 2023 Cite this Report
Kadovar
Papua New Guinea
3.608°S, 144.588°E; summit elev. 365 m
All times are local (unless otherwise noted)
An ash plume and weak thermal anomaly during May 2023
Kadovar is a 2-km-wide island that is the emergent summit of a Bismarck Sea stratovolcano. It lies off the coast of New Guinea, about 25 km N of the mouth of the Sepik River. Prior to an eruption that began in 2018, a lava dome formed the high point of the volcano, filling an arcuate landslide scarp open to the S. Submarine debris-avalanche deposits occur to the S of the island. The current eruption began in January 2018 and has comprised lava effusion from vents at the summit and at the E coast; more recent activity has consisted of ash plumes, weak thermal activity, and gas-and-steam plumes (BGVN 48:02). This report covers activity during February through May 2023 using information from the Darwin Volcanic Ash Advisory Center (VAAC) and satellite data.
Activity during the reporting period was relatively low and mainly consisted of white gas-and-steam plumes that were visible in natural color satellite images on clear weather days (figure 67). According to a Darwin VAAC report, at 2040 on 6 May an ash plume rose to 4.6 km altitude and drifted W; by 2300 the plume had dissipated. MODIS satellite instruments using the MODVOLC thermal algorithm detected a single thermal hotspot on the SE side of the island on 7 May. Weak thermal activity was also detected in a satellite image on the E side of the island on 14 May, accompanied by a white gas-and-steam plume that drifted SE (figure 68).
Geologic Background. The 2-km-wide island of Kadovar is the emergent summit of a Bismarck Sea stratovolcano of Holocene age. It is part of the Schouten Islands, and lies off the coast of New Guinea, about 25 km N of the mouth of the Sepik River. Prior to an eruption that began in 2018, a lava dome formed the high point of the andesitic volcano, filling an arcuate landslide scarp open to the south; submarine debris-avalanche deposits occur in that direction. Thick lava flows with columnar jointing forms low cliffs along the coast. The youthful island lacks fringing or offshore reefs. A period of heightened thermal phenomena took place in 1976. An eruption began in January 2018 that included lava effusion from vents at the summit and at the E coast.
Information Contacts: Darwin Volcanic Ash Advisory Centre (VAAC), Bureau of Meteorology, Northern Territory Regional Office, PO Box 40050, Casuarina, NT 0811, Australia (URL: http://www.bom.gov.au/info/vaac/); Hawai'i Institute of Geophysics and Planetology (HIGP) - MODVOLC Thermal Alerts System, School of Ocean and Earth Science and Technology (SOEST), Univ. of Hawai'i, 2525 Correa Road, Honolulu, HI 96822, USA (URL: http://modis.higp.hawaii.edu/); Copernicus Browser, Copernicus Data Space Ecosystem, European Space Agency (URL: https://dataspace.copernicus.eu/browser/).
San Miguel (El Salvador) — June 2023 Cite this Report
San Miguel
El Salvador
13.434°N, 88.269°W; summit elev. 2130 m
All times are local (unless otherwise noted)
Small gas-and-ash explosions during March and May 2023
San Miguel in El Salvador is a broad, deep crater complex that has been frequently modified by eruptions recorded since the early 16th century and consists of the summit known locally as Chaparrastique. Flank eruptions have produced lava flows that extended to the N, NE, and SE during the 17-19th centuries. The most recent activity has consisted of minor ash eruptions from the summit crater. The current eruption period began in November 2022 and has been characterized by frequent phreatic explosions, gas-and-ash emissions, and sulfur dioxide plumes (BGVN 47:12). This report describes small gas-and-ash explosions during December 2022 through May 2023 based on special reports from the Ministero de Medio Ambiente y Recursos Naturales (MARN).
Activity has been relatively low since the last recorded explosions on 29 November 2022. Seismicity recorded by the San Miguel Volcano Station (VSM) located on the N flank at 1.7 km elevation had decreased by 7 December. Sulfur dioxide gas measurements taken with DOAS (Differential Optical Absorption Spectroscopy) mobile equipment were below typical previously recorded values: 300 tons per day (t/d). During December, small explosions were recorded by the seismic network and manifested as gas-and-steam emissions.
Gas-and-ash explosions in the crater occurred during January 2023, which were recorded by the seismic network. Sulfur dioxide values remained low, between 300-400 t/d through 10 March. At 0817 on 14 January a gas-and-ash emission was visible in webcam images, rising just above the crater rim. Some mornings during February, small gas-and-steam plumes were visible in the crater. On 7 March at 2252 MARN noted an increase in degassing from the central crater; gas emissions were constantly observed through the early morning hours on 8 March. During the early morning of 8 March through the afternoon on 9 March, 12 emissions were registered, some accompanied by ash. The last gas-and-ash emission was recorded at 1210 on 9 March; very fine ashfall was reported in El Tránsito (10 km S), La Morita (6 km W), and La Piedrita (3 km W). The smell of sulfur was reported in Piedra Azul (5 km SW). On 16 March MARN reported that gas-and-steam emissions decreased.
Low degassing and very low seismicity were reported during April; no explosions have been detected between 9 March and 27 May. The sulfur dioxide emissions remained between 350-400 t/d; during 13-20 April sulfur dioxide values fluctuated between 30-300 t/d. Activity remained low through most of May; on 23 May seismicity increased. An explosion was detected at 1647 on 27 May generated a gas-and-ash plume that rose 700 m high (figure 32); a decrease in seismicity and gas emissions followed. The DOAS station installed on the W flank recorded sulfur dioxide values that reached 400 t/d on 27 May; subsequent measurements showed a decrease to 268 t/d on 28 May and 100 t/d on 29 May.
Geologic Background. The symmetrical cone of San Miguel, one of the most active volcanoes in El Salvador, rises from near sea level to form one of the country's most prominent landmarks. A broad, deep, crater complex that has been frequently modified by eruptions recorded since the early 16th century caps the truncated unvegetated summit, also known locally as Chaparrastique. Flanks eruptions of the basaltic-andesitic volcano have produced many lava flows, including several during the 17th-19th centuries that extended to the N, NE, and SE. The SE-flank flows are the largest and form broad, sparsely vegetated lava fields crossed by highways and a railroad skirting the base of the volcano. Flank vent locations have migrated higher on the edifice during historical time, and the most recent activity has consisted of minor ash eruptions from the summit crater.
Information Contacts: Ministero de Medio Ambiente y Recursos Naturales (MARN), Km. 5½ Carretera a Nueva San Salvador, Avenida las Mercedes, San Salvador, El Salvador (URL: http://www.snet.gob.sv/ver/vulcanologia).
Semisopochnoi (United States) — June 2023 Cite this Report
Semisopochnoi
United States
51.93°N, 179.58°E; summit elev. 1221 m
All times are local (unless otherwise noted)
Occasional explosions, ash deposits, and gas-and-steam plumes during December 2022-May 2023
Semisopochnoi is located in the western Aleutians, is 20-km-wide at sea level, and contains an 8-km-wide caldera. The three-peaked Mount Young (formerly Cerberus) was constructed within the caldera during the Holocene. Each of these peaks contains a summit crater; the lava flows on the N flank appear younger than those on the S side. The current eruption period began in early February 2021 and has more recently consisted of intermittent explosions and ash emissions (BGVN 47:12). This report updates activity during December 2022 through May 2023 using daily, weekly, and special reports from the Alaska Volcano Observatory (AVO). AVO monitors the volcano using local seismic and infrasound sensors, satellite data, web cameras, and remote infrasound and lightning networks.
Activity during most of December 2022 was relatively quiet; according to AVO no eruptive or explosive activity was observed since 7 November 2022. Intermittent tremor and occasional small earthquakes were observed in geophysical data. Continuous gas-and-steam emissions were observed from the N crater of Mount Young in webcam images on clear weather days (figure 25). On 24 December, there was a slight increase in earthquake activity and several small possible explosion signals were detected in infrasound data. Eruptive activity resumed on 27 December at the N crater of Mount Young; AVO issued a Volcano Activity Notice (VAN) that reported minor ash deposits on the flanks of Mount Young that extended as far as 1 km from the vent, according to webcam images taken during 27-28 December (figure 26). No ash plumes were observed in webcam or satellite imagery, but a persistent gas-and-steam plume that might have contained some ash rose to 1.5 km altitude. As a result, AVO raised the Aviation Color Code (ACC) to Orange (the second highest level on a four-color scale) and the Volcano Alert Level (VAL) to Watch (the second highest level on a four-level scale). Possible explosions were detected during 21 December 2022 through 1 January 2023 and seismic tremor was recorded during 30-31 December.
During January 2023 eruptive activity continued at the active N crater of Mount Young. Minor ash deposits were observed on the flanks, extending about 2 km SSW, based on webcam images from 1 and 3 January. A possible explosion occurred during 1-2 January based on elevated seismicity recorded on local seismometers and an infrasound signal recorded minutes later by an array at Adak. Though no ash plumes were observed in webcam or satellite imagery, a persistent gas-and-steam plume rose to 1.5 km altitude that might have carried minor traces of ash. Ash deposits were accompanied by periods of elevated seismicity and infrasound signals from the local geophysical network, which AVO reported were likely due to weak explosive activity. Low-level explosive activity was also detected during 2-3 January, with minor gas-and-steam emissions and a new ash deposit that was visible in webcam images. Low-level explosive activity was detected in geophysical data during 4-5 January, with elevated seismicity and infrasound signals observed on local stations. Volcanic tremor was detected during 7-9 January and very weak explosive activity was detected in seismic and infrasound data on 9 January. Weak seismic and infrasound signals were recorded on 17 January, which indicated minor explosive activity, but no ash emissions were observed in clear webcam images; a gas-and-steam plume continued to rise to 1.5 km altitude. During 29-30 January, ash deposits near the summit were observed on fresh snow, according to webcam images.
The active N cone at Mount Young continued to produce a gas-and-steam plume during February, but no ash emissions or explosive events were detected. Seismicity remained elevated with faint tremor during early February. Gas-and-steam emissions from the N crater were observed in clear webcam images on 11-13 and 16 February; no explosive activity was detected in seismic, infrasound, or satellite data. Seismicity has also decreased, with no significant seismic tremor observed since 25 January. Therefore, the ACC was lowered to Yellow (the second lowest level on a four-color scale) and the VAL was lowered to Advisory (the second lowest level on a four-color scale) on 22 February.
Gas-and-steam emissions persisted during March from the N cone of Mount Young, based on clear webcam images. A few brief episodes of weak tremor were detected in seismic data, although seismicity decreased over the month. A gas-and-steam plume detected in satellite data extended 150 km on 18 March. Low-level ash emissions from the N cone at Mount Young were observed in several webcam images during 18-19 March, in addition to small explosions and volcanic tremor. The ACC was raised to Orange and the VAL increased to Watch on 19 March. A small explosion was detected in seismic and infrasound data on 21 March.
Low-level unrest continued during April, although cloudy weather often obscured views of the summit; periods of seismic tremor and local earthquakes were recorded. During 3-4 April a gas-and-steam plume was visible traveling more than 200 km overnight; no ash was evident in the plume, according to AVO. A gas-and-steam plume was observed during 4-6 April that extended 400 km but did not seem to contain ash. Small explosions were detected in seismic and infrasound data on 5 April. Occasional clear webcam images showed continuing gas-and-steam emissions rose from Mount Young, but no ash deposits were observed on the snow. On 19 April small explosions and tremor were detected in seismic and infrasound data. A period of seismic tremor was detected during 22-25 April, with possible weak explosions on 25 April. Ash deposits were visible near the crater rim, but it was unclear if these deposits were recent or due to older deposits.
Occasional small earthquakes were recorded during May, but there were no signs of explosive activity seen in geophysical data. Gas-and-steam emissions continued from the N crater of Mount Young, based on webcam images, and seismicity remained slightly elevated. A new, light ash deposit was visible during the morning of 5 May on fresh snow on the NW flank of Mount Young. During 10 May periods of volcanic tremor were observed. The ACC was lowered to Yellow and the VAL to Advisory on 17 May due to no additional evidence of activity.
Geologic Background. Semisopochnoi, the largest subaerial volcano of the western Aleutians, is 20 km wide at sea level and contains an 8-km-wide caldera. It formed as a result of collapse of a low-angle, dominantly basaltic volcano following the eruption of a large volume of dacitic pumice. The high point of the island is Anvil Peak, a double-peaked late-Pleistocene cone that forms much of the island's northern part. The three-peaked Mount Cerberus (renamed Mount Young in 2023) was constructed within the caldera during the Holocene. Each of the peaks contains a summit crater; lava flows on the N flank appear younger than those on the south side. Other post-caldera volcanoes include the symmetrical Sugarloaf Peak SSE of the caldera and Lakeshore Cone, a small cinder cone at the edge of Fenner Lake in the NE part of the caldera. Most documented eruptions have originated from Young, although Coats (1950) considered that both Sugarloaf and Lakeshore Cone could have been recently active.
Information Contacts: Alaska Volcano Observatory (AVO), a cooperative program of a) U.S. Geological Survey, 4200 University Drive, Anchorage, AK 99508-4667 USA (URL: https://avo.alaska.edu/), b) Geophysical Institute, University of Alaska, PO Box 757320, Fairbanks, AK 99775-7320, USA, and c) Alaska Division of Geological & Geophysical Surveys, 794 University Ave., Suite 200, Fairbanks, AK 99709, USA (URL: http://dggs.alaska.gov/).
Ebeko
Russia
50.686°N, 156.014°E; summit elev. 1103 m
All times are local (unless otherwise noted)
Continued explosions, ash plumes, and ashfall during October 2022-May 2023
Ebeko, located on the N end of Paramushir Island in the Kuril Islands, consists of three summit craters along a SSW-NNE line at the northern end of a complex of five volcanic cones. Eruptions date back to the late 18th century and have been characterized as small-to-moderate explosions from the summit crater, accompanied by intense fumarolic activity. The current eruption period began in June 2022 and has recently consisted of frequent explosions, ash plumes, and thermal activity (BGVN 47:10). This report covers similar activity during October 2022 through May 2023, based on information from the Kamchatka Volcanic Eruptions Response Team (KVERT) and satellite data.
Activity during October consisted of explosive activity, ash plumes, and occasional thermal anomalies. Visual data by volcanologists from Severo-Kurilsk showed explosions producing ash clouds up to 2.1-3 km altitude which drifted E, N, NE, and SE during 1-8, 10, 16, and 18 October. KVERT issued several Volcano Observatory Notices for Aviation (VONA) on 7, 13-15, and 27 October 2022, stating that explosions generated ash plumes that rose to 2.3-4 km altitude and drifted 5 km E, NE, and SE. Ashfall was reported in Severo-Kurilsk (Paramushir Island, about 7 km E) on 7 and 13 October. Satellite data showed a thermal anomaly over the volcano on 15-16 October. Visual data showed ash plumes rising to 2.5-3.6 km altitude on 22, 25-29, and 31 October and moving NE due to constant explosions.
Similar activity continued during November, with explosions, ash plumes, and ashfall occurring. KVERT issued VONAs on 1-2, 4, 6-7, 9, 13, and 16 November that reported explosions and resulting ash plumes that rose to 1.7-3.6 km altitude and drifted 3-5 km SE, ESE, E, and NE. On 1 November ash plumes extended as far as 110 km SE. On 5, 8, 12, and 24-25 November explosions and ash plumes rose to 2-3.1 km altitude and drifted N and E. Ashfall was observed in Severo-Kurilsk on 7 and 16 November. A thermal anomaly was visible during 1-4, 16, and 20 November. Explosions during 26 November rose as high as 2.7 km altitude and drifted NE (figure 45).
Explosions and ash plumes continued to occur in December. During 1-2 and 4 December volcanologists from Severo-Kurilsk observed explosions that sent ash to 1.9-2.5 km altitude and drifted NE and SE (figure 46). VONAs were issued on 5, 9, and 16 December reporting that explosions generated ash plumes rising to 1.9 km, 2.6 km, and 2.4 km altitude and drifted 5 km SE, E, and NE, respectively. A thermal anomaly was visible in satellite imagery on 16 December. On 18 and 27-28 December explosions produced ash plumes that rose to 2.5 km altitude and drifted NE and SE. On 31 December an ash plume rose to 2 km altitude and drifted NE.
Explosions continued during January 2023, based on visual observations by volcanologists from Severo-Kurilsk. During 1-7 January explosions generated ash plumes that rose to 4 km altitude and drifted NE, E, W, and SE. According to VONAs issued by KVERT on 2, 4, 10, and 23 January, explosions produced ash plumes that rose to 2-4 km altitude and drifted 5 km N, NE, E, and ENE; the ash plume that rose to 4 km altitude occurred on 10 January (figure 47). Satellite data showed a thermal anomaly during 3-4, 10, 13, 16, 21, 22, and 31 January. KVERT reported that an ash cloud on 4 January moved 12 km NE. On 6 and 9-11 January explosions sent ash plumes to 4.5 km altitude and drifted W and ESE. On 13 January an ash plume rose to 3 km altitude and drifted SE. During 20-24 January ash plumes from explosions rose to 3.7 km altitude and drifted SE, N, and NE. On 21 January the ash plume drifted as far as 40 km NE. During 28-29 and 31 January and 1 February ash plumes rose to 4 km altitude and drifted NE.
During February, explosions, ash plumes, and ashfall were reported. During 1, 4-5 and 7-8 February explosions generated ash plumes that rose to 4.5 km altitude and drifted E and NE; ashfall was observed on 5 and 8 February. On 6 February an explosion produced an ash plume that rose to 3 km altitude and drifted 7 km E, causing ashfall in Severo-Kurilsk. A thermal anomaly was visible in satellite data on 8, 9, 13, and 21 February. Explosions on 9 and 12-13 February produced ash plumes that rose to 4 km altitude and drifted E and NE; the ash cloud on 12 February extended as far as 45 km E. On 22 February explosions sent ash to 3 km altitude that drifted E. During 24 and 26-27 February ash plumes rose to 4 km altitude and drifted E. On 28 February an explosion sent ash to 2.5-3 km altitude and drifted 5 km E; ashfall was observed in Severo-Kurilsk.
Activity continued during March; visual observations showed that explosions generated ash plumes that rose to 3.6 km altitude on 3, 5-7, and 9-12 March and drifted E, NE, and NW. Thermal anomalies were visible on 10, 13, and 29-30 March in satellite imagery. On 18, 21-23, 26, and 29-30 March explosions produced ash plumes that rose to 2.8 km altitude and drifted NE and E; the ash plumes during 22-23 March extended up to 76 km E. A VONA issued on 21 March reported an explosion that produced an ash plume that rose to 2.8 km altitude and drifted 5 km E. Another VONA issued on 23 March reported that satellite data showed an ash plume rising to 3 km altitude and drifted 14 km E.
Explosions during April continued to generate ash plumes. On 1 and 4 April an ash plume rose to 2.8-3.5 km altitude and drifted SE and NE. A thermal anomaly was visible in satellite imagery during 1-6 April. Satellite data showed ash plumes and clouds rising to 2-3 km altitude and drifting up to 12 km SW and E on 3 and 6 April (figure 48). KVERT issued VONAs on 3, 5, 14, 16 April describing explosions that produced ash plumes rising to 3 km, 3.5 km, 3.5 km, and 3 km altitude and drifting 5 km S, 5 km NE and SE, 72 km NNE, and 5 km NE, respectively. According to satellite data, the resulting ash cloud from the explosion on 14 April was 25 x 7 km in size and drifted 72-104 km NNE during 14-15 April. According to visual data by volcanologists from Severo-Kurilsk explosions sent ash up to 3.5 km altitude that drifted NE and E during 15-16, 22, 25-26, and 29 April.
The explosive eruption continued during May. Explosions during 3-4, 6-7, and 9-10 May generated ash plumes that rose to 4 km altitude and drifted SW and E. Satellite data showed a thermal anomaly on 3, 9, 13-14, and 24 May. During 12-16, 23-25, and 27-28 May ash plumes rose to 3.5 km altitude and drifted in different directions due to explosions. Two VONA notices were issued on 16 and 25 May, describing explosions that generated ash plumes rising to 3 km and 3.5 km altitude, respectively and extending 5 km E. The ash cloud on 25 May drifted 75 km SE.
Thermal activity in the summit crater, occasionally accompanied by ash plumes and ash deposits on the SE and E flanks due to frequent explosions, were visible in infrared and true color satellite images (figure 49).
Geologic Background. The flat-topped summit of the central cone of Ebeko volcano, one of the most active in the Kuril Islands, occupies the northern end of Paramushir Island. Three summit craters located along a SSW-NNE line form Ebeko volcano proper, at the northern end of a complex of five volcanic cones. Blocky lava flows extend west from Ebeko and SE from the neighboring Nezametnyi cone. The eastern part of the southern crater contains strong solfataras and a large boiling spring. The central crater is filled by a lake about 20 m deep whose shores are lined with steaming solfataras; the northern crater lies across a narrow, low barrier from the central crater and contains a small, cold crescentic lake. Historical activity, recorded since the late-18th century, has been restricted to small-to-moderate explosive eruptions from the summit craters. Intense fumarolic activity occurs in the summit craters, on the outer flanks of the cone, and in lateral explosion craters.
Information Contacts: Kamchatka Volcanic Eruptions Response Team (KVERT), Far Eastern Branch, Russian Academy of Sciences, 9 Piip Blvd., Petropavlovsk-Kamchatsky, 683006, Russia (URL: http://www.kscnet.ru/ivs/kvert/); MIROVA (Middle InfraRed Observation of Volcanic Activity), a collaborative project between the Universities of Turin and Florence (Italy) supported by the Centre for Volcanic Risk of the Italian Civil Protection Department (URL: http://www.mirovaweb.it/); Copernicus Browser, Copernicus Data Space Ecosystem, European Space Agency (URL: https://dataspace.copernicus.eu/browser/).
Home Reef
Tonga
18.992°S, 174.775°W; summit elev. -10 m
All times are local (unless otherwise noted)
Discolored plumes continued during November 2022-April 2023
Home Reef is a submarine volcano located in the central Tonga islands between Lateiki (Metis Shoal) and Late Island. The first recorded eruption occurred in the mid-19th century, when an ephemeral island formed. An eruption in 1984 produced a 12-km-high eruption plume, a large volume of floating pumice, and an ephemeral island 500 x 1,500 m wide, with cliffs 30-50 m high that enclosed a water-filled crater. Another island-forming eruption in 2006 produced widespread pumice rafts that drifted as far as Australia; by 2008 the island had eroded below sea level. The previous eruption occurred during October 2022 and was characterized by a new island-forming eruption, lava effusion, ash plumes, discolored water, and gas-and-steam plumes (BGVN 47:11). This report covers discolored water plumes during November 2022 through April 2023 using satellite data.
Discolored plumes continued during the reporting period and were observed in true color satellite images on clear weather days. Satellite images show light green-yellow discolored water extending W on 8 and 28 November 2022 (figure 31), and SW on 18 November. Light green-yellow plumes extended W on 3 December, S on 13 December, SW on 18 December, and W and S on 23 December (figure 31). On 12 January 2023 discolored green-yellow plumes extended to the NE, E, SE, and N. The plume moved SE on 17 January and NW on 22 January. Faint discolored water in February was visible moving NE on 1 February. A discolored plume extended NW on 8 and 28 March and NW on 13 March (figure 31). During April, clear weather showed green-blue discolored plumes moving S on 2 April, W on 7 April, and NE and S on 12 April. A strong green-yellow discolored plume extended E and NE on 22 April for several kilometers (figure 31).
Geologic Background. Home Reef, a submarine volcano midway between Metis Shoal and Late Island in the central Tonga islands, was first reported active in the mid-19th century, when an ephemeral island formed. An eruption in 1984 produced a 12-km-high eruption plume, large amounts of floating pumice, and an ephemeral 500 x 1,500 m island, with cliffs 30-50 m high that enclosed a water-filled crater. In 2006 an island-forming eruption produced widespread dacitic pumice rafts that drifted as far as Australia. Another island was built during a September-October 2022 eruption.
Information Contacts: Copernicus Browser, Copernicus Data Space Ecosystem, European Space Agency (URL: https://dataspace.copernicus.eu/browser/).
Ambae
Vanuatu
15.389°S, 167.835°E; summit elev. 1496 m
All times are local (unless otherwise noted)
New lava flow, ash plumes, and sulfur dioxide plumes during February-May 2023
Ambae, also known as Aoba, is a large basaltic shield volcano in Vanuatu. A broad pyroclastic cone containing three crater lakes (Manaro Ngoru, Voui, and Manaro Lakua) is located at the summit within the youngest of at least two nested calderas. Periodic phreatic and pyroclastic explosions have been reported since the 16th century. A large eruption more than 400 years ago resulted in a volcanic cone within the summit crater that is now filled by Lake Voui; the similarly sized Lake Manaro fills the western third of the caldera. The previous eruption ended in August 2022 that was characterized by gas-and-steam and ash emissions and explosions of wet tephra (BGVN 47:10). This report covers a new eruption during February through May 2023 that consisted of a new lava flow, ash plumes, and sulfur dioxide emissions, using information from the Vanuatu Meteorology and Geo-Hazards Department (VMGD) and satellite data.
During the reporting period, the Alert Level remained at a 2 (on a scale of 0-5), which has been in place since December 2021. Activity during October 2022 through March 2023 remained relatively low and mostly consisted of gas-and-steam emissions in Lake Voui. VMGD reported that at 1300 on 15 November a satellite image captured a strong amount of sulfur dioxide rising above the volcano (figure 99), and that seismicity slightly increased. The southern and northern part of the island reported a strong sulfur dioxide smell and heard explosions. On 20 February 2023 a gas-and-ash plume rose 1.3 km above the summit and drifted SSW, according to a webcam image (figure 100). Gas-and-steam and possibly ash emissions continued on 23 February and volcanic earthquakes were recorded by the seismic network.
During April, volcanic earthquakes and gas-and-steam and ash emissions were reported from the cone in Lake Voui. VMGD reported that activity increased during 5-7 April; high gas-and-steam and ash plumes were visible, accompanied by nighttime incandescence. According to a Wellington VAAC report, a low-level ash plume rose as high as 2.5 km above the summit and drifted W and SW on 5 April, based on satellite imagery. Reports in Saratamata stated that a dark ash plume drifted to the WSW, but no loud explosion was heard. Webcam images from 2100 showed incandescence above the crater and reflected in the clouds. According to an aerial survey, field observations, and satellite data, water was no longer present in the lake. A lava flow was reported effusing from the vent and traveling N into the dry Lake Voui, which lasted three days. The next morning at 0745 on 6 April a gas-and-steam and ash plume rose 5.4 km above the summit and drifted ESE, based on information from VMGD (figure 101). The Wellington VAAC also reported that light ashfall was observed on the island. Intermittent gas-and-steam and ash emissions were visible on 7 April, some of which rose to an estimated 3 km above the summit and drifted E. Webcam images during 0107-0730 on 7 April showed continuing ash emissions. A gas-and-steam and ash plume rose 695 m above the summit crater at 0730 on 19 April and drifted ESE, based on a webcam image (figure 102).
According to visual and infrared satellite data, water was visible in Lake Voui as late as 24 March 2023 (figure 103). The vent in the caldera showed a gas-and-steam plume drifted SE. On 3 April thermal activity was first detected, accompanied by a gas-and-ash plume that drifted W (figure 103). The lava flow moved N within the dry lake and was shown cooling by 8 April. By 23 April much of the water in the lake had returned. Occasional sulfur dioxide plumes were detected by the TROPOMI instrument on the Sentinel-5P satellite that exceeded 2 Dobson Units (DU) and drifted in different directions (figure 104).
Geologic Background. The island of Ambae, also known as Aoba, is a massive 2,500 km3 basaltic shield that is the most voluminous volcano of the New Hebrides archipelago. A pronounced NE-SW-trending rift zone with numerous scoria cones gives the 16 x 38 km island an elongated form. A broad pyroclastic cone containing three crater lakes (Manaro Ngoru, Voui, and Manaro Lakua) is located at the summit within the youngest of at least two nested calderas, the largest of which is 6 km in diameter. That large central edifice is also called Manaro Voui or Lombenben volcano. Post-caldera explosive eruptions formed the summit craters about 360 years ago. A tuff cone was constructed within Lake Voui (or Vui) about 60 years later. The latest known flank eruption, about 300 years ago, destroyed the population of the Nduindui area near the western coast.
Information Contacts: Geo-Hazards Division, Vanuatu Meteorology and Geo-Hazards Department (VMGD), Ministry of Climate Change Adaptation, Meteorology, Geo-Hazards, Energy, Environment and Disaster Management, Private Mail Bag 9054, Lini Highway, Port Vila, Vanuatu (URL: http://www.vmgd.gov.vu/, https://www.facebook.com/VanuatuGeohazardsObservatory/); Wellington Volcanic Ash Advisory Centre (VAAC), Meteorological Service of New Zealand Ltd (MetService), PO Box 722, Wellington, New Zealand (URL: http://www.metservice.com/vaac/, http://www.ssd.noaa.gov/VAAC/OTH/NZ/messages.html); MIROVA (Middle InfraRed Observation of Volcanic Activity), a collaborative project between the Universities of Turin and Florence (Italy) supported by the Centre for Volcanic Risk of the Italian Civil Protection Department (URL: http://www.mirovaweb.it/); Global Sulfur Dioxide Monitoring Page, Atmospheric Chemistry and Dynamics Laboratory, NASA Goddard Space Flight Center (NASA/GSFC), 8800 Greenbelt Road, Goddard, Maryland, USA (URL: https://so2.gsfc.nasa.gov/); Copernicus Browser, Copernicus Data Space Ecosystem, European Space Agency (URL: https://dataspace.copernicus.eu/browser/).
Search Bulletin Archive by Publication Date
Select a month and year from the drop-downs and click "Show Issue" to have that issue displayed in this tab.
The default month and year is the latest issue available.
Bulletin of the Global Volcanism Network - Volume 42, Number 09 (September 2017)
Managing Editor: Edward Venzke
Barren Island (India)
Decreased and intermittent thermal anomalies after mid-March 2017
Bogoslof (United States)
Ash-bearing explosions begin in December 2016; lava dome emerges in June 2017
Bristol Island (United Kingdom)
First eruption since 1956; lava flows and ash plumes, April-July 2016
Etna (Italy)
Lava flows during May 2016 followed by new fracture zones and major subsidence at the summit craters
Fogo (Cabo Verde)
November 2014-February 2015 eruption destroys two villages, lava displaces over 1000 people
Krakatau (Indonesia)
Eruption during 17-19 February 2017 sends large lava flow down the SE flank
Langila (Papua New Guinea)
Eruption continues, intensifying from mid-December 2016 through July 2017
Masaya (Nicaragua)
Persistent lava lake and gas plume activity, with intermittent ash emission, through mid-July 2017
Popocatepetl (Mexico)
Ongoing steam, gas, ash emissions, and lava dome growth and destruction, July 2016-July 2017
Sangeang Api (Indonesia)
Weak Strombolian activity and occasional weak ash plumes, 15 July-12 August 2017
Barren Island (India) — September 2017 Cite this Report
Barren Island
India
12.278°N, 93.858°E; summit elev. 354 m
All times are local (unless otherwise noted)
Decreased and intermittent thermal anomalies after mid-March 2017
Following sporadic activity during the second half of 2016, a new period of strong thermal anomalies suggestive of lava flows began in mid-January 2017 (BVGN: 42:03). Scientists on a nearby research vessel observed ash emissions and lava fountains that fed lava flows during 23-26 January. Subsequent possible activity, as shown by MODIS thermal anomalies detected by MIROVA (figure 26), continued at similar levels until mid-March, after the anomalies became more intermittent and decreased in power through at least 2 September. Thermal alerts in MODVOLC were recorded during 15 January-8 March 2017.
Geological Survey of India cruise in May 2015. Some observations and photos of activity on 14 and 31 May 2015 have been provided by Sachin Tripathi, a geologist at the Geological Survey of India, who was close to the volcano during the SR-013 cruise of the RV Samudra Ratnakar. On 14 May the plumes were described as light gray "mushroom shaped" clouds. Tripathi further noted that the activity occurred in discrete pulses; he observed two such events during an 8-minute period that sent ash plumes 300-400 m high (figure 27). Eruptive pulses on 31 May lasted about 20-25 seconds, with an interval of 4-5 minutes. The plumes on that day were light gray to gray, and rose to around 50-100 m. The NE portion of the island was covered with ash (figure 28).
Geologic Background. Barren Island, a possession of India in the Andaman Sea about 135 km NE of Port Blair in the Andaman Islands, is the only historically active volcano along the N-S volcanic arc extending between Sumatra and Burma (Myanmar). It is the emergent summit of a volcano that rises from a depth of about 2250 m. The small, uninhabited 3-km-wide island contains a roughly 2-km-wide caldera with walls 250-350 m high. The caldera, which is open to the sea on the west, was created during a major explosive eruption in the late Pleistocene that produced pyroclastic-flow and -surge deposits. Historical eruptions have changed the morphology of the pyroclastic cone in the center of the caldera, and lava flows that fill much of the caldera floor have reached the sea along the western coast.
Information Contacts: Sachin Tripathi, Geological Survey of India; MIROVA (Middle InfraRed Observation of Volcanic Activity), a collaborative project between the Universities of Turin and Florence (Italy) supported by the Centre for Volcanic Risk of the Italian Civil Protection Department (URL: http://www.mirovaweb.it/); Hawai'i Institute of Geophysics and Planetology (HIGP) - MODVOLC Thermal Alerts System, School of Ocean and Earth Science and Technology (SOEST), Univ. of Hawai'i, 2525 Correa Road, Honolulu, HI 96822, USA (URL: http://modis.higp.hawaii.edu/).
Bogoslof (United States) — September 2017 Cite this Report
Bogoslof
United States
53.93°N, 168.03°W; summit elev. 150 m
All times are local (unless otherwise noted)
Ash-bearing explosions begin in December 2016; lava dome emerges in June 2017
Bogoslof lies 40 km N of the main Aleutian arc, over 1,350 km SW of Anchorage, Alaska (figure 2). Its intermittent eruptive history, first recorded in the late 18th century, has created and destroyed several distinct islands that are responsible for a unique and changing landscape at the summit of this submarine volcano, and produced multiple explosive ash-bearing plumes. The last subaerial eruption, in July 1992, created a lava dome on the N side of the island, adjacent to an eroded dome created in 1927 (BGVN 17:07, figure 1). A new eruption began on 20 December 2016, and was ongoing through July 2017. Information comes from the Alaska Volcano Observatory (AVO) and the Anchorage Volcanic Ash Advisory Center (VAAC).
AVO notes that there is no ground-based monitoring equipment on Bogoslof, so monitoring is accomplished using satellite images, information from the Worldwide Lightning Location Network pertaining to volcanic-cloud lightning, and data from seismic and infrasound (airwave sensor) instruments. The infrasound instruments are located on neighboring Umnak (100 km SW) and Unalaska Islands (85 km SE) and further away at Sand Point (500 km E) on Popof Island, and on the Alaska mainland in Dillingham (825 km NE). AVO also receives reports from observers on ships and airplanes.
The first eruption at Bogoslof since 1992 began during mid-December 2016, when an ash plume was seen on 20 December. Numerous explosions were recorded via seismic, infrasound, lightning, satellite, and visual observations until 19 February 2017, and the morphology of the island changed significantly during that time. Ashfall was reported in Unalaska on 31 January. A large explosion on 7 March produced a substantial ash plume, and was followed by four days with earthquake swarms that lasted for hours. An explosion on 16 May produced an ash plume that rose to over 10 km altitude. A larger explosion on 28 May created tephra jets, pyroclastic fall and flow material around the island, and a possible 13.7-km-high ash plume. A substantial submarine sediment plume was observed in early June, followed by confirmation of a lava dome above the ocean surface during 5-6 June. A series of explosions during 10 June destroyed the lava dome. Explosions producing ash plumes that rose to altitudes above 10 km occurred on 23 June and 2 July; several additional smaller explosions were recorded through mid-July.
Activity during December 2016-February 2017. According to AVO, Bogoslof showed signs of unrest beginning on 12 December 2016 in seismic, infrasound (air-wave), and satellite data. Ash emissions may have occurred on 16 and 19 December on the basis of recorded lightning strikes, seismic data, and sulfur dioxide clouds detected by satellite instruments, though there were no direct visual observations from satellite or ground observers. On 20 December, a powerful, short-lived explosion at about 1535 AKST (0035 UTC 21 December) sent ash to over 10.3 km altitude which then drifted S (figure 3).
An explosion on 21 December at 1610 AKST was detected in satellite images and seismic data from neighboring islands. This eruption lasted about 30 minutes and sent ash as high as 10.7 km which then drifted N. Satellite images from the next day showed that a small new island had formed just offshore of the NE end of the main island. The previous shore and much of the NE side of Bogoslof Island adjacent to the new island was mostly removed and, according to AVO, was likely the site of the new, underwater vent; deposition of material was visible on the W side of the island (figure 4).
During the morning of 23 December 2016, observers aboard a Coast Guard vessel reported ash emission, lightning, and the ejection of incandescent lava and fragmental material. Ash emission and lava ejection subsided after about an hour. The ash cloud was carried N over the Bering Sea and did not penetrate above the regional cloud tops at 9.1 km altitude. Similar, repeated, short-duration explosions continued every few days through 19 February 2017 before the first break in activity (table 1).
Table 1. Observations of activity at Bogoslof, December 2016-July 2017, as reported by AVO and the Anchorage VAAC. Date is local AKST or AKDT (starting 10 June). Plume altitude in kilometers. Drift is direction and distance in kilometers.
| Date |
Time (local) |
Observation and notes |
Plume Altitude (km) |
Drift |
Detection Method |
| 12 Dec 2016 |
-- |
"Unrest" |
-- |
-- |
Seismic, infrasound, satellite |
| 16 Dec 2016 |
-- |
Possible ash emissions |
-- |
-- |
Lightning, seismic, SO2 |
| 19 Dec 2016 |
-- |
Possible ash emissions |
-- |
-- |
Lightning, seismic, SO2 |
| 20 Dec 2016 |
1530 |
Explosive eruption with ash plume |
10.3 |
S |
Pilot, satellite |
| 21 Dec 2016 |
1610 |
30-minute-long explosion with ash plume |
10.7 |
N |
Satellite, seismic |
| 23 Dec 2016 |
0930 |
Explosion with ash, lightning, incandescent lava, and debris, 60 minute duration |
Below 9.1 |
N |
Coast Guard observers from nearby vessel |
| 25 Dec 2016 |
evening |
Tremor, possible minor, low-level ash emission, lightning |
-- |
-- |
Seismic, lightning |
| 26 Dec 2016 |
1405 |
Ash Plume |
9.1 |
WSW |
Lightning, seismic, satellite |
| 28 Dec 2016 |
1755 |
Tremor, 50 minutes, Cloud cover obscured |
-- |
-- |
Seismic |
| 29 Dec 2016 |
1900, 2345 |
Continuous tremor at 1900, 30-minute-long ash producing event at 2345 |
6.1 |
NE |
Seismic station on Umnak, infrasound, satellite |
| 30 Dec 2016 |
2230 |
Explosive event, 45 minutes, Cloud cover obscured |
-- |
-- |
Seismic, infrasound, lightning |
| 31 Dec 2016 |
0500 |
Low-level eruptive activity, continuous; cloud cover obscured; windy conditions affect local seismic stations |
-- |
-- |
Dillingham infrasound |
| 02 Jan 2017 |
1353 |
Minor explosions, 10 minutes of increased seismicity, cloud cover obscured |
-- |
-- |
Seismic, infrasound |
| 03 Jan 2017 |
2118 |
Seismic activity, 5 minutes, ash plume |
10.0 |
N |
Seismic, infrasound, lightning, satellite |
| 05 Jan 2017 |
1324 |
Increased seismicity, ash plume, detached |
10.7 |
NNW |
Seismic, lightning, satellite, pilot |
| 08 Jan 2017 |
2233, 2256 |
Two strong seismic pulses, two volcanic clouds |
10.7 |
NW |
Seismic, infrasound, satellite |
| 12 Jan 2017 |
1123, 1230 |
Two short-lived explosions, plumes |
5.5, 4.4 |
-- |
Seismic, pilot |
| 14 Jan 2017 |
2126, 2216 |
Six explosions, beginning 2216, no ash plumes observed |
-- |
-- |
Seismic, lightning |
| 17 Jan 2017 |
0400, 0740 |
Increasing tremor signal, Steam with minor ash |
4.6 |
-- |
Seismic, satellite |
| 18 Jan 2017 |
1320 |
Explosion, dark ash cloud, strong thermal anomaly around vent |
9.4 |
NE |
Seismic, pilot, lightning, infrasound, satellite, SO2, MODVOLC |
| 20 Jan 2017 |
1317 |
Explosion, ice-rich ash plume, lava at vent |
11.0 |
SE |
Seismic, lightning, pilot, satellite imagery of lava, infrasound |
| 22 Jan 2017 |
1409 |
Explosion, ash plume |
9.1 |
-- |
Lightning, satellite |
| 24 Jan 2017 |
0453 |
Explosion, ice-rich cloud with likely ash |
7.6-10.7 |
E |
Seismic, lightning |
| 26 Jan 2017 |
0650, 0706 |
Exposion, ice-rich cloud with likely ash; ash drifted in multiple directions |
9.8, 6.1 |
SE, NE |
Seismic, lightning |
| 27 Jan 2017 |
0824 |
Explosion, ice-rich cloud with likely ash |
7.6 |
-- |
Seismic, lightning |
| 30 Jan 2017 |
2020 |
Eruption cloud, more than 10 short explosions, Trace ashfall in Dutch Harbor (98 km E) and strong SO2 odor |
7.6 |
125 km SE |
Seismic, infrasound, lightning, satellite |
| 03 Feb 2017 |
0457, 0533 |
Increased seismicity, small explosions, no ash detected |
-- |
-- |
Seismic, infrasound |
| 03 Feb 2017 |
1641 |
Seismic event, small plume |
7.6 |
40 km N |
Infrasound, satellite, pilot |
| 5, 7, 8 Feb 2017 |
-- |
Weakly elevated surface temp |
-- |
-- |
Satellite |
| 13 Feb 2017 |
0724 |
Increased seismicity, no ash emissions above 3 km |
-- |
-- |
Seismic, satellite |
| 17 Feb 2017 |
0955, 1546 |
Explosive event, ash plume |
11.6, 7.6 |
N |
Seismic, satellite, pilot, infrasound, lightning |
| 18 Feb 2017 |
0450 |
Explosion, ash emissions |
7.6 |
SW |
Seismic, infrasound, lightning, satellite |
| 19 Feb 2017 |
1708-1745 |
Series of short explosive pulses, plume |
7.6 |
160 km SE |
Seismic, infrasound, satellite |
| 07-08 Mar 2017 |
2236 |
3 hour explosive event, large ash plume, over 1,000 lightning strokes |
10.7 |
E |
Seismic, lightning, infrasound |
| 09-10 Mar 2017 |
1750 |
Earthquake swarm, 20 hours |
-- |
-- |
Seismic |
| 10-11 Mar 2017 |
1900 |
Earthquake swarm, 10 hours |
-- |
-- |
Seismic |
| 12 Mar 2017 |
0500 |
Earthquake swarm |
-- |
-- |
Seismic |
| 13 Mar 2017 |
1131 |
Seismic event, small ash cloud, weakly elevated surface temps |
5.5 |
90 km SSW |
Seismic, satellite |
| 16 May 2017 |
2232 |
Increased seismicity, ash plume, 73 minutes |
10.4 |
SW |
Seismic, infrasound, lightning, satellite, pilot |
| 28 May 2017 |
1416 |
Explosion, ash plume, 50 minutes, plume visible for 4 days |
10.7-13.7 |
W, NE |
Seismic, satellite, pilot |
| 31 May 2017 |
1842 |
Several hour-long seismic swarm followed by short duration explosion, volcanic cloud |
7.3 |
WNW |
Seismic, infrasound, satellite |
| 05 Jun 2017 |
0750 |
Explosion, small volcanic cloud |
-- |
-- |
Seismic, pilot |
| 06 Jun 2017 |
0600 |
Brief explosive event, possible plume, lava dome emerges |
1.8 |
-- |
Seismic, infrasound, satellite |
| 10 Jun 2017 |
0318 |
Explosive eruption, ash-rich cloud |
10.4 |
NW |
Seismic, infrasound, lightning, satellite |
| 12 Jun 2017 |
1747 |
Series of explosive events, ash plumes |
7.6 |
SE |
Seismic, infrasound |
| 13 Jun 2017 |
0817 |
Six-minute long explosion, no plume observed |
-- |
-- |
Seismic, infrasound |
| 23 Jun 2017 |
1649 |
Five explosions, ash plume |
11.0 |
400-490 km E |
Seismic, infrasound |
| 26 Jun 2017 |
1645 |
14-minute explosion, ash plume |
7.6 |
-- |
Seismic |
| 27 Jun 2017 |
0317 |
14-minute explosion, ash plume |
9.1 |
NW |
Seismic, lightning |
| 30 Jun 2017 |
0124 |
Explosion, 20 minutes, small cloud |
-- |
16 km N |
Seismic |
| 02 Jul 2017 |
1248 |
16-minute explosion, ash plume |
11 |
E |
Seismic, infrasound |
| 04 Jul 2017 |
1651 |
13-minute explosive event, eruption cloud |
8.5 |
SE |
Seismic |
| 04 Jul 2017 |
1907 |
11-minute-long explosion, small cloud |
9.8 |
SE |
Seismic |
| 08 Jul 2017 |
1015 |
Two eruption pulses, ash plume |
9.1 |
N |
Seismic, satellite |
| 09 Jul 2017 |
2347 |
Two eruptions, 5-minutes and 7-minutes long, small ash cloud |
6.1 |
SE |
Seismic, satellite |
| 10 Jul 2017 |
1000, 1706 |
Two explosions, no confirmed ash |
-- |
-- |
Seismic, infrasound |
AVO reported that photos taken by a pilot on 10 January showed Bogoslof covered with dark gray ash, and a roughly 300-m-diameter submarine explosion crater on the E side of the island. The dark (ash-rich) plume from an explosion on 18 January (figure 5) was identified in satellite images and observed by a pilot; the event produced lightning strikes and infrasound signals detected by sensors in Sand Point and Dillingham. Analysis of a satellite image suggested the presence of very hot material (possibly lava) at the surface immediately surrounding the vent, which was the first such observation since the beginning of the eruption. The first MODVOLC thermal alerts were issued on 18 January.
AVO analysis of satellite images from 16 and 18 January 2017 (before the eruption that day) showed that the vent area, which formed on the NE end of the island in shallow water, had been filling in with eruptive material and building out of the water. On 20 January, satellite images showed an ice-rich plume and lava present at the vent. Prevailing winds carried the plume to the SE over the SW end of Unalaska Island, but no ash fall was reported. A high spatial resolution satellite image collected on 24 January showed AVO that the explosive eruptions continued to change the morphology of the island and the coastline (see figure 7). The eruptive vent, however, remained below sea level in the N portion of a figure-eight-shaped bay, as indicated by the presence of upwelling volcanic gases. There was no sign of lava at the surface.
A series of more than 10 short-duration explosions beginning on 30 January (AKST) and detected in seismic, infrasound, and lightning data, resulted in an ash plume that rose to 7.6 km altitude and drifted 125 km SE. Trace amounts of ashfall and a strong SO2 odor were reported in Dutch Harbor on Unalaska Island (98 km E) (figure 6). Satellite images acquired on 31 January showed additional significant changes to the morphology of the island (figure 7). AVO stated that freshly erupted volcanic rock and ash had formed a barrier that separated the vent from the sea.
On 19 February 2017, a series of short-lived explosive pulses resulted in a plume that drifted 160 km SE over Unalaska Island. AVO geologists on the island described the cloud has having a white upper portion and a slightly darker lower portion. A satellite image from 23 February showed that the vent location at Bogoslof remained underwater. After the 19 February events, the volcano was quiet for two weeks.
Activity during March 2017. A 3-hour-long explosive event occurred overnight during 7-8 March 2017 and produced numerous strokes of volcanic lightning, high levels of seismicity and infrasound, and an ash cloud up to 10.7 km altitude that moved E over Unalaska Island. The seismicity was among the highest levels observed for the eruption sequence that began in mid-December 2016, and the more than 1,000 detected lightning strokes were by far the highest number observed to date. The eruptive activity again changed the shape of the island and temporarily dried out the vent area. Satellite images from 8 March showed that the W coast of the island appeared to have grown significantly due to the eruption of new volcanic ash and blocks. A new vent was also identified on the NW side of the island, and the lava dome emplaced during the 1992 eruption was partially destroyed (figure 8).
Two earthquake swarms were detected during 9-11 March; the first began at 1750 on 9 March and ended at 1400 on 10 March, and the second was detected from 1900 on 10 March to 0500 on 11 March. Mildly elevated surface temperatures were identified in satellite data during 10-11 March. A third swarm began at 0500 on 12 March. A 12-minute-long explosive event, beginning at 1131 on 13 March, produced a small ash cloud that rose to an altitude of 5.5 km and drifted SSW. AVO noted that after the event, the level of seismic activity declined and the repeating earthquakes of the previous several days had stopped. Weakly elevated surface temperatures were observed in two satellite images from 13 March. A photograph taken by a pilot showed a low-level, billowy steam plume rising from the general area of the intra-island lake. Except for weakly elevated surface temperatures in satellite data, no significant activity was reported during the rest of March. The only activity detected during April 2017 was a brief increase in seismicity on 15 April. Aerial reconnaissance by the US Coast Guard on 8 May showed the dramatic changes of the island's shape (figure 9).
Activity during May-July 2017. Following a pause in explosive activity that lasted a little over two months, Bogoslof erupted explosively at 2232 (AKDT) on 16 May. The eruption, which lasted about 70 minutes, was detected by seismic and infrasound sensors on neighboring islands and the resulting ash-cloud-generated volcanic lightning that was detected by the Worldwide Lightning Location Network. A pilot report and satellite images showed that the plume rose as high as 10.4 km, and then drifted SW. Trace ashfall was reported in the community of Nikolski on Umnak Island (125 km SW). A drifting sulfur dioxide cloud from the eruption was detected for several days using satellite-based sensors. The eruption altered the northern coastline of the island, with the crater lake breached by a 550-m-wide gap along the N shore. Part of the NE shore had been extended 300 m due to new tephra deposits.
Another large explosion began at 1416 on 28 May 2017. Pilot and satellite observations indicated that ash plumes rose at least 10.7 km and possibly as high as 13.7 km altitude (figure 10). An observer on Unalaska Island reported seeing a large white-gray mushroom cloud form over Bogoslof, with ashfall to the W. The event lasted 50 minutes. On 29 May the ash cloud continued to drift NE, and on 2 June, an SO2 plume from the event was still visible in satellite data drifting over the Hudson Bay region.
On 5 June, a vessel in the area reported vigorous steaming and a white plume rising at least a kilometer above sea level. Also, a substantial submarine sediment plume was seen in satellite imagery drifting N from the lagoon area (figure 11). A brief explosive event at 0600 on 6 June likely produced a low-level (less than 3 km) emission. A possible plume at 1.8 km that quickly dissipated was identified in a satellite image following the detection of the activity in seismic and infrasound data.
AVO reported that a new lava dome breached the surface of the ocean on or around 6 June 2017; it was the first observation of lava at the surface since the start of the eruption in mid-December 2016 (figure 12). The dome was an estimated 110 m in diameter on 7 June, and then grew to 160 m in diameter by 9 June. Four short-duration explosions were detected in seismic and/or infrasound data between 5 and 7 June, and generated volcanic clouds that in many cases were too small to be observed in satellite data. AVO reported that robust steaming was identified in satellite data and by observers aboard a U.S. Fish and Wildlife Service ship in the region following the emergence of the lava dome likely due to, or enhanced by, the effusion of lava into the ocean.
A series of six explosions was detected on 10 June, starting with a 2-hour explosive event that emitted an ash-rich cloud to 10.4 km altitude that was detected in seismic, infrasound, lightning, and satellite data. This event destroyed the 160-m-diameter lava dome that was first observed on 5 June (figure 13). On 12 June, a series of four small explosions lasting 10-30 minutes each emitted volcanic clouds that rose to a maximum height of 7.6 km, and dissipated within about 30 minutes. On 13 June, a six-minute-long explosion occurred, although no ash cloud was observed in satellite imagery likely because it's altitude was below detection limits.
Weakly elevated surface temperatures detected in satellite imagery on 10 and 11 June suggested to AVO that a new lava dome was extruding beneath the ocean surface. Satellite imagery showed persistent degassing from the island in between explosions. In addition, residents of Unalaska/Dutch Harbor reported smelling sulfur on 12 June, and winds were consistent with a source at Bogoslof. AVO reported that elevated surface temperatures and a small steam emission were identified in satellite images during 13-14 and 16 June. A 13-km-long steam plume was visible on 18 June.
A series of nine explosions were detected in seismic and/or infrasound data during the night of 23 June, the largest of which produced a volcanic cloud reaching an altitude of 11 km that drifted well over 400 km E (figure 14). Additional explosions on 26 and 27 June sent volcanic clouds to 7.6 and 9.1 km altitude, respectively. Winds carried most of these plumes N and NE; AVO received no reports of ashfall from local communities. Bogoslof erupted again on 29 June and produced a small plume, and several times during the first two weeks of July explosions produced larger plumes that rose to 8.5-11 km altitude. Two explosions that occurred on 10 July without producing observed ash were the last for the rest of the month. Weakly elevated surface temperatures were observed in clear satellite images on 12 and 16 July. No further activity was reported for the rest of July 2017.
A modest thermal signal was detected by the MIROVA system between February and July 2017 consistent with the activity that suggested lava dome growth during that time (figure 15).
References: Beget, J.E., Larsen, J.F., Neal, C.A., Nye, C.J., and Schaefer, J.R., 2005, Preliminary volcano-hazard assessment for Okmok Volcano, Umnak Island, Alaska: Alaska Division of Geological & Geophysical Surveys Report of Investigation 2004-3, 32 p., 1 sheet, scale 1:150,000.
Geologic Background. Bogoslof is the emergent summit of a submarine volcano that lies 40 km N of the main Aleutian arc. It rises 1,500 m above the Bering Sea floor. Repeated construction and destruction of lava domes at different locations during historical time has greatly modified the appearance of this "Jack-in-the-Box" volcano and has introduced a confusing nomenclature applied during frequent visits by exploring expeditions. The present triangular-shaped, 0.75 x 2 km island consists of remnants of lava domes emplaced from 1796 to 1992. Castle Rock (Old Bogoslof) is a steep-sided pinnacle that is a remnant of a spine from the 1796 eruption. The small Fire Island (New Bogoslof), about 600 m NW of Bogoslof Island, is a remnant of a lava dome formed in 1883.
Information Contacts: Alaska Volcano Observatory (AVO), a cooperative program of a) U.S. Geological Survey, 4200 University Drive, Anchorage, AK 99508-4667 USA (URL: http://www.avo.alaska.edu/), b) Geophysical Institute, University of Alaska, PO Box 757320, Fairbanks, AK 99775-7320, USA, and c) Alaska Division of Geological & Geophysical Surveys, 794 University Ave., Suite 200, Fairbanks, AK 99709, USA (URL: http://www.dggs.alaska.gov/); Anchorage Volcanic Ash Advisory Center (VAAC), Alaska Aviation Weather Unit, NWS NOAA US Dept of Commerce, 6930 Sand Lake Road, Anchorage, AK 99502-1845(URL: http://vaac.arh.noaa.gov/); NASA Earth Observatory, EOS Project Science Office, NASA Goddard Space Flight Center, Goddard, Maryland, USA (URL: http://earthobservatory.nasa.gov/).
Bristol Island (United Kingdom) — September 2017 Cite this Report
Bristol Island
United Kingdom
59.017°S, 26.533°W; summit elev. 1100 m
All times are local (unless otherwise noted)
First eruption since 1956; lava flows and ash plumes, April-July 2016
Bristol Island, near the southern end of the seven South Sandwich Islands in the isolated Southern Atlantic Ocean, lies 800 km SE of South Georgia Island at latitude 59° S. Historic eruptions occurred on Bristol Island in 1823, the 1930s, and the 1950s. A new eruption was reported from Mount Sourabaya, a cone near the center of the island, beginning at the end of April 2016. It produced ash plumes and strong thermal anomalies most likely generated by lava flows until the end of July 2016. Information about Bristol Island comes from NASA Earth Observatory and other satellite imagery data, and the Buenos Aires Volcanic Ash Advisory Center (VAAC).
Evidence for a new eruption at Bristol Island first appeared in Landsat 8 imagery on 24 April 2016 as a large steam plume and a thermal anomaly at the summit (figure 1). Another image on 1 May showed the still-active plume and an elongation of the thermal anomaly to the W, suggesting that lava may have breached the crater rim. Two MODVOLC thermal alerts also appeared on 24 April; their frequency and intensity increased significantly in subsequent days.
The number of daily MODVOLC thermal alerts increased during May 2016 to as many as 35 on 26 May. On many days, more than 10 thermal alerts were issued. The distribution of the alert pixels suggested that an E-W linear feature such as one or more lava flows was responsible for many of the thermal anomalies (figure 2).
A Moderate Resolution Imaging Spectroradiometer (MODIS) satellite image of Bristol Island acquired on 28 May 2016 showed an ash plume from Mt. Sourabaya drifting NE (figure 3). The Buenos Aires VAAC issued the first reports of gas and possible ash plumes on 29 May 2016, noting that they drifted as far as 185 km N, NNE, and SE at an altitude of approximately 1.5 km.
The Buenos Aires VAAC issued multiple daily ash advisories during 29 May-7 June 2016. They noted that weather clouds mostly prevented satellite observations of Mount Sourabaya during 1-6 June, though a thermal anomaly was detected during 1-2 and 5-7 June. Satellite images from Suomi NPP/VIIRS often showed possible ash plumes mixed with clouds, but revealed distinct plumes on 2 and 4 June (figure 4) drifting E, and on 7 June towards the NE. On 16 June, a diffuse plume of volcanic ash was reported by the Buenos Aires VAAC moving SE at about 1.5 km altitude. MODVOLC thermal alerts continued even more strongly in June than during May. On almost every day, more than ten alerts were recorded, and they continued with a broad E-W distribution similar to that seen during May.
On 16 and 18 July, ash seen in Suomi NPP/VIIRS imagers appeared to be drifting NE, and on 19 July a faint thin ash plume was identified drifting 100 km NE; the persistent thermal anomaly continued to be visible. No further VAAC reports were issued after 21 July. Numerous MODVOLC thermal alerts continued during most days of July, until they stopped abruptly after the 17 alerts issued on 26 July (figure 5). The MIROVA thermal anomaly system captured a strong signal from Bristol Island between late April and late July 2016 (figure 6).
Two satellite images, from 21 August and 22 September 2016, confirm the presence of new lava fields around the summit of Mount Sourabaya that were created during the April-July 2016 eruption (figure 7).
Geologic Background. The 9 x 10 km Bristol Island near the southern end of the South Sandwich arc lies across Fortser's Passage from the Southern Thule Islands and forms one of the largest islands of the chain. Largely glacier-covered, it contains a horseshoe-shaped ridge at the interior extending northward from the highest peak, 1100-m-high Mount Darnley. A steep-sided flank cone or lava dome, Havfruen Peak, is located on the east side, and a young crater and fissure are on the west flank. Three large sea stacks lying off Turmoil Point at the western tip of the island may be remnants of an older now-eroded volcanic center. Both summit and flank vents have been active during historical time. The latest eruption, during 1956, originated from the west-flank crater, and deposited cinder over the icecap. The extensive icecap and the difficulty of landing make it the least explored of the South Sandwich Islands.
Information Contacts: NASA Earth Observatory, EOS Project Science Office, NASA Goddard Space Flight Center, Goddard, Maryland, USA (URL: http://earthobservatory.nasa.gov/); NASA Worldview (URL: https://worldview.earthdata.nasa.gov/); Buenos Aires Volcanic Ash Advisory Center (VAAC), Servicio Meteorológico Nacional-Fuerza Aérea Argentina, 25 de mayo 658, Buenos Aires, Argentina (URL: http://www.smn.gov.ar/vaac/buenosaires/inicio.php?lang=es); MIROVA (Middle InfraRed Observation of Volcanic Activity), a collaborative project between the Universities of Turin and Florence (Italy) supported by the Centre for Volcanic Risk of the Italian Civil Protection Department (URL: http://www.mirovaweb.it/); Hawai'i Institute of Geophysics and Planetology (HIGP), MODVOLC Thermal Alerts System, School of Ocean and Earth Science and Technology (SOEST), Univ. of Hawai'i, 2525 Correa Road, Honolulu, HI 96822, USA (URL: http://modis.higp.hawaii.edu/); South Sandwich Islands Volcano Monitoring Blog (URL: http://southsandwichmonitoring.blogspot.com/); Cultur Volcan, Journal d'un volcanophile (URL: https://laculturevolcan.blogspot.com/).
Etna
Italy
37.748°N, 14.999°E; summit elev. 3357 m
All times are local (unless otherwise noted)
Lava flows during May 2016 followed by new fracture zones and major subsidence at the summit craters
Italy's Mount Etna on the island of Sicily has had historically recorded eruptions for the past 3,500 years. Lava flows, explosive eruptions with ash plumes, and lava fountains commonly occur from its major summit crater areas, the North East Crater (NEC), the Voragine-Bocca Nuova complex (VOR-BN), the South East Crater (SEC) (formed in 1978), and the New South East Crater (NSEC) (formed in 2011). The Etna Observatory, which provides weekly reports and special updates on activity, is run by the Catania Branch of Italy's Istituo Nazionale di Geofisica e Vulcanologica (INGV). This report uses information from INGV to provide a detailed summary of events between April 2016 and January 2017.
Summary of April 2016-January 2017 activity. A new eruptive episode at Etna began on 15 May 2016 and included activity around all four major summit cones; Strombolian activity began at NSEC on 15-16 May, from a pit on the E flank of the cone. The following night, thermal webcams suggested Strombolian activity at NEC. This ceased on 18 May when Strombolian activity started at VOR that also produced a large ash plume. Lava then overflowed the W rim of BN and headed W multiple times during the next few days. A different flow emerged from a fracture on the SE side of VOR near SEC on 21 May. Activity from all of the active vents had ended by 26 May. New fracture zones trending N-S and NE-SW, and extensive subsidence within VOR were observed at the summit craters at the end of May after the episode ceased.
Intermittent weak ash emissions during late May and July and intense degassing from several craters were the primary activity until explosive activity at VOR began on 7 August and opened a new vent along the inner wall of the NE rim. Strong subsidence followed at VOR and BN during August and September, creating a single large crater that included both areas. Dense ash emissions from the vent on the upper E flank of NSEC in mid-October and a few modest ash emissions from VOR and NSEC were observed. There was also persistent incandescence from the new vent at VOR and its continued subsidence through early January 2017. After the spike in activity during May 2016, heat flow diminished, but was persistent throughout the period (figure 174).
Activity during March-April 2016. After the major lava fountains and ash plumes of the first week of December 2015 (BGVN 42:05), eruptive activity was lower through March 2016. Sporadic ash emissions and minor incandescence were reported a few times each month. The largest event was an explosion on 23 February 2016; it produced an ash plume that drifted NE and caused ashfall in communities as far as 40 km away.
Continuous degassing accompanied dense ash emissions from the North East Crater (NEC) and the New South East Crater (NSEC) during 31 March-1 April 2016. Winds sent material to the SW, and then changed direction to the N the following day, dispersing pyroclastic material around the crater area. Ash emissions continued to be weak but persistent for the rest of April from NEC and NSEC, while only minor degassing was observed from the Voragine-Bocca Nuova complex (VOR-BN). A new pit crater was observed near the center of BN from the gradual collapse of the crater between 19 February and 15 April 2016.
Activity during May 2016. Although visibility was limited due to weather in early May 2016, discontinuous explosive activity with minor ash emissions was observed over several days from NEC and NSEC near the top of Valle del Bove (a large valley SE of the summit crater area). Weak incandescence from NSEC was detected by the high-resolution webcam at Monte Cagliato for the first time in several months during the night of 16 May, and marked the beginning of a new eruptive episode that lasted until 25 May 2016, involving activity at all four summit crater areas (figure 175).
Explosive activity first observed during the night of 15-16 May 2016 at NSEC came from a pit on the E flank of the cone. The following night, webcams also showed a thermal anomaly at NEC, interpreted by INGV as probable Strombolian activity. At first light on 17 May, intense degassing was observed from NEC which lasted throughout the day and included minor ash emissions. Strong explosions from NEC were heard about 10 km from the crater. Strombolian activity rising tens of meters above the rim was first observed around 2000 UTC. During the night of 17-18 May, intermittent flashes, likely from explosive activity, originated from the pit on the E flank of NSEC.
Continued explosions at NEC during the morning of 18 May produced an ash cloud that drifted ESE. This activity ceased around 1050 UTC, when Strombolian activity began at VOR that rapidly evolved into a lava fountain. The activity also created an ash plume that rose to an altitude of 7 km and drifted due E. The lava fountain continued until about 1430 UTC. Shortly after the Strombolian activity began at VOR (around 1100 UTC), lava overflowed the W rim of BN and headed W towards Monte Nunziata. It traveled for about 2 km and stopped at an elevation of around 2,100 m based on observations from the Bronte thermal webcam. Also at 1100 UTC, a small explosive vent opened at the base of the N side of NEC (Bocca 1 in red, figure 175) that spattered for a few minutes. Around 1530 UTC, an improvement in weather conditions permitted observation of a new lava flow in the Valle del Bove. The flow, fed by a vent at the base of the E side of NEC (Bocca 2 in red, figure 175), headed E towards Monte Simone, and stopped at an elevation of approximately 2,400 m.
By the morning of 19 May, although adverse weather conditions prevented observations, a sudden increase in the amplitude of tremor and loud explosions heard in communities E and S of the volcano suggested another explosive episode at VOR. A dense eruptive cloud drifted E. A new lava flow emerged from the W rim of BN, and headed W on top of the flow from the previous day. It divided into several arms, the longest of which flowed about 1,800 m, near Monte Nunziata, without reaching the nearby highway. Strombolian activity was again observed at VOR beginning around 1900 UTC on 20 May when weather conditions improved.
Beginning around 0140 UTC on 21 May 2016, a rapid escalation of the amplitude of volcanic tremor occurred together with increased explosions from VOR. Around 0200 a small lava flow was observed from a fracture at the base of the SE side of the cone of VOR near the base of SEC (the yellow flow marked on figure 175). The intense explosive activity at VOR generated a plume that drifted S. Tremor amplitude decreased suddenly around 0600. Lava was observed overflowing the W rim of BN around 0700, covering the flows of the previous days. Strombolian activity was again observed from VOR during the night of 21-22 May. Sporadic ash emissions from the pit on the E flank of NSEC during the early morning of 22 May quickly dissipated. That afternoon, renewed Strombolian activity began at NEC which intensified and then ended during the following night (figure 176).
A new round of weak Strombolian activity began at VOR around 1900 on 23 May 2016. Activity continued until 1750 on 24 May when explosive activity increased sharply. Vigorous Strombolian activity peaked during the night of 24-25 May. Incandescent material rose a few hundred meters into the air, and mostly fell back into the crater. It was not accompanied by a lava flow or ash plume. Activity began decreasing during the afternoon of 25 May, and ceased sometime during the following night. Both ground-based and aerial observations by INGV personnel on 26 and 27 May confirmed the end of the eruptive episode and documented its effects (figure 177).
A N-S trending fracture zone about 400 m wide and 1,300 m long was observed extending S beginning at the northern side of NEC, crossing the E rim of the Central Crater (the combined VOR-BN complex), where it changes direction and extends SE toward the SEC (figure 178). A vent at the base of the saddle between SEC and VOR fed weak effusive activity on 21 May. Tens of meters of collapse within the graben contributed to the destruction of the S rim of NEC, significantly changing its shape and filling it with debris.
Major subsidence at VOR after the end of the Strombolian activity of 23-26 May 2016 created numerous sub-circular concentric fractures within the crater with a vent degassing at the base (figure 179). The BN area was filled with the eruptive material that had overflowed the W rim (figure 180).
Activity during June 2016-January 2017.A weak ash emission from VOR on the morning of 31 May 2016 was the only additional eruptive activity during May. INGV volcanologists making ground observations on 3 June noted about 10 m of subsidence of the lava surface filling BN and continued collapse at the center of VOR. Intense degassing of mostly water vapor occurred from the fracture on the SE side of VOR. Strong degassing continued from all the new fracture zones at the summit during June and July. Ground-based thermal imagery recorded on 16 June indicated temperatures as high as 300°C around the fractures within the Central Crater. A helicopter overflight on 14 July showed few changes in the graben system first documented at the end of May, except for continued collapse near the S rim of NEC. Minor ash emissions resumed at NSEC; they were observed during 10-14, 19-21, and 26-28 July. Explosions were heard from the W side of BN during a visit by INGV scientists on 28 July.
Intense and persistent degassing continued during August 2016 from NEC and from the fractures between NEC and VOR (figure 181). Incandescence was observed within the fractures on 4 August. NSEC produced minor ash emissions again during 4-5 August. Low intensity explosive activity began at VOR on 7 August, but no material was ejected beyond the crater rim. An incandescent vent was observed within the collapsed inner wall of VOR on 10 August (figure 182). Explosive activity and incandescence was intermittent from this vent during 7-22 August. The apparent temperature at the vent as measured by thermal camera was greater than 580°C on 22 August. Weak and episodic ash emissions also occurred from a vent on the upper E side of NSEC on 27 and 29 August. Incandescent degassing continued at the 7 August VOR vent throughout September, along with persistent fumarolic emissions from the fracture zones.
A series of low-frequency seismic events were recorded at the summit on 10 October, some accompanied by explosive sounds. The strongest seismic event produced ash and hot gas that was recorded by two thermal cameras during the early afternoon. The ash rose from the W part of BN about 100 m above the rim and drifted rapidly E. During an inspection on 12 October, INGV scientists noted that subsidence of about 50 m had occurred within the BN, centered near the W crater wall, and was ongoing. They observed the sudden dropping of material along concentric fractures accompanied by reddish ash and modest steam emissions. One of these events exposed an incandescent area within the fresh lava (figure 183).
Dense ash emissions were produced on 17 October from the 25 November 2015 vent on the upper E flank of the NSEC (figure 184). A diffuse brown ash plume was observed the next day during a field inspection of the area. Intermittent diffuse brown ash emissions were again observed on 6 November. Persistent fumaroles from the vent at VOR and bottom subsidence at BN continued during November where two distinct areas of subsidence (BN-1 and BN-2) were visible (figure 185).
Intermittent, low-intensity incandescence at the VOR vent appeared during the night of 28-29 November 2016. Sporadic, minor ash emissions occurred from the saddle area between SEC and NSEC during 15 December. Incandescence that evening from the VOR vent was also recorded on the webcams. A light coating of ash and a few lithic blocks appeared the next morning in the fresh snow on the flank of the SEC. Modest ash emissions from the same area continued intermittently through the end of December. On 31 December, a diffuse ash plume was also noted from the vent on the upper E flank of NSEC. Sporadic incandescence continued from the VOR vent during early January 2017.
Geologic Background. Mount Etna, towering above Catania on the island of Sicily, has one of the world's longest documented records of volcanism, dating back to 1500 BCE. Historical lava flows of basaltic composition cover much of the surface of this massive volcano, whose edifice is the highest and most voluminous in Italy. The Mongibello stratovolcano, truncated by several small calderas, was constructed during the late Pleistocene and Holocene over an older shield volcano. The most prominent morphological feature of Etna is the Valle del Bove, a 5 x 10 km caldera open to the east. Two styles of eruptive activity typically occur, sometimes simultaneously. Persistent explosive eruptions, sometimes with minor lava emissions, take place from one or more summit craters. Flank vents, typically with higher effusion rates, are less frequently active and originate from fissures that open progressively downward from near the summit (usually accompanied by Strombolian eruptions at the upper end). Cinder cones are commonly constructed over the vents of lower-flank lava flows. Lava flows extend to the foot of the volcano on all sides and have reached the sea over a broad area on the SE flank.
Information Contacts: Sezione di Catania - Osservatorio Etneo, Istituto Nazionale di Geofisica e Vulcanologia (INGV), Sezione di Catania, Piazza Roma 2, 95123 Catania, Italy (URL: http://www.ct.ingv.it/it/); MIROVA (Middle InfraRed Observation of Volcanic Activity), a collaborative project between the Universities of Turin and Florence (Italy) supported by the Centre for Volcanic Risk of the Italian Civil Protection Department (URL: http://www.mirovaweb.it/).
Fogo (Cabo Verde) — September 2017 Cite this Report
Fogo
Cabo Verde
14.95°N, 24.35°W; summit elev. 2829 m
All times are local (unless otherwise noted)
November 2014-February 2015 eruption destroys two villages, lava displaces over 1000 people
The 25-km-wide island of Fogo in the Cape Verde Islands, 750 km W of Dakar, Senegal, is a single massive stratovolcano with a 9-km-wide summit caldera (Cha Caldera) that is breached to the east. A steep-sided central cone, Pico, rises more than a kilometer above the caldera floor, and is capped by a 500-m-wide, 150-m-deep summit crater; it was apparently almost continuously active from the time of Portuguese settlement in 1500 CE until around 1760. Several lava flows that erupted during the eighteenth and nineteenth centuries reached the eastern coast below the breached caldera rim (BGVN 20:03, figure 1). Lava flows in 1951 and 1995 were contained within the W half of the Cha Caldera, as were the flows from the November 2014-February 2015 eruption (figure 16) described below. Information for this report comes from the Toulouse Volcanic Ash Advisory Center (VAAC), the Observatório Vulcanológico de Cabo Verde (OVCV), and satellite and news data from several sources.
The April-May 1995 eruption produced lava flows from a vent at the SW base of the Pico cone (BGVN 20:05, figure 3) that flowed SW and NW from the vent. They cut off the main access road to the larger villages of Portela and Bangaeira along the NW side of the caldera, but the approximately 1,300 residents from the various communities within the caldera were all safely evacuated, and the villages were spared. Effusive activity produced Strombolian fountains, pyroclastic material, ash plumes, and both pahoehoe and aa lava flows. The lava flows destroyed the small settlement of Boca de Fonte (population 56) near the caldera wall about 2 km W of the eruption center, and reached to within 300 m of Portela village. By the time it was over at the end of May 1995, new lava flows covered about 6.3 km2 of land, and ranged from one to over twenty meters thick.
The most recent eruption at Fogo began with lava flows emerging from a similar fissure vent at the base of Pico on 23 November 2014 (figure 17), and continued through 8 February 2015 according to OVCV; the flows covered about 4 km2 of land. The villages of Portela and Bangaeira, located 4-5 km NW of Pico with a combined population of about 1,000 residents, were not spared during the 2014-15 eruption as they had been in 1995; both villages were largely destroyed (figure 18), although their inhabitants were safely rescued. The eruption began from a fissure near the 1995 vent, but it soon emerged from multiple vents along the fissure with Strombolian activity (figure 19), explosions, lava fountains, and ash emissions.
The lava flows consisted of three primary lobes that traveled NNW, S, and W (BGVN 39:11, figure 8). During the earliest days of the eruption in late November, lava flowed to the NNW destroying much of Portela (figure 20 and 21) and to the S from the main fissure. The flow to the S ceased after 30 November.
The main flows continued NNW into the first week of December; they destroyed the remaining structures in Portela and caused extensive damage in Bangaeira and at the Parque Natural de Fogo headquarters (figures 22 and 23). A third lobe flowed to the W of the fissure during the second half of December, reaching the base of the 1-km-high caldera rim where it damaged farms and infrastructure in the small village of Ilhéu de Losna (see figure 16). The lava had ceased advancing by early January.
The MODVOLC thermal alert system issued eight thermal alerts from the lava flows (figure 24) on 23 November 2014. Tens of alerts were reported almost daily through 19 December, with a peak of 46 alerts on 30 November. For the rest of December, as many as 10 alerts a day were recorded. By January 2015, they became more intermittent, with no more than three alerts issued in any day, and they occurred on only 11 days of the month. The final two thermal alerts were recorded on 7 February 2015.
Ash emissions from the fissure vents were intermittent throughout the eruption (figures 25). The first major plume on 24 November 2014 was reported by the Toulouse VAAC as consisting largely of SO2, with very little ash. It rose to 9.1 km altitude, drifted 220 km NW, and caused minor ashfall on the flanks of the volcano. After the initial plume of mostly SO2, ash emissions from the vent were generally below 3.9 km altitude and limited to the immediate area of the island (figure 26).
Ash was reported rising to 2 km above the summit (4.8 km altitude) on 2 December (figure 27), and ashfall was reported near San Felipe (17 km SW). Ash and SO2 emissions decreased in mid-December; the next plume was reported on 21 December rising 800 m above the summit. Additional plumes during 30 December-2 January rose 400-900 m above the cone and occasionally sent tephra up to 40 m away. Several explosions of gas-and-ash plumes during 8-12 January produced plumes that rose up to 2 km above the summit and drifted E or SE. The largest plume, on 12 January, was very dense and dark-gray, it rose 2 km and drifted E; tephra was also ejected 50 m above the crater and was observed by people in San Felipe and other parts of the island.
Satellite data on SO2 flux from Fogo corroborated the VAAC reports of the high SO2 content in the emissions, especially during the first two weeks of the eruption when Dobson Unit (DU) values greater than 2 were recorded several times, and the plume areas covered several hundred thousand square kilometers (figure 28).
Geologic Background. The island of Fogo consists of a single massive stratovolcano that is the most prominent of the Cape Verde Islands. The roughly circular 25-km-wide island is truncated by a large 9-km-wide caldera that is breached to the east and has a headwall 1 km high. The caldera is located asymmetrically NE of the center of the island and was formed as a result of massive lateral collapse of the older Monte Armarelo edifice. A very youthful steep-sided central cone, Pico, rises more than 1 km above the caldera floor to about 100 m above the rim. Pico, which is capped by a 500-m-wide, 150-m-deep summit crater, was apparently in almost continuous activity from the time of Portuguese settlement in 1500 CE until around 1760. Later lava flows, some from vents on the caldera floor, reached the eastern coast below the breached caldera.
Information Contacts: Toulouse Volcanic Ash Advisory Center (VAAC), Météo-France, 42 Avenue Gaspard Coriolis, F-31057 Toulouse cedex, France (URL: http://www.meteo.fr/vaac/); Observatório Vulcanológico de Cabo Verde (OVCV), Departamento de Ciência e Tecnologia, Universidade de Cabo Verde (Uni-CV), Campus de Palmarejo, Praia, Cape Verde (URL: https://www.facebook.com/pages/Observatorio-Vulcanologico-de-Cabo-Verde-OVCV/175875102444250); Hawai'i Institute of Geophysics and Planetology (HIGP), MODVOLC Thermal Alerts System, School of Ocean and Earth Science and Technology (SOEST), Univ. of Hawai'i, 2525 Correa Road, Honolulu, HI 96822, USA (URL: http://modis.higp.hawaii.edu/); NASA Earth Observatory, EOS Project Science Office, NASA Goddard Space Flight Center, Goddard, Maryland, USA (URL: http://earthobservatory.nasa.gov/); NASA Goddard Space Flight Center (NASA/GSFC), Global Sulfur Dioxide Monitoring Page, Atmospheric Chemistry and Dynamics Laboratory, 8800 Greenbelt Road, Goddard, Maryland, USA (URL: https://so2.gsfc.nasa.gov/); Google Earth (URL: https://www.google.com/earth/); The Observador (URL: http://observador.pt/2014/11/30/erupcoes-vulcanicas-da-ilha-fogo-evoluem-para-estado-critico/); Martin Rietze, Photographer (URL: http://www.mrietze.com/web13/Fogo_f14.htm).
Krakatau (Indonesia) — September 2017 Cite this Report
Krakatau
Indonesia
6.1009°S, 105.4233°E; summit elev. 285 m
All times are local (unless otherwise noted)
Eruption during 17-19 February 2017 sends large lava flow down the SE flank
The most recent reported eruptive activity from the Anak Krakatau cone was a pilot report of an ash plume on 31 March 2014 (BGVN 40:08). Monitoring reports by the Pusat Vulkanologi dan Mitigasi Bencana Geologi (PVMBG, also known as Indonesian Center for Volcanology and Geological Hazard Mitigation, CVGHM) from January 2014 through July 2015 only noted seismicity and fumarolic emissions.
The only indication of possible eruptive activity in the second half of 2015 through 2016 reported by PVMBG was a Volcano Observatory Notice for Aviation (VONA) on 20 June. The seismograph at the Anak Krakatau Volcano Observatory detected an eruption at 0551 local time (2251 UTC), but the eruption was not observed visually because of cloudy weather. There had been a swarm of volcanic earthquakes about one day earlier, and seismicity had significantly increased 3 hours before the eruption. After the eruption, seismicity gradually decreased. Although thermal anomalies were frequently recorded in 2016 (figure 36, bottom), they may have been a result of strong hot fumaroles at the summit dome; no PVMBG or tourist reports indicated active lava flows or ash plumes.
The PVMBG reported that seismicity was dominated by shallow volcanic earthquakes in February 2017. In a Volcano Observatory Notice for Aviation (VONA), the aviation color code was reported to be raised to Orange. Emission earthquakes increased beginning on 17 February and gradually formed continuous tremor. At 1535 on 17 February 2017 at 1535 infrared MODIS data recorded by MODVOLC measured a 2-pixel thermal alert from the Aqua satellite, and on 18 February 2017 at 0650 a 2-pixel thermal alert was measured from the Terra satellite. Satellite thermal anomalies identified by the MIROVA system showed a strong sequence of anomalies around this same time (figure 36, top). Harmonic tremor began to be recorded at 1810 on 19 February. Almost an hour later, at 1904, Strombolian explosions ejected incandescent material 200 m high.
O.L. Andersen, a professional photographer, visited Anak Krakatau 25-26 February 2017. The eruption earlier in the month had resulted in a new lava flow on the SE flank (figure 37) where the September 2012 lava flow was located. He observed that "The new layer of lava-flow is black, compared to the red color of the 2012 lava flow. The lava flow has cooled down since the material was deposited. Fresh volcanic blocks were also seen distributed on the SE, S, E flank of Krakatau." No eruptions of ash were observed by Andersen, but gas emissions were present. Further, Andersen noted "After having studied aerial views of the crater area (figure 38), it seems that the source vent of the new lava-flow, is the same vent (main, central vent) that was involved in the 2012 eruption. On the top of the vent, it now seems to be a lava-dome...."
A comparison of photos from October 2015 and February 2017 composed by Andersen showed the morphological changes during that time, including the new dome and lava flows (figure 39). Incandescence was obvious at night (figure 40) and from aerial observations of the lava dome Andersen noted that the area with incandescence was small, and that "the lava dome did not appear to be overly active." Andersen observed further that the "main crater and summit area today seem to be of a more complex and dynamic character than it was before the eruption of September 2012. From footage of 2010/2011 the main crater was seen to be broad and fairly deep. Now the main crater is filled with material, with two lava flows originating from this vent running down on the SW and E flanks. On the northern side of the summit an eruption vent is also clearly observed...."
Geologic Background. The renowned Krakatau (frequently mis-named as Krakatoa) volcano lies in the Sunda Strait between Java and Sumatra. Collapse of an older edifice, perhaps in 416 or 535 CE, formed a 7-km-wide caldera. Remnants of that volcano are preserved in Verlaten and Lang Islands; subsequently the Rakata, Danan, and Perbuwatan cones were formed, coalescing to create the pre-1883 Krakatau Island. Caldera collapse during the catastrophic 1883 eruption destroyed Danan and Perbuwatan, and left only a remnant of Rakata. This eruption caused more than 36,000 fatalities, most as a result of tsunamis that swept the adjacent coastlines of Sumatra and Java. Pyroclastic surges traveled 40 km across the Sunda Strait and reached the Sumatra coast. After a quiescence of less than a half century, the post-collapse cone of Anak Krakatau (Child of Krakatau) was constructed within the 1883 caldera at a point between the former Danan and Perbuwatan cones. Anak Krakatau has been the site of frequent eruptions since 1927.
Information Contacts: Øystein Lund Andersen (URL: http://www.oysteinlundandersen.com/krakatau-volcano/visit-to-anak-krakatau-volcano-february-2017/); Pusat Vulkanologi dan Mitigasi Bencana Geologi (PVMBG, also known as Indonesian Center for Volcanology and Geological Hazard Mitigation, CVGHM), Jalan Diponegoro 57, Bandung 40122, Indonesia (URL: http://www.vsi.esdm.go.id/); Hawai'i Institute of Geophysics and Planetology (HIGP) - MODVOLC Thermal Alerts System, School of Ocean and Earth Science and Technology (SOEST), Univ. of Hawai'i, 2525 Correa Road, Honolulu, HI 96822, USA (URL: http://modis.higp.hawaii.edu/); MIROVA (Middle InfraRed Observation of Volcanic Activity), a collaborative project between the Universities of Turin and Florence (Italy) supported by the Centre for Volcanic Risk of the Italian Civil Protection Department (URL: http://www.mirovaweb.it/).
Langila (Papua New Guinea) — September 2017 Cite this Report
Langila
Papua New Guinea
5.525°S, 148.42°E; summit elev. 1330 m
All times are local (unless otherwise noted)
Eruption continues, intensifying from mid-December 2016 through July 2017
Eruptive activity at Langila was intermittent during 2016, with ash plumes seen during April-May and November-December (BGVN 42:01); thermal anomalies were somewhat more commonly detected, but were also intermittent. No reports were available from the Rabaul Volcano Observatory during January-July 2017, but volcanic ash warnings were issued by the Darwin Volcanic Ash Advisory Centre (VAAC). Thermal anomaly data acquired by satellite-based MODIS instruments showed a strong increase in activity beginning in mid-December 2016 that was ongoing as of early August 2017.
Ash plumes were reported frequently during the first half of 2017 except during March and early April. The plumes rose to altitudes between 1.8 and 3 km (table 4). The aviation color code has remained at Orange (third highest of a four-step universal volcanic ash alert level system for aviation) throughout 2016 and through July 2017.
Table 4. Ash plumes from Langila reported during January-June 2017. Observations are based on analyses of satellite imagery and wind data; dates are based on local time. Courtesy of the Darwin VAAC.
| Date |
Max. Plume Altitude (km) |
Drift |
| 02 Jan 2017 |
2.1 |
NE |
| 05 Jan 2017 |
2.4 |
45 km W |
| 12-13, 15 Jan 2017 |
2.1 |
ESE and SE |
| 25-27 Jan 2017 |
1.8-3 |
NW and N |
| 17-18 Feb 2017 |
1.8 |
SE |
| 24 Feb 2017 |
2.4 |
N |
| 23-25 Apr 2017 |
2.1 |
55 km S and SE |
| 26 Apr 2017 |
2.1 |
E and NE |
| 02 May 2017 |
2.1 |
E and NE |
| 10-14 May 2017 |
1.8-2.4 |
N, NW, and S |
| 19 May 2017 |
4.6 |
~170 km WSW |
| 19-20 May 2017 |
1.8 |
N and NNW |
| 23 May 2017 |
2.1, 3 |
NW, SW |
| 24-27 May 2017 |
2.1-3 |
75-85 km W and NW |
| 01 Jun 2017 |
1.8 |
N and NW |
| 07 Jun 2017 |
2.1 |
45 km NW |
| 12 Jun 2017 |
1.8 |
WNW |
| 20 Jun 2017 |
2.1 |
NW |
| 21 Jun 2017 |
2.1 |
95 km NW |
Thermal alerts, based on MODIS satellite instruments analyzed using the MODVOLC algorithm, were identified often during December 2016 through June 2017. The MIROVA volcano hotspot detection system, also based on analysis of MODIS data, detected occasional anomalies from August 2016 through late December 2016 (BGVN 42:01), followed by more continuous anomalies through late July 2017 (figure 6). The most intense anomalies over this time period occurred from mid-April to early May 2017.
Geologic Background. Langila, one of the most active volcanoes of New Britain, consists of a group of four small overlapping composite basaltic-andesitic cones on the lower E flank of the extinct Talawe volcano in the Cape Gloucester area of NW New Britain. A rectangular, 2.5-km-long crater is breached widely to the SE; Langila was constructed NE of the breached crater of Talawe. An extensive lava field reaches the coast on the N and NE sides of Langila. Frequent mild-to-moderate explosive eruptions, sometimes accompanied by lava flows, have been recorded since the 19th century from three active craters at the summit. The youngest and smallest crater (no. 3 crater) was formed in 1960 and has a diameter of 150 m.
Information Contacts: Darwin Volcanic Ash Advisory Centre (VAAC), Bureau of Meteorology, Northern Territory Regional Office, PO Box 40050, Casuarina, NT 0811, Australia (URL: http://www.bom.gov.au/info/vaac/); Hawai'i Institute of Geophysics and Planetology (HIGP) - MODVOLC Thermal Alerts System, School of Ocean and Earth Science and Technology (SOEST), Univ. of Hawai'i, 2525 Correa Road, Honolulu, HI 96822, USA (URL: http://modis.higp.hawaii.edu/); MIROVA (Middle InfraRed Observation of Volcanic Activity), a collaborative project between the Universities of Turin and Florence (Italy) supported by the Centre for Volcanic Risk of the Italian Civil Protection Department (URL: http://www.mirovaweb.it/).
Masaya (Nicaragua) — September 2017 Cite this Report
Masaya
Nicaragua
11.9844°N, 86.1688°W; summit elev. 594 m
All times are local (unless otherwise noted)
Persistent lava lake and gas plume activity, with intermittent ash emission, through mid-July 2017
Masaya volcano near the Pacific Ocean in Nicaragua (figure 52) is one of the most active volcanos in that country. The period from October 2015 through August 2016 saw the re-emergence of the lava lake, increased seismic frequency and amplitude, intermittent explosive activity, and continued strong thermal anomalies from satellite and ground based sources as a result of the newly active lava lake. (BGVN 41:08). Thermal satellite data analyzed by MIROVA measured moderate volcanic radiative power beginning January 2016 and continuing regularly through August 2016. The Instituto Nicareguense de Estudios Territoriales (INETER), Sistema Nacional para la Prevencion, Mitigacion y Atencion de Desastres (SINAPRED), and the Washington Volcanic Ash Advisory Center (VAAC) monitor the volcano's activity and provide regular reports.
Ash and steam emissions have been reported by the Washington VAAC from satellite data from August 2016 through mid-July 2017, the latest on 13 May 2017 when both satellite images showed and a pilot observed a W-drifting ash emission from Masaya. Plumes with possible ash content were noted on 15 August, 28 August, and 3 November 2016. Plumes identified on 5 and 21 January 2017 were stated to have minor ash content. Monthly reports from INETER consistently noted ongoing gas emissions, lava lake activity, and variable seismicity.
Since August 2016, thermal anomalies recorded by MIROVA seemed nearly constant in power level and regularity until about May 2017, at which time both seemed to decrease slightly (figure 53). Since mid-May 2017, MODIS thermal satellite data processed by MODVOLC measured thermal alerts have decreased from nearly daily in July 2016 to 4-6/month through July 2017.
INETER reported that from 1 to 5 May 2017 fieldwork was conducted with scientists from the University of McGill (Canada) and the Volcanological and Seismological Observatory of Costa Rica (OVSICORI). Measurements of sulfur dioxide (SO2) in the plume emitted by the Santiago crater were carried out using the DOAS Mobile technique, and samples of hydrogen sulfide (H2S), hydrogen bromide (HBr) and bromine chloride (BrCl) were collected to be analyzed by ion chromatography at McGill (figures 54 and 55).
During the INETER field monitoring that took place on 22 May 2017, strong convection of the lake was observed, as were landslides on almost all of the walls. Fumaroles were seen that are possibly not new, but were active due to recent rainfall. The landslides on the W wall of the crater have been occurring since the end of February (figure 56). They are believed by INETER to be caused by undercutting of the walls by lava lake convection (figure 57).
References. Rymer, H., van Wyk de Vries, B., Stix, J., and Williams-Jones, G., 1998, Pit crater structure and processes governing persistent activity at Masaya Volcano, Nicaragua. Bull. Volcanol., v. 59, pp. 345-355.
Geologic Background. Masaya volcano in Nicaragua has erupted frequently since the time of the Spanish Conquistadors, when an active lava lake prompted attempts to extract the volcano's molten "gold" until it was found to be basalt rock upon cooling. It lies within the massive Pleistocene Las Sierras caldera and is itself a broad, 6 x 11 km basaltic caldera with steep-sided walls up to 300 m high. The caldera is filled on its NW end by more than a dozen vents that erupted along a circular, 4-km-diameter fracture system. The Nindirí and Masaya cones, the source of observed eruptions, were constructed at the southern end of the fracture system and contain multiple summit craters, including the currently active Santiago crater. A major basaltic Plinian tephra erupted from Masaya about 6,500 years ago. Recent lava flows cover much of the caldera floor and there is a lake at the far eastern end. A lava flow from the 1670 eruption overtopped the north caldera rim. Periods of long-term vigorous gas emission at roughly quarter-century intervals have caused health hazards and crop damage.
Information Contacts: Instituto Nicaragüense de Estudios Territoriales (INETER), Apartado Postal 2110, Managua, Nicaragua (URL: http://webserver2.ineter.gob.ni/vol/dep-vol.html); MIROVA (Middle InfraRed Observation of Volcanic Activity), a collaborative project between the Universities of Turin and Florence (Italy) supported by the Centre for Volcanic Risk of the Italian Civil Protection Department (URL: http://www.mirovaweb.it/); Hawai'i Institute of Geophysics and Planetology (HIGP) - MODVOLC Thermal Alerts System, School of Ocean and Earth Science and Technology (SOEST), Univ. of Hawai'i, 2525 Correa Road, Honolulu, HI 96822, USA (URL: http://modis.higp.hawaii.edu/); Washington Volcanic Ash Advisory Center (VAAC), Satellite Analysis Branch (SAB), NOAA/NESDIS OSPO, NOAA Science Center Room 401, 5200 Auth Rd, Camp Springs, MD 20746, USA (URL: http://www.ospo.noaa.gov/Products/atmosphere/vaac/, archive at: http://www.ssd.noaa.gov/VAAC/archive.html); Sistema Nacional para la Prevencion, Mitigacion y Atencion de Desastres, (SINAPRED), Edificio SINAPRED, Rotonda Comandante Hugo Chávez 50 metros al Norte, frente a la Avenida Bolívar, Managua, Nicaragua (URL: http://www.sinapred.gob.ni/).
Popocatepetl (Mexico) — September 2017 Cite this Report
Popocatepetl
Mexico
19.023°N, 98.622°W; summit elev. 5393 m
All times are local (unless otherwise noted)
Ongoing steam, gas, ash emissions, and lava dome growth and destruction, July 2016-July 2017
Frequent historical eruptions have occurred since pre-Columbian time at México's Popocatépetl. More recently, activity picked up in the mid-1990s after about 50 years of quiescence. The current eruption, which has been ongoing since January 2005, has included frequent ash plumes rising generally 1-4 km above the 5.4-km-elevation summit, and numerous episodes of lava-dome growth and destruction within the 500-m-wide summit caldera. Multiple emissions of steam and gas occur daily, many contain small amounts of ash. Larger, more explosive events that generate ashfall in neighboring communities usually occur every month or two. Information about Popocatépetl comes from daily reports provided by México's Centro Nacional de Prevención de Desastres (CENAPRED). Many ash emissions are also reported by the Washington Volcanic Ash Advisory Center (VAAC). Satellite visible and thermal imagery and SO2 data also provide important observations. Activity through June 2016 was typical of the ongoing eruption with near-constant emissions of water vapor, gas, and ash, and at least two episodes of dome growth and destruction (BGVN 42:07). This report covers similar activity through July 2017.
Activity at Popocatépetl during July 2016-July 2017 was typical of the ongoing eruption since 2005. Near constant steam-and-gas emissions often contained minor amounts of ash. Explosions with ash plumes occurred several times a week during most months. Incandescence at the summit was usually visible on clear nights; nighttime explosions revealed incandescent blocks travelling 100 m or more down the flanks. Large ash explosions on 25 and 26 November 2016 sent ash plumes to 11.5 and 10.9 km altitude, respectively. Ashfall was reported from communities within about 35 km on five different occasions. Thermal activity slowly increased during 2016 to high levels indicative of dome growth during December 2016 and January 2017; they diminished early in 2017 and then fluctuated through July 2017. Sulfur dioxide plumes were persistent in satellite data with plume densities generally exceeding two Dobson Units (DU) several times each month.
Activity during July-September 2016. Intermittent activity continued during July 2016. Tens of daily emissions of gas and steam were reported during the first and last weeks of the month; explosions with ash plumes also generally occurred daily during those weeks, and incandescence was visible on clear nights. The Washington VAAC reported ash emissions observed on 3 July at 7.9 km altitude drifting W, 2.5 km above the summit. Explosions on 4 July produced ash plumes that rose to 8.5 km altitude, just over 3 km above the crater and drifted WSW. Ashfall was reported in Atlatlahucan (30 km WSW) and Tepetlixpa (20 km W). Continuous ash emissions rising to just under 6 km altitude were seen in satellite imagery on 10 July extending almost 40 km W from the summit. Multiple daily explosions occurred during 24-26 July (figure 84). A small cloud of volcanic ash was centered about 35 km W of the summit early on 25 July at 5.8 km altitude. Later in the day, another plume was observed at 7 km altitude drifting WNW and then WSW before dissipating. Satellite imagery confirmed an ash emission on 30 July that rose to 6.7 km altitude and drifted W-WSW. MODVOLC thermal alerts were issued on 3, 10 (2) and 27 July. Small SO2 plumes were recorded daily by the Aura instrument on the OMI satellite. Most measured around two Dobson Units (DU) with an area of about 100,000 km2.
Tens of daily emissions were common during August 2016, some of which contained minor amounts of ash. Six landslides were detected by the seismic network on 11 August (figure 85). The two largest had volumes of 440 and 220 m3. The Washington VAAC reported an ash plume moving NW at 7.3 km altitude just after midnight on 1 August, extending about 35 km from the summit. A short while later, continuous emissions were reported extending up to 75 km W at 6.1 km altitude. By 0910 UTC, they extended 220 km WNW at 7.3 km altitude. The edge of the plume farthest from the summit had reached close to 500 km W by 1945 UTC when it was last observed. The webcam captured an emission on 11 August but it was not visible in satellite imagery due to weather clouds. An explosion on 12 August generated an ash plume that rose 2.5 km above the 5.4-km-high summit crater and drifted WNW, causing ashfall in Ozumba (18 km W) and Atlautla (16 km W). An explosion at 0034 on 13 August ejected incandescent material onto the flanks. An ash emission was seen in satellite imagery at 8.2 km altitude about 35 km W of the summit later in the morning. Another ash emission was observed with the webcam midday on 15 August that produced an ash plume that rose to 8.5 km altitude and drifted WSW. An ash plume on 21 August drifted W at 6.1 km altitude, and one on 28 August was observed in satellite imagery moving NNW below 7.3 km altitude. Two explosions on 27 August at 1505 and 1537, and one at 0559 on 28 August sent incandescent fragments down the flanks.
MODVOLC thermal alerts were issued on 1 (4), 3, 4, 11 (2), 13, and 29 August 2016. SO2 plumes were also captured daily by the Aura Instrument on the OMI satellite, with similar values to those recorded during July. During an overflight of Popocatépetl on 30 August 2016 CENAPRED scientists confirmed that explosions during 27-28 August had destroyed lava dome 69 (first identified on 1 August). The crater which had hosted the dome was 300 m in diameter and 30 m deep (figure 86).
Only one MODVOLC thermal alert was reported on 14 September 2016. SO2 emissions continued at similar levels to the previous months. Tens of daily steam-and-gas emissions were recorded and crater incandescence was visible on clear nights. An explosion on 8 September produced an ash plume that rose 1.5 km above the crater. On 11 September, an explosion generated a plume that rose 1 km, and an explosion that night ejected incandescent material onto the flanks. CENAPRED reported two volcanic ash emissions on 14 September that rose to 7.3 km. Weather clouds prevented satellite observations of the first, but the second one was observed extending 10 km W of the summit, and reached about 50 km before dissipating. Minor amounts of volcanic ash and steam on 23 September extended NW about 30 km from the summit at 5.5 km altitude. The Mexico City Meteorological Weather Office (MWO) reported volcanic ash at 7.3 km altitude on 29 September, but it was not observed in satellite imagery due to weather clouds.
Activity during October-December 2016. An increase in thermal activity was responsible for ten MODVOLC thermal alerts on 4, 7, 14, 16 (2), 20, 23, 27, 28, and 30 October 2016. Although near-constant steam-and-gas emissions continued, some with minor amounts of ash, there was only one observation of an ash plume from the Washington VAAC, on 28 October at 6.4 km altitude drifting SW. Sulfur dioxide emissions appeared to decrease in the Aura satellite data, although there were values measured over two DU at least four days of the month. Fewer ash emissions were reported during November 2016 as well, but ten MODVOLC thermal alerts were reported on 5, 14, 24, 25, 26 (2), 28, and 30 (3) November.
Ash emissions increased significantly during the last week of November. An ash plume at 5.5 km altitude was visible 55 km E of the summit on 24 November. A larger emission on 25 November was observed at 9.1 km altitude towering above the summit and drifting N (figure 87) with additional ash emissions at 7.3 km altitude drifting SE. Ashfall was reported from this event in areas downwind, including in the municipalities of Atlixco (25 km SE), Tochimilco (15 km SSE), and San Pedro Benito Juárez (12 km SE). Emissions were observed as high as 11.5 km altitude drifting NE later in the day; they continued drifting ENE at 7.9 km into the next day before dissipating 250 km from the summit. A new ash emission on 26 November rose to 10.9 km altitude. It was visible 300 km S of the summit while a second ash cloud was centered 150 km S at 5.2 km altitude. Later in the day, an ash emission was observed at 6.7 km drifting SW.
During 28-29 November 2016 there was another pulse of activity with 48 detected emissions. Beginning at 0559 on 28 November, water vapor, gas, and ash emissions became constant, rising as high as 1.5 km above the crater rim and drifting NE. Incandescent fragments were ejected 300-800 m from the crater, mainly onto the NE flank during the next night (figure 88). Ash fell in Atlixco, Chiautzingo (25 km NE), Domingo Arenas (22 km NE), Huejotzingo (27 km NE), Juan C. Bonilla (33 km NE), San Andrés Calpan (18 km NE), and San Martín Texmelucan (Puebla state, 35 km NNE), and in San Miguel (Tlaxcala state). Plumes from these emissions were reported on 29 November at 7.3 km altitude, and they drifted as far as 170 km NE; remnant ash was observed over the Gulf of Mexico on 30 November. Emission intensity increased again on 30 November and a new continuous plume at 6.4 km altitude extended 370 km NE before dissipating. At 1500 UTC on 30 November, a second higher plume was reported by the Washington VAAC at 9.3 km altitude centered 400 km NE of the summit. The continuous emissions became intermittent on 1 December; the last of the emissions dissipated about 200 km NE of the summit. A short puff noted on the webcam late on 1 December was the last VAAC report for 2016.
While ash emissions decreased during December 2016, steam-and-gas emissions continued, and thermal activity increased. MODVOLC alerts were reported 24 times on 17 different days. More substantial SO2 plumes than seen in previous months were also captured by the Aura satellite instrument on 8 and 31 December (figure 89). A new lava dome (71) first detected by CENAPRED on 29 and 30 November had almost completely filled the internal crater by 12 December (figure 90), reaching 280 m in diameter and 50 m thick. The volume of the dome was estimated to be about 3 million m3.
Activity during January-April 2017. Low-intensity steam-and-gas emissions continued during January 2017; incandescence was regularly observed at the summit. During January, only one emission was reported by the Washington VAAC, on 23 January at 7.6 km altitude drifting NW. They noted that the satellite imagery indicated the emission was mostly gas and water vapor with minor amounts of ash. Thermal activity continued to increase in January 2017 with 35 alerts reported on 26 days of the month. The increase in thermal activity was also visible in the MIROVA log radiative power information plotted from the MODIS thermal anomaly data (figure 91). SO2 plumes were also notable through 18 January, after which they decreased in both size and density in satellite data.
Ash emissions were reported on three days during February 2017. A plume on 7 February rose to 5.8 km altitude and drifted W, dissipating quickly. A plume on 12 February was reported at 6.1 km altitude drifting 10 km N of the summit. An ash emission was recorded on the CENAPRED webcam on 15 February (figure 92); it was seen in satellite imagery at 6.7 km altitude drifting NE, and dissipated after about six hours. Thermal activity decreased during February relative to January. MODVOLC only reported 16 thermal alerts on 11 days of the month.
Continued steam-and-gas emissions during March 2017 were accompanied by a few ash-bearing explosions. The webcam captured an ash emission on 8 March that the Washington VAAC observed in satellite imagery drifting N at 5.8 km altitude. Another emission late on 11 March rose to 6.1 km and drifted E; it contained mostly gas with only small amounts of ash. Late on 28 March, an ash cloud was observed in satellite imagery centered about 50 km ENE of the summit at 5.8 km altitude. Thermal activity continued to decrease with only ten MODVOLC thermal alerts issued on six different days during March.
Thermal alerts were fewer still during April 2017; one appeared on 6 April, and then a cluster of six were reported during 24-30 April. Ash emissions were reported by the Washington VAAC on 16, 20, 24, and 25 April. Constant emissions were seen by the webcam on 16 April; they likely contained ash, and were estimated to be at 6.1 km altitude. A small puff of ash was seen in satellite imagery on 20 April drifting S to about 35 km at the same altitude. Multiple emissions of ash mixed with steam and gas were observed in satellite imagery on 24 April moving SE at 5.6 km altitude. Constant steam-and-gas emissions continued throughout the month, with incandescence visible on clear nights. Tephra from explosions on 26 and 27 April was ejected 100 m NE of the crater.
Activity during May-July 2017. Thermal activity increased somewhat during May 2017. Seventeen MODVOLC alerts were reported on 13 different days. SO2 emissions with DU values greater than two occurred eight times during the month. Low intensity explosions with water vapor, gas, and ash emissions occurred daily throughout the month. On 18 May, the Washington VAAC reported an ash plume at 7.3 km altitude drifting N, and they observed a bright hotspot in shortwave imagery. Multiple emissions were later observed, with plumes rising to 7.6 km, moving NNE 70 km from the summit. A small puff of ash was seen in satellite imagery on 21 May at 7 km altitude approximately 25 km from the summit moving N. The leading edge of a new emission was observed the next day about 45 km SSW of the summit at 6.1 km altitude. An ash emission was observed on the CENAPRED webcam on 30 May, but weather clouds obscured any satellite observations.
MODVOLC thermal alerts were reported on 6, 16, 17, 18(3) and 21 June 2017. Observers noted material being ejected 200 m from the crater on 3 June. Cloud cover obscured satellite and webcam views of a reported ash plume on 12 June. A small ash emission was reported on 13 June 16 km W of the summit at 7.0 km altitude.
A series of ash emissions were reported by the Washington VAAC almost daily during 2-11 July 2017. A social media post by CENAPRED and a webcam image showed an ash emission (figure 93) on 2 July. It was observed by the Washington VAAC in satellite imagery moving SW at 6.7 km altitude. Minor ashfall on 2 July was also noted in Ozumba (18 km W), Amecameca (19 km NW), Tlalmanalco (26 km NW), Chalco (38 km NW), Ayapango (22 km NW), Tenango del Aire (28 km NW), and San Pedro Nexapa (14 km NW). An emission on 3 July was confirmed in visible satellite imagery drifting WNW at 6.7 km altitude. On 4 July, a plume was observed in satellite imagery 25 km NE of the summit at 7.6 km altitude. An ash emission observed in the webcam early on 6 July was not visible in satellite imagery due to weather clouds, but a larger emission that evening was spotted with difficulty at 7.6 km altitude, in spite of the weather clouds. CENAPRED reported that the plume was clearly visible nearly 2 km above the summit. The next day, clouds obscured the summit from the webcam, but an ash emission was clearly visible in satellite imagery at 7.6 km altitude moving NW. The webcam recorded additional emissions on 9 and 11 July; they were obscured from satellite images by weather clouds. A plume of mostly gas and steam with a small amount of ash near the summit extended 55 km W of the summit on 31 July at 6.4 km altitude.
MODVOLC thermal alerts were reported on 13-15, 21, 23 (2) and 28 July. Sulfur dioxide plumes with densities between one and two Dobson Units were captured by the Aura Instrument on the OMI satellite almost every day of the month.
Geologic Background. Volcán Popocatépetl, whose name is the Aztec word for smoking mountain, rises 70 km SE of Mexico City to form North America's 2nd-highest volcano. The glacier-clad stratovolcano contains a steep-walled, 400 x 600 m wide crater. The generally symmetrical volcano is modified by the sharp-peaked Ventorrillo on the NW, a remnant of an earlier volcano. At least three previous major cones were destroyed by gravitational failure during the Pleistocene, producing massive debris-avalanche deposits covering broad areas to the south. The modern volcano was constructed south of the late-Pleistocene to Holocene El Fraile cone. Three major Plinian eruptions, the most recent of which took place about 800 CE, have occurred since the mid-Holocene, accompanied by pyroclastic flows and voluminous lahars that swept basins below the volcano. Frequent historical eruptions, first recorded in Aztec codices, have occurred since Pre-Columbian time.
Information Contacts: Centro Nacional de Prevención de Desastres (CENAPRED), Av. Delfín Madrigal No.665. Coyoacan, México D.F. 04360, México (URL: http://www.cenapred.gob.mx/), Daily Report Archive (URL: https://www.gob.mx/cenapred/archivo/articulos?order=DESC&page=1); Washington Volcanic Ash Advisory Center (VAAC), Satellite Analysis Branch (SAB), NOAA/NESDIS OSPO, NOAA Science Center Room 401, 5200 Auth Rd, Camp Springs, MD 20746, USA (URL: http://www.ospo.noaa.gov/Products/atmosphere/vaac/, archive at: http://www.ssd.noaa.gov/VAAC/archive.html); Hawai'i Institute of Geophysics and Planetology (HIGP), MODVOLC Thermal Alerts System, School of Ocean and Earth Science and Technology (SOEST), Univ. of Hawai'i, 2525 Correa Road, Honolulu, HI 96822, USA (URL: http://modis.higp.hawaii.edu/); MIROVA (Middle InfraRed Observation of Volcanic Activity), a collaborative project between the Universities of Turin and Florence (Italy) supported by the Centre for Volcanic Risk of the Italian Civil Protection Department (URL: http://www.mirovaweb.it/); NASA Goddard Space Flight Center (NASA/GSFC), Global Sulfur Dioxide Monitoring Page, Atmospheric Chemistry and Dynamics Laboratory, 8800 Greenbelt Road, Goddard, Maryland, USA (URL: https://so2.gsfc.nasa.gov/).
Sangeang Api (Indonesia) — September 2017 Cite this Report
Sangeang Api
Indonesia
8.2°S, 119.07°E; summit elev. 1912 m
All times are local (unless otherwise noted)
Weak Strombolian activity and occasional weak ash plumes, 15 July-12 August 2017
Strong explosions at Sangeang Api on 30-31 May 2014 generated ash plumes that rose as high as 15 km altitude, followed by less intense activity that produced ash plumes during the first half of June 2014 and 1 July-1 November 2015 (BGVN 41:10). No further activity was reported by the Pusat Vulkanologi dan Mitigasi Bencana Geologi (PVMBG) and Darwin Volcanic Ash Advisory Centre (VAAC) until June 2017.
The MIROVA (Middle InfraRed Observation of Volcanic Activity) system detected thermal anomalies in MODIS satellite data near the summit during the second week of January 2017, when four were recorded (figure 16). The number increased significantly beginning with the latter half of February. Another increase in the number and power of the anomalies took place at the beginning of June 2017 and continued into mid-August.
Thermal anomalies identified using the MODVOLC algorithm were first recorded on 25 February 2017. Over the same time period as the MIROVA data, through 11 August, there were 105 thermal alerts. Cumulatively, the locations of the alert pixels define an area extending from the summit crater to about 2.5 km down the E flank (figure 17).
According to PVMBG, a small Strombolian eruption at 1154 on 15 July 2017 generated an ash plume that rose 100-200 m above the crater rim and drifted SW. Seismicity had increased starting in April. Based on analyses of satellite imagery, PVMBG observations, and wind data, the Darwin VAAC reported that on 16 July an ash plume rose to an altitude of 2.1 km, or 200 m above the crater rim, and drifted NW. The Darwin VAAC also reported ash plumes to altitudes of 2.4-4.3 km on 19-20 July, 29-30 July, 7-8 August, and 12 August 2017; in most cases they drifted NW.
Geologic Background. Sangeang Api volcano, one of the most active in the Lesser Sunda Islands, forms a small 13-km-wide island off the NE coast of Sumbawa Island. Two large trachybasaltic-to-tranchyandesitic volcanic cones, Doro Api and Doro Mantoi, were constructed in the center and on the eastern rim, respectively, of an older, largely obscured caldera. Flank vents occur on the south side of Doro Mantoi and near the northern coast. Intermittent eruptions have been recorded since 1512, most of them during in the 20th century.
Information Contacts: Pusat Vulkanologi dan Mitigasi Bencana Geologi (PVMBG, also known as Indonesian Center for Volcanology and Geological Hazard Mitigation, CVGHM), Jalan Diponegoro 57, Bandung 40122, Indonesia (URL: http://www.vsi.esdm.go.id/); Darwin Volcanic Ash Advisory Centre (VAAC), Bureau of Meteorology, Northern Territory Regional Office, PO Box 40050, Casuarina, NT 0811, Australia (URL: http://www.bom.gov.au/info/vaac/); Hawai'i Institute of Geophysics and Planetology (HIGP) - MODVOLC Thermal Alerts System, School of Ocean and Earth Science and Technology (SOEST), Univ. of Hawai'i, 2525 Correa Road, Honolulu, HI 96822, USA (URL: http://modis.higp.hawaii.edu/); MIROVA (Middle InfraRed Observation of Volcanic Activity), a collaborative project between the Universities of Turin and Florence (Italy) supported by the Centre for Volcanic Risk of the Italian Civil Protection Department (URL: http://www.mirovaweb.it/).