Recently Published Bulletin Reports
Manam (Papua New Guinea) Few ash plumes during November-December 2022
Krakatau (Indonesia) Strombolian activity and ash plumes during November 2022-April 2023
Stromboli (Italy) Strombolian explosions and lava flows continue during January-April 2023
Nishinoshima (Japan) Small ash plumes and fumarolic activity during November 2022 through April 2023
Karangetang (Indonesia) Lava flows, incandescent avalanches, and ash plumes during January-June 2023
Ahyi (United States) Intermittent hydroacoustic signals and discolored plumes during November 2022-June 2023
Kadovar (Papua New Guinea) An ash plume and weak thermal anomaly during May 2023
San Miguel (El Salvador) Small gas-and-ash explosions during March and May 2023
Semisopochnoi (United States) Occasional explosions, ash deposits, and gas-and-steam plumes during December 2022-May 2023
Ebeko (Russia) Continued explosions, ash plumes, and ashfall during October 2022-May 2023
Home Reef (Tonga) Discolored plumes continued during November 2022-April 2023
Ambae (Vanuatu) New lava flow, ash plumes, and sulfur dioxide plumes during February-May 2023
Manam (Papua New Guinea) — July 2023  Cite this Report
Manam
Papua New Guinea
4.08°S, 145.037°E; summit elev. 1807 m
All times are local (unless otherwise noted)
Few ash plumes during November-December 2022
Manam is a 10-km-wide island that consists of two active summit craters: the Main summit crater and the South summit crater and is located 13 km off the northern coast of mainland Papua New Guinea. Frequent mild-to-moderate eruptions have been recorded since 1616. The current eruption period began during June 2014 and has more recently been characterized by intermittent ash plumes and thermal activity (BGVN 47:11). This report updates activity that occurred from November 2022 through May 2023 based on information from the Darwin Volcanic Ash Advisory Center (VAAC) and various satellite data.
Ash plumes were reported during November and December 2022 by the Darwin VAAC. On 7 November an ash plume rose to 2.1 km altitude and drifted NE based on satellite images and weather models. On 14 November an ash plume rose to 2.1 km altitude and drifted W based on RVO webcam images. On 20 November ash plumes rose to 1.8 km altitude and drifted NW. On 26 December an ash plume rose to 3 km altitude and drifted S and SSE.
Intermittent sulfur dioxide plumes were detected using the TROPOMI instrument on the Sentinel-5P satellite, some of which exceeded at least two Dobson Units (DU) and drifted in different directions (figure 93). Occasional low-to-moderate power thermal anomalies were recorded by the MIROVA (Middle InfraRed Observation of Volcanic Activity) system; less than five anomalies were recorded each month during November 2022 through May 2023 (figure 94). Two thermal hotspots were detected by the MODVOLC thermal alerts system on 10 December 2022. On clear weather days, thermal activity was also captured in infrared satellite imagery in both the Main and South summit craters, accompanied by gas-and-steam emissions (figure 95).
Geologic Background. The 10-km-wide island of Manam, lying 13 km off the northern coast of mainland Papua New Guinea, is one of the country's most active volcanoes. Four large radial valleys extend from the unvegetated summit of the conical basaltic-andesitic stratovolcano to its lower flanks. These valleys channel lava flows and pyroclastic avalanches that have sometimes reached the coast. Five small satellitic centers are located near the island's shoreline on the northern, southern, and western sides. Two summit craters are present; both are active, although most observed eruptions have originated from the southern crater, concentrating eruptive products during much of the past century into the SE valley. Frequent eruptions, typically of mild-to-moderate scale, have been recorded since 1616. Occasional larger eruptions have produced pyroclastic flows and lava flows that reached flat-lying coastal areas and entered the sea, sometimes impacting populated areas.
Information Contacts: Rabaul Volcano Observatory (RVO), Geohazards Management Division, Department of Mineral Policy and Geohazards Management (DMPGM), PO Box 3386, Kokopo, East New Britain Province, Papua New Guinea; Darwin Volcanic Ash Advisory Centre (VAAC), Bureau of Meteorology, Northern Territory Regional Office, PO Box 40050, Casuarina, NT 0811, Australia (URL: http://www.bom.gov.au/info/vaac/); MIROVA (Middle InfraRed Observation of Volcanic Activity), a collaborative project between the Universities of Turin and Florence (Italy) supported by the Centre for Volcanic Risk of the Italian Civil Protection Department (URL: http://www.mirovaweb.it/); Hawai'i Institute of Geophysics and Planetology (HIGP) - MODVOLC Thermal Alerts System, School of Ocean and Earth Science and Technology (SOEST), Univ. of Hawai'i, 2525 Correa Road, Honolulu, HI 96822, USA (URL: http://modis.higp.hawaii.edu/); NASA Global Sulfur Dioxide Monitoring Page, Atmospheric Chemistry and Dynamics Laboratory, NASA Goddard Space Flight Center (NASA/GSFC), 8800 Greenbelt Road, Goddard, Maryland, USA (URL: https://so2.gsfc.nasa.gov/); Copernicus Browser, Copernicus Data Space Ecosystem, European Space Agency (URL: https://dataspace.copernicus.eu/browser/).
Krakatau (Indonesia) — July 2023 Cite this Report
Krakatau
Indonesia
6.1009°S, 105.4233°E; summit elev. 285 m
All times are local (unless otherwise noted)
Strombolian activity and ash plumes during November 2022-April 2023
Krakatau is located in the Sunda Strait between Java and Sumatra, Indonesia. Caldera collapse during the catastrophic 1883 eruption destroyed Danan and Perbuwatan cones and left only a remnant of Rakata. The post-collapse cone of Anak Krakatau (Child of Krakatau) was constructed within the 1883 caldera at a point between the former Danan and Perbuwatan cones; it has been the site of frequent eruptions since 1927. The current eruption period began in May 2021 and has recently consisted of explosions, ash plumes, and thermal activity (BGVN 47:11). This report covers activity during November 2022 through April 2023 based on information provided by the Indonesian Center for Volcanology and Geological Hazard Mitigation, referred to as Pusat Vulkanologi dan Mitigasi Bencana Geologi (PVMBG), MAGMA Indonesia, the Darwin Volcanic Ash Advisory Center (VAAC), and several sources of satellite data.
Activity was relatively low during November and December 2022. Daily white gas-and-steam plumes rose 25-100 m above the summit and drifted in different directions. Gray ash plumes rose 200 m above the summit and drifted NE at 1047 and at 2343 on 11 November. On 14 November at 0933 ash plumes rose 300 m above the summit and drifted E. An ash plume was reported at 0935 on 15 December that rose 100 m above the summit and drifted NE. An eruptive event at 1031 later that day generated an ash plume that rose 700 m above the summit and drifted NE. A gray ash plume at 1910 rose 100 m above the summit and drifted E. Incandescent material was ejected above the vent based on an image taken at 1936.
During January 2023 daily white gas-and-steam plumes rose 25-300 m above the summit and drifted in multiple directions. Gray-to-brown ash plumes were reported at 1638 on 3 January, at 1410 and 1509 on 4 January, and at 0013 on 5 January that rose 100-750 m above the summit and drifted NE and E; the gray-to-black ash plume at 1509 on 4 January rose as high as 3 km above the summit and drifted E. Gray ash plumes were recorded at 1754, 2241, and 2325 on 11 January and at 0046 on 12 January and rose 200-300 m above the summit and drifted NE. Toward the end of January, PVMBG reported that activity had intensified; Strombolian activity was visible in webcam images taken at 0041, 0043, and 0450 on 23 January. Multiple gray ash plumes throughout the day rose 200-500 m above the summit and drifted E and SE (figure 135). Webcam images showed progressively intensifying Strombolian activity at 1919, 1958, and 2113 on 24 January; a gray ash plume at 1957 rose 300 m above the summit and drifted E (figure 135). Eruptive events at 0231 and 2256 on 25 January and at 0003 on 26 January ejected incandescent material from the vent, based on webcam images. Gray ash plumes observed during 26-27 January rose 300-500 m above the summit and drifted NE, E, and SE.
Low levels of activity were reported during February and March. Daily white gas-and-steam plumes rose 25-300 m above the summit and drifted in different directions. The Darwin VAAC reported that continuous ash emissions rose to 1.5-1.8 km altitude and drifted W and NW during 1240-1300 on 10 March, based on satellite images, weather models, and PVMBG webcams. White-and-gray ash plumes rose 500 m and 300 m above the summit and drifted SW at 1446 and 1846 on 18 March, respectively. An eruptive event was recorded at 2143, though it was not visible due to darkness. Multiple ash plumes were reported during 27-29 March that rose as high as 2.5 km above the summit and drifted NE, W, and SW (figure 136). Webcam images captured incandescent ejecta above the vent at 0415 and around the summit area at 2003 on 28 March and at 0047 above the vent on 29 March.
Daily white gas-and-steam plumes rose 25-300 m above the summit and drifted in multiple directions during April and May. White-and-gray and black plumes rose 50-300 m above the summit on 2 and 9 April. On 11 May at 1241 a gray ash plume rose 1-3 km above the summit and drifted SW. On 12 May at 0920 a gray ash plume rose 2.5 km above the summit and drifted SW and at 2320 an ash plume rose 1.5 km above the summit and drifted SW. An accompanying webcam image showed incandescent ejecta. On 13 May at 0710 a gray ash plume rose 2 km above the summit and drifted SW (figure 137).
The MIROVA (Middle InfraRed Observation of Volcanic Activity) graph of MODIS thermal anomaly data showed intermittent low-to-moderate power thermal anomalies during November 2022 through April 2023 (figure 138). Some of this thermal activity was also visible in infrared satellite imagery at the crater, accompanied by gas-and-steam and ash plumes that drifted in different directions (figure 139).
Geologic Background. The renowned Krakatau (frequently mis-named as Krakatoa) volcano lies in the Sunda Strait between Java and Sumatra. Collapse of an older edifice, perhaps in 416 or 535 CE, formed a 7-km-wide caldera. Remnants of that volcano are preserved in Verlaten and Lang Islands; subsequently the Rakata, Danan, and Perbuwatan cones were formed, coalescing to create the pre-1883 Krakatau Island. Caldera collapse during the catastrophic 1883 eruption destroyed Danan and Perbuwatan, and left only a remnant of Rakata. This eruption caused more than 36,000 fatalities, most as a result of tsunamis that swept the adjacent coastlines of Sumatra and Java. Pyroclastic surges traveled 40 km across the Sunda Strait and reached the Sumatra coast. After a quiescence of less than a half century, the post-collapse cone of Anak Krakatau (Child of Krakatau) was constructed within the 1883 caldera at a point between the former Danan and Perbuwatan cones. Anak Krakatau has been the site of frequent eruptions since 1927.
Information Contacts: Pusat Vulkanologi dan Mitigasi Bencana Geologi (PVMBG, also known as Indonesian Center for Volcanology and Geological Hazard Mitigation, CVGHM), Jalan Diponegoro 57, Bandung 40122, Indonesia (URL: http://www.vsi.esdm.go.id/); MAGMA Indonesia, Kementerian Energi dan Sumber Daya Mineral (URL: https://magma.esdm.go.id/v1); Darwin Volcanic Ash Advisory Centre (VAAC), Bureau of Meteorology, Northern Territory Regional Office, PO Box 40050, Casuarina, NT 0811, Australia (URL: http://www.bom.gov.au/info/vaac/); MIROVA (Middle InfraRed Observation of Volcanic Activity), a collaborative project between the Universities of Turin and Florence (Italy) supported by the Centre for Volcanic Risk of the Italian Civil Protection Department (URL: http://www.mirovaweb.it/); Copernicus Browser, Copernicus Data Space Ecosystem, European Space Agency (URL: https://dataspace.copernicus.eu/browser/).
Stromboli
Italy
38.789°N, 15.213°E; summit elev. 924 m
All times are local (unless otherwise noted)
Strombolian explosions and lava flows continue during January-April 2023
Stromboli, located in Italy, has exhibited nearly constant lava fountains for the past 2,000 years; recorded eruptions date back to 350 BCE. Eruptive activity occurs at the summit from multiple vents, which include a north crater area (N area) and a central-southern crater (CS area) on a terrace known as the ‘terrazza craterica’ at the head of the Sciara del Fuoco, a large scarp that runs from the summit down the NW side of the volcano-island. Activity typically consists of Strombolian explosions, incandescent ejecta, lava flows, and pyroclastic flows. Thermal and visual monitoring cameras are located on the nearby Pizzo Sopra La Fossa, above the terrazza craterica, and at multiple flank locations. The current eruption period has been ongoing since 1934 and recent activity has consisted of frequent Strombolian explosions and lava flows (BGVN 48:02). This report updates activity during January through April 2023 primarily characterized by Strombolian explosions and lava flows based on reports from Italy's Istituto Nazionale di Geofisica e Vulcanologia (INGV) and various satellite data.
Frequent explosive activity continued throughout the reporting period, generally in the low-to-medium range, based on the number of hourly explosions in the summit crater (figure 253, table 16). Intermittent thermal activity was recorded by the MIROVA (Middle InfraRed Observation of Volcanic Activity) analysis of MODIS satellite data (figure 254). According to data collected by the MODVOLC thermal algorithm, a total of 9 thermal alerts were detected: one on 2 January 2023, one on 1 February, five on 24 March, and two on 26 March. The stronger pulses of thermal activity likely reflected lava flow events. Infrared satellite imagery captured relatively strong thermal hotspots at the two active summit craters on clear weather days, showing an especially strong event on 8 March (figure 255).
Table 16. Summary of type, frequency, and intensity of explosive activity at Stromboli by month during January-April 2023; information from webcam observations. Courtesy of INGV weekly reports.
| Month |
Explosive Activity |
| Jan 2023 |
Typical Strombolian activity with spattering and lava overflows in the N crater area. Explosions were reported from 4 vents in the N area and 1-2 vents in the CS area. The average hourly frequency of explosions was low-to-medium (1-12 events/hour). The intensity of the explosions varied from low (less than 80 m high) to medium (less than 150 m high) in the N crater area and up to high (greater than 150 m high) in the CS crater area. |
| Feb 2023 |
Typical Strombolian activity with spattering in the N crater area. Explosions were reported from 2-3 vents in the N area and 1-4 vents in the CS area. The average hourly frequency of explosions was low-to-medium (1-14 events/hour). The intensity of the explosions varied from low (less than 80 m high) to medium (less than 150 m high) in the N crater area and up to high (greater than 150 m high) in the CS crater area. |
| Mar 2023 |
Typical Strombolian activity with spattering and lava overflows in the N crater area. Explosions were reported from 2-3 vents in the N area and 2-4 vents in the CS area. The average hourly frequency of explosions was low-to-medium (1-18 events/hour). The intensity of the explosions varied from low (less than 80 m high) to medium (less than 150 m high) in the N crater area and up to high (greater than 150 m high) in the CS crater area. |
| Apr 2023 |
Typical Strombolian activity. Explosions were reported from 2 vents in the N area and 2-3 vents in the CS area. The average hourly frequency of explosions was low-to-high (1-16 events/hour). The intensity of the explosions varied from low (less than 80 m high) to medium (less than 150 m high) in both the N and CS crater areas. |
Activity during January-February 2023. Strombolian explosions were reported in the N crater area, as well as lava effusion. Explosive activity in the N crater area ejected coarse material (bombs and lapilli). Intense spattering was observed in both the N1 and N2 craters. In the CS crater area, explosions generally ejected fine material (ash), sometimes to heights greater than 250 m. The intensity of the explosions was characterized as low-to-medium in the N crater and medium-to-high in the CS crater. After intense spattering activity from the N crater area, a lava overflow began at 2136 on 2 January that flowed part way down the Sciara del Fuoco, possibly moving down the drainage that formed in October, out of view from webcams. The flow remained active for a couple of hours before stopping and beginning to cool. A second lava flow was reported at 0224 on 4 January that similarly remained active for a few hours before stopping and cooling. Intense spattering was observed on 11 and 13 January from the N1 crater. After intense spattering activity at the N2 crater at 1052 on 17 January another lava flow started to flow into the upper part of the Sciara del Fuoco (figure 256), dividing into two: one that traveled in the direction of the drainage formed in October, and the other one moving parallel to the point of emission. By the afternoon, the rate of the flow began to decrease, and at 1900 it started to cool. A lava flow was reported at 1519 on 24 January following intense spattering in the N2 area, which began to flow into the upper part of the Sciara del Fuoco. By the morning of 25 January, the lava flow had begun to cool. During 27 January the frequency of eruption in the CS crater area increased to 6-7 events/hour compared to the typical 1-7 events/hour; the following two days showed a decrease in frequency to less than 1 event/hour. Starting at 1007 on 30 January a high-energy explosive sequence was produced by vents in the CS crater area. The sequence began with an initial energetic pulse that lasted 45 seconds, ejecting predominantly coarse products 300 m above the crater that fell in an ESE direction. Subsequent and less intense explosions ejected material 100 m above the crater. The total duration of this event lasted approximately two minutes. During 31 January through 6, 13, and 24 February spattering activity was particularly intense for short periods in the N2 crater.
An explosive sequence was reported on 16 February that was characterized by a major explosion in the CS crater area (figure 257). The sequence began at 1817 near the S2 crater that ejected material radially. A few seconds later, lava fountains were observed in the central part of the crater. Three explosions of medium intensity (material was ejected less than 150 m high) were recorded at the S2 crater. The first part of this sequence lasted approximately one minute, according to INGV, and material rose 300 m above the crater and then was deposited along the Sciara del Fuoco. The second phase began at 1818 at the S1 crater; it lasted seven seconds and material was ejected 150 m above the crater. Another event 20 seconds later lasted 12 seconds, also ejecting material 150 m above the crater. The sequence ended with at least three explosions of mostly fine material from the S1 crater. The total duration of this sequence was about two minutes.
Short, intense spattering activity was noted above the N1 crater on 27 and 28 February. A lava overflow was first reported at 0657 from the N2 crater on 27 February that flowed into the October 2022 drainage. By 1900 the flow had stopped. A second lava overflow also in the N crater area occurred at 2149, which overlapped the first flow and then stopped by 0150 on 28 February. Material detached from both the lava overflows rolled down the Sciara del Fuoco, some of which was visible in webcam images.
Activity during March-April 2023. Strombolian activity continued with spattering activity and lava overflows in the N crater area during March. Explosive activity at the N crater area varied from low (less than 80 m high) to medium (less than 150 m high) and ejected coarse material, such as bombs and lapilli. Spattering was observed above the N1 crater, while explosive activity at the CS crater area varied from medium to high (greater than 150 m high) and ejected coarse material. Intense spattering activity was observed for short periods on 6 March above the N1 crater. At approximately 0610 a lava overflow was reported around the N2 crater on 8 March, which then flowed into the October 2022 drainage. By 1700 the flow started to cool. A second overflow began at 1712 on 9 March and overlapped the previous flow. It had stopped by 2100. Material from both flows was deposited along the Sciara del Fuoco, though much of the activity was not visible in webcam images. On 11 March a lava overflow was observed at 0215 that overlapped the two previous flows in the October 2022 drainage. By late afternoon on 12 March, it had stopped.
During a field excursion on 16 March, scientists noted that a vent in the central crater area was degassing. Another vent showed occasional Strombolian activity that emitted ash and lapilli. During 1200-1430 low-to-medium intense activity was reported; the N1 crater emitted ash emissions and the N2 crater emitted both ash and coarse material. Some explosions also occurred in the CS crater area that ejected coarse material. The C crater in the CS crater area occasionally showed gas jetting and low intensity explosions on 17 and 22 March; no activity was observed at the S1 crater. Intense, longer periods of spattering were reported in the N1 crater on 19, 24, and 25 March. Around 2242 on 23 March a lava overflow began from the N1 crater that, after about an hour, began moving down the October 2022 drainage and flow along the Sciara del Fuoco (figure 258). Between 0200 and 0400 on 26 March the flow rate increased, which generated avalanches of material from collapses at the advancing flow front. By early afternoon, the flow began to cool. On 25 March at 1548 an explosive sequence began from one of the vents at S2 in the CS crater area (figure 258). Fine ash mixed with coarse material was ejected 300 m above the crater rim and drifted SSE. Some modest explosions around Vent C were detected at 1549 on 25 March, which included an explosion at 1551 that ejected coarse material. The entire explosive sequence lasted approximately three minutes.
During April explosions persisted in both the N and CS crater areas. Fine material was ejected less than 80 m above the N crater rim until 6 April, followed by ejection of coarser material. Fine material was also ejected less than 80 m above the CS crater rim. The C and S2 crater did not show significant eruptive activity. On 7 April an explosive sequence was detected in the CS crater area at 1203 (figure 259). The first explosion lasted approximately 18 seconds and ejected material 400 m above the crater rim, depositing pyroclastic material in the upper part of the Sciara del Fuoco. At 1204 a second, less intense explosion lasted approximately four seconds and deposited pyroclastic products outside the crater area and near Pizzo Sopra La Fossa. A third explosion at 1205 was mainly composed of ash that rose about 150 m above the crater and lasted roughly 20 seconds. A fourth explosion occurred at 1205 about 28 seconds after the third explosion and ejected a mixture of coarse and fine material about 200 m above the crater; the explosion lasted roughly seven seconds. Overall, the entire explosive sequence lasted about two minutes and 20 seconds. After the explosive sequence on 7 April, explosions in both the N and CS crater areas ejected material as high as 150 m above the crater.
On 21 April research scientists from INGV made field observations in the summit area of Stromboli, and some lapilli samples were collected. In the N crater area near the N1 crater, a small cone was observed with at least two active vents, one of which was characterized by Strombolian explosions. The other vent produced explosions that ejected ash and chunks of cooled lava. At the N2 crater at least one vent was active and frequently emitted ash. In the CS crater area, a small cone contained 2-3 degassing vents and a smaller, possible fissure area also showed signs of degassing close to the Pizzo Sopra La Fossa. In the S part of the crater, three vents were active: a small hornito was characterized by modest and rare explosions, a vent that intermittently produced weak Strombolian explosions, and a vent at the end of the terrace that produced frequent ash emissions. Near the S1 crater there was a hornito that generally emitted weak gas-and-steam emissions, sometimes associated with “gas rings”. On 22 April another field inspection was carried out that reported two large sliding surfaces on the Sciara del Fuoco that showed where blocks frequently descended toward the sea. A thermal anomaly was detected at 0150 on 29 April.
Geologic Background. Spectacular incandescent nighttime explosions at Stromboli have long attracted visitors to the "Lighthouse of the Mediterranean" in the NE Aeolian Islands. This volcano has lent its name to the frequent mild explosive activity that has characterized its eruptions throughout much of historical time. The small island is the emergent summit of a volcano that grew in two main eruptive cycles, the last of which formed the western portion of the island. The Neostromboli eruptive period took place between about 13,000 and 5,000 years ago. The active summit vents are located at the head of the Sciara del Fuoco, a prominent scarp that formed about 5,000 years ago due to a series of slope failures which extends to below sea level. The modern volcano has been constructed within this scarp, which funnels pyroclastic ejecta and lava flows to the NW. Essentially continuous mild Strombolian explosions, sometimes accompanied by lava flows, have been recorded for more than a millennium.
Information Contacts: Istituto Nazionale di Geofisica e Vulcanologia (INGV), Sezione di Catania, Piazza Roma 2, 95123 Catania, Italy, (URL: http://www.ct.ingv.it/en/); MIROVA (Middle InfraRed Observation of Volcanic Activity), a collaborative project between the Universities of Turin and Florence (Italy) supported by the Centre for Volcanic Risk of the Italian Civil Protection Department (URL: http://www.mirovaweb.it/); Hawai'i Institute of Geophysics and Planetology (HIGP) - MODVOLC Thermal Alerts System, School of Ocean and Earth Science and Technology (SOEST), Univ. of Hawai'i, 2525 Correa Road, Honolulu, HI 96822, USA (URL: http://modis.higp.hawaii.edu/); Copernicus Browser, Copernicus Data Space Ecosystem, European Space Agency (URL: https://dataspace.copernicus.eu/browser/).
Nishinoshima (Japan) — July 2023 Cite this Report
Nishinoshima
Japan
27.247°N, 140.874°E; summit elev. 100 m
All times are local (unless otherwise noted)
Small ash plumes and fumarolic activity during November 2022 through April 2023
Nishinoshima is a small island located about 1,000 km S of Tokyo in the Ogasawara Arc in Japan. The island is the summit of a massive submarine volcano that has prominent peaks to the S, W, and NE. Eruptions date back to 1973; the most recent eruption period began in October 2022 and was characterized by ash plumes and fumarolic activity (BGVN 47:12). This report describes ash plumes and fumarolic activity during November 2022 through April 2023 based on monthly reports from the Japan Meteorological Agency (JMA) monthly reports and satellite data.
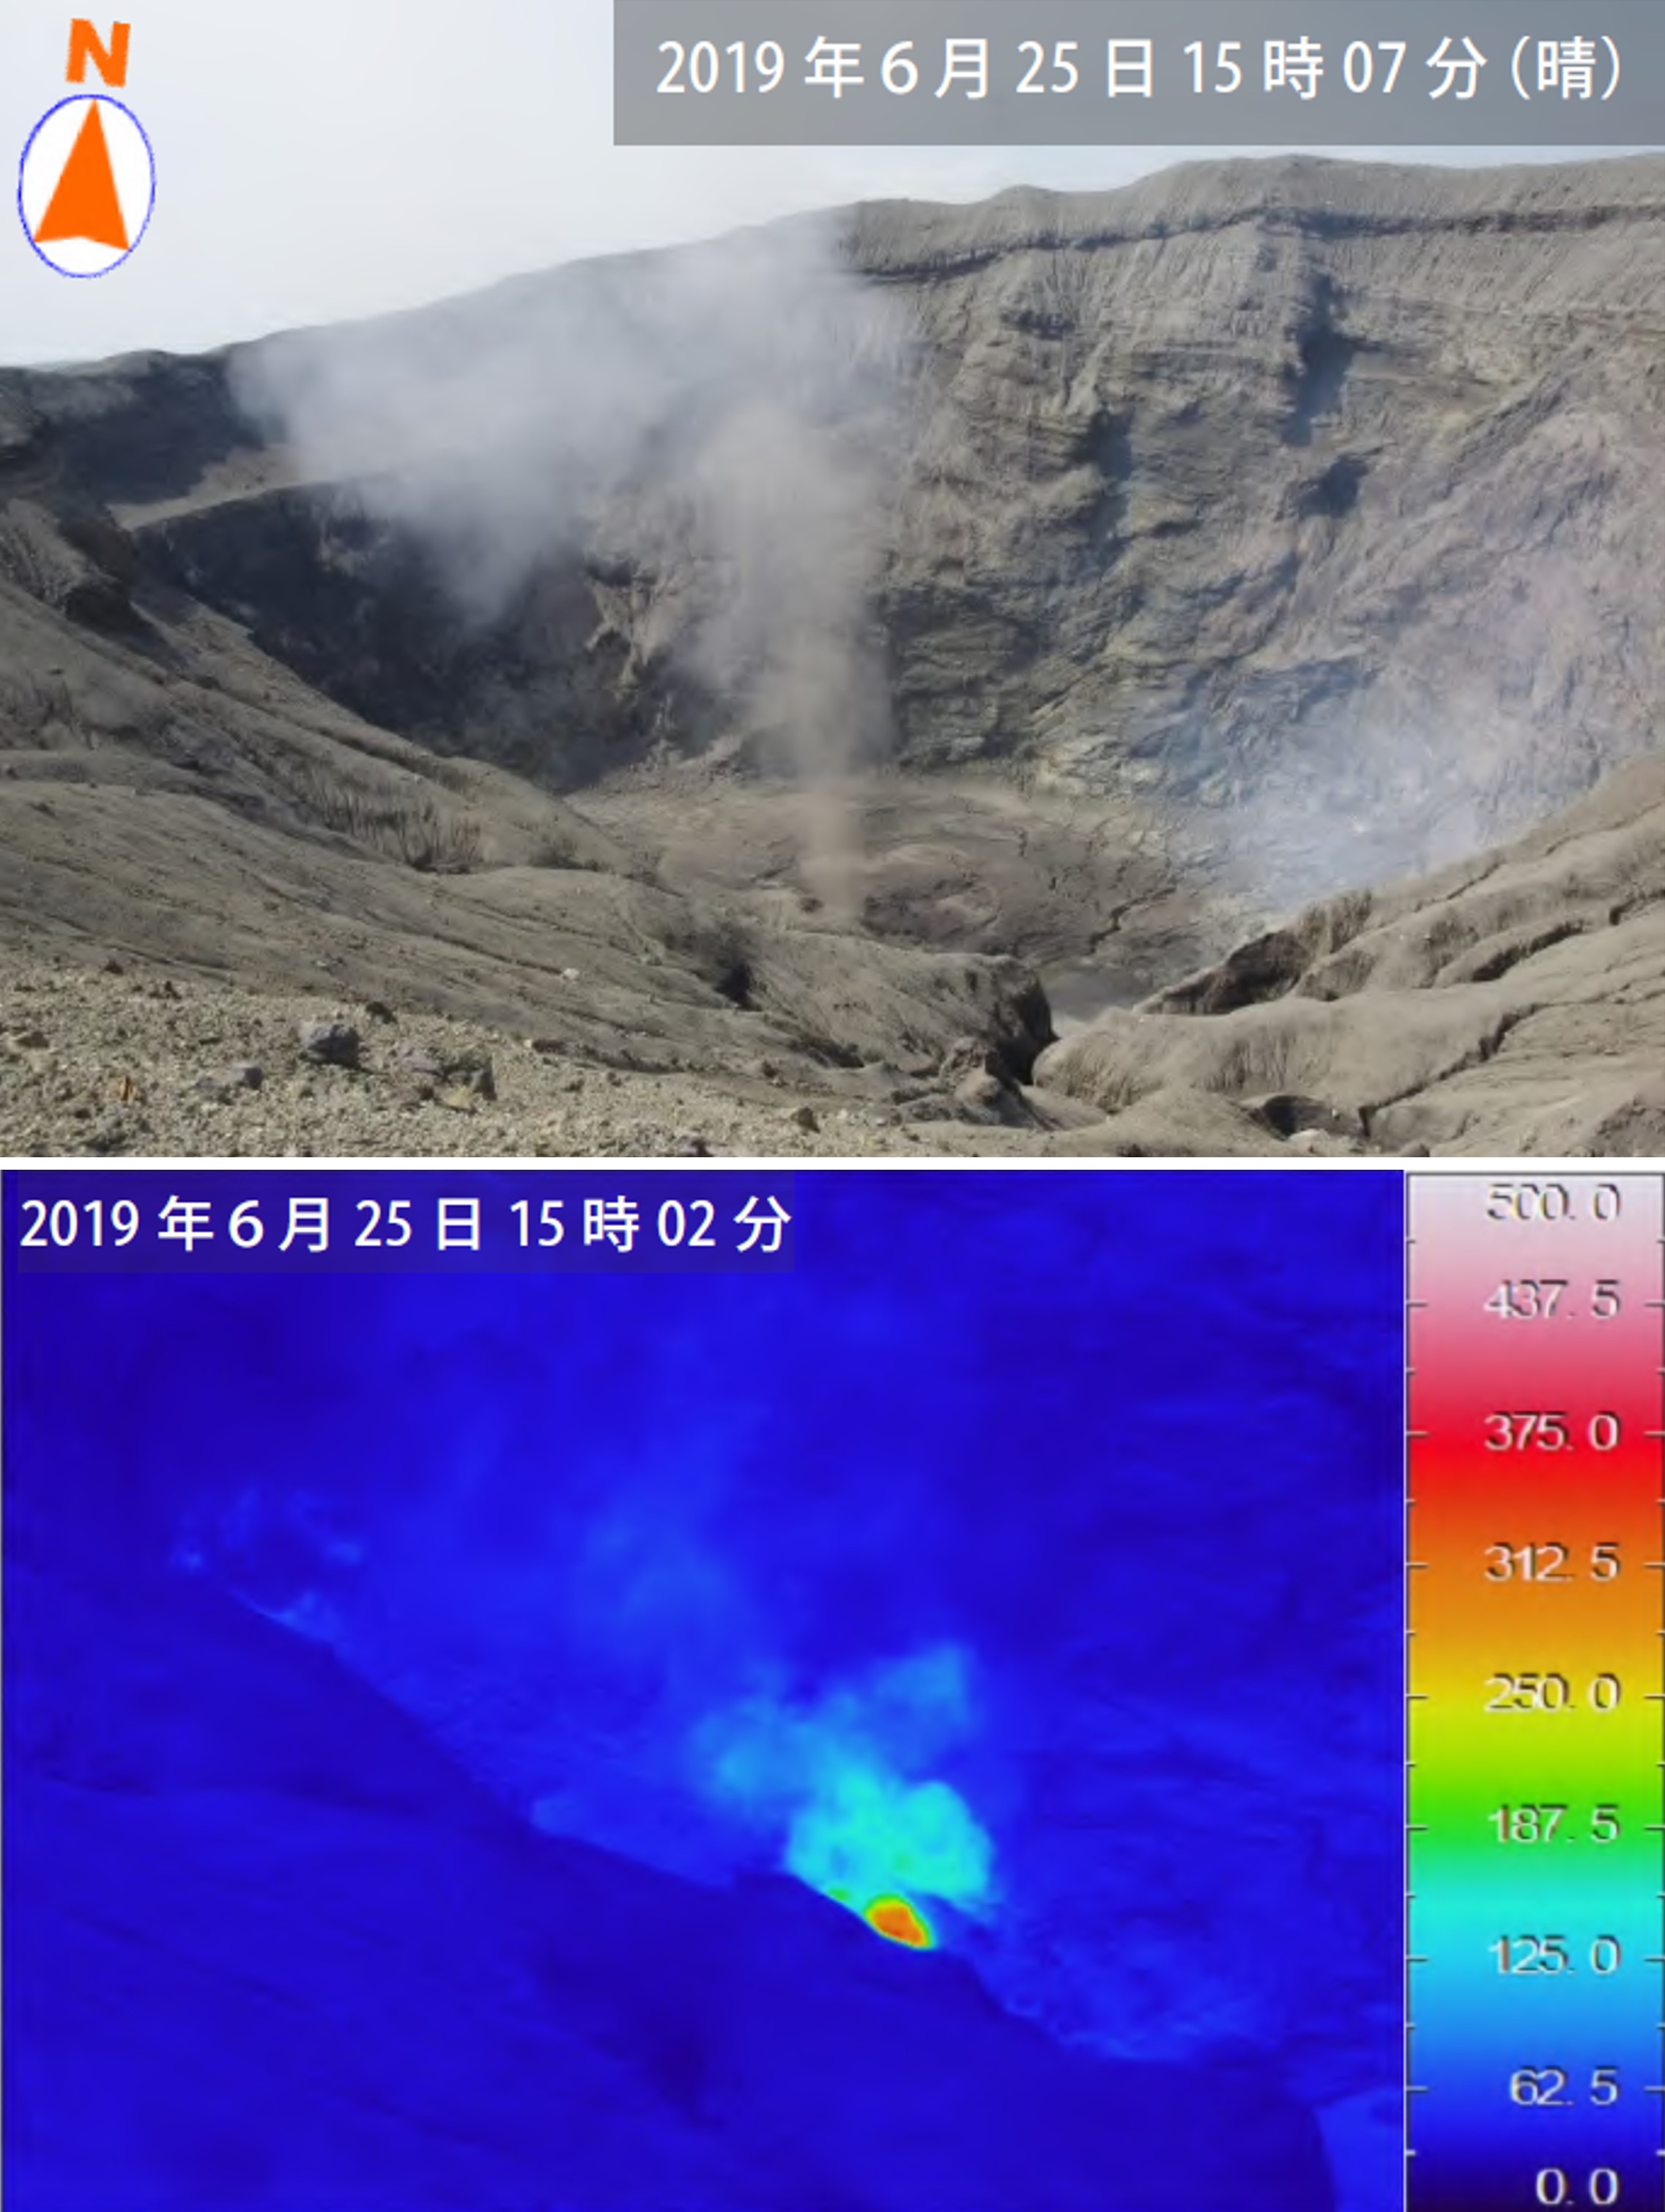
The most recent eruptive activity prior to the reporting internal occurred on 12 October 2022, when an ash plume rose 3.5 km above the crater rim. An aerial observation conducted by the Japan Coast Guard (JCG) on 25 November reported that white fumaroles rose approximately 200 m above the central crater of a pyroclastic cone (figure 119), and multiple plumes were observed on the ESE flank of the cone. Discolored water ranging from reddish-brown to brown and yellowish-green were visible around the perimeter of the island (figure 119). No significant activity was reported in December.
During an overflight conducted by JCG on 25 January 2023 intermittent activity and small, blackish-gray plumes rose 900 m above the central part of the crater were observed (figure 120). The fumarolic zone of the E flank and base of the cone had expanded and emissions had intensified. Dark brown discolored water was visible around the perimeter of the island.
No significant activity was reported during February through March. Ash plumes at 1050 and 1420 on 11 April rose 1.9 km above the crater rim and drifted NW and N. These were the first ash plumes observed since 12 October 2022. On 14 April JCG carried out an overflight and reported that no further eruptive activity was visible, although white gas-and-steam plumes were visible from the central crater and rose 900 m high (figure 121). Brownish and yellow-green discolored water surrounded the island.
Intermittent low-to-moderate power thermal anomalies were recorded in the MIROVA graph (Middle InfraRed Observation of Volcanic Activity) during November 2022 through April 2023 (figure 123). A cluster of six to eight anomalies were detected during November while a smaller number were detected during the following months: two to three during December, one during mid-January 2023, one during February, five during March, and two during April. Thermal activity was also reflected in infrared satellite data at the summit crater, accompanied by occasional gas-and-steam plumes (figure 124).
Geologic Background. The small island of Nishinoshima was enlarged when several new islands coalesced during an eruption in 1973-74. Multiple eruptions that began in 2013 completely covered the previous exposed surface and continued to enlarge the island. The island is the summit of a massive submarine volcano that has prominent peaks to the S, W, and NE. The summit of the southern cone rises to within 214 m of the ocean surface 9 km SSE.
Information Contacts: Japan Meteorological Agency (JMA), 1-3-4 Otemachi, Chiyoda-ku, Tokyo 100-8122, Japan (URL: http://www.jma.go.jp/jma/indexe.html); MIROVA (Middle InfraRed Observation of Volcanic Activity), a collaborative project between the Universities of Turin and Florence (Italy) supported by the Centre for Volcanic Risk of the Italian Civil Protection Department (URL: http://www.mirovaweb.it/); Copernicus Browser, Copernicus Data Space Ecosystem, European Space Agency (URL: https://dataspace.copernicus.eu/browser/).
Karangetang (Indonesia) — July 2023 Cite this Report
Karangetang
Indonesia
2.781°N, 125.407°E; summit elev. 1797 m
All times are local (unless otherwise noted)
Lava flows, incandescent avalanches, and ash plumes during January-June 2023
Karangetang (also known as Api Siau), at the northern end of the island of Siau, Indonesia, contains five summit craters along a N-S line. More than 40 eruptions have been recorded since 1675; recent eruptions have included frequent explosive activity, sometimes accompanied by pyroclastic flows and lahars. Lava dome growth has occurred in the summit craters and collapses of lava flow fronts have produced pyroclastic flows. The two active summit craters are Kawah Dua (the N crater) and Kawah Utama (the S crater, also referred to as the “Main Crater”). The most recent eruption began in late November 2018 and has more recently consisted of weak thermal activity and gas-and-steam emissions (BGVN 48:01). This report updates activity characterized by lava flows, incandescent avalanches, and ash plumes during January through June 2023 using reports from Pusat Vulkanologi dan Mitigasi Bencana Geologi (PVMBG, also known as CVGHM, or the Center of Volcanology and Geological Hazard Mitigation), MAGMA Indonesia, the Darwin VAAC (Volcano Ash Advisory Center), and satellite data.
Activity during January was relatively low and mainly consisted of white gas-and-steam emissions that rose 25-150 m above Main Crater (S crater) and drifted in different directions. Incandescence was visible from the lava dome in Kawah Dua (the N crater). Weather conditions often prevented clear views of the summit. On 18 January the number of seismic signals that indicated avalanches of material began to increase. In addition, there were a total of 71 earthquakes detected during the month.
Activity continued to increase during the first week of February. Material from Main Crater traveled as far as 800 m down the Batuawang (S) and Batang (W) drainages and as far as 1 km W down the Beha (W) drainage on 4 February. On 6 February 43 earthquake events were recorded, and on 7 February, 62 events were recorded. White gas-and-steam emissions rose 25-250 m above both summit craters throughout the month. PVMBG reported an eruption began during the evening of 8 February around 1700. Photos showed incandescent material at Main Crater. Incandescent material had also descended the flank in at least two unconfirmed directions as far as 2 km from Main Crater, accompanied by ash plumes (figure 60). As a result, PVMBG increased the Volcano Alert Level (VAL) to 3 (the second highest level on a 1-4 scale).
Occasional nighttime webcam images showed three main incandescent lava flows of differing lengths traveling down the S, SW, and W flanks (figure 61). Incandescent rocks were visible on the upper flanks, possibly from ejected or collapsed material from the crater, and incandescence was the most intense at the summit. Based on analyses of satellite imagery and weather models, the Darwin VAAC reported that daily ash plumes during 16-20 February rose to 2.1-3 km altitude and drifted NNE, E, and SE. BNPB reported on 16 February that as many as 77 people were evacuated and relocated to the East Siau Museum. A webcam image taken at 2156 on 17 February possibly showed incandescent material descending the SE flank. Ash plumes rose to 2.1 km altitude and drifted SE during 22-23 February, according to the Darwin VAAC.
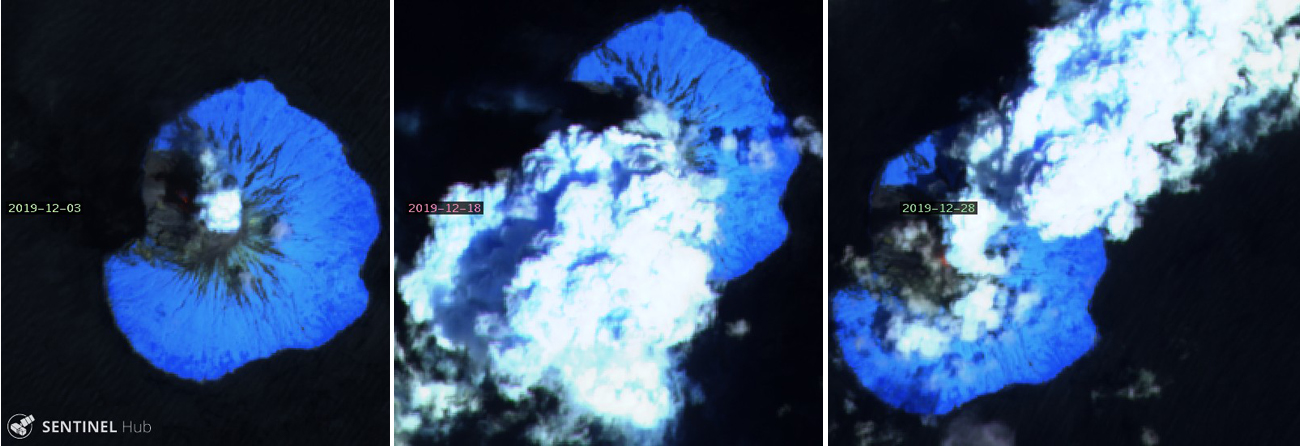
Incandescent avalanches of material and summit incandescence at Main Crater continued during March. White gas-and-steam emissions during March generally rose 25-150 m above the summit crater; on 31 March gas-and-steam emissions rose 200-400 m high. An ash plume rose to 2.4 km altitude and drifted S at 1710 on 9 March and a large thermal anomaly was visible in images taken at 0550 and 0930 on 10 March. Incandescent material was visible at the summit and on the flanks based on webcam images taken at 0007 and 2345 on 16 March, at 1828 on 17 March, at 1940 on 18 March, at 2311 on 19 March, and at 2351 on 20 March. Incandescence was most intense on 18 and 20 March and webcam images showed possible Strombolian explosions (figure 62). An ash plume rose to 2.4 km altitude and drifted SW on 18 March, accompanied by a thermal anomaly.
Summit crater incandescence at Main Crater and on the flanks persisted during April. Incandescent material at the S crater and on the flanks was reported at 0016 on 1 April. The lava flows had stopped by 1 April according to PVMBG, although incandescence was still visible up to 10 m high. Seismic signals indicating effusion decreased and by 6 April they were no longer detected. Incandescence was visible from both summit craters. On 26 April the VAL was lowered to 2 (the second lowest level on a 1-4 scale). White gas-and-steam emissions rose 25-200 m above the summit crater.
During May white gas-and-steam emissions generally rose 50-250 m above the summit, though it was often cloudy, which prevented clear views; on 21 May gas-and-steam emissions rose 50-400 m high. Nighttime N summit crater incandescence rose 10-25 m above the lava dome, and less intense incandescence was noted above Main Crater, which reached about 10 m above the dome. Sounds of falling rocks at Main Crater were heard on 15 May and the seismic network recorded 32 rockfall events in the crater on 17 May. Avalanches traveled as far as 1.5 km down the SW and S flanks, accompanied by rumbling sounds on 18 May. Incandescent material descending the flanks was captured in a webcam image at 2025 on 19 May (figure 63) and on 29 May; summit crater incandescence was observed in webcam images at 2332 on 26 May and at 2304 on 29 May. On 19 May the VAL was again raised to 3.
Occasional Main Crater incandescence was reported during June, as well as incandescent material on the flanks. White gas-and-steam emissions rose 10-200 m above the summit crater. Ash plumes rose to 2.1 km altitude and drifted SE and E during 2-4 June, according to the Darwin VAAC. Material on the flanks of Main Crater were observed at 2225 on 7 June, at 2051 on 9 June, at 0007 on 17 June, and at 0440 on 18 June. Webcam images taken on 21, 25, and 27 June showed incandescence at Main Crater and from material on the flanks.
MIROVA (Middle InfraRed Observation of Volcanic Activity) analysis of MODIS satellite data showed strong thermal activity during mid-February through March and mid-May through June, which represented incandescent avalanches and lava flows (figure 64). During April through mid-May the power of the anomalies decreased but frequent anomalies were still detected. Brief gaps in activity occurred during late March through early April and during mid-June. Infrared satellite images showed strong lava flows mainly affecting the SW and S flanks, accompanied by gas-and-steam emissions (figure 65). According to data recorded by the MODVOLC thermal algorithm, there were a total of 79 thermal hotspots detected: 28 during February, 24 during March, one during April, five during May, and 21 during June.
Geologic Background. Karangetang (Api Siau) volcano lies at the northern end of the island of Siau, about 125 km NNE of the NE-most point of Sulawesi. The stratovolcano contains five summit craters along a N-S line. It is one of Indonesia's most active volcanoes, with more than 40 eruptions recorded since 1675 and many additional small eruptions that were not documented (Neumann van Padang, 1951). Twentieth-century eruptions have included frequent explosive activity sometimes accompanied by pyroclastic flows and lahars. Lava dome growth has occurred in the summit craters; collapse of lava flow fronts have produced pyroclastic flows.
Information Contacts: Pusat Vulkanologi dan Mitigasi Bencana Geologi (PVMBG, also known as Indonesian Center for Volcanology and Geological Hazard Mitigation, CVGHM), Jalan Diponegoro 57, Bandung 40122, Indonesia (URL: http://www.vsi.esdm.go.id/); MAGMA Indonesia, Kementerian Energi dan Sumber Daya Mineral (URL: https://magma.esdm.go.id/v1); Badan Nasional Penanggulangan Bencana (BNPB), National Disaster Management Agency, Graha BNPB - Jl. Scout Kav.38, East Jakarta 13120, Indonesia (URL: http://www.bnpb.go.id/); Darwin Volcanic Ash Advisory Centre (VAAC), Bureau of Meteorology, Northern Territory Regional Office, PO Box 40050, Casuarina, NT 0811, Australia (URL: http://www.bom.gov.au/info/vaac/); MIROVA (Middle InfraRed Observation of Volcanic Activity), a collaborative project between the Universities of Turin and Florence (Italy) supported by the Centre for Volcanic Risk of the Italian Civil Protection Department (URL: http://www.mirovaweb.it/); Hawai'i Institute of Geophysics and Planetology (HIGP) - MODVOLC Thermal Alerts System, School of Ocean and Earth Science and Technology (SOEST), Univ. of Hawai'i, 2525 Correa Road, Honolulu, HI 96822, USA (URL: http://modis.higp.hawaii.edu/); Copernicus Browser, Copernicus Data Space Ecosystem, European Space Agency (URL: https://dataspace.copernicus.eu/browser/); IDN Times, Jl. Jend. Gatot Subroto Kav. 27 3rd Floor Kuningan, Jakarta, Indonesia 12950, Status of Karangetang Volcano in Sitaro Islands Increases (URL: https://sulsel.idntimes.com/news/indonesia/savi/status-gunung-api-karangetang-di-kepulauan-sitaro-meningkat?page=all).
Ahyi (United States) — July 2023 Cite this Report
Ahyi
United States
20.42°N, 145.03°E; summit elev. -75 m
All times are local (unless otherwise noted)
Intermittent hydroacoustic signals and discolored plumes during November 2022-June 2023
Ahyi seamount is a large, conical submarine volcano that rises to within 75 m of the ocean surface about 18 km SE of the island of Farallon de Pajaros in the Northern Marianas. The remote location of the seamount has made eruptions difficult to document, but seismic stations installed in the region confirmed an eruption in the vicinity in 2001. No new activity was detected until April-May 2014 when an eruption was detected by NOAA (National Oceanic and Atmospheric Administration) divers, hydroacoustic sensors, and seismic stations (BGVN 42:04). New activity was first detected on 15 November by hydroacoustic sensors that were consistent with submarine volcanic activity. This report covers activity during November 2022 through June 2023 based on daily and weekly reports from the US Geological Survey.
Starting in mid-October, hydroacoustic sensors at Wake Island (2.2 km E) recorded signals consistent with submarine volcanic activity, according to a report from the USGS issued on 15 November 2022. A combined analysis of the hydroacoustic signals and seismic stations located at Guam and Chichijima Island, Japan, suggested that the source of this activity was at or near the Ahyi seamount. After a re-analysis of a satellite image of the area that was captured on 6 November, USGS confirmed that there was no evidence of discoloration at the ocean surface. Few hydroacoustic and seismic signals continued through November, including on 18 November, which USGS suggested signified a decline or pause in unrest. A VONA (Volcano Observatory Notice for Aviation) reported that a discolored water plume was persistently visible in satellite data starting on 18 November (figure 6). Though clouds often obscured clear views of the volcano, another discolored water plume was captured in a satellite image on 26 November. The Aviation Color Code (ACC) was raised to Yellow (the second lowest level on a four-color scale) and the Volcano Alert Level (VAL) was raised to Advisory (the second lowest level on a four-level scale) on 29 November.
During December, occasional detections were recorded on the Wake Island hydrophone sensors and discolored water over the seamount remained visible. During 2-7, 10-12, and 16-31 December possible explosion signals were detected. A small area of discolored water was observed in high-resolution Sentinel-2 satellite images during 1-6 December (figure 7). High-resolution satellite images recorded discolored water plumes on 13 December that originated from the summit region; no observations indicated that activity breached the ocean surface. A possible underwater plume was visible in satellite images on 18 December, and during 19-20 December a definite but diffuse underwater plume located SSE from the main vent was reported. An underwater plume was visible in a satellite image taken on 26 December (figure 7).
Hydrophone sensors continued to detect signals consistent with possible explosions during 1-8 January 2023. USGS reported that the number of detections decreased during 4-5 January. The hydrophone sensors experienced a data outage that started at 0118 on 8 January and continued through 10 January, though according to USGS, possible explosions were recorded prior to the data outage and likely continued during the outage. A discolored water plume originating from the summit region was detected in a partly cloudy satellite image on 8 January. On 11-12 and 15-17 January possible explosion signals were recorded again. One small signal was detected during 22-23 January and several signals were recorded on 25 and 31 January. During 27-31 January a plume of discolored water was observed above the seamount in satellite imagery (figure 8).
Low levels of activity continued during February and March, based on data from pressure sensors on Wake Island. During 1 and 4-6 February activity was reported, and a submarine plume was observed on 4 February (figure 8). Possible explosion signals were detected during 7-8, 10, 13-14, and 24 February. During 1-2 and 3-5 March a plume of discolored water was observed in satellite imagery (figure 8). Almost continuous hydroacoustic signals were detected in remote pressure sensor data on Wake Island 2,270 km E from the volcano during 7-13 March. During 12-13 March water discoloration around the seamount was observed in satellite imagery, despite cloudy weather. By 14 March discolored water extended about 35 km, but no direction was noted. USGS reported that the continuous hydroacoustic signals detected during 13-14 March stopped abruptly on 14 March and no new detections were observed. Three 30 second hydroacoustic detections were reported during 17-19 March, but no activity was visible due to cloudy weather. A data outage was reported during 21-22 March, making pressure sensor data unavailable; a discolored water plume was, however, visible in satellite data. A possible underwater explosion signal was detected by pressure sensors at Wake Island on 26, 29, and 31 March, though the cause and origin of these events were unclear.
Similar low activity continued during April, May, and June. Several signals were detected during 1-3 April in pressure sensors at Wake Island. USGS suggested that these may be related to underwater explosions or earthquakes at the volcano, but no underwater plumes were visible in clear satellite images. The pressure sensors had data outages during 12-13 April and no data were recorded; no underwater plumes were visible in satellite images, although cloudy weather obscured most clear views. Eruptive activity was reported starting at 2210 on 21 May. On 22 May a discolored water plume that extended 4 km was visible in satellite images, though no direction was recorded. During 23-24 May some signals were detected by the underwater pressure sensors. Possible hydroacoustic signals were detected during 2-3 and 6-8 June. Multiple hydroacoustic signals were detected during 9-11 and 16-17 June, although no activity was visible in satellite images. One hydroacoustic signal was detected during 23-24 June, but there was some uncertainty about its association with volcanic activity. A single possible hydroacoustic signal was detected during 30 June to 1 July.
Geologic Background. Ahyi seamount is a large conical submarine volcano that rises to within 75 m of the ocean surface ~18 km SE of the island of Farallon de Pajaros in the northern Marianas. Water discoloration has been observed there, and in 1979 the crew of a fishing boat felt shocks over the summit area, followed by upwelling of sulfur-bearing water. On 24-25 April 2001 an explosive eruption was detected seismically by a station on Rangiroa Atoll, Tuamotu Archipelago. The event was well constrained (+/- 15 km) at a location near the southern base of Ahyi. An eruption in April-May 2014 was detected by NOAA divers, hydroacoustic sensors, and seismic stations.
Information Contacts: US Geological Survey, Volcano Hazards Program (USGS-VHP), 12201 Sunrise Valley Drive, Reston, VA, USA, https://volcanoes.usgs.gov/index.html; Copernicus Browser, Copernicus Data Space Ecosystem, European Space Agency (URL: https://dataspace.copernicus.eu/browser/).
Kadovar (Papua New Guinea) — June 2023 Cite this Report
Kadovar
Papua New Guinea
3.608°S, 144.588°E; summit elev. 365 m
All times are local (unless otherwise noted)
An ash plume and weak thermal anomaly during May 2023
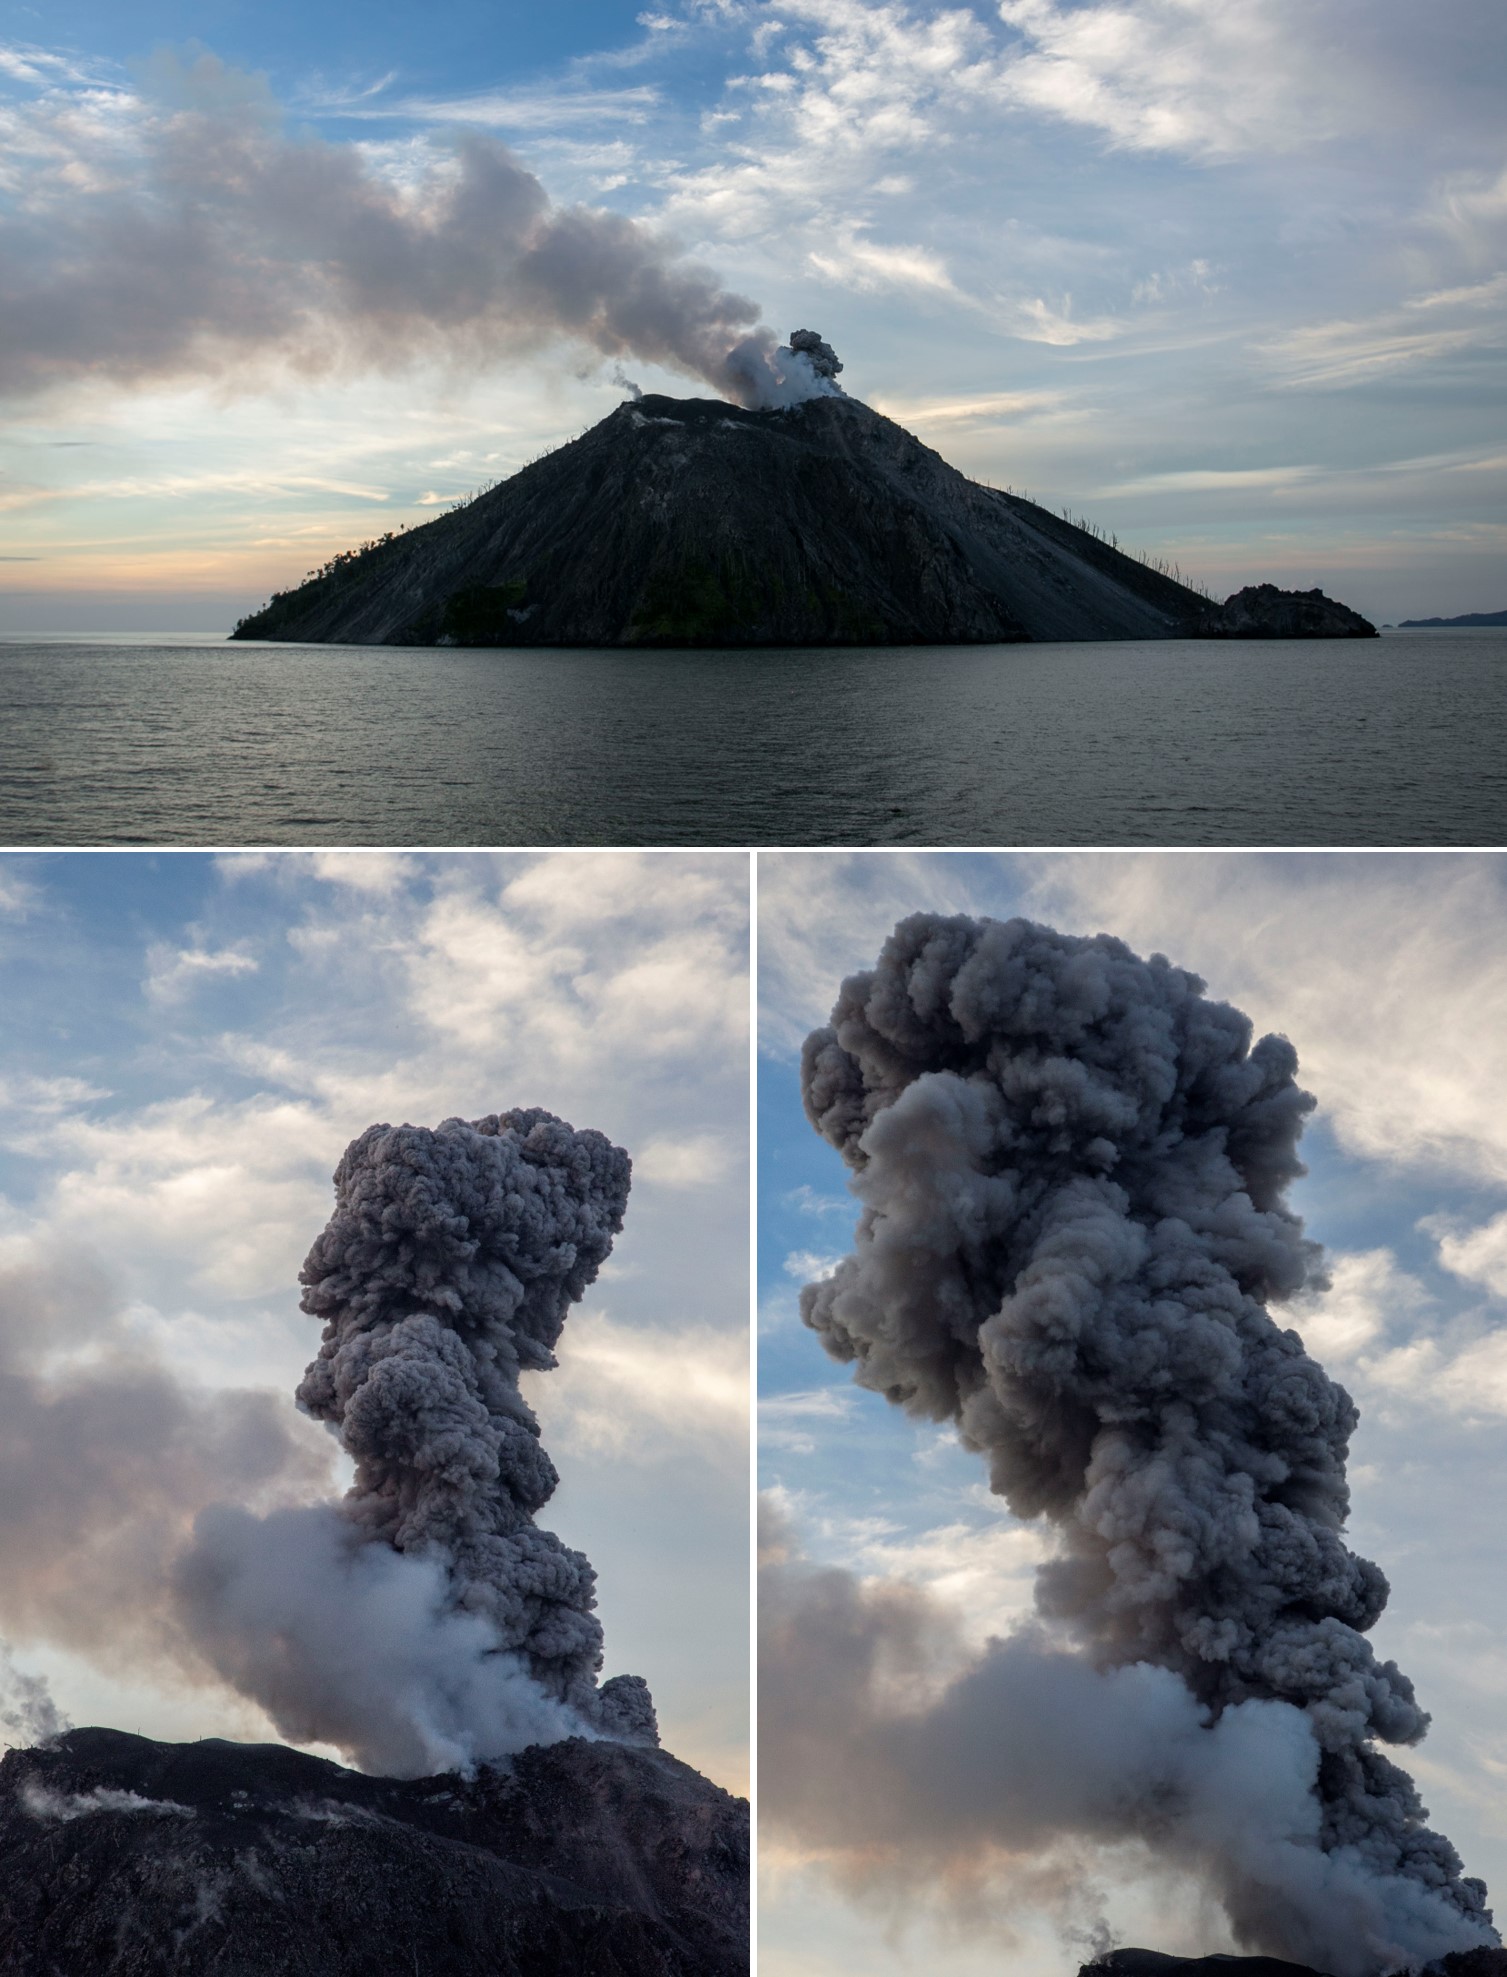
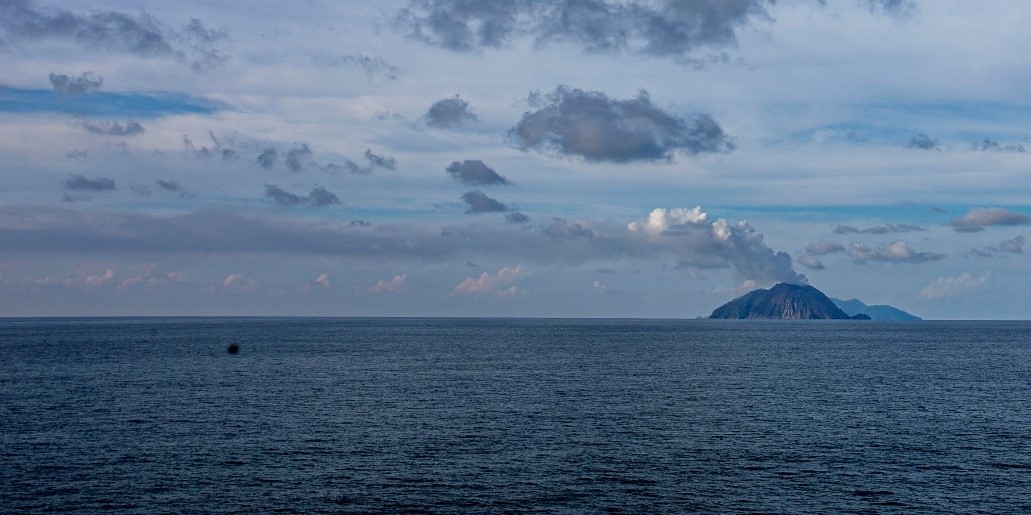
Kadovar is a 2-km-wide island that is the emergent summit of a Bismarck Sea stratovolcano. It lies off the coast of New Guinea, about 25 km N of the mouth of the Sepik River. Prior to an eruption that began in 2018, a lava dome formed the high point of the volcano, filling an arcuate landslide scarp open to the S. Submarine debris-avalanche deposits occur to the S of the island. The current eruption began in January 2018 and has comprised lava effusion from vents at the summit and at the E coast; more recent activity has consisted of ash plumes, weak thermal activity, and gas-and-steam plumes (BGVN 48:02). This report covers activity during February through May 2023 using information from the Darwin Volcanic Ash Advisory Center (VAAC) and satellite data.
Activity during the reporting period was relatively low and mainly consisted of white gas-and-steam plumes that were visible in natural color satellite images on clear weather days (figure 67). According to a Darwin VAAC report, at 2040 on 6 May an ash plume rose to 4.6 km altitude and drifted W; by 2300 the plume had dissipated. MODIS satellite instruments using the MODVOLC thermal algorithm detected a single thermal hotspot on the SE side of the island on 7 May. Weak thermal activity was also detected in a satellite image on the E side of the island on 14 May, accompanied by a white gas-and-steam plume that drifted SE (figure 68).
Geologic Background. The 2-km-wide island of Kadovar is the emergent summit of a Bismarck Sea stratovolcano of Holocene age. It is part of the Schouten Islands, and lies off the coast of New Guinea, about 25 km N of the mouth of the Sepik River. Prior to an eruption that began in 2018, a lava dome formed the high point of the andesitic volcano, filling an arcuate landslide scarp open to the south; submarine debris-avalanche deposits occur in that direction. Thick lava flows with columnar jointing forms low cliffs along the coast. The youthful island lacks fringing or offshore reefs. A period of heightened thermal phenomena took place in 1976. An eruption began in January 2018 that included lava effusion from vents at the summit and at the E coast.
Information Contacts: Darwin Volcanic Ash Advisory Centre (VAAC), Bureau of Meteorology, Northern Territory Regional Office, PO Box 40050, Casuarina, NT 0811, Australia (URL: http://www.bom.gov.au/info/vaac/); Hawai'i Institute of Geophysics and Planetology (HIGP) - MODVOLC Thermal Alerts System, School of Ocean and Earth Science and Technology (SOEST), Univ. of Hawai'i, 2525 Correa Road, Honolulu, HI 96822, USA (URL: http://modis.higp.hawaii.edu/); Copernicus Browser, Copernicus Data Space Ecosystem, European Space Agency (URL: https://dataspace.copernicus.eu/browser/).
San Miguel (El Salvador) — June 2023 Cite this Report
San Miguel
El Salvador
13.434°N, 88.269°W; summit elev. 2130 m
All times are local (unless otherwise noted)
Small gas-and-ash explosions during March and May 2023
San Miguel in El Salvador is a broad, deep crater complex that has been frequently modified by eruptions recorded since the early 16th century and consists of the summit known locally as Chaparrastique. Flank eruptions have produced lava flows that extended to the N, NE, and SE during the 17-19th centuries. The most recent activity has consisted of minor ash eruptions from the summit crater. The current eruption period began in November 2022 and has been characterized by frequent phreatic explosions, gas-and-ash emissions, and sulfur dioxide plumes (BGVN 47:12). This report describes small gas-and-ash explosions during December 2022 through May 2023 based on special reports from the Ministero de Medio Ambiente y Recursos Naturales (MARN).
Activity has been relatively low since the last recorded explosions on 29 November 2022. Seismicity recorded by the San Miguel Volcano Station (VSM) located on the N flank at 1.7 km elevation had decreased by 7 December. Sulfur dioxide gas measurements taken with DOAS (Differential Optical Absorption Spectroscopy) mobile equipment were below typical previously recorded values: 300 tons per day (t/d). During December, small explosions were recorded by the seismic network and manifested as gas-and-steam emissions.
Gas-and-ash explosions in the crater occurred during January 2023, which were recorded by the seismic network. Sulfur dioxide values remained low, between 300-400 t/d through 10 March. At 0817 on 14 January a gas-and-ash emission was visible in webcam images, rising just above the crater rim. Some mornings during February, small gas-and-steam plumes were visible in the crater. On 7 March at 2252 MARN noted an increase in degassing from the central crater; gas emissions were constantly observed through the early morning hours on 8 March. During the early morning of 8 March through the afternoon on 9 March, 12 emissions were registered, some accompanied by ash. The last gas-and-ash emission was recorded at 1210 on 9 March; very fine ashfall was reported in El Tránsito (10 km S), La Morita (6 km W), and La Piedrita (3 km W). The smell of sulfur was reported in Piedra Azul (5 km SW). On 16 March MARN reported that gas-and-steam emissions decreased.
Low degassing and very low seismicity were reported during April; no explosions have been detected between 9 March and 27 May. The sulfur dioxide emissions remained between 350-400 t/d; during 13-20 April sulfur dioxide values fluctuated between 30-300 t/d. Activity remained low through most of May; on 23 May seismicity increased. An explosion was detected at 1647 on 27 May generated a gas-and-ash plume that rose 700 m high (figure 32); a decrease in seismicity and gas emissions followed. The DOAS station installed on the W flank recorded sulfur dioxide values that reached 400 t/d on 27 May; subsequent measurements showed a decrease to 268 t/d on 28 May and 100 t/d on 29 May.
Geologic Background. The symmetrical cone of San Miguel, one of the most active volcanoes in El Salvador, rises from near sea level to form one of the country's most prominent landmarks. A broad, deep, crater complex that has been frequently modified by eruptions recorded since the early 16th century caps the truncated unvegetated summit, also known locally as Chaparrastique. Flanks eruptions of the basaltic-andesitic volcano have produced many lava flows, including several during the 17th-19th centuries that extended to the N, NE, and SE. The SE-flank flows are the largest and form broad, sparsely vegetated lava fields crossed by highways and a railroad skirting the base of the volcano. Flank vent locations have migrated higher on the edifice during historical time, and the most recent activity has consisted of minor ash eruptions from the summit crater.
Information Contacts: Ministero de Medio Ambiente y Recursos Naturales (MARN), Km. 5½ Carretera a Nueva San Salvador, Avenida las Mercedes, San Salvador, El Salvador (URL: http://www.snet.gob.sv/ver/vulcanologia).
Semisopochnoi (United States) — June 2023 Cite this Report
Semisopochnoi
United States
51.93°N, 179.58°E; summit elev. 1221 m
All times are local (unless otherwise noted)
Occasional explosions, ash deposits, and gas-and-steam plumes during December 2022-May 2023
Semisopochnoi is located in the western Aleutians, is 20-km-wide at sea level, and contains an 8-km-wide caldera. The three-peaked Mount Young (formerly Cerberus) was constructed within the caldera during the Holocene. Each of these peaks contains a summit crater; the lava flows on the N flank appear younger than those on the S side. The current eruption period began in early February 2021 and has more recently consisted of intermittent explosions and ash emissions (BGVN 47:12). This report updates activity during December 2022 through May 2023 using daily, weekly, and special reports from the Alaska Volcano Observatory (AVO). AVO monitors the volcano using local seismic and infrasound sensors, satellite data, web cameras, and remote infrasound and lightning networks.
Activity during most of December 2022 was relatively quiet; according to AVO no eruptive or explosive activity was observed since 7 November 2022. Intermittent tremor and occasional small earthquakes were observed in geophysical data. Continuous gas-and-steam emissions were observed from the N crater of Mount Young in webcam images on clear weather days (figure 25). On 24 December, there was a slight increase in earthquake activity and several small possible explosion signals were detected in infrasound data. Eruptive activity resumed on 27 December at the N crater of Mount Young; AVO issued a Volcano Activity Notice (VAN) that reported minor ash deposits on the flanks of Mount Young that extended as far as 1 km from the vent, according to webcam images taken during 27-28 December (figure 26). No ash plumes were observed in webcam or satellite imagery, but a persistent gas-and-steam plume that might have contained some ash rose to 1.5 km altitude. As a result, AVO raised the Aviation Color Code (ACC) to Orange (the second highest level on a four-color scale) and the Volcano Alert Level (VAL) to Watch (the second highest level on a four-level scale). Possible explosions were detected during 21 December 2022 through 1 January 2023 and seismic tremor was recorded during 30-31 December.
During January 2023 eruptive activity continued at the active N crater of Mount Young. Minor ash deposits were observed on the flanks, extending about 2 km SSW, based on webcam images from 1 and 3 January. A possible explosion occurred during 1-2 January based on elevated seismicity recorded on local seismometers and an infrasound signal recorded minutes later by an array at Adak. Though no ash plumes were observed in webcam or satellite imagery, a persistent gas-and-steam plume rose to 1.5 km altitude that might have carried minor traces of ash. Ash deposits were accompanied by periods of elevated seismicity and infrasound signals from the local geophysical network, which AVO reported were likely due to weak explosive activity. Low-level explosive activity was also detected during 2-3 January, with minor gas-and-steam emissions and a new ash deposit that was visible in webcam images. Low-level explosive activity was detected in geophysical data during 4-5 January, with elevated seismicity and infrasound signals observed on local stations. Volcanic tremor was detected during 7-9 January and very weak explosive activity was detected in seismic and infrasound data on 9 January. Weak seismic and infrasound signals were recorded on 17 January, which indicated minor explosive activity, but no ash emissions were observed in clear webcam images; a gas-and-steam plume continued to rise to 1.5 km altitude. During 29-30 January, ash deposits near the summit were observed on fresh snow, according to webcam images.
The active N cone at Mount Young continued to produce a gas-and-steam plume during February, but no ash emissions or explosive events were detected. Seismicity remained elevated with faint tremor during early February. Gas-and-steam emissions from the N crater were observed in clear webcam images on 11-13 and 16 February; no explosive activity was detected in seismic, infrasound, or satellite data. Seismicity has also decreased, with no significant seismic tremor observed since 25 January. Therefore, the ACC was lowered to Yellow (the second lowest level on a four-color scale) and the VAL was lowered to Advisory (the second lowest level on a four-color scale) on 22 February.
Gas-and-steam emissions persisted during March from the N cone of Mount Young, based on clear webcam images. A few brief episodes of weak tremor were detected in seismic data, although seismicity decreased over the month. A gas-and-steam plume detected in satellite data extended 150 km on 18 March. Low-level ash emissions from the N cone at Mount Young were observed in several webcam images during 18-19 March, in addition to small explosions and volcanic tremor. The ACC was raised to Orange and the VAL increased to Watch on 19 March. A small explosion was detected in seismic and infrasound data on 21 March.
Low-level unrest continued during April, although cloudy weather often obscured views of the summit; periods of seismic tremor and local earthquakes were recorded. During 3-4 April a gas-and-steam plume was visible traveling more than 200 km overnight; no ash was evident in the plume, according to AVO. A gas-and-steam plume was observed during 4-6 April that extended 400 km but did not seem to contain ash. Small explosions were detected in seismic and infrasound data on 5 April. Occasional clear webcam images showed continuing gas-and-steam emissions rose from Mount Young, but no ash deposits were observed on the snow. On 19 April small explosions and tremor were detected in seismic and infrasound data. A period of seismic tremor was detected during 22-25 April, with possible weak explosions on 25 April. Ash deposits were visible near the crater rim, but it was unclear if these deposits were recent or due to older deposits.
Occasional small earthquakes were recorded during May, but there were no signs of explosive activity seen in geophysical data. Gas-and-steam emissions continued from the N crater of Mount Young, based on webcam images, and seismicity remained slightly elevated. A new, light ash deposit was visible during the morning of 5 May on fresh snow on the NW flank of Mount Young. During 10 May periods of volcanic tremor were observed. The ACC was lowered to Yellow and the VAL to Advisory on 17 May due to no additional evidence of activity.
Geologic Background. Semisopochnoi, the largest subaerial volcano of the western Aleutians, is 20 km wide at sea level and contains an 8-km-wide caldera. It formed as a result of collapse of a low-angle, dominantly basaltic volcano following the eruption of a large volume of dacitic pumice. The high point of the island is Anvil Peak, a double-peaked late-Pleistocene cone that forms much of the island's northern part. The three-peaked Mount Cerberus (renamed Mount Young in 2023) was constructed within the caldera during the Holocene. Each of the peaks contains a summit crater; lava flows on the N flank appear younger than those on the south side. Other post-caldera volcanoes include the symmetrical Sugarloaf Peak SSE of the caldera and Lakeshore Cone, a small cinder cone at the edge of Fenner Lake in the NE part of the caldera. Most documented eruptions have originated from Young, although Coats (1950) considered that both Sugarloaf and Lakeshore Cone could have been recently active.
Information Contacts: Alaska Volcano Observatory (AVO), a cooperative program of a) U.S. Geological Survey, 4200 University Drive, Anchorage, AK 99508-4667 USA (URL: https://avo.alaska.edu/), b) Geophysical Institute, University of Alaska, PO Box 757320, Fairbanks, AK 99775-7320, USA, and c) Alaska Division of Geological & Geophysical Surveys, 794 University Ave., Suite 200, Fairbanks, AK 99709, USA (URL: http://dggs.alaska.gov/).
Ebeko
Russia
50.686°N, 156.014°E; summit elev. 1103 m
All times are local (unless otherwise noted)
Continued explosions, ash plumes, and ashfall during October 2022-May 2023
Ebeko, located on the N end of Paramushir Island in the Kuril Islands, consists of three summit craters along a SSW-NNE line at the northern end of a complex of five volcanic cones. Eruptions date back to the late 18th century and have been characterized as small-to-moderate explosions from the summit crater, accompanied by intense fumarolic activity. The current eruption period began in June 2022 and has recently consisted of frequent explosions, ash plumes, and thermal activity (BGVN 47:10). This report covers similar activity during October 2022 through May 2023, based on information from the Kamchatka Volcanic Eruptions Response Team (KVERT) and satellite data.
Activity during October consisted of explosive activity, ash plumes, and occasional thermal anomalies. Visual data by volcanologists from Severo-Kurilsk showed explosions producing ash clouds up to 2.1-3 km altitude which drifted E, N, NE, and SE during 1-8, 10, 16, and 18 October. KVERT issued several Volcano Observatory Notices for Aviation (VONA) on 7, 13-15, and 27 October 2022, stating that explosions generated ash plumes that rose to 2.3-4 km altitude and drifted 5 km E, NE, and SE. Ashfall was reported in Severo-Kurilsk (Paramushir Island, about 7 km E) on 7 and 13 October. Satellite data showed a thermal anomaly over the volcano on 15-16 October. Visual data showed ash plumes rising to 2.5-3.6 km altitude on 22, 25-29, and 31 October and moving NE due to constant explosions.
Similar activity continued during November, with explosions, ash plumes, and ashfall occurring. KVERT issued VONAs on 1-2, 4, 6-7, 9, 13, and 16 November that reported explosions and resulting ash plumes that rose to 1.7-3.6 km altitude and drifted 3-5 km SE, ESE, E, and NE. On 1 November ash plumes extended as far as 110 km SE. On 5, 8, 12, and 24-25 November explosions and ash plumes rose to 2-3.1 km altitude and drifted N and E. Ashfall was observed in Severo-Kurilsk on 7 and 16 November. A thermal anomaly was visible during 1-4, 16, and 20 November. Explosions during 26 November rose as high as 2.7 km altitude and drifted NE (figure 45).
Explosions and ash plumes continued to occur in December. During 1-2 and 4 December volcanologists from Severo-Kurilsk observed explosions that sent ash to 1.9-2.5 km altitude and drifted NE and SE (figure 46). VONAs were issued on 5, 9, and 16 December reporting that explosions generated ash plumes rising to 1.9 km, 2.6 km, and 2.4 km altitude and drifted 5 km SE, E, and NE, respectively. A thermal anomaly was visible in satellite imagery on 16 December. On 18 and 27-28 December explosions produced ash plumes that rose to 2.5 km altitude and drifted NE and SE. On 31 December an ash plume rose to 2 km altitude and drifted NE.
Explosions continued during January 2023, based on visual observations by volcanologists from Severo-Kurilsk. During 1-7 January explosions generated ash plumes that rose to 4 km altitude and drifted NE, E, W, and SE. According to VONAs issued by KVERT on 2, 4, 10, and 23 January, explosions produced ash plumes that rose to 2-4 km altitude and drifted 5 km N, NE, E, and ENE; the ash plume that rose to 4 km altitude occurred on 10 January (figure 47). Satellite data showed a thermal anomaly during 3-4, 10, 13, 16, 21, 22, and 31 January. KVERT reported that an ash cloud on 4 January moved 12 km NE. On 6 and 9-11 January explosions sent ash plumes to 4.5 km altitude and drifted W and ESE. On 13 January an ash plume rose to 3 km altitude and drifted SE. During 20-24 January ash plumes from explosions rose to 3.7 km altitude and drifted SE, N, and NE. On 21 January the ash plume drifted as far as 40 km NE. During 28-29 and 31 January and 1 February ash plumes rose to 4 km altitude and drifted NE.
During February, explosions, ash plumes, and ashfall were reported. During 1, 4-5 and 7-8 February explosions generated ash plumes that rose to 4.5 km altitude and drifted E and NE; ashfall was observed on 5 and 8 February. On 6 February an explosion produced an ash plume that rose to 3 km altitude and drifted 7 km E, causing ashfall in Severo-Kurilsk. A thermal anomaly was visible in satellite data on 8, 9, 13, and 21 February. Explosions on 9 and 12-13 February produced ash plumes that rose to 4 km altitude and drifted E and NE; the ash cloud on 12 February extended as far as 45 km E. On 22 February explosions sent ash to 3 km altitude that drifted E. During 24 and 26-27 February ash plumes rose to 4 km altitude and drifted E. On 28 February an explosion sent ash to 2.5-3 km altitude and drifted 5 km E; ashfall was observed in Severo-Kurilsk.
Activity continued during March; visual observations showed that explosions generated ash plumes that rose to 3.6 km altitude on 3, 5-7, and 9-12 March and drifted E, NE, and NW. Thermal anomalies were visible on 10, 13, and 29-30 March in satellite imagery. On 18, 21-23, 26, and 29-30 March explosions produced ash plumes that rose to 2.8 km altitude and drifted NE and E; the ash plumes during 22-23 March extended up to 76 km E. A VONA issued on 21 March reported an explosion that produced an ash plume that rose to 2.8 km altitude and drifted 5 km E. Another VONA issued on 23 March reported that satellite data showed an ash plume rising to 3 km altitude and drifted 14 km E.
Explosions during April continued to generate ash plumes. On 1 and 4 April an ash plume rose to 2.8-3.5 km altitude and drifted SE and NE. A thermal anomaly was visible in satellite imagery during 1-6 April. Satellite data showed ash plumes and clouds rising to 2-3 km altitude and drifting up to 12 km SW and E on 3 and 6 April (figure 48). KVERT issued VONAs on 3, 5, 14, 16 April describing explosions that produced ash plumes rising to 3 km, 3.5 km, 3.5 km, and 3 km altitude and drifting 5 km S, 5 km NE and SE, 72 km NNE, and 5 km NE, respectively. According to satellite data, the resulting ash cloud from the explosion on 14 April was 25 x 7 km in size and drifted 72-104 km NNE during 14-15 April. According to visual data by volcanologists from Severo-Kurilsk explosions sent ash up to 3.5 km altitude that drifted NE and E during 15-16, 22, 25-26, and 29 April.
The explosive eruption continued during May. Explosions during 3-4, 6-7, and 9-10 May generated ash plumes that rose to 4 km altitude and drifted SW and E. Satellite data showed a thermal anomaly on 3, 9, 13-14, and 24 May. During 12-16, 23-25, and 27-28 May ash plumes rose to 3.5 km altitude and drifted in different directions due to explosions. Two VONA notices were issued on 16 and 25 May, describing explosions that generated ash plumes rising to 3 km and 3.5 km altitude, respectively and extending 5 km E. The ash cloud on 25 May drifted 75 km SE.
Thermal activity in the summit crater, occasionally accompanied by ash plumes and ash deposits on the SE and E flanks due to frequent explosions, were visible in infrared and true color satellite images (figure 49).
Geologic Background. The flat-topped summit of the central cone of Ebeko volcano, one of the most active in the Kuril Islands, occupies the northern end of Paramushir Island. Three summit craters located along a SSW-NNE line form Ebeko volcano proper, at the northern end of a complex of five volcanic cones. Blocky lava flows extend west from Ebeko and SE from the neighboring Nezametnyi cone. The eastern part of the southern crater contains strong solfataras and a large boiling spring. The central crater is filled by a lake about 20 m deep whose shores are lined with steaming solfataras; the northern crater lies across a narrow, low barrier from the central crater and contains a small, cold crescentic lake. Historical activity, recorded since the late-18th century, has been restricted to small-to-moderate explosive eruptions from the summit craters. Intense fumarolic activity occurs in the summit craters, on the outer flanks of the cone, and in lateral explosion craters.
Information Contacts: Kamchatka Volcanic Eruptions Response Team (KVERT), Far Eastern Branch, Russian Academy of Sciences, 9 Piip Blvd., Petropavlovsk-Kamchatsky, 683006, Russia (URL: http://www.kscnet.ru/ivs/kvert/); MIROVA (Middle InfraRed Observation of Volcanic Activity), a collaborative project between the Universities of Turin and Florence (Italy) supported by the Centre for Volcanic Risk of the Italian Civil Protection Department (URL: http://www.mirovaweb.it/); Copernicus Browser, Copernicus Data Space Ecosystem, European Space Agency (URL: https://dataspace.copernicus.eu/browser/).
Home Reef
Tonga
18.992°S, 174.775°W; summit elev. -10 m
All times are local (unless otherwise noted)
Discolored plumes continued during November 2022-April 2023
Home Reef is a submarine volcano located in the central Tonga islands between Lateiki (Metis Shoal) and Late Island. The first recorded eruption occurred in the mid-19th century, when an ephemeral island formed. An eruption in 1984 produced a 12-km-high eruption plume, a large volume of floating pumice, and an ephemeral island 500 x 1,500 m wide, with cliffs 30-50 m high that enclosed a water-filled crater. Another island-forming eruption in 2006 produced widespread pumice rafts that drifted as far as Australia; by 2008 the island had eroded below sea level. The previous eruption occurred during October 2022 and was characterized by a new island-forming eruption, lava effusion, ash plumes, discolored water, and gas-and-steam plumes (BGVN 47:11). This report covers discolored water plumes during November 2022 through April 2023 using satellite data.
Discolored plumes continued during the reporting period and were observed in true color satellite images on clear weather days. Satellite images show light green-yellow discolored water extending W on 8 and 28 November 2022 (figure 31), and SW on 18 November. Light green-yellow plumes extended W on 3 December, S on 13 December, SW on 18 December, and W and S on 23 December (figure 31). On 12 January 2023 discolored green-yellow plumes extended to the NE, E, SE, and N. The plume moved SE on 17 January and NW on 22 January. Faint discolored water in February was visible moving NE on 1 February. A discolored plume extended NW on 8 and 28 March and NW on 13 March (figure 31). During April, clear weather showed green-blue discolored plumes moving S on 2 April, W on 7 April, and NE and S on 12 April. A strong green-yellow discolored plume extended E and NE on 22 April for several kilometers (figure 31).
Geologic Background. Home Reef, a submarine volcano midway between Metis Shoal and Late Island in the central Tonga islands, was first reported active in the mid-19th century, when an ephemeral island formed. An eruption in 1984 produced a 12-km-high eruption plume, large amounts of floating pumice, and an ephemeral 500 x 1,500 m island, with cliffs 30-50 m high that enclosed a water-filled crater. In 2006 an island-forming eruption produced widespread dacitic pumice rafts that drifted as far as Australia. Another island was built during a September-October 2022 eruption.
Information Contacts: Copernicus Browser, Copernicus Data Space Ecosystem, European Space Agency (URL: https://dataspace.copernicus.eu/browser/).
Ambae
Vanuatu
15.389°S, 167.835°E; summit elev. 1496 m
All times are local (unless otherwise noted)
New lava flow, ash plumes, and sulfur dioxide plumes during February-May 2023
Ambae, also known as Aoba, is a large basaltic shield volcano in Vanuatu. A broad pyroclastic cone containing three crater lakes (Manaro Ngoru, Voui, and Manaro Lakua) is located at the summit within the youngest of at least two nested calderas. Periodic phreatic and pyroclastic explosions have been reported since the 16th century. A large eruption more than 400 years ago resulted in a volcanic cone within the summit crater that is now filled by Lake Voui; the similarly sized Lake Manaro fills the western third of the caldera. The previous eruption ended in August 2022 that was characterized by gas-and-steam and ash emissions and explosions of wet tephra (BGVN 47:10). This report covers a new eruption during February through May 2023 that consisted of a new lava flow, ash plumes, and sulfur dioxide emissions, using information from the Vanuatu Meteorology and Geo-Hazards Department (VMGD) and satellite data.
During the reporting period, the Alert Level remained at a 2 (on a scale of 0-5), which has been in place since December 2021. Activity during October 2022 through March 2023 remained relatively low and mostly consisted of gas-and-steam emissions in Lake Voui. VMGD reported that at 1300 on 15 November a satellite image captured a strong amount of sulfur dioxide rising above the volcano (figure 99), and that seismicity slightly increased. The southern and northern part of the island reported a strong sulfur dioxide smell and heard explosions. On 20 February 2023 a gas-and-ash plume rose 1.3 km above the summit and drifted SSW, according to a webcam image (figure 100). Gas-and-steam and possibly ash emissions continued on 23 February and volcanic earthquakes were recorded by the seismic network.
During April, volcanic earthquakes and gas-and-steam and ash emissions were reported from the cone in Lake Voui. VMGD reported that activity increased during 5-7 April; high gas-and-steam and ash plumes were visible, accompanied by nighttime incandescence. According to a Wellington VAAC report, a low-level ash plume rose as high as 2.5 km above the summit and drifted W and SW on 5 April, based on satellite imagery. Reports in Saratamata stated that a dark ash plume drifted to the WSW, but no loud explosion was heard. Webcam images from 2100 showed incandescence above the crater and reflected in the clouds. According to an aerial survey, field observations, and satellite data, water was no longer present in the lake. A lava flow was reported effusing from the vent and traveling N into the dry Lake Voui, which lasted three days. The next morning at 0745 on 6 April a gas-and-steam and ash plume rose 5.4 km above the summit and drifted ESE, based on information from VMGD (figure 101). The Wellington VAAC also reported that light ashfall was observed on the island. Intermittent gas-and-steam and ash emissions were visible on 7 April, some of which rose to an estimated 3 km above the summit and drifted E. Webcam images during 0107-0730 on 7 April showed continuing ash emissions. A gas-and-steam and ash plume rose 695 m above the summit crater at 0730 on 19 April and drifted ESE, based on a webcam image (figure 102).
According to visual and infrared satellite data, water was visible in Lake Voui as late as 24 March 2023 (figure 103). The vent in the caldera showed a gas-and-steam plume drifted SE. On 3 April thermal activity was first detected, accompanied by a gas-and-ash plume that drifted W (figure 103). The lava flow moved N within the dry lake and was shown cooling by 8 April. By 23 April much of the water in the lake had returned. Occasional sulfur dioxide plumes were detected by the TROPOMI instrument on the Sentinel-5P satellite that exceeded 2 Dobson Units (DU) and drifted in different directions (figure 104).
Geologic Background. The island of Ambae, also known as Aoba, is a massive 2,500 km3 basaltic shield that is the most voluminous volcano of the New Hebrides archipelago. A pronounced NE-SW-trending rift zone with numerous scoria cones gives the 16 x 38 km island an elongated form. A broad pyroclastic cone containing three crater lakes (Manaro Ngoru, Voui, and Manaro Lakua) is located at the summit within the youngest of at least two nested calderas, the largest of which is 6 km in diameter. That large central edifice is also called Manaro Voui or Lombenben volcano. Post-caldera explosive eruptions formed the summit craters about 360 years ago. A tuff cone was constructed within Lake Voui (or Vui) about 60 years later. The latest known flank eruption, about 300 years ago, destroyed the population of the Nduindui area near the western coast.
Information Contacts: Geo-Hazards Division, Vanuatu Meteorology and Geo-Hazards Department (VMGD), Ministry of Climate Change Adaptation, Meteorology, Geo-Hazards, Energy, Environment and Disaster Management, Private Mail Bag 9054, Lini Highway, Port Vila, Vanuatu (URL: http://www.vmgd.gov.vu/, https://www.facebook.com/VanuatuGeohazardsObservatory/); Wellington Volcanic Ash Advisory Centre (VAAC), Meteorological Service of New Zealand Ltd (MetService), PO Box 722, Wellington, New Zealand (URL: http://www.metservice.com/vaac/, http://www.ssd.noaa.gov/VAAC/OTH/NZ/messages.html); MIROVA (Middle InfraRed Observation of Volcanic Activity), a collaborative project between the Universities of Turin and Florence (Italy) supported by the Centre for Volcanic Risk of the Italian Civil Protection Department (URL: http://www.mirovaweb.it/); Global Sulfur Dioxide Monitoring Page, Atmospheric Chemistry and Dynamics Laboratory, NASA Goddard Space Flight Center (NASA/GSFC), 8800 Greenbelt Road, Goddard, Maryland, USA (URL: https://so2.gsfc.nasa.gov/); Copernicus Browser, Copernicus Data Space Ecosystem, European Space Agency (URL: https://dataspace.copernicus.eu/browser/).
Search Bulletin Archive by Publication Date
Select a month and year from the drop-downs and click "Show Issue" to have that issue displayed in this tab.
The default month and year is the latest issue available.
Bulletin of the Global Volcanism Network - Volume 45, Number 01 (January 2020)
Managing Editor: Edward Venzke
Aira (Japan)
Ongoing explosions with ejecta and ash plumes, along with summit incandescence, during July-December 2019
Asosan (Japan)
Intermittent ash plumes and elevated SO2 emissions continue during July-December 2019
Chillan, Nevados de (Chile)
Many explosions, ash plumes, lava and pyroclastic flows June-December 2019
Erebus (Antarctica)
Lava lakes persist through 2019
Ibu (Indonesia)
Frequent ash plumes and small lava flows in the crater through December 2019
Kadovar (Papua New Guinea)
Frequent gas and some ash emissions during May-December 2019 with some hot avalanches
Ruiz, Nevado del (Colombia)
Intermittent ash, gas-and-steam, and SO2 plumes, and thermal anomalies during January 2018-December 2019
Sangay (Ecuador)
Continuing ash emissions, lava flows, pyroclastic flows, and lahars through December 2019
Suwanosejima (Japan)
Explosions, ash emissions, and summit incandescence in July-December 2019
Tinakula (Solomon Islands)
Intermittent thermal activity suggests ongoing eruption, July-December 2019
Aira
Japan
31.5772°N, 130.6589°E; summit elev. 1117 m
All times are local (unless otherwise noted)
Ongoing explosions with ejecta and ash plumes, along with summit incandescence, during July-December 2019
Sakurajima is a highly active stratovolcano situated in the Aira caldera in southern Kyushu, Japan. Common volcanism for this recent eruptive episode since March 2017 includes frequent explosions, ash plumes, and scattered ejecta. Much of this activity has been focused in the Minamidake crater since 1955; the Showa crater on the E flank has had intermittent activity since 2006. This report updates activity during July through December 2019 with the primary source information from monthly reports by the Japan Meteorological Agency (JMA) and various satellite data.
During July to December 2019, explosive eruptions and ash plumes were reported multiple times per week by JMA. November was the most active, with 137 eruptive events, seven of which were explosive while August was the least active with no eruptive events recorded (table 22). Ash plumes rose between 800 m to 5.5 km above the crater rim during this reporting period. Large blocks of incandescent ejecta traveled as far as 1.7 km from the Minamidake crater during explosions in September through December. The Kagoshima Regional Meteorological Observatory (11 km WSW) reported monthly amounts of ashfall during each month, with a high of 143 g/m2 during October. Occasionally at night throughout this reporting period, crater incandescence was observed with a highly sensitive surveillance camera. All explosive activity originated from the Minamidake crater; the adjacent Showa crater produced mild thermal anomalies and gas-and-steam plumes.
Table 22. Monthly summary of eruptive events recorded at Sakurajima's Minamidake crater in the Aira caldera, July through December 2019. The number of events that were explosive in nature are in parentheses. No events were recorded at the Showa crater during this time. Ashfall is measured at the Kagoshima Local Meteorological Observatory (KLMO), 10 km W of Showa crater. Data courtesy of JMA (July to December 2019 monthly reports).
| Month |
Ash emissions (explosive) |
Max plume height above crater |
Max ejecta distance from crater |
Total amount of ashfall (g/m2) |
| Jul 2019 |
9 (5) |
3.8 km |
1.1 km |
-- |
| Aug 2019 |
-- |
800 m |
-- |
2 |
| Sep 2019 |
32 (11) |
3.4 km |
1.7 km |
115 |
| Oct 2019 |
62 (41) |
3.0 km |
1.7 km |
143 |
| Nov 2019 |
137 (77) |
5.5 km |
1.7 km |
69 |
| Dec 2019 |
71 (49) |
3.3 km |
1.7 km |
54 |
An explosion that occurred at 1044 on 4 July 2019 produced an ash plume that rose up to 3.2 km above the Minamidake crater rim and ejected material 1.1 km from the vent. Field surveys conducted on 17 and 23 July measured SO2 emissions that were 1,200-1,800 tons/day. Additional explosions between 19-22 July generated smaller plumes that rose to 1.5 km above the crater and ejected material 1.1 km away. On 28 July explosions at 1725 and 1754 produced ash plumes 3.5-3.8 km above the crater rim, which resulted in ashfall in areas N and E of Sakurajima (figure 86), including Kirishima City (20 km NE), Kagoshima Prefecture (30 km SE), Yusui Town (40 km N), and parts of the Kumamoto Prefecture (140 km NE).
The month of August 2019 showed the least activity and consisted of mainly small eruptive events occurring up to 800 m above the crater; summit incandescence was observed with a highly sensitive surveillance camera. SO2 emissions were measured on 8 and 13 August with 1,000-2,000 tons/day, which was slightly greater than the previous month. An extensometer at the Arimura Observation Tunnel and an inclinometer at the Amida River recorded slight inflation on 29 August, but continuous GNSS (Global Navigation Satellite System) observations showed no significant changes.
In September 2019 there were 32 eruptive events recorded, of which 11 were explosions, more than the previous two months. Seismicity also increased during this month. An extensometer and inclinometer recorded inflation at the Minamidake crater on 9 September, which stopped after the eruptive events. On 16 September, an eruption at 0746 produced an ash plume that rose 2.8 km above the crater rim and drifted SW; a series of eruptive events followed from 0830-1110 (figure 87). Explosions on 18 and 20 September produced ash plumes that rose 3.4 km above the crater rim and ejecting material as far as 1.7 km from the summit crater on the 18th and 700 m on the 20th. Field surveys measured an increased amount of SO2 emissions ranging from 1,100 to 2,300 tons/day during September.
Seismicity, SO2 emissions, and the number of eruptions continued to increase in October 2019, 41 of which were explosive. Field surveys conducted on 1, 11, and 15 October reported that SO2 emissions were 2,000-2,800 tons/day. An explosion at 0050 on 12 October produced an ash plume that traveled 1.7 km from the Minamidake crater. Explosions between 16 and 19 October produced an ash plume that rose up to 3 km above the crater rim (figure 88). The Japan Maritime Self-Defense Force 1st Air group observed gas-and-steam plumes rising from both the Minamidake and Showa craters on 25 October. The inflation reported from 16 September began to slow in late October.
November 2019 was the most active month during this reporting period with increased seismicity, SO2 emissions, and 137 eruptive events, 77 of which were explosive. GNSS observations indicated that inflation began to slow during this month. On 8 November, an explosion at 1724 produced an ash plume up to a maximum of 5.5 km above the crater rim and drifted E. This explosion ejected large blocks as far as 500-800 m away from the crater (figure 89). The last time plumes rose above 5 km from the vents occurred on 26 July 2016 at the Showa crater and on 7 October 2000 at the Minamidake crater. Field surveys on 8, 21, and 29 November measured increased SO2 emissions ranging from 2,600 to 3,600 tons/day. Eruptions between 13-19 November produced ash plumes that rose up to 3.6 km above the crater and ejected large blocks up 1.7 km away. An onsite survey on 29 November used infrared thermal imaging equipment to observe incandescence and geothermal areas near the Showa crater and the SE flank of Minamidake (figure 90).
Volcanism, which included seismicity, SO2 emissions, and eruptive events, decreased during December 2019. Explosions during 4-10 December produced ash plumes that rose up to 2.6 km above the crater rim and ejected material up to 1.7 km away. Field surveys conducted on 6, 16, and 23 December measured SO2 emissions around 1,000-3,000 tons/day. On 24 December, an explosion produced an ash plume that rose to 3.3 km above the crater rim, this high for this month.
Sentinel-2 natural color satellite imagery showed dense ash plumes in late August 2019, early November, and through December (figure 91). These plumes drifted in different directions and rose to a maximum 5.5 km above the crater rim on 8 November.
MIROVA (Middle InfraRed Observation of Volcanic Activity) analysis of MODIS satellite data showed intermittent thermal anomalies beginning in mid-August to early September 2019 after a nearly two-month hiatus (figure 92). Activity increased by early November and continued through December. Three Sentinel-2 thermal satellite images between late July and early October showed distinct thermal hotspots within the Minamidake crater, in addition to faint gas-and-steam emissions in July and September (figure 93).
Geologic Background. The Aira caldera in the northern half of Kagoshima Bay contains the post-caldera Sakurajima volcano, one of Japan's most active. Eruption of the voluminous Ito pyroclastic flow accompanied formation of the 17 x 23 km caldera about 22,000 years ago. The smaller Wakamiko caldera was formed during the early Holocene in the NE corner of the caldera, along with several post-caldera cones. The construction of Sakurajima began about 13,000 years ago on the southern rim and built an island that was joined to the Osumi Peninsula during the major explosive and effusive eruption of 1914. Activity at the Kitadake summit cone ended about 4,850 years ago, after which eruptions took place at Minamidake. Frequent eruptions since the 8th century have deposited ash on the city of Kagoshima, located across Kagoshima Bay only 8 km from the summit. The largest recorded eruption took place during 1471-76.
Information Contacts: Japan Meteorological Agency (JMA), 1-3-4 Otemachi, Chiyoda-ku, Tokyo 100-8122, Japan (URL: http://www.jma.go.jp/jma/indexe.html); MIROVA (Middle InfraRed Observation of Volcanic Activity), a collaborative project between the Universities of Turin and Florence (Italy) supported by the Centre for Volcanic Risk of the Italian Civil Protection Department (URL: http://www.mirovaweb.it/); Sentinel Hub Playground (URL: https://www.sentinel-hub.com/explore/sentinel-playground); Weathernews Inc. (Twitter: @wni_jp, https://twitter.com/wni_jp, URL: https://weathernews.jp/s/topics/201608/210085/, photo posted at https://twitter.com/wni_jp/status/1173382407216652289); Bradley Pitcher, Vanderbilt University, Nashville. TN, USA (URL: https://bradpitcher.weebly.com/, Twitter: @TieDyeSciGuy, photo posted at https://twitter.com/TieDyeSciGuy/status/1185191225101471744); Geoscientific Network of Chile (Twitter: @RedGeoChile, https://twitter.com/RedGeoChile, Facebook: https://www.facebook.com/RedGeoChile/, photo posted at https://twitter.com/RedGeoChile/status/1192921768186515456).
Asosan
Japan
32.8849°N, 131.085°E; summit elev. 1592 m
All times are local (unless otherwise noted)
Intermittent ash plumes and elevated SO2 emissions continue during July-December 2019
The large Asosan caldera reaches around 23 km long in the N-S direction and contains a complex of 17 cones, of which Nakadake is the most active (figure 58). A recent increase in activity prompted an alert level increase from 1 to 2 on 14 April 2019. The Nakadake crater is the site of current activity (figure 59) and contains several smaller craters, with the No. 1 crater being the main source of activity during July-December 2019. The activity during this period is summarized here based on reports by the Japan Meteorological Agency and satellite data.
Small explosions were observed at the No. 1 vent on the 4, 5, 9, 13-16, and 26 July. There was an increase in thermal energy detected near the vent leading to a larger event on the 26th (figures 60 and 61), which produced an ash plume up to 1.6 km above the crater rim and continuing from 0757 to around 1300 with a lower plume height of 400 m after 0900. Light ashfall was reported downwind. Elevated activity was noted during 28-29 July, and an ash plume was seen in webcam footage on the 30th. Incandescence was visible in light-sensitive cameras during 4-17 and after the 26th. A field survey on 5 July measured 1,300 tons of sulfur dioxide (SO2) per day. This had increased to 2,300 tons per day by the 12th, 2,500 on the 24th, and 2,400 by the 25th. A sulfur dioxide plume was detected in Sentinel-5P/TROPOMI satellite data acquired on 28 July (figure 62).
The increased eruptive activity that began on 5 July continued to 16 August. There were 24 eruptions recorded throughout the month, with eruptions occurring on 18-23, 25, and 29-31 August. An ash plume at 2100 on 4 August reached 1.5 km above the crater rim. Detected SO2 increased to extremely high levels from late July to early August with 5,200 tons per day recorded on 9 August, but which then reduced to 2,000 tons per day. Ashfall occurred out to around 7 km NW on the 10th (figure 63). Activity continued to increase at the Nakadake No. 1 crater, producing incandescence. High-temperature gas plumes were detected at the No. 2 crater.
Thermal activity continued to increase, and incandescence was observed at the No. 1 crater throughout September. There were 24 eruptions recorded throughout August. Light ashfall occurred out to around 8 km NE on the 3rd and ash plumes reached 1.6 km above the crater rim during 10-13, and again during 25-30 (figures 64 and 65). During the later dates ashfall was reported to the NE and NW. The SO2 levels were back down to 1,600 tons per day by 11 September and increased to 2,600 tons per day by the 26th.
Similar elevated activity continued through October with ash plumes reaching 1.3 km above the crater and periodic ashfall reported at the Kumamoto Regional Meteorological Observatory, and out to 4 km S to SW on the 19th and 29th. Temperatures up to 580°C were recorded at the No. 1 crater on 23 October and incandescence was occasionally visible at night through the month (figure 66). Gas surveys detected 2,800 tons per day of SO2 on 7 October, which had increased to 4,000 tons per day by the 11th.
Ash plume emission continued through November (figure 67 and 68). Plumes reached 1.5 to 2.4 km above sea level during 13-18 November and ashfall occurred downwind, with a maximum of 1.4 km above the crater rim for the month. Ashfall was reported near Aso City Hall on the 27th. Incandescence was observed until 6 November. During the first half of October sulfur dioxide emissions were slightly lower than the previous month, with measurements detecting under 3,000 tons per day. In the second half of the month emissions increased to 2,000 to 6,300 tons per day. This was accompanied by an increase in volcanic tremor.
Throughout December activity remained elevated with ash plumes reaching 1.1 km above the Nakadake No. 1 crater and producing ashfall. The maximum gas plume height was 1.8 km above the crater. A total of 23 eruptions were recorded, and incandescence at the crater was observed through the month. Sulfur dioxide emissions continued to increase with 5,800 tons per day recorded on the 27th, and 7,400 tons per day recorded on the 31st.
Overall, eruptive activity has continued intermittently since 26 July and SO2 emissions have increased through the year. Incandescence was seen at the crater since 2 October and this is consistent with an increase in thermal energy detected by the MIROVA algorithm around that time (figure 69).
Geologic Background. The 24-km-wide Asosan caldera was formed during four major explosive eruptions from 300,000 to 90,000 years ago. These produced voluminous pyroclastic flows that covered much of Kyushu. The last of these, the Aso-4 eruption, produced more than 600 km3 of airfall tephra and pyroclastic-flow deposits. A group of 17 central cones was constructed in the middle of the caldera, one of which, Nakadake, is one of Japan's most active volcanoes. It was the location of Japan's first documented historical eruption in 553 CE. The Nakadake complex has remained active throughout the Holocene. Several other cones have been active during the Holocene, including the Kometsuka scoria cone as recently as about 210 CE. Historical eruptions have largely consisted of basaltic to basaltic-andesite ash emission with periodic strombolian and phreatomagmatic activity. The summit crater of Nakadake is accessible by toll road and cable car, and is one of Kyushu's most popular tourist destinations.
Information Contacts: Japan Meteorological Agency (JMA), 1-3-4 Otemachi, Chiyoda-ku, Tokyo 100-8122, Japan (URL: http://www.jma.go.jp/jma/indexe.html); Global Sulfur Dioxide Monitoring Page, Atmospheric Chemistry and Dynamics Laboratory, NASA Goddard Space Flight Center (NASA/GSFC), 8800 Greenbelt Road, Goddard, Maryland, USA (URL: https://so2.gsfc.nasa.gov/); MIROVA (Middle InfraRed Observation of Volcanic Activity), a collaborative project between the Universities of Turin and Florence (Italy) supported by the Centre for Volcanic Risk of the Italian Civil Protection Department (URL: http://www.mirovaweb.it/); Planet Labs, Inc. (URL: https://www.planet.com/); Mizumoto, Kumamoto, Kyushu, Japan (Twitter: https://twitter.com/hepomodeler); Volcanoverse (URL: https://www.youtube.com/channel/UCi3T_esus8Sr9I-3W5teVQQ).
Nevados de Chillan (Chile) — January 2020 Cite this Report
Nevados de Chillan
Chile
36.868°S, 71.378°W; summit elev. 3180 m
All times are local (unless otherwise noted)
Many explosions, ash plumes, lava and pyroclastic flows June-December 2019
Nevados de Chillán is a complex of late-Pleistocene to Holocene stratovolcanoes in the Chilean Central Andes. An eruption started with a phreatic explosion and ash emission on 8 January 2016 from a new crater (Nicanor) on the E flank of the Nuevo crater, which lies on the NW flank of the cone of the large stratovolcano referred to as Volcán Viejo. Strombolian explosions and ash emissions continued throughout 2016 and 2017; a lava dome within the Nicanor crater was confirmed in early January 2018. Explosions and pyroclastic flows continued during 2018 and the first half of 2019. This report covers continuing activity from June-December 2019 when ongoing explosive events produced ash plumes, lava, and pyroclastic flows. Information for this report is provided primarily by Chile's Servicio Nacional de Geología y Minería (SERNAGEOMIN)-Observatorio Volcanológico de Los Andes del Sur (OVDAS), and by the Buenos Aires Volcanic Ash Advisory Center (VAAC).
Nevados de Chillán was relatively quiet during June 2019, generating only a small number of explosions with ash plumes. This activity continued during July; some events produced incandescent ejecta around the crater. By August a distinct increase in activity was noticeable; ash plumes were larger and more frequent, and incandescent ejecta rose hundreds of meters above the summit a number of times. Frequent explosions were typical during September; the first of several blocky lava flows emerged from the crater mid-month. Inflation that began in mid-July continued with several centimeters of both horizontal and vertical displacement. By October, pyroclastic flows often accompanied the explosive events in addition to the ash plumes, and multiple vents opened within the crater. Three more lava flows had appeared by mid-November; explosions continued at a high rate. Activity remained high at the beginning of December but dropped abruptly mid-month. MODVOLC measured three thermal alerts in September, two in October, seven in November, and six in December. This period of increased thermal activity closely matches the thermal anomaly data reported by the MIROVA project (figure 37), which included an increase at the end of August 2019 that lasted through mid-December before stopping abruptly. Several lava flows and frequent explosions with incandescent ejecta and pyroclastic flows were reported throughout the period of increased thermal activity.
Activity during June-August 2019. Nevados de Chillán remained relatively quiet during June 2019 with a few explosions of ash. At the active Nicanor crater, located on the E flank of the Volcán Nuevo dome, predominantly white steam plumes were observed daily in the nearby webcams. The growth rate of the dome inside the crater was reported by SERNAGEOMIN as continuing at about 260 m3/day. They noted an explosion on 3 June; the Buenos Aires VAAC reported a puff of ash seen from the webcam drifting SE at 3.7 km altitude (figure 38). The webcam indicated sporadic weak emissions continuing that day and the next. Minor explosions were also reported on 7-8 June and included incandescence observed at night and ejecta deposited around the crater rim. The Buenos Aires VAAC reported a narrow ash plume drifting ENE in multispectral imagery under clear skies late on 7 June. The webcams showed sporadic emissions of ash at 3.4 km altitude on 19 June that dissipated rapidly.
Minor pulsating explosive activity continued during July 2019 with multiple occurrences of ash emissions. Ash emissions rose to 3.7 km altitude on 4 July and were seen in the SERNAGEOMIN webcam; the VAAC reported an emission on 8 July that rose to 4.3 km altitude and drifted SE. Monitoring stations near the complex recorded an explosive event early on 9 July; incandescence with gases and ejecta were deposited around the crater and an ash plume rose to 3.9 km and drifted SE. Small ash plumes from sporadic puffs on 12 July rose to 4.6 km altitude. An explosive event on 14 July also produced incandescent ejecta around the crater along with weak sporadic ash emissions. Single ash emissions on 18 (figure 39) and 22 July at 3.7 km altitude drifted ESE from summit before dissipating; another emission on 26 July was reported at 4.3 km altitude.
A distinct increase in the intensity and frequency of explosive activity was recorded during August 2019. SERNAGEOMIN noted ash emissions and explosions during 3-4 August in addition to the persistent steam plumes above the Nicanor crater (figure 40). The Buenos Aires VAAC reported a single puff on 3 August that was seen in the webcam rising to 3.9 km altitude and dissipating quickly. The next day a pilot reported an ash plume estimated at 5.5 km altitude drifting E. It was later detected in satellite imagery; the webcam revealed continuous emission of steam and gas with intermittent puffs of ash. SERNAGEOMIN issued a special report (REAV) on 6 August noting the increase in size and frequency of explosions, some of which produced dense ash plumes that rose 1.6 km above the crater along with incandescent ejecta. They also reported that satellite imagery indicated a 1.5-km-long lahar that traveled down the NNE flank as a result of the interaction of the explosive ejecta with the snowfall near the summit.
Beginning on 9-10 August 2019, and continuing throughout the month, SERNAGEOMIN observed explosive nighttime activity with incandescent ejecta scattered around the crater rim along with moderate levels of seismicity each day. A diffuse ash plume was detected in satellite imagery by the VAAC on 9 August drifting NW at 4.9 km altitude. SERNAGEOMIN issued a new warning on 12-13 August that the recent increase in activity since the end of July suggested the injection of a new magmatic body that could lead to larger explosive events with pyroclastic and lava flows. They reported pyroclastic ejecta from multiple explosions on 13 August rising 765 and 735 m above the crater. Drone images taken between 4 and 12 August showed the destruction of the summit dome from multiple explosions with the Nicanor Crater (figure 41). The VAAC reported sporadic pulses of volcanic ash drifting N during 12-14 August, visible in satellite imagery estimated at 4.3 km altitude. By 17-18 August, they noted constant steam emissions interspersed with gray plumes during explosive activity.
An increase in seismicity, especially VT events, during 21-22 August 2019 resulted in multiple special REAV reports from SERNAGEOMIN. They noted on 21 August that an explosion produced gas emissions and pyroclastic material that rose 1,400 m above the crater; the next day material rose 450 m. That night, in addition to incandescent ejecta around the crater, they reported small high-temperature flows on the N flank which extended to the NNE flank a few days later. The VAAC reported pulses of ash plumes moving SE on 22 August at 4.3 km altitude. A faint ash cloud was visible in satellite imagery on 29 August drifting E at 3.7 km altitude (figure 42). The cloud was dissipating rapidly as it moved away from the summit. Sporadic ash emissions from intermittent explosions continued moving ESE then N and NE; they were reported daily through 5 September. They continued to rise in altitude to 3.9 km on 30 August, 4.3 km on 1 September, and 4.6 km on 3 September.
Activity during September-October 2019. Frequent explosions from Nicanor crater continued during September 2019, producing numerous ash plumes and small high-temperature flows along the NNE flank. A webcam detected a small lateral vent on the NNE flank about 50 m from the crater rim emitting gas and particulates on 2-3 September. Multiple explosions during 3-5 September were associated with gas and ash emissions and incandescent ejecta deposited around the crater rim (figure 43). The network of GNSS stations recording deformation of the volcanic complex confirmed on 3-4 September that inflation, which had been recorded since mid-July 2019, was continuing at a rate of about 1 cm/month. Blocks of incandescent ejecta from numerous explosions were observed rolling down the N flank on 6-7 September and the E flank the following night.
SERNAGEOMIN reported on 9-10 September that satellite imagery revealed a new surface deposit about 130 m long trending NNE from the center of crater. They reported an increase in the level of seismicity from moderate to high on 10-11 September and observed incandescent ejecta at the summit during several explosions (figure 44). During a flyover on 12 September scientists confirmed the presence of a new blocky lava flow emerging from Nicanor Crater and moving down the NNE flank of Nuevo volcano. The flow was about 600 m long, 100 m wide, and 5 m thick with a blocky surface and incandescent lava at the base within the active crater. Measurements with a thermal camera indicated a temperature around 800°C within the active crater, and greater than 100°C on the surface of the flow. Frequent high-energy explosions that day produced incandescent ejecta that could be seen from Las Trancas and Shangri-La (figure 45). Ashfall 0.5 cm thick was reported 2 km from the volcano to the SW. The flow was visible from the webcam located N of Nicanor on 16-17 September. Satellite imagery indicated the flow was about 550 m long and moving at a rate of about 21 m/day.
During 18-22 September 2019 multiple special reports of seismicity were released each day with incandescent ejecta, gas, and particulate emissions often observed at the summit crater; the lava flow remained active. On 24 September ashfall was reported about 15 km NW in communities including Las Trancas; small pyroclastic flows were observed the following day. Horizontal inflation of 2.4 cm was reported on 25 September, and vertical inflation was measured at 3.4 cm since mid-July. SERNAGEOMIN noted that while the frequency of explosions had increased, the energy released had decreased. Morphological changes in Nicanor crater suggested that it was growing at its SW edge and eroding the adjacent Arrau crater; the NE edge of the crater was unstable.
Plumes of steam and ash continued along with the explosions for the remainder of the month. During the night, incandescent ejecta was observed, and the low-velocity lava flow continued to move. Multiple VAAC reports were issued virtually every day of September. Pulses of ash were moving SE at 4.3 km altitude on 7-8 September. For most of the rest of the month sporadic emissions with minor amounts of ash were observed in either the webcam or satellite images at an altitude of 3.7 km, occasionally rising to 4.3 km. They drifted generally SE but varied somewhat with the changing winds. Continuous ash emissions were observed during 24-25 September that rose as high as 4.9 km altitude and drifted E, clearly visible in satellite imagery. After that, the altitude dropped back to 3.7 km and the plume was only faintly and intermittently visible in satellite imagery.
Low-altitude gray ash plumes were observed rising from Nicanor crater almost every day that weather permitted during October 2019. Incandescent ejecta was frequently observed at night. Beginning on 6-7 October, SERNAGEOM reported pyroclastic flows traveling short distances from the crater most days. They traveled 1.13 km down the NNE flank, 0.42 km down the NNW flank and 0.88 km down the SW flank. The blocky lava flow on the NNE flank was no longer active (figure 46). During 9-12 October, multiple special reports of increased seismic activity (REAVs) were issued each day. Inflation continued throughout the month. On 10 October the total horizontal deformation (since mid-July) was 3 cm, with a rate of movement a little over 1 cm/month; the total vertical displacement was 4.5 cm, with a rate of 1.93 cm/month during the previous 30 days.
In a special report issued on 11 October, SERNAGEOMIN mentioned that analysis of satellite imagery indicated a new emission center within the Nicanor crater adjacent to the dome vent active since December 2017 and to the lava flow of September. The new center was oval shaped with an E-W dimension of 60 m and a N-S dimension of 55 m, located about 90 m SE of the old, still active center, and was the site of the explosive activity reported since 30 September.
On 16 October a new blocky flow was observed on the NE flank of the Nicanor Crater; it was about 70 m long, moving about 30 m/day. By 21 October it had reached 130 m in length, and its rate of advance had slowed significantly. Beginning on 25 October seismicity decreased noticeably and much less surface activity was observed at the crater. Explosions at the end of the month produced steam plumes, gas emissions and minor pulsating ash emissions.
The Buenos Aires VAAC reported a puff of ash at 4.9 km altitude on 1 October moving SE. Continuous emission of steam and gas with sporadic puffs of ash that rose to around 3.7-4.3 km altitude were typical every day after that until 25 October usually drifting S or E; they were most often visible in the webcams, and occasionally visible in satellite imagery when weather conditions permitted. A diffuse plume of ash was detected on 16 October drifting SE at 4.6 km altitude. The VAAC reported incandescence visible at the summit in webcam images on 22 October; a significant daytime explosion on 24 October produced a large incandescent ash cloud (figure 47). The next day the VAAC detected weak pulses of ash plumes in satellite images extending E from the summit for 130 km. Intermittent ash emissions were reported drifting SE at 3.7-4.3 km each day from 29-31 October.
Activity during November-December 2019. Moderate seismicity continued during November 2019 with recurrent episodes of pulsating gas and ash emissions. Incandescent ejecta was visible many nights that the weather conditions were favorable (figure 48). In the Daily Report (RAV) issued on 6 November, SERNAGEOMIN noted that the original 700-m-long blocky lava flow on the NNE flank active during September had been partly covered by another flow, about 350 m long. They also reported that pyroclastic density currents were observed in the area immediately around the crater extending in several directions. They extended 850 m down the SW flank, 670 m down the NW flank, 1,680 m down the N flank, and 440 m to the NNE.
Changes in the crater area indicated a growth of the SW edge of the Nicanor Crater, continuing to erode the Arrau crater, with the constant emission of gas, ash, and incandescent ejecta that produced plumes up to 1.8 km high. SERNAGEOMIN also observed activity from a vent at the NE edge of the crater that included gas emission and ejecta, but no lava flow. The fourth lava flow observed in recent months (L4) was identified on the NNE slope on 13 November adjacent to the earlier flows; it was about 70 m long and slowly advancing. By 19 November L4 consisted of two lobes and extended about 90 m from the edge of the Nicanor crater advancing at an average rate of 0.4 m/hour. The vent producing L4 was located about 60 m SSE of the vent that produced the earlier flows (L1, L2, and L3). By 28 November the flow had reached a length of 165 m and was no longer advancing. A series of explosions reported on 25-27 and 30 November produced ejecta that rose 800, 1,000, 1,300, and 700 m above the crater.
Ash emissions were reported by the Buenos Aires VAAC during most of November, usually visible from the webcams, but often also seen in satellite imagery. The plumes generally reached 3.7-4.6 km altitude and drifted SSE. They usually occurred as continuous emission of steam and gas accompanied by sporadic pulses of ash but were sometimes continuous ash for several hours. They were visible about 100 km E of the summit on 2 November, and over 200 km SE the following day. A narrow plume of ash was seen in visual satellite imagery extending 50 km E of the summit on 9 November. Intermittent incandescence at the summit was seen from the webcam on 18 November. Pulses of ash were detected in satellite imagery extending 125 km SE on 22 November. Strong puffs of ash briefly rose to 4.9 km altitude and drifted NE on 26 November (figure 49); incandescence during the nighttime was visible in the webcam on 28 November.
Pulsating emissions of gas and ejecta continued into December 2019. Five explosions were reported on 1 December that produced gas plumes which rose 300-800 m above the crater. Three more explosions occurred on 3 December sending gas plumes 500-1,000 m high. SERNAGEOMIN reported on 4 December that explosive activity was observed from four vents within the Nicanor crater. This activity triggered new pyroclastic flows that extended 1,100 m E and 400 m S. By 5 December the total vertical inflation reported since July was 8 cm. A large explosion on 5 December sent material 1.6 km above the summit and pyroclastic flows down the flanks (figure 50). The webcams at Andarivel and Portezuelo showed a pyroclastic flow moving 400 m W, a direction not previously observed; this was followed by additional pyroclastic flows to the N and E.
On 9 December SERNAGEOMIN noted that the increase to four active vents was causing erosion on the S and SE edges of the crater making the most affected areas to the SW, S, SE and E of the crater. Major explosions reported that day produced pyroclastic flows that descended down the E and ESE flanks and particulate emissions that rose 1 km. The SW flank near the crater was also affected by ejecta and pyroclastic debris carried by the wind. The most extensive pyroclastic flows travelled down the E flank for the next several days; explosions on 10 December sent material 1.2 km high. Three explosions were noted on 11 December; the first sent incandescence close to 200 m high, and the second produced a column of particulate material 1.2 km high. The first of two explosions on 12 December sent material 1.8 km above the crater and pyroclastic flows down the flanks (figure 51). Although explosions were reported on 13 and 14 December, cloudy skies prevented observations of the summit.
Intermittent ash emissions were reported by the Buenos Aires VAAC during 1-13 December 2019. They rose to 3.7-4.3 km and drifted generally E. Pulses of ash were detected at 4.9 km altitude moving S in satellite imagery on 9 December. The last reported ash emission for December was on the afternoon of 12 December; puffs of ash could be seen in satellite imagery moving E at 4.6 km altitude. A decrease in particulate emissions and explosions was reported beginning on 14 December, and no further explosions were recorded by infrasound devices after 15 December. The deposits from the earlier pyroclastic flows had reached 600 m E and 300 m W of the crater. Seismic activity was recorded as low instead of moderate beginning on 25 December. A total horizontal inflation of about 6 cm since July was measured at the end of December.
Geologic Background. The compound volcano of Nevados de Chillán is one of the most active of the Central Andes. Three late-Pleistocene to Holocene stratovolcanoes were constructed along a NNW-SSE line within three nested Pleistocene calderas, which produced ignimbrite sheets extending more than 100 km into the Central Depression of Chile. The dominantly andesitic Cerro Blanco (Volcán Nevado) stratovolcano is located at the NW end of the massif. Volcán Viejo (Volcán Chillán), which was the main active vent during the 17th-19th centuries, occupies the SE end. The Volcán Nuevo lava-dome complex formed during 1906-1945 on the NW flank of Viejo. The Volcán Arrau dome complex was then constructed on the SE side of Volcán Nuevo between 1973 and 1986, and eventually exceeded its height. Smaller domes or cones are present in the 5-km valley between the two major edifices.
Information Contacts: Servicio Nacional de Geología y Minería (SERNAGEOMIN), Observatorio Volcanológico de Los Andes del Sur (OVDAS), Avda Sta María No. 0104, Santiago, Chile (URL: http://www.sernageomin.cl/), Twitter: @Sernageomin; Hawai'i Institute of Geophysics and Planetology (HIGP) - MODVOLC Thermal Alerts System, School of Ocean and Earth Science and Technology (SOEST), Univ. of Hawai'i, 2525 Correa Road, Honolulu, HI 96822, USA (URL: http://modis.higp.hawaii.edu/); MIROVA (Middle InfraRed Observation of Volcanic Activity), a collaborative project between the Universities of Turin and Florence (Italy) supported by the Centre for Volcanic Risk of the Italian Civil Protection Department (URL: http://www.mirovaweb.it/); Cristian Farias Vega, Departamento de Obras Civiles y Geología, Universidad Católica de Temuco, Vilcún, Región de La Araucanía, Chile (URL: https://twitter.com/cfariasvega/status/1187471827255226370); Copernicus Emergency Management Service (Copernicus EMS), Joint Research Centre, European Union (URL: https://emergency.copernicus.eu/, https://twitter.com/CopernicusEMS/status/1168156474817818624); Volcanes de Chile, Proyectos de la Fundación Volcanes de Chile, Chile (URL: https://www.volcanesdechile.net/, https://twitter.com/volcanesdechile/status/1199496839491395585); Pehuenia Online, Pehuenia, Argentina (URL: http://pehueniaonline.com.ar/, https://twitter.com/PehueniaOnline/status/1135703309824745472); Eco Bio Bio La Red Informativa, Bio Bio Region, Chile (URL: http://emergenciasbiobio.blogspot.com/, https://twitter.com/Eco_BioBio_II/status/1141734238590574593); INF0SCHILE (URL: https://twitter.com/INF0SCHILE/status/1151849611482599425); Radio Ñuble AM y FM, Chillán, Chile (URL: http://radionuble.cl/linea/, lhttps://twitter.com/RadioNuble/status/1151858189299781632); CHV Noticias, Santiago, Chile (URL: https://www.chvnoticias.cl/, https://twitter.com/CHVNoticias/status/1159263718015819777); Movisis.org Internacional, Manabi, Ecuador (URL: https://movisis.org/, https://twitter.com/MOVISISEC/status/1160778823031558144); Carlos Bustos (URL: https://twitter.com/cbusca1970/status/1168932243873644548); EarthQuakesTime (URL: https://twitter.com/EarthQuakesTime/status/1171654504841908229); Red Geocientifica de Chile (URL: https://twitter.com/RedGeoChile/status/1171972482875703296); American Earthquakes (URL: https://twitter.com/earthquakevt/status/1172271139760091136); PatoArias, Talca, Chile (URL: https://twitter.com/patoarias/status/1172287142191665153); Volcanologia Chile, (URL: http://www.volcanochile.com/joomla30/, https://twitter.com/volcanologiachl/status/1182707451554078720); Claudio Kanisius (URL: https://twitter.com/ClaudioKanisius/status/1191182878346031104).
Erebus (Antarctica) — January 2020 Cite this Report
Erebus
Antarctica
77.53°S, 167.17°E; summit elev. 3794 m
All times are local (unless otherwise noted)
Lava lakes persist through 2019
Erebus, the world's southernmost historically active volcano, overlooks the McMurdo research station on Antarctica's Ross Island, 35 km SSW. Because of the remoteness of the volcano, activity is primarily monitored using satellites (figure 27), including MODIS infrared detectors aboard the Aqua and Terra satellites and analyzed using the MODVOLC algorithm.
Available since 2000, MODIS-MODVOLC data have shown a strong and nearly continuous thermal signal through 2019. A compilation of thermal alert pixels during 2017-2019 (table 5, continuing the table in BGVN 44:01) shows a wide range of detected activity in 2019, with a high of 162 in April. Infrared satellite imagery from Sentinel-2 identified one or two lava lakes during January-March and September-December 2019; a few of the images showed gas emissions, possibly from melted snow (figure 28).
Table 5. Number of monthly MODVOLC thermal alert pixels recorded at Erebus from 1 January 2017 to 31 December. Table compiled using data provided by the Hawai'i Institute of Geophysics and Planetology (HIGP) - MODVOLC Thermal Alerts System.
| Year |
Jan |
Feb |
Mar |
Apr |
May |
Jun |
Jul |
Aug |
Sep |
Oct |
Nov |
Dec |
SUM |
| 2017 |
0 |
21 |
9 |
0 |
0 |
1 |
11 |
61 |
76 |
52 |
0 |
3 |
234 |
| 2018 |
0 |
21 |
58 |
182 |
55 |
17 |
137 |
172 |
103 |
29 |
0 |
0 |
774 |
| 2019 |
2 |
21 |
162 |
151 |
55 |
56 |
75 |
53 |
29 |
19 |
1 |
0 |
624 |
Geologic Background. Mount Erebus, the world's southernmost historically active volcano, overlooks the McMurdo research station on Ross Island. It is the largest of three major volcanoes forming the crudely triangular Ross Island. The summit of the dominantly phonolitic volcano has been modified by one or two generations of caldera formation. A summit plateau at about 3,200 m elevation marks the rim of the youngest caldera, which formed during the late-Pleistocene and within which the modern cone was constructed. An elliptical 500 x 600 m wide, 110-m-deep crater truncates the summit and contains an active lava lake within a 250-m-wide, 100-m-deep inner crater; other lava lakes are sometimes present. The glacier-covered volcano was erupting when first sighted by Captain James Ross in 1841. Continuous lava-lake activity with minor explosions, punctuated by occasional larger Strombolian explosions that eject bombs onto the crater rim, has been documented since 1972, but has probably been occurring for much of the volcano's recent history.
Information Contacts: Hawai'i Institute of Geophysics and Planetology (HIGP) - MODVOLC Thermal Alerts System, School of Ocean and Earth Science and Technology (SOEST), Univ. of Hawai'i, 2525 Correa Road, Honolulu, HI 96822, USA (URL: http://modis.higp.hawaii.edu/); Sentinel Hub Playground (URL: https://www.sentinel-hub.com/explore/sentinel-playground); NASA Earth Observatory, EOS Project Science Office, NASA Goddard Space Flight Center, Goddard, Maryland, USA (URL: http://earthobservatory.nasa.gov/).
Ibu
Indonesia
1.488°N, 127.63°E; summit elev. 1325 m
All times are local (unless otherwise noted)
Frequent ash plumes and small lava flows in the crater through December 2019
Heightened continuing activity at Ibu since March 2018 has been dominated by frequent ash explosions with weak ash plumes, and numerous thermal anomalies reflecting one or more weak lava flows (BGVN 43:05, 43:12, and 44:07). This report summarizes activity through December 2019, and is based on data from the Pusat Vulkanologi dan Mitigasi Bencana Geologi (PVMBG, also known as Indonesian Center for Volcanology and Geological Hazard Mitigation, CVGHM), Darwin Volcanic Ash Advisory Centre (VAAC), and various satellites.
Typical ash plumes during the reporting period of July-December 2019 rose 800 m above the crater, with the highest reported to 1.4 km in early October (table 5). They were usually noted a few times each month. According to MAGMA Indonesia, explosive activity caused the Aviation Color Code to be raised to ORANGE (second highest of four) on 14, 22, and 31 August, 4 and 30 September, and 15 and 20 October.
Table 5. Ash plumes and other volcanic activity reported at Ibu during December 2018-December 2019. Plume heights are reported above the crater rim. Data courtesy of PVMBG and Darwin VAAC.
| Date |
Time |
Ash Plume Height |
Plume Drift |
Remarks |
| 11 Dec 2018 |
-- |
500 m |
-- |
Weather clouds prevented views in satellite data. |
| 12 Jan 2019 |
1712 |
800 m |
S |
-- |
| 13 Jan 2019 |
0801 |
800 m |
S |
-- |
| 05-12 Feb 2019 |
-- |
200-800 m |
E, S, W |
Weather conditions occasionally prevented observations. |
| 25-26 Feb 2019 |
-- |
1.1-1.7 km |
NE, ENE |
Thermal anomaly. |
| 28 Feb 2019 |
-- |
800 m |
N |
-- |
| 18 Mar 2019 |
-- |
1.1 km |
E |
Plume drifted about 17 km NE. |
| 23 Mar 2019 |
-- |
1.1 km |
E |
-- |
| 28 Mar 2019 |
-- |
800 m |
SE |
-- |
| 10 Apr 2019 |
-- |
800 m |
N |
-- |
| 15-16 Apr 2019 |
-- |
1.1 km |
N, NE |
-- |
| 18 Apr 2019 |
-- |
800 m |
E |
-- |
| 07 May 2019 |
-- |
1.1 km |
ESE |
-- |
| 08 May 2019 |
-- |
1.1 km |
ESE |
-- |
| 09 May 2019 |
1821 |
600 m |
S |
Seismicity characterized by explosions, tremor, and rock avalanches. |
| 10 May 2019 |
-- |
500 m |
ESE |
-- |
| 14 May 2019 |
1846 |
800 m |
N |
-- |
| 14-16, 18-19 May 2019 |
-- |
0.8-1.7 km |
NW, N, ENE |
-- |
| 23-24 May 2019 |
-- |
1.1-1.4 km |
SE |
-- |
| 31 May 2019 |
-- |
800 m |
W |
-- |
| 02 Jun 2019 |
-- |
1.7 km |
W |
-- |
| 21 Jun 2019 |
-- |
500 m |
N, NE |
-- |
| 24-25 Jun 2019 |
-- |
0.2-1.1 km |
SE, ESE |
-- |
| 06 Jul 2019 |
-- |
800 m |
N |
Intermittent thermal anomaly. |
| 15 Jul 2019 |
-- |
800 m |
NE |
-- |
| 07-12 Aug 2019 |
-- |
200-800 m |
-- |
Plumes were white-to-gray. |
| 14 Aug 2019 |
1107 |
800 m |
N |
Seismicity characterized by explosions and rock avalanches. |
| 22 Aug 2019 |
0704 |
800 m |
W |
Seismicity characterized by explosions and rock avalanches. |
| 31 Aug 2019 |
1847 |
800 m |
N |
Seismicity characterized by explosions and rock avalanches. |
| 04 Sep 2019 |
0936 |
300 m |
S |
-- |
| 28 Sep 2019 |
-- |
500-800 m |
WNW |
-- |
| 30 Sep 2019 |
1806 |
800 m |
N |
-- |
| 06-07 Oct 2019 |
-- |
0.8-1.4 km |
S, N |
-- |
| 15 Oct 2019 |
0707 |
400 m |
S |
-- |
| 20 Oct 2019 |
0829 |
400 m |
W |
-- |
| 01-05 Nov 2019 |
-- |
200-800 m |
E, N |
Plumes were white-and-gray. |
| 20-21, 23-25 Nov 2019 |
-- |
500-800 m |
Multiple |
Thermal anomaly on 21 Nov. |
| 03 Dec 2019 |
-- |
800 m |
NE |
Thermal anomaly. |
| 26 Dec 2019 |
-- |
800 m |
S |
Discrete ash puffs in satellite imagery. |
Thermal anomalies were sometimes noted by PVMBG, and were also frequently obvious in infrared satellite imagery suggesting lava flows and multiple active vents, as seen on 22 November 2019 (figure 19). Thermal anomalies using MODIS satellite instruments processed by the MODVOLC algorithm were recorded 2-4 days every month from July to December 2019. In contrast, the MIROVA (Middle InfraRed Observation of Volcanic Activity) system detected numerous hotspots on most days (figure 20).
Geologic Background. The truncated summit of Gunung Ibu stratovolcano along the NW coast of Halmahera Island has large nested summit craters. The inner crater, 1 km wide and 400 m deep, has contained several small crater lakes. The 1.2-km-wide outer crater is breached on the N, creating a steep-walled valley. A large cone grew ENE of the summit, and a smaller one to the WSW has fed a lava flow down the W flank. A group of maars is located below the N and W flanks. The first observed and recorded eruption was a small explosion from the summit crater in 1911. Eruptive activity began again in December 1998, producing a lava dome that eventually covered much of the floor of the inner summit crater along with ongoing explosive ash emissions.
Information Contacts: Pusat Vulkanologi dan Mitigasi Bencana Geologi (PVMBG, also known as Indonesian Center for Volcanology and Geological Hazard Mitigation, CVGHM), Jalan Diponegoro 57, Bandung 40122, Indonesia (URL: http://www.vsi.esdm.go.id/); MAGMA Indonesia, Kementerian Energi dan Sumber Daya Mineral (URL: https://magma.vsi.esdm.go.id/); Badan Nasional Penanggulangan Bencana (BNPB), National Disaster Management Agency, Graha BNPB - Jl. Scout Kav.38, East Jakarta 13120, Indonesia (URL: http://www.bnpb.go.id/); Darwin Volcanic Ash Advisory Centre (VAAC), Bureau of Meteorology, Northern Territory Regional Office, PO Box 40050, Casuarina, NT 0811, Australia (URL: http://www.bom.gov.au/info/vaac/); Hawai'i Institute of Geophysics and Planetology (HIGP) - MODVOLC Thermal Alerts System, School of Ocean and Earth Science and Technology (SOEST), Univ. of Hawai'i, 2525 Correa Road, Honolulu, HI 96822, USA (URL: http://modis.higp.hawaii.edu/); MIROVA (Middle InfraRed Observation of Volcanic Activity), a collaborative project between the Universities of Turin and Florence (Italy) supported by the Centre for Volcanic Risk of the Italian Civil Protection Department (URL: http://www.mirovaweb.it/); Sentinel Hub Playground (URL: https://www.sentinel-hub.com/explore/sentinel-playground).
Kadovar (Papua New Guinea) — January 2020 Cite this Report
Kadovar
Papua New Guinea
3.608°S, 144.588°E; summit elev. 365 m
All times are local (unless otherwise noted)
Frequent gas and some ash emissions during May-December 2019 with some hot avalanches
Kadovar is an island volcano north of Papua New Guinea and northwest of Manam. The first confirmed historical activity began in January 2018 and resulted in the evacuation of residents from the island. Eruptive activity through 2018 changed the morphology of the SE side of the island and activity continued through 2019 (figure 36). This report summarizes activity from May through December 2019 and is based largely on various satellite data, tourist reports, and Darwin Volcanic Ash Advisory Center (VAAC) reports.
Since this eruptive episode began a large part of the island has been deforested and has undergone erosion (figure 37). Activity in early 2019 included regular gas and steam emissions, ash plumes, and thermal anomalies at the summit (BGVN 44:05). On 15 May an ash plume originated from two vents at the summit area and dispersed to the east. A MODVOLC thermal alert was also issued on this day, and again on 17 May. Elevated temperatures were detected in Sentinel-2 thermal satellite data on 20, 21, and 30 May (figure 38), with accompanying gas-and-steam plumes dispersing to the NNW and NW. On 30 May the area of elevated temperature extended to the SE shoreline, indicating an avalanche of hot material reaching the water.
Throughout June cloud-free Sentinel-2 thermal satellite images showed elevated temperatures at the summit area and extending down the upper SE flank (figure 38). Gas-and-steam plumes were persistent in every Sentinel-2 and NASA Suomi NPP / VIIRS (Visible Infrared Imaging Radiometer Suite) image. MODVOLC thermal alerts were issued on 4 and 9 June. Similar activity continued through July with gas-and-steam emissions visible in every cloud-free satellite image. Thermal anomalies appeared weaker in late-July but remained at the summit area. An ash plume was imaged on 17 July by Landsat 8 with a gas-and-ash plume dispersing to the west (figure 39). Thermal anomalies continued through August with a MODVOLC thermal alert issued on the 14th. Gas emissions also continued and a Volcano Observatory Notice for Aviation (VONA) was issued on the 19th reporting an ash plume to an altitude of 1.5 km and drifting NW.
An elongate area extending from the summit area to the E-flank coastal dome appears lighter in color in a 7 September Sentinel-2 natural color satellite image, and as a higher temperature area in the correlating thermal bands, indicating a hot avalanche deposit. These observations along with the previous avalanche, persistent elevated summit temperatures, and persistent gas and steam emissions from varying vent locations (figure 40) suggests that the summit dome has remained active through 2019.
Thermal anomalies and emissions continued through to the end of 2019 (figure 41). A tour group witnessed an explosion producing an ash plume at around 1800 on 13 November (figure 42). While the ash plume erupted near-vertically above the island, a more diffuse gas plume rose from multiple vents on the summit dome and dispersed at a lower altitude.
While gas plumes were visible throughout May-December 2019 (figure 43), SO2 plumes were difficult to detect in NASA SO2 images due to the activity of nearby Manam volcano. The MIROVA thermal detection system shows continued elevated temperatures through to early December, with an increase during May-June (figure 44). Sentinel-2 thermal images showed elevated temperatures through to the end of December but at a lower intensity than previous months.
Geologic Background. The 2-km-wide island of Kadovar is the emergent summit of a Bismarck Sea stratovolcano of Holocene age. It is part of the Schouten Islands, and lies off the coast of New Guinea, about 25 km N of the mouth of the Sepik River. Prior to an eruption that began in 2018, a lava dome formed the high point of the andesitic volcano, filling an arcuate landslide scarp open to the south; submarine debris-avalanche deposits occur in that direction. Thick lava flows with columnar jointing forms low cliffs along the coast. The youthful island lacks fringing or offshore reefs. A period of heightened thermal phenomena took place in 1976. An eruption began in January 2018 that included lava effusion from vents at the summit and at the E coast.
Information Contacts: Hawai'i Institute of Geophysics and Planetology (HIGP) - MODVOLC Thermal Alerts System, School of Ocean and Earth Science and Technology (SOEST), Univ. of Hawai'i, 2525 Correa Road, Honolulu, HI 96822, USA (URL: http://modis.higp.hawaii.edu/); Planet Labs, Inc. (URL: https://www.planet.com/); Sentinel Hub Playground (URL: https://www.sentinel-hub.com/explore/sentinel-playground); NASA Worldview (URL: https://worldview.earthdata.nasa.gov); Chrissie Goldrick, Australian Geographic, Level 7, 54 Park Street, Sydney, NSW 2000, Australia (URL: https://www.australiangeographic.com.au/).
Nevado del Ruiz (Colombia) — January 2020 Cite this Report
Nevado del Ruiz
Colombia
4.892°N, 75.324°W; summit elev. 5279 m
All times are local (unless otherwise noted)
Intermittent ash, gas-and-steam, and SO2 plumes, and thermal anomalies during January 2018-December 2019
Nevado del Ruiz is a glaciated stratovolcano located in Colombia. It is most known for the eruption on 13 November 1985 that produced an ash plume and pyroclastic flows onto the glacier, triggering a lahar and killing approximately 25,000 people in the towns of Armero (46 km W) and Chinchiná (34 km E). Since the September 1985-July 1991 eruption, volcanism has occurred dominantly at the Arenas crater, with eruptive periods during February 2012-July 2013 and November 2014-May 2017 (BGVN 42:06 and 44:12). The previous eruption included ash and gas-and-steam plumes, ashfall, and thermal anomalies through May 2017, after which no clear observations of ongoing activity were available until an ash plume was seen in satellite and webcam images on 18 December 2017. This report provides data and observations from January 2018 through December 2019 using information primarily from reports by the Servicio Geologico Colombiano and the Observatorio Vulcanológico y Sismológico de Manizales, the Washington Volcanic Ash Advisory Center (VAAC) notices, and various satellite data.
Summary of activity during December 2017-December 2019. Although data is incomplete, the current eruptive period is considered to have begun with the emission of an ash plume on 18 December 2017. The Washington VAAC issued an advisory that day for an ash plume to 6 km that was moving west and dispersing, further describing it as a "thin veil of volcanic ash and gasses" that was seen in visible satellite imagery, NOAA/CIMSS, and supported by webcam imagery.
Reports of significant ash plumes visible in satellite imagery were infrequent in 2018 and 2019, with a few notable pulses in July 2018, February-March 2019, and August-September 2019 (figure 95). Sentinel-2 thermal satellite data in comparison with Suomi NPP/VIIRS sensor data, and the MODVOLC algorithm for MODIS data registered infrared thermal hotspots intermittently throughout 2018 to 2019 with more frequent anomalies during January-March 2018, August 2018, October 2018-February 2019, and November-December 2019; observations during March-June of each year were low. Identification of SO2 emissions were frequent and consistent during all of 2018-2019 (figure 96).
MIROVA (Middle InfraRed Observation of Volcanic Activity) analysis of MODIS satellite data shows weak thermal anomalies within 5 km of the summit occurring dominantly between October 2018 through March 2019 (figure 97). Between April and October 2019, the number of thermal anomalies was low, registering eight during this time. The number of thermal signatures increased at the beginning of November 2019 and continued through the rest of 2019.
Seismicity that occurred during 2018-2019 was located mainly in the Arenas crater and consisted of low-frequency (LF) and very low-frequency (VLF) earthquakes and volcanic tremors, many of which were associated with minor gas-and-steam and ash emissions confirmed through webcams. The number of earthquakes reported by SGC fluctuated each week, but the energy remained relatively consistent. The highest magnitude earthquake that occurred during 2018 was on 26 October reaching 3.1 ML (local magnitude) and during 2019 the largest was 2.8 ML on 21 April.
Activity during 2018. Throughout 2018, gas-and-steam plumes, mostly composed of water vapor and sulfur dioxide frequently occurred, rising to a maximum of 2.2 km above the Arenas crater on 24 March. Weak thermal anomalies were seen intermittently in thermal satellite imagery from Sentinel-2 and NASA Worldview during 4 January through March and September to December (figure 98). Activity during March to April 2018 was relatively low and consisted dominantly of gas-and-steam emissions, low-energy seismicity, and intermittent thermal anomalies. Between 9 May and 5 August, no thermal signatures were detected.
Ash plumes were seen in GOES-EAST satellite imagery, through webcams, and by SGC personnel. The first ash plume of 2018 occurred on 21 April at 0800, six days after NASA Worldview detected a thermal anomaly within the Arenas crater. The plume rose 6 km altitude and drifted NW as seen in GOES-EAST satellite imagery and reported by the Washington VAAC. Weak gas-and-steam and ash emissions were confirmed by webcams on 22 July, associated with a volcanic tremor. On 11 August 2018, another ash plume was reported in a VAAC notice rising 6.7 km altitude drifting W. During the week of 21 August, SGC reported that seismicity in the Arenas crater was associated with minor gas-and-steam and ash emissions, as confirmed by webcams.
The number of ash plumes increased during September (figure 99), one of which reached a maximum altitude of 7.3 km on 2 September. On 5 September, a continuous volcanic tremor occurred and was accompanied by an ash plume rising 7 km altitude drifting W, according to a Washington VAAC report. Ashfall was observed during the week of 11 September in Manizales (30 km NW) and Villamaría (27 km NW). A new volcanic tremor occurred on 15 September and was accompanied by various ash emissions reaching 1.4 km above the crater and drifting NW as confirmed by PNNN, inhabitants within the vicinity of the volcano, and the Washington VAAC. Seismicity continuing into the weeks of 25 September and 2 October was also accompanied by ash emissions, rising to an altitude of 1.4 km above the crater on 22 September. The number of reported gas-and-steam and ash emissions decreased after September; ash emissions were reported by SGC on 19, 22, 26, and 31 October, 6, 9, and 17 November, and 14 December.
Activity during 2019. Gas-and-steam and ash emissions continued intermittently through 2019, with an increased number of ash emissions compared to the previous year. Infrared hotspots were detected in Sentinel-2 satellite imagery primarily during January-February 2019 and December 2019, often accompanied by gas-and-steam emissions (figure 100). An ash plume was seen in GOES-EAST satellite imagery on 2 January 2019, rising to an altitude of 5.8 km and drifting NW, according to a Washington VAAC report. On 7 January, ashfall in Manizales and Villamaría was observed. A thermal hotspot was detected in multispectral imagery, according to a Washington VAAC report on 29 January. Slight ground deformation was observed by GNSS and electronic inclinometers during the weeks of 29 January and 10 September. Volcanism was relatively low during February to March and consisted of mostly gas-and-steam emissions and rare ash plumes; these ash emissions were reported on 2 and 9 February and 16 March by the Washington VAAC rising between 5.8-6.7 km altitude. Gas-and-steam emission were detected on 6 and 17 February and 17 and 21 March.
The number of ash emissions detected in satellite imagery increased after March, occurring on 4, 7, 16, 17-19, and 23-26 April and 2 and 4-5 May. Ash plumes were detected on 27 June, 4, 7, 8, and 29 July, 1 August, and on 19, 29, and 30 September. Los Nevados National Natural Park (PNNN) personnel reported that the ash plume on 8 July was accompanied by gas-and-steam emissions and a continuous tremor occurring at 0722 (figure 101). These emissions rose 450 m above the crater and drifted W. On 29 September, a tremor associated with an ash plume occurred at 2353. The ash plume rose to a maximum altitude of 8.5 km drifted NW, resulting in ashfall confirmed by PNNN, GOES-EAST satellite imagery, and SGC personnel in the field.
Seismicity increased during the week of 1 October compared to the previous week, which was accompanied by several gas-and-steam and ash emissions rising 1 km altitude drifting NW observed by webcams, PNNN personnel, and GOES-EAST satellite imagery. An ash plume rising 7 km altitude drifting NW on 4 October resulted in fine ashfall in Manizales. Ash plumes rose to an altitude of 7.3 km drifting N on 5, 9, and 16 October and was seen in the GOES-EAST satellite according to Washington VAAC notices. Ash emissions were observed frequently during November; 11 Washington VAAC notices, the most for any month during 2019, reported emissions ranging 5.8 to 7 km altitude drifting in different directions. Gas-and-steam plumes rose to a maximum of 2.4 km above the crater during 14 and 30 November. The number of reported emissions decreased during December with one ash emission observed on 4 December.
Geologic Background. Nevado del Ruiz is a broad, glacier-covered volcano in central Colombia that covers more than 200 km2. Three major edifices, composed of andesitic and dacitic lavas and andesitic pyroclastics, have been constructed since the beginning of the Pleistocene. The modern cone consists of a broad cluster of lava domes built within the caldera of an older edifice. The 1-km-wide, 240-m-deep Arenas crater occupies the summit. The prominent La Olleta pyroclastic cone located on the SW flank may also have been active in historical time. Steep headwalls of massive landslides cut the flanks. Melting of its summit icecap during historical eruptions, which date back to the 16th century, has resulted in devastating lahars, including one in 1985 that was South America's deadliest eruption.
Information Contacts: Servicio Geologico Colombiano (SGC), Diagonal 53 No. 34-53 - Bogotá D.C., Colombia (URL: https://www2.sgc.gov.co/volcanes/index.html); Washington Volcanic Ash Advisory Center (VAAC), Satellite Analysis Branch (SAB), NOAA/NESDIS OSPO, NOAA Science Center Room 401, 5200 Auth Rd, Camp Springs, MD 20746, USA (URL: www.ospo.noaa.gov/Products/atmosphere/vaac, archive at: http://www.ssd.noaa.gov/VAAC/archive.html); Global Sulfur Dioxide Monitoring Page, Atmospheric Chemistry and Dynamics Laboratory, NASA Goddard Space Flight Center (NASA/GSFC), 8800 Greenbelt Road, Goddard, Maryland, USA (URL: https://so2.gsfc.nasa.gov/); MIROVA (Middle InfraRed Observation of Volcanic Activity), a collaborative project between the Universities of Turin and Florence (Italy) supported by the Centre for Volcanic Risk of the Italian Civil Protection Department (URL: http://www.mirovaweb.it/); Sentinel Hub Playground (URL: https://www.sentinel-hub.com/explore/sentinel-playground); Hawai'i Institute of Geophysics and Planetology (HIGP) - MODVOLC Thermal Alerts System, School of Ocean and Earth Science and Technology (SOEST), Univ. of Hawai'i, 2525 Correa Road, Honolulu, HI 96822, USA (URL: http://modis.higp.hawaii.edu/); NASA Worldview (URL: https://worldview.earthdata.nasa.gov/).
Sangay
Ecuador
2.005°S, 78.341°W; summit elev. 5286 m
All times are local (unless otherwise noted)
Continuing ash emissions, lava flows, pyroclastic flows, and lahars through December 2019
Frequent activity at Ecuador's Sangay has included pyroclastic flows, lava flows, ash plumes, and lahars since 1628. Its remoteness on the east side of the Andean crest has made ground observations difficult until recent times. The current eruption began in March 2019; this report covers ongoing activity from July through December 2019. Information is provided by Ecuador's Instituto Geofísico, Escuela Politécnica Nacional (IG-EPN), and a number of sources of remote data including the Washington Volcanic Ash Advisory Center (VAAC), the Italian MIROVA Volcano HotSpot Detection System, and Sentinel-2 satellite imagery.
The eruption that began in March 2019 continued during July-December 2019 with activity focused on two eruptive centers at the summit, the Cráter Central and the Ñuñurco (southeast) vent. The Cráter Central produced explosive activity which generated small ash emissions that rose up to 3.2 km above the crater and were frequently directed towards the W and SW. Associated with these emissions in early November, ashfall was reported in Chimborazo province and elsewhere, and ejecta from explosions was deposited on all the upper flanks. At the Ñuñurcu vent, effusive activity resulted in an almost continuous emission of material down the SE flank. Small rockfalls and pyroclastic flows along the fronts and sides of the flows reached the basin and upper channel of the Volcán river which flows into the Upano river. These deposits were remobilized by rainfall and formed mud and debris flows (lahars) in the Volcán river, which caused damming at the confluence with the Upano river downstream. Increased thermal activity was recorded by the MIROVA system from mid-May 2019 through the end of the year, corresponding to the ongoing lava flow and explosive activity (figure 39).
Activity during July-September 2019. Several ash emissions were reported by the Washington VAAC during the first part of July 2019. On 1 July a plume rose to 6.7 km altitude and extended 45 km WSW from the summit. During 3-4 July a plume rose 6.4 km and drifted WNW; it included occasional discrete emissions that extended approximately 35 km from summit. The VAAC recorded a bright hotspot in SWIR imagery on 4 July. On 11 July a 7.3-km-altitude ash plume detached from the summit and extended from immediately W of the summit S past Segu. Webcam and satellite imagery on 11 July demonstrated the continuing thermal activity of the lava flow on the SE flank and ash emissions drifting W (figure 40). On 29 July a plume rose to 7.6 km altitude and drifted 65 km WSW. Later in the day continuous emissions were drifting SW from the summit at 5.8 km altitude before dissipating. The first satellite images of 30 July showed a plume extending 110 km WSW from the summit at 7 km altitude. Activity decreased later in the day and the plume extended W about 45 km from the summit at 6.4 km altitude. Composite satellite imagery on 31 July showed almost constant ash emissions extending over 150 km W of the summit (figure 41).
During an overflight on 6 August 2019 scientists from IG-EPN observed ash emissions from the Cráter Central, and the lava flow continuing from the Vento Ñuñurco in a similar location to where it was in May 2019 (figure 42). Light-colored sediments filled much of the upper basin of the Volcán river. Thermal images of the area also showed that some of the deposits were elevated in temperature, even in the riverbed (figure 43).
Frequent ash emissions continued during August 2019. Diffuse ash was seen moving W from the summit at 5.8 km altitude on 1 August. Another short-lived plume was observed extending 15 km WSW the next day at 5.8-6.1 km altitude. Continuous ash emissions were visible in satellite imagery extending 35 km SW from the summit at 6.1 km altitude on 5 August. During the next two days, the emissions extended 45 km WSW and a prominent hot spot was visible through the meteoric clouds. The ash plume altitude rose to 6.7 km on 8 August and a larger ash emission extended more than 100 km WSW. A new emission the next day drifted 25-35 km W at 6.1 km altitude. A well-defined hotspot seen in shortwave imagery on 10 August accompanied an ash emission that extended 35 km WSW from the summit at 6.7 km altitude. On 12 August a plume drifted 65 km due W at 6.4 km altitude; emissions continued the next day in the same direction at 6.1 km altitude. An ash plume extended 100 km WNW of the summit at 5.8 km altitude on 18 August. A very bright hotspot was observed in infrared imagery the next day. The ash emissions continued to be visible in satellite imagery through 20 August.
An ash plume extending 10 km N from the summit on 25 August coincided with the appearance of a vivid hot spot, according to the Washington VAAC. The plume was initially reported at 7.6 km altitude and later in the day was at 6.7 km altitude. The leading edge of an ash emission reported on 31 August was 350 km W of the summit late that day moving at 5.8 km altitude, and over 950 km WSW before it dissipated on 1 September. Fewer ash emissions were reported during September 2019. The leading edge of a plume extended about 160 km W from the summit on 2 September at 7.6 km altitude; a second emission that day moved NE at 6.4 km altitude. On 4 September a small emission rose to 6.4 km altitude and drifted SW; on 9 September a plume was observed moving W at 5.5 km. A new emission on 19 September was seen in satellite imagery moving in many different directions (N, NE, E, and SE) at 6.7 km altitude. The lava flow on the SE flank produced a strong thermal signature that appeared unchanged from late August through late September (figure 44).
Activity during October-December 2019. Pulses of ash were reported during 1, 9-11, 14, 26, and 31 October 2019 by the Washington VAAC. On 1 October the plume rose to 5.8 km altitude and drifted NE. A narrow plume on 9 October extending 55 km NW corresponded with a bright hotspot at its source. Concentrated emissions the next day rose to 7.3 km altitude and extended over 200 km WNW. Later in the day on 10 October emissions were reported at 5.8 km drifting W. A substantial thermal anomaly and a constant plume of diffuse ash appeared in satellite imagery on 14 October at 6.1 km altitude drifting 15 km W. Diffuse emissions on 26 October appeared 35 km NW of the summit at 5.8 km altitude. The intensity of the thermal anomaly from the lava flow on the SE flank remained strong during the month, and emissions of steam and ash were also visible in satellite images (figure 45). In a site visit on 19 October 2019, IG-EPN scientists measured a recent lahar deposited near the confluence of the Volcán and Upano rivers. It was full of sand-sized particles and approximately 30 cm thick at the river’s edge (figure 46).
Ash emissions during 10-26 November 2019 were reported daily by the Washington VAAC, each lasting for less than 24 hours before dissipating. The first report of ash detected in satellite imagery on 10 November indicated that the plume extended 25 km WSW at 6.7 km altitude. On the subsequent days, the plumes drifted in many different directions at altitudes of 5.8-7.3 km, usually around 6.4 km. The plumes generally drifted 25-45 km from the summit, although some were still visible over 100 km away, depending on weather conditions. The highest plume reached 7.3 km altitude on 18 November and drifted W. The plume on 26 November rose to 6.4 km altitude and was last seen 140 km SW of the summit before it dissipated. Pyroclastic flows were witnessed on 20 November 2019 (figure 47). The last plume of the month, on 29 November, rose to 6.4 km altitude and drifted 65 km W, dissipating quickly, and was accompanied by a very bright thermal anomaly.
Ashfall was reported during November in the provinces of Chimborazo (Alao, 20 km NW, Cebadas, 35 km NW, and Guaguallá), Morona Santiago (Macas, 40 km SE), and Azuay (120 km SW). Samples of ash collected from two locations indicated that the amount of material was very small (less than10 g/m2) with a high content of extremely fine ash (between 40 and 60% ash less 63 μm in diameter). The larger fraction over 63 μm was mainly composed of juvenile magma (80%) and a small fraction of free crystals (10% plagioclase and pyroxenes), oxidized fragments (5%), and gray lithics (5%) (figure 48).
In a report issued in early December 2019 the IG-EPN noted that eruptive activity which increased in May 2019 was continuing (figure 49); a small amount of inflation was observed during November. Explosive activity continued at the Cráter Central with ash plumes reaching 2 km above the summit, and plumes drifting frequently towards the NE causing small amounts of ash to fall in the Chimborazo, Morona Santiago, and Azuay provinces. Effusive activity from the Ñuñurco vent produced almost continuous lava that flowed down the SE flank. Small pyroclastic flows around the margins of the lava flows reached the basin and the upper channel of the Volcán river, causing temporary dams that turned to mudflows during rain events.
During an overflight on 3 December 2019 a strong smell of sulfur was noted 1 km above the summit. The Ñuñurco vent continued to emit lava with a maximum apparent temperature of 100 to 210°C (figure 50). IG-EPN scientists concluded that approximately 58 ± 29 million m3 of lava had been emitted through 3 December.
Recurring lahars in the Río Volcán during the period occasionally reached the Rio Upano (figure 51). By late November, they had partially dammed the Upano river (figure 52). On 26 November 2019 when IG-EPN and Sangay National Park officials inspected the area, they recorded deposits more than 2 m thick at the confluence of the two rivers (figure 53). During an overflight the next day, additional deposits were identified along 16 km upstream. The total volume of the lahar deposits was estimated at 5 million m3 to date.
Another extended period of ash emissions began on 4 December 2019 and continued daily through 19 December. The Washington VAAC reported that an ash plume was initially at 6.7 km altitude drifting S on 4 December. Continuous emissions were observed at 4.6 km altitude later in the day and were visible in satellite images located 25 km S at 5.8 km altitude that evening. The drift directions were initially mostly SW in early December, but migrated to mostly SE during 10-16 December, then back to SW. Plume altitudes ranged from 5.8 to 7.3 km and satellite images revealed ash as far as 160 km away; most plumes were visible to about 25 km before dissipating or disappearing into meteoric clouds. IG-EPN reported steam and gas emissions with small amounts of ash on 13 December that drifted SE (figure 54). Small block avalanches from the active flow were also observed on the SE flank. The next day, ash and gas emissions rose to 1,170 m above the summit and drifted NE while the lava flow appeared incandescent on the SE flank.
During the night of 14-15 December ashfall was reported in San Isidro in the Province of Morona Santiago (30 km SE). Ash plumes rose 870 m above the summit on 15 December and 1,470 m high the next day. Ashfall was reported in the Guasuntos (60 km SW) and Llagos (80 km SW) areas of the Chimborazo province on the morning of 16 December. The next day plumes drifted SE and SW, and minor ashfall was reported that night (16-17 December) in Macas (40 km SE), Morona Santiago province. Satellite images captured gas and ash emissions on 25 December, and ashfall was reported in Alausí (60 km SW) in the province of Chimborazo. An explosion on 29 December produced an ash plume that rose to 6.1 km and first drifted WNW then in an arc to the SW almost 185 km to the coast. Multiple plumes at 5.8-6.7 km drifted westerly for tens of kilometers that day and the next. Prominent thermal anomalies were noted in satellite imagery on 8, 15, 17, and 30 December.
By late December 2019, the lahar deposits in Rio Volcán had backed up noticeably further into the Upano river from a month earlier (figure 55). Sulfur dioxide emissions were not recorded during July through August 2019, but small, pulsing plumes were captured in satellite images during September, October and November, gradually increasing in density. Several plumes were detected hundreds of kilometers from the volcano before dissipating; by December, larger, more frequent pulses of SO2 were measured during many days when ash emissions were reported (figure 56).
Geologic Background. The isolated Sangay volcano, located east of the Andean crest, is the southernmost of Ecuador's volcanoes and its most active. The steep-sided, glacier-covered, dominantly andesitic volcano grew within the open calderas of two previous edifices which were destroyed by collapse to the east, producing large debris avalanches that reached the Amazonian lowlands. The modern edifice dates back to at least 14,000 years ago. It towers above the tropical jungle on the east side; on the other sides flat plains of ash have been eroded by heavy rains into steep-walled canyons up to 600 m deep. The earliest report of an eruption was in 1628. Almost continuous eruptions were reported from 1728 until 1916, and again from 1934 to the present. The almost constant activity has caused frequent changes to the morphology of the summit crater complex.
Information Contacts: Instituto Geofísico (IG-EPN), Escuela Politécnica Nacional, Casilla 17-01-2759, Quito, Ecuador (URL: http://www.igepn.edu.ec/);
MIROVA (Middle InfraRed Observation of Volcanic Activity), a collaborative project between the Universities of Turin and Florence (Italy) supported by the Centre for Volcanic Risk of the Italian Civil Protection Department (URL: http://www.mirovaweb.it/);
Sentinel Hub Playground (URL: https://www.sentinel-hub.com/explore/sentinel-playground);
Global Sulfur Dioxide Monitoring Page, Atmospheric Chemistry and Dynamics Laboratory, NASA Goddard Space Flight Center (NASA/GSFC), 8800 Greenbelt Road, Goddard, Maryland, USA (URL: https://so2.gsfc.nasa.gov/);
Walter Calle C., Macas, Ecuador (Twitter: @walterc333; URL: https://twitter.com/walterc333/status/1197273200822046720);
Edgar Chulde, Quito, Ecuador (Twitter: @EdgarChulde2; URL: https://twitter.com/EdgarChulde2/status/1208547471024173056).
Suwanosejima (Japan) — January 2020 Cite this Report
Suwanosejima
Japan
29.638°N, 129.714°E; summit elev. 796 m
All times are local (unless otherwise noted)
Explosions, ash emissions, and summit incandescence in July-December 2019
Suwanosejima, located south of Japan in the northern Ryukyu Islands, is an active andesitic stratovolcano that has had continuous activity since October 2004, typically producing ash plumes and Strombolian explosions. Much of this activity is focused within the Otake crater. This report updates information during July through December 2019 using monthly reports from the Japan Meteorological Agency (JMA), the Tokyo Volcanic Ash Advisory Center (VAAC), and various satellite data.
White gas-and-steam plumes rose from Suwanosejima on 26 July 2019, 30-31 August, 1-6, 10, and 20-27 September, reaching a maximum altitude of 2.4 km on 10 September, according to Tokyo VAAC advisories. Intermittent gray-white plumes were observed rising from the summit during October through December (figure 40).
An explosion that occurred at 2331 on 1 August 2019 ejected material 400 m from the crater while other eruptions on 3-6 and 26 August produced ash plumes that rose up to a maximum altitude of 2.1 km and drifted generally NW according to the Tokyo VAAC report. JMA reported eruptions and summit incandescence in September accompanied by white gas-and-steam plumes, but no explosions were noted. Eruptions on 19 and 29 October produced ash plumes that rose 300 and 800 m above the crater rim, resulting in ashfall in Toshima (4 km SW), according to the Toshima Village Office, Suwanosejima Branch Office. Another eruption on 30 October produced a similar gray-white plume rising 800 m above the crater rim but did not result in ashfall. Similar activity continued in November with eruptions on 5-7 and 13-15 November producing grayish-white plumes rising 900 m and 1.5 km above the crater rim and frequent crater incandescence. Ashfall was reported in Toshima Village on 19 and 20 November; the 20 November eruption ejected material 200 m from the Otake crater.
Field surveys on 14 and 18 December using an infrared thermal imaging system to the E of Suwanose Island showed hotspots around the Otake crater, on the N slope of the crater, and on the upper part of the E coastline. GNSS (Global Navigation Satellite Systems) observations on 15 and 17 December showed a slight change in the baseline length. After 2122 on 25-26 and 31 December, 23 eruptions, nine of which were explosive were reported, producing gray-white plumes that rose 800-1,800 m above the crater rim and ejected material up to 600 m from the Otake crater. JMA reported volcanic tremors occurred intermittently throughout this reporting period.
Incandescence at the summit crater was occasionally visible at night during July through December 2019, as recorded by webcam images and reported by JMA (figure 41). MIROVA (Middle InfraRed Observation of Volcanic Activity) analysis of MODIS satellite data showed weak thermal anomalies that occurred dominantly in November with little to no activity recorded between July and October (figure 42). Two Sentinel-2 thermal satellite images in early November and late December showed thermal hotspots within the summit crater (figure 43).
Geologic Background. The 8-km-long island of Suwanosejima in the northern Ryukyu Islands consists of an andesitic stratovolcano with two active summit craters. The summit is truncated by a large breached crater extending to the sea on the E flank that was formed by edifice collapse. One of Japan's most frequently active volcanoes, it was in a state of intermittent Strombolian activity from Otake, the NE summit crater, between 1949 and 1996, after which periods of inactivity lengthened. The largest recorded eruption took place in 1813-14, when thick scoria deposits covered residential areas, and the SW crater produced two lava flows that reached the western coast. At the end of the eruption the summit of Otake collapsed, forming a large debris avalanche and creating an open collapse scarp extending to the eastern coast. The island remained uninhabited for about 70 years after the 1813-1814 eruption. Lava flows reached the eastern coast of the island in 1884. Only about 50 people live on the island.
Information Contacts: Japan Meteorological Agency (JMA), 1-3-4 Otemachi, Chiyoda-ku, Tokyo 100-8122, Japan (URL: http://www.jma.go.jp/jma/indexe.html); MIROVA (Middle InfraRed Observation of Volcanic Activity), a collaborative project between the Universities of Turin and Florence (Italy) supported by the Centre for Volcanic Risk of the Italian Civil Protection Department (URL: http://www.mirovaweb.it/); Tokyo Volcanic Ash Advisory Center (VAAC), 1-3-4 Otemachi, Chiyoda-ku, Tokyo 100-8122, Japan (URL: http://ds.data.jma.go.jp/svd/vaac/data/); Sentinel Hub Playground (URL: https://www.sentinel-hub.com/explore/sentinel-playground).
Tinakula (Solomon Islands) — January 2020 Cite this Report
Tinakula
Solomon Islands
10.386°S, 165.804°E; summit elev. 796 m
All times are local (unless otherwise noted)
Intermittent thermal activity suggests ongoing eruption, July-December 2019
Remote Tinakula lies 100 km NE of the Solomon Trench at the N end of the Santa Cruz Islands, which are part of the South Pacific country of the Solomon Islands located 400 km to the W. It has been uninhabited since an eruption with lava flows and ash explosions in 1971 when the small population was evacuated (CSLP 87-71). The nearest communities live on Te Motu (Trevanion) Island (about 30 km S), Nupani (40 km N), and the Reef Islands (60 km E); residents occasionally report noises from explosions at Tinakula. Ashfall from larger explosions has historically reached these islands. A large ash explosion during 21-26 October 2017 was a short-lived event; renewed thermal activity was detected beginning in December 2018 and intermittently throughout 2019. This report covers the ongoing activity from July-December 2019. Since ground-based observations are rarely available, satellite thermal and visual data are the primary sources of information.
MIROVA thermal anomaly data indicated intermittent but ongoing thermal activity at Tinakula during July-December 2019 (figure 35). It was characterized by pulses of multiple alerts of varying intensities for several days followed by no activity for a few weeks.
Observations using Sentinel-2 satellite imagery were often prevented by clouds during July, but two MODVOLC thermal alerts on 2 July 2019 corresponded to MIROVA thermal activity on that date. No thermal anomalies were reported by MIROVA during August 2019, but Sentinel-2 satellite images showed dense steam plumes drifting away from the summit on four separate dates (figure 36). Two distinct thermal anomalies appeared in infrared imagery on 9 September, and a dense steam plume drifted about 10 km NW on 14 September (figure 37).
During October 2019 steam emissions were captured in four clear satellite images; a weak thermal anomaly was present on the W flank on 9 October (figure 38). MODVOLC recorded a single thermal alert on 9 November. Stronger thermal anomalies appeared twice during November in satellite images. On 13 November a strong anomaly was present at the summit in Sentinel-2 imagery; it was accompanied by a dense steam plume drifting NE from the hotspot. On 28 November two thermal anomalies appeared part way down the upper NW flank (figure 39). Thermal imagery on 3 December suggested that a weak anomaly remained on the NW flank in a similar location; a dense steam plume rose above the summit, drifting slightly SW on 18 December (figure 40). A thermal anomaly at the summit on 28 December was accompanied by a dense steam plume and corresponded to multiple MIROVA thermal anomalies at the end of December.
Geologic Background. The small 3.5-km-wide island of Tinakula is the exposed summit of a massive stratovolcano at the NW end of the Santa Cruz islands. It has a breached summit crater that extends from the summit to below sea level. Landslides enlarged this scarp in 1965, creating an embayment on the NW coast. The Mendana cone is located on the SE side. The dominantly andesitic volcano has frequently been observed in eruption since the era of Spanish exploration began in 1595. In about 1840, an explosive eruption apparently produced pyroclastic flows that swept all sides of the island, killing its inhabitants. Recorded eruptions have frequently originated from a cone constructed within the large breached crater. These have left the upper flanks and the steep apron of lava flows and volcaniclastic debris within the breach unvegetated.
Information Contacts: MIROVA (Middle InfraRed Observation of Volcanic Activity), a collaborative project between the Universities of Turin and Florence (Italy) supported by the Centre for Volcanic Risk of the Italian Civil Protection Department (URL: http://www.mirovaweb.it/); Hawai'i Institute of Geophysics and Planetology (HIGP) - MODVOLC Thermal Alerts System, School of Ocean and Earth Science and Technology (SOEST), Univ. of Hawai'i, 2525 Correa Road, Honolulu, HI 96822, USA (URL: http://modis.higp.hawaii.edu/); Sentinel Hub Playground (URL: https://www.sentinel-hub.com/explore/sentinel-playground).