Recently Published Bulletin Reports
Kadovar (Papua New Guinea) An ash plume and weak thermal anomaly during May 2023
San Miguel (El Salvador) Small gas-and-ash explosions during March and May 2023
Ebeko (Russia) Continued explosions, ash plumes, and ashfall during October 2022-May 2023
Home Reef (Tonga) Discolored plumes continued during November 2022-April 2023
Semisopochnoi (United States) Occasional explosions, ash deposits, and gas-and-steam plumes during December 2022-May 2023
Ambae (Vanuatu) New lava flow, ash plumes, and sulfur dioxide plumes during February-May 2023
Ibu (Indonesia) Daily ash explosions continue, along with thermal anomalies in the crater, October 2022-May 2023
Dukono (Indonesia) Continuing ash emissions, SO2 plumes, and thermal signals during October 2022-May 2023
Sabancaya (Peru) Explosions, gas-and-ash plumes, and thermal activity persist during November 2022-April 2023
Sheveluch (Russia) Significant explosions destroyed part of the lava-dome complex during April 2023
Bezymianny (Russia) Explosions, ash plumes, lava flows, and avalanches during November 2022-April 2023
Chikurachki (Russia) New explosive eruption during late January-early February 2023
Kadovar (Papua New Guinea) — June 2023  Cite this Report
Kadovar
Papua New Guinea
3.608°S, 144.588°E; summit elev. 365 m
All times are local (unless otherwise noted)
An ash plume and weak thermal anomaly during May 2023
Kadovar is a 2-km-wide island that is the emergent summit of a Bismarck Sea stratovolcano. It lies off the coast of New Guinea, about 25 km N of the mouth of the Sepik River. Prior to an eruption that began in 2018, a lava dome formed the high point of the volcano, filling an arcuate landslide scarp open to the S. Submarine debris-avalanche deposits occur to the S of the island. The current eruption began in January 2018 and has comprised lava effusion from vents at the summit and at the E coast; more recent activity has consisted of ash plumes, weak thermal activity, and gas-and-steam plumes (BGVN 48:02). This report covers activity during February through May 2023 using information from the Darwin Volcanic Ash Advisory Center (VAAC) and satellite data.
Activity during the reporting period was relatively low and mainly consisted of white gas-and-steam plumes that were visible in natural color satellite images on clear weather days (figure 67). According to a Darwin VAAC report, at 2040 on 6 May an ash plume rose to 4.6 km altitude and drifted W; by 2300 the plume had dissipated. MODIS satellite instruments using the MODVOLC thermal algorithm detected a single thermal hotspot on the SE side of the island on 7 May. Weak thermal activity was also detected in a satellite image on the E side of the island on 14 May, accompanied by a white gas-and-steam plume that drifted SE (figure 68).
Geologic Background. The 2-km-wide island of Kadovar is the emergent summit of a Bismarck Sea stratovolcano of Holocene age. It is part of the Schouten Islands, and lies off the coast of New Guinea, about 25 km N of the mouth of the Sepik River. Prior to an eruption that began in 2018, a lava dome formed the high point of the andesitic volcano, filling an arcuate landslide scarp open to the south; submarine debris-avalanche deposits occur in that direction. Thick lava flows with columnar jointing forms low cliffs along the coast. The youthful island lacks fringing or offshore reefs. A period of heightened thermal phenomena took place in 1976. An eruption began in January 2018 that included lava effusion from vents at the summit and at the E coast.
Information Contacts: Darwin Volcanic Ash Advisory Centre (VAAC), Bureau of Meteorology, Northern Territory Regional Office, PO Box 40050, Casuarina, NT 0811, Australia (URL: http://www.bom.gov.au/info/vaac/); Hawai'i Institute of Geophysics and Planetology (HIGP) - MODVOLC Thermal Alerts System, School of Ocean and Earth Science and Technology (SOEST), Univ. of Hawai'i, 2525 Correa Road, Honolulu, HI 96822, USA (URL: http://modis.higp.hawaii.edu/); Copernicus Browser, Copernicus Data Space Ecosystem, European Space Agency (URL: https://dataspace.copernicus.eu/browser/).
San Miguel (El Salvador) — June 2023 Cite this Report
San Miguel
El Salvador
13.434°N, 88.269°W; summit elev. 2130 m
All times are local (unless otherwise noted)
Small gas-and-ash explosions during March and May 2023
San Miguel in El Salvador is a broad, deep crater complex that has been frequently modified by eruptions recorded since the early 16th century and consists of the summit known locally as Chaparrastique. Flank eruptions have produced lava flows that extended to the N, NE, and SE during the 17-19th centuries. The most recent activity has consisted of minor ash eruptions from the summit crater. The current eruption period began in November 2022 and has been characterized by frequent phreatic explosions, gas-and-ash emissions, and sulfur dioxide plumes (BGVN 47:12). This report describes small gas-and-ash explosions during December 2022 through May 2023 based on special reports from the Ministero de Medio Ambiente y Recursos Naturales (MARN).
Activity has been relatively low since the last recorded explosions on 29 November 2022. Seismicity recorded by the San Miguel Volcano Station (VSM) located on the N flank at 1.7 km elevation had decreased by 7 December. Sulfur dioxide gas measurements taken with DOAS (Differential Optical Absorption Spectroscopy) mobile equipment were below typical previously recorded values: 300 tons per day (t/d). During December, small explosions were recorded by the seismic network and manifested as gas-and-steam emissions.
Gas-and-ash explosions in the crater occurred during January 2023, which were recorded by the seismic network. Sulfur dioxide values remained low, between 300-400 t/d through 10 March. At 0817 on 14 January a gas-and-ash emission was visible in webcam images, rising just above the crater rim. Some mornings during February, small gas-and-steam plumes were visible in the crater. On 7 March at 2252 MARN noted an increase in degassing from the central crater; gas emissions were constantly observed through the early morning hours on 8 March. During the early morning of 8 March through the afternoon on 9 March, 12 emissions were registered, some accompanied by ash. The last gas-and-ash emission was recorded at 1210 on 9 March; very fine ashfall was reported in El Tránsito (10 km S), La Morita (6 km W), and La Piedrita (3 km W). The smell of sulfur was reported in Piedra Azul (5 km SW). On 16 March MARN reported that gas-and-steam emissions decreased.
Low degassing and very low seismicity were reported during April; no explosions have been detected between 9 March and 27 May. The sulfur dioxide emissions remained between 350-400 t/d; during 13-20 April sulfur dioxide values fluctuated between 30-300 t/d. Activity remained low through most of May; on 23 May seismicity increased. An explosion was detected at 1647 on 27 May generated a gas-and-ash plume that rose 700 m high (figure 32); a decrease in seismicity and gas emissions followed. The DOAS station installed on the W flank recorded sulfur dioxide values that reached 400 t/d on 27 May; subsequent measurements showed a decrease to 268 t/d on 28 May and 100 t/d on 29 May.
Geologic Background. The symmetrical cone of San Miguel, one of the most active volcanoes in El Salvador, rises from near sea level to form one of the country's most prominent landmarks. A broad, deep, crater complex that has been frequently modified by eruptions recorded since the early 16th century caps the truncated unvegetated summit, also known locally as Chaparrastique. Flanks eruptions of the basaltic-andesitic volcano have produced many lava flows, including several during the 17th-19th centuries that extended to the N, NE, and SE. The SE-flank flows are the largest and form broad, sparsely vegetated lava fields crossed by highways and a railroad skirting the base of the volcano. Flank vent locations have migrated higher on the edifice during historical time, and the most recent activity has consisted of minor ash eruptions from the summit crater.
Information Contacts: Ministero de Medio Ambiente y Recursos Naturales (MARN), Km. 5½ Carretera a Nueva San Salvador, Avenida las Mercedes, San Salvador, El Salvador (URL: http://www.snet.gob.sv/ver/vulcanologia).
Ebeko
Russia
50.686°N, 156.014°E; summit elev. 1103 m
All times are local (unless otherwise noted)
Continued explosions, ash plumes, and ashfall during October 2022-May 2023
Ebeko, located on the N end of Paramushir Island in the Kuril Islands, consists of three summit craters along a SSW-NNE line at the northern end of a complex of five volcanic cones. Eruptions date back to the late 18th century and have been characterized as small-to-moderate explosions from the summit crater, accompanied by intense fumarolic activity. The current eruption period began in June 2022 and has recently consisted of frequent explosions, ash plumes, and thermal activity (BGVN 47:10). This report covers similar activity during October 2022 through May 2023, based on information from the Kamchatka Volcanic Eruptions Response Team (KVERT) and satellite data.
Activity during October consisted of explosive activity, ash plumes, and occasional thermal anomalies. Visual data by volcanologists from Severo-Kurilsk showed explosions producing ash clouds up to 2.1-3 km altitude which drifted E, N, NE, and SE during 1-8, 10, 16, and 18 October. KVERT issued several Volcano Observatory Notices for Aviation (VONA) on 7, 13-15, and 27 October 2022, stating that explosions generated ash plumes that rose to 2.3-4 km altitude and drifted 5 km E, NE, and SE. Ashfall was reported in Severo-Kurilsk (Paramushir Island, about 7 km E) on 7 and 13 October. Satellite data showed a thermal anomaly over the volcano on 15-16 October. Visual data showed ash plumes rising to 2.5-3.6 km altitude on 22, 25-29, and 31 October and moving NE due to constant explosions.
Similar activity continued during November, with explosions, ash plumes, and ashfall occurring. KVERT issued VONAs on 1-2, 4, 6-7, 9, 13, and 16 November that reported explosions and resulting ash plumes that rose to 1.7-3.6 km altitude and drifted 3-5 km SE, ESE, E, and NE. On 1 November ash plumes extended as far as 110 km SE. On 5, 8, 12, and 24-25 November explosions and ash plumes rose to 2-3.1 km altitude and drifted N and E. Ashfall was observed in Severo-Kurilsk on 7 and 16 November. A thermal anomaly was visible during 1-4, 16, and 20 November. Explosions during 26 November rose as high as 2.7 km altitude and drifted NE (figure 45).
Explosions and ash plumes continued to occur in December. During 1-2 and 4 December volcanologists from Severo-Kurilsk observed explosions that sent ash to 1.9-2.5 km altitude and drifted NE and SE (figure 46). VONAs were issued on 5, 9, and 16 December reporting that explosions generated ash plumes rising to 1.9 km, 2.6 km, and 2.4 km altitude and drifted 5 km SE, E, and NE, respectively. A thermal anomaly was visible in satellite imagery on 16 December. On 18 and 27-28 December explosions produced ash plumes that rose to 2.5 km altitude and drifted NE and SE. On 31 December an ash plume rose to 2 km altitude and drifted NE.
Explosions continued during January 2023, based on visual observations by volcanologists from Severo-Kurilsk. During 1-7 January explosions generated ash plumes that rose to 4 km altitude and drifted NE, E, W, and SE. According to VONAs issued by KVERT on 2, 4, 10, and 23 January, explosions produced ash plumes that rose to 2-4 km altitude and drifted 5 km N, NE, E, and ENE; the ash plume that rose to 4 km altitude occurred on 10 January (figure 47). Satellite data showed a thermal anomaly during 3-4, 10, 13, 16, 21, 22, and 31 January. KVERT reported that an ash cloud on 4 January moved 12 km NE. On 6 and 9-11 January explosions sent ash plumes to 4.5 km altitude and drifted W and ESE. On 13 January an ash plume rose to 3 km altitude and drifted SE. During 20-24 January ash plumes from explosions rose to 3.7 km altitude and drifted SE, N, and NE. On 21 January the ash plume drifted as far as 40 km NE. During 28-29 and 31 January and 1 February ash plumes rose to 4 km altitude and drifted NE.
During February, explosions, ash plumes, and ashfall were reported. During 1, 4-5 and 7-8 February explosions generated ash plumes that rose to 4.5 km altitude and drifted E and NE; ashfall was observed on 5 and 8 February. On 6 February an explosion produced an ash plume that rose to 3 km altitude and drifted 7 km E, causing ashfall in Severo-Kurilsk. A thermal anomaly was visible in satellite data on 8, 9, 13, and 21 February. Explosions on 9 and 12-13 February produced ash plumes that rose to 4 km altitude and drifted E and NE; the ash cloud on 12 February extended as far as 45 km E. On 22 February explosions sent ash to 3 km altitude that drifted E. During 24 and 26-27 February ash plumes rose to 4 km altitude and drifted E. On 28 February an explosion sent ash to 2.5-3 km altitude and drifted 5 km E; ashfall was observed in Severo-Kurilsk.
Activity continued during March; visual observations showed that explosions generated ash plumes that rose to 3.6 km altitude on 3, 5-7, and 9-12 March and drifted E, NE, and NW. Thermal anomalies were visible on 10, 13, and 29-30 March in satellite imagery. On 18, 21-23, 26, and 29-30 March explosions produced ash plumes that rose to 2.8 km altitude and drifted NE and E; the ash plumes during 22-23 March extended up to 76 km E. A VONA issued on 21 March reported an explosion that produced an ash plume that rose to 2.8 km altitude and drifted 5 km E. Another VONA issued on 23 March reported that satellite data showed an ash plume rising to 3 km altitude and drifted 14 km E.
Explosions during April continued to generate ash plumes. On 1 and 4 April an ash plume rose to 2.8-3.5 km altitude and drifted SE and NE. A thermal anomaly was visible in satellite imagery during 1-6 April. Satellite data showed ash plumes and clouds rising to 2-3 km altitude and drifting up to 12 km SW and E on 3 and 6 April (figure 48). KVERT issued VONAs on 3, 5, 14, 16 April describing explosions that produced ash plumes rising to 3 km, 3.5 km, 3.5 km, and 3 km altitude and drifting 5 km S, 5 km NE and SE, 72 km NNE, and 5 km NE, respectively. According to satellite data, the resulting ash cloud from the explosion on 14 April was 25 x 7 km in size and drifted 72-104 km NNE during 14-15 April. According to visual data by volcanologists from Severo-Kurilsk explosions sent ash up to 3.5 km altitude that drifted NE and E during 15-16, 22, 25-26, and 29 April.
The explosive eruption continued during May. Explosions during 3-4, 6-7, and 9-10 May generated ash plumes that rose to 4 km altitude and drifted SW and E. Satellite data showed a thermal anomaly on 3, 9, 13-14, and 24 May. During 12-16, 23-25, and 27-28 May ash plumes rose to 3.5 km altitude and drifted in different directions due to explosions. Two VONA notices were issued on 16 and 25 May, describing explosions that generated ash plumes rising to 3 km and 3.5 km altitude, respectively and extending 5 km E. The ash cloud on 25 May drifted 75 km SE.
Thermal activity in the summit crater, occasionally accompanied by ash plumes and ash deposits on the SE and E flanks due to frequent explosions, were visible in infrared and true color satellite images (figure 49).
Geologic Background. The flat-topped summit of the central cone of Ebeko volcano, one of the most active in the Kuril Islands, occupies the northern end of Paramushir Island. Three summit craters located along a SSW-NNE line form Ebeko volcano proper, at the northern end of a complex of five volcanic cones. Blocky lava flows extend west from Ebeko and SE from the neighboring Nezametnyi cone. The eastern part of the southern crater contains strong solfataras and a large boiling spring. The central crater is filled by a lake about 20 m deep whose shores are lined with steaming solfataras; the northern crater lies across a narrow, low barrier from the central crater and contains a small, cold crescentic lake. Historical activity, recorded since the late-18th century, has been restricted to small-to-moderate explosive eruptions from the summit craters. Intense fumarolic activity occurs in the summit craters, on the outer flanks of the cone, and in lateral explosion craters.
Information Contacts: Kamchatka Volcanic Eruptions Response Team (KVERT), Far Eastern Branch, Russian Academy of Sciences, 9 Piip Blvd., Petropavlovsk-Kamchatsky, 683006, Russia (URL: http://www.kscnet.ru/ivs/kvert/); MIROVA (Middle InfraRed Observation of Volcanic Activity), a collaborative project between the Universities of Turin and Florence (Italy) supported by the Centre for Volcanic Risk of the Italian Civil Protection Department (URL: http://www.mirovaweb.it/); Copernicus Browser, Copernicus Data Space Ecosystem, European Space Agency (URL: https://dataspace.copernicus.eu/browser/).
Home Reef
Tonga
18.992°S, 174.775°W; summit elev. -10 m
All times are local (unless otherwise noted)
Discolored plumes continued during November 2022-April 2023
Home Reef is a submarine volcano located in the central Tonga islands between Lateiki (Metis Shoal) and Late Island. The first recorded eruption occurred in the mid-19th century, when an ephemeral island formed. An eruption in 1984 produced a 12-km-high eruption plume, a large volume of floating pumice, and an ephemeral island 500 x 1,500 m wide, with cliffs 30-50 m high that enclosed a water-filled crater. Another island-forming eruption in 2006 produced widespread pumice rafts that drifted as far as Australia; by 2008 the island had eroded below sea level. The previous eruption occurred during October 2022 and was characterized by a new island-forming eruption, lava effusion, ash plumes, discolored water, and gas-and-steam plumes (BGVN 47:11). This report covers discolored water plumes during November 2022 through April 2023 using satellite data.
Discolored plumes continued during the reporting period and were observed in true color satellite images on clear weather days. Satellite images show light green-yellow discolored water extending W on 8 and 28 November 2022 (figure 31), and SW on 18 November. Light green-yellow plumes extended W on 3 December, S on 13 December, SW on 18 December, and W and S on 23 December (figure 31). On 12 January 2023 discolored green-yellow plumes extended to the NE, E, SE, and N. The plume moved SE on 17 January and NW on 22 January. Faint discolored water in February was visible moving NE on 1 February. A discolored plume extended NW on 8 and 28 March and NW on 13 March (figure 31). During April, clear weather showed green-blue discolored plumes moving S on 2 April, W on 7 April, and NE and S on 12 April. A strong green-yellow discolored plume extended E and NE on 22 April for several kilometers (figure 31).
Geologic Background. Home Reef, a submarine volcano midway between Metis Shoal and Late Island in the central Tonga islands, was first reported active in the mid-19th century, when an ephemeral island formed. An eruption in 1984 produced a 12-km-high eruption plume, large amounts of floating pumice, and an ephemeral 500 x 1,500 m island, with cliffs 30-50 m high that enclosed a water-filled crater. In 2006 an island-forming eruption produced widespread dacitic pumice rafts that drifted as far as Australia. Another island was built during a September-October 2022 eruption.
Information Contacts: Copernicus Browser, Copernicus Data Space Ecosystem, European Space Agency (URL: https://dataspace.copernicus.eu/browser/).
Semisopochnoi (United States) — June 2023 Cite this Report
Semisopochnoi
United States
51.93°N, 179.58°E; summit elev. 1221 m
All times are local (unless otherwise noted)
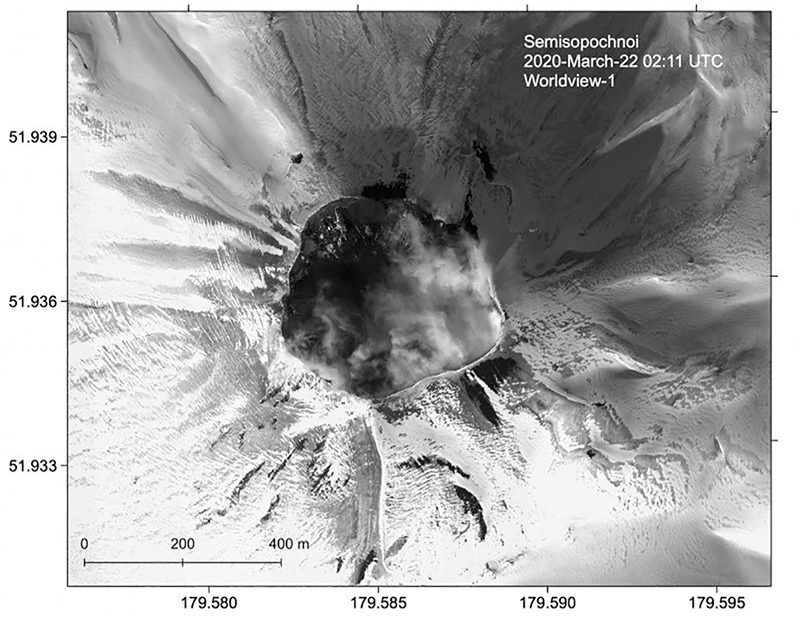
Occasional explosions, ash deposits, and gas-and-steam plumes during December 2022-May 2023
Semisopochnoi is located in the western Aleutians, is 20-km-wide at sea level, and contains an 8-km-wide caldera. The three-peaked Mount Young (formerly Cerberus) was constructed within the caldera during the Holocene. Each of these peaks contains a summit crater; the lava flows on the N flank appear younger than those on the S side. The current eruption period began in early February 2021 and has more recently consisted of intermittent explosions and ash emissions (BGVN 47:12). This report updates activity during December 2022 through May 2023 using daily, weekly, and special reports from the Alaska Volcano Observatory (AVO). AVO monitors the volcano using local seismic and infrasound sensors, satellite data, web cameras, and remote infrasound and lightning networks.
Activity during most of December 2022 was relatively quiet; according to AVO no eruptive or explosive activity was observed since 7 November 2022. Intermittent tremor and occasional small earthquakes were observed in geophysical data. Continuous gas-and-steam emissions were observed from the N crater of Mount Young in webcam images on clear weather days (figure 25). On 24 December, there was a slight increase in earthquake activity and several small possible explosion signals were detected in infrasound data. Eruptive activity resumed on 27 December at the N crater of Mount Young; AVO issued a Volcano Activity Notice (VAN) that reported minor ash deposits on the flanks of Mount Young that extended as far as 1 km from the vent, according to webcam images taken during 27-28 December (figure 26). No ash plumes were observed in webcam or satellite imagery, but a persistent gas-and-steam plume that might have contained some ash rose to 1.5 km altitude. As a result, AVO raised the Aviation Color Code (ACC) to Orange (the second highest level on a four-color scale) and the Volcano Alert Level (VAL) to Watch (the second highest level on a four-level scale). Possible explosions were detected during 21 December 2022 through 1 January 2023 and seismic tremor was recorded during 30-31 December.
During January 2023 eruptive activity continued at the active N crater of Mount Young. Minor ash deposits were observed on the flanks, extending about 2 km SSW, based on webcam images from 1 and 3 January. A possible explosion occurred during 1-2 January based on elevated seismicity recorded on local seismometers and an infrasound signal recorded minutes later by an array at Adak. Though no ash plumes were observed in webcam or satellite imagery, a persistent gas-and-steam plume rose to 1.5 km altitude that might have carried minor traces of ash. Ash deposits were accompanied by periods of elevated seismicity and infrasound signals from the local geophysical network, which AVO reported were likely due to weak explosive activity. Low-level explosive activity was also detected during 2-3 January, with minor gas-and-steam emissions and a new ash deposit that was visible in webcam images. Low-level explosive activity was detected in geophysical data during 4-5 January, with elevated seismicity and infrasound signals observed on local stations. Volcanic tremor was detected during 7-9 January and very weak explosive activity was detected in seismic and infrasound data on 9 January. Weak seismic and infrasound signals were recorded on 17 January, which indicated minor explosive activity, but no ash emissions were observed in clear webcam images; a gas-and-steam plume continued to rise to 1.5 km altitude. During 29-30 January, ash deposits near the summit were observed on fresh snow, according to webcam images.
The active N cone at Mount Young continued to produce a gas-and-steam plume during February, but no ash emissions or explosive events were detected. Seismicity remained elevated with faint tremor during early February. Gas-and-steam emissions from the N crater were observed in clear webcam images on 11-13 and 16 February; no explosive activity was detected in seismic, infrasound, or satellite data. Seismicity has also decreased, with no significant seismic tremor observed since 25 January. Therefore, the ACC was lowered to Yellow (the second lowest level on a four-color scale) and the VAL was lowered to Advisory (the second lowest level on a four-color scale) on 22 February.
Gas-and-steam emissions persisted during March from the N cone of Mount Young, based on clear webcam images. A few brief episodes of weak tremor were detected in seismic data, although seismicity decreased over the month. A gas-and-steam plume detected in satellite data extended 150 km on 18 March. Low-level ash emissions from the N cone at Mount Young were observed in several webcam images during 18-19 March, in addition to small explosions and volcanic tremor. The ACC was raised to Orange and the VAL increased to Watch on 19 March. A small explosion was detected in seismic and infrasound data on 21 March.
Low-level unrest continued during April, although cloudy weather often obscured views of the summit; periods of seismic tremor and local earthquakes were recorded. During 3-4 April a gas-and-steam plume was visible traveling more than 200 km overnight; no ash was evident in the plume, according to AVO. A gas-and-steam plume was observed during 4-6 April that extended 400 km but did not seem to contain ash. Small explosions were detected in seismic and infrasound data on 5 April. Occasional clear webcam images showed continuing gas-and-steam emissions rose from Mount Young, but no ash deposits were observed on the snow. On 19 April small explosions and tremor were detected in seismic and infrasound data. A period of seismic tremor was detected during 22-25 April, with possible weak explosions on 25 April. Ash deposits were visible near the crater rim, but it was unclear if these deposits were recent or due to older deposits.
Occasional small earthquakes were recorded during May, but there were no signs of explosive activity seen in geophysical data. Gas-and-steam emissions continued from the N crater of Mount Young, based on webcam images, and seismicity remained slightly elevated. A new, light ash deposit was visible during the morning of 5 May on fresh snow on the NW flank of Mount Young. During 10 May periods of volcanic tremor were observed. The ACC was lowered to Yellow and the VAL to Advisory on 17 May due to no additional evidence of activity.
Geologic Background. Semisopochnoi, the largest subaerial volcano of the western Aleutians, is 20 km wide at sea level and contains an 8-km-wide caldera. It formed as a result of collapse of a low-angle, dominantly basaltic volcano following the eruption of a large volume of dacitic pumice. The high point of the island is Anvil Peak, a double-peaked late-Pleistocene cone that forms much of the island's northern part. The three-peaked Mount Cerberus (renamed Mount Young in 2023) was constructed within the caldera during the Holocene. Each of the peaks contains a summit crater; lava flows on the N flank appear younger than those on the south side. Other post-caldera volcanoes include the symmetrical Sugarloaf Peak SSE of the caldera and Lakeshore Cone, a small cinder cone at the edge of Fenner Lake in the NE part of the caldera. Most documented eruptions have originated from Young, although Coats (1950) considered that both Sugarloaf and Lakeshore Cone could have been recently active.
Information Contacts: Alaska Volcano Observatory (AVO), a cooperative program of a) U.S. Geological Survey, 4200 University Drive, Anchorage, AK 99508-4667 USA (URL: https://avo.alaska.edu/), b) Geophysical Institute, University of Alaska, PO Box 757320, Fairbanks, AK 99775-7320, USA, and c) Alaska Division of Geological & Geophysical Surveys, 794 University Ave., Suite 200, Fairbanks, AK 99709, USA (URL: http://dggs.alaska.gov/).
Ambae
Vanuatu
15.389°S, 167.835°E; summit elev. 1496 m
All times are local (unless otherwise noted)
New lava flow, ash plumes, and sulfur dioxide plumes during February-May 2023
Ambae, also known as Aoba, is a large basaltic shield volcano in Vanuatu. A broad pyroclastic cone containing three crater lakes (Manaro Ngoru, Voui, and Manaro Lakua) is located at the summit within the youngest of at least two nested calderas. Periodic phreatic and pyroclastic explosions have been reported since the 16th century. A large eruption more than 400 years ago resulted in a volcanic cone within the summit crater that is now filled by Lake Voui; the similarly sized Lake Manaro fills the western third of the caldera. The previous eruption ended in August 2022 that was characterized by gas-and-steam and ash emissions and explosions of wet tephra (BGVN 47:10). This report covers a new eruption during February through May 2023 that consisted of a new lava flow, ash plumes, and sulfur dioxide emissions, using information from the Vanuatu Meteorology and Geo-Hazards Department (VMGD) and satellite data.
During the reporting period, the Alert Level remained at a 2 (on a scale of 0-5), which has been in place since December 2021. Activity during October 2022 through March 2023 remained relatively low and mostly consisted of gas-and-steam emissions in Lake Voui. VMGD reported that at 1300 on 15 November a satellite image captured a strong amount of sulfur dioxide rising above the volcano (figure 99), and that seismicity slightly increased. The southern and northern part of the island reported a strong sulfur dioxide smell and heard explosions. On 20 February 2023 a gas-and-ash plume rose 1.3 km above the summit and drifted SSW, according to a webcam image (figure 100). Gas-and-steam and possibly ash emissions continued on 23 February and volcanic earthquakes were recorded by the seismic network.
During April, volcanic earthquakes and gas-and-steam and ash emissions were reported from the cone in Lake Voui. VMGD reported that activity increased during 5-7 April; high gas-and-steam and ash plumes were visible, accompanied by nighttime incandescence. According to a Wellington VAAC report, a low-level ash plume rose as high as 2.5 km above the summit and drifted W and SW on 5 April, based on satellite imagery. Reports in Saratamata stated that a dark ash plume drifted to the WSW, but no loud explosion was heard. Webcam images from 2100 showed incandescence above the crater and reflected in the clouds. According to an aerial survey, field observations, and satellite data, water was no longer present in the lake. A lava flow was reported effusing from the vent and traveling N into the dry Lake Voui, which lasted three days. The next morning at 0745 on 6 April a gas-and-steam and ash plume rose 5.4 km above the summit and drifted ESE, based on information from VMGD (figure 101). The Wellington VAAC also reported that light ashfall was observed on the island. Intermittent gas-and-steam and ash emissions were visible on 7 April, some of which rose to an estimated 3 km above the summit and drifted E. Webcam images during 0107-0730 on 7 April showed continuing ash emissions. A gas-and-steam and ash plume rose 695 m above the summit crater at 0730 on 19 April and drifted ESE, based on a webcam image (figure 102).
According to visual and infrared satellite data, water was visible in Lake Voui as late as 24 March 2023 (figure 103). The vent in the caldera showed a gas-and-steam plume drifted SE. On 3 April thermal activity was first detected, accompanied by a gas-and-ash plume that drifted W (figure 103). The lava flow moved N within the dry lake and was shown cooling by 8 April. By 23 April much of the water in the lake had returned. Occasional sulfur dioxide plumes were detected by the TROPOMI instrument on the Sentinel-5P satellite that exceeded 2 Dobson Units (DU) and drifted in different directions (figure 104).
Geologic Background. The island of Ambae, also known as Aoba, is a massive 2,500 km3 basaltic shield that is the most voluminous volcano of the New Hebrides archipelago. A pronounced NE-SW-trending rift zone with numerous scoria cones gives the 16 x 38 km island an elongated form. A broad pyroclastic cone containing three crater lakes (Manaro Ngoru, Voui, and Manaro Lakua) is located at the summit within the youngest of at least two nested calderas, the largest of which is 6 km in diameter. That large central edifice is also called Manaro Voui or Lombenben volcano. Post-caldera explosive eruptions formed the summit craters about 360 years ago. A tuff cone was constructed within Lake Voui (or Vui) about 60 years later. The latest known flank eruption, about 300 years ago, destroyed the population of the Nduindui area near the western coast.
Information Contacts: Geo-Hazards Division, Vanuatu Meteorology and Geo-Hazards Department (VMGD), Ministry of Climate Change Adaptation, Meteorology, Geo-Hazards, Energy, Environment and Disaster Management, Private Mail Bag 9054, Lini Highway, Port Vila, Vanuatu (URL: http://www.vmgd.gov.vu/, https://www.facebook.com/VanuatuGeohazardsObservatory/); Wellington Volcanic Ash Advisory Centre (VAAC), Meteorological Service of New Zealand Ltd (MetService), PO Box 722, Wellington, New Zealand (URL: http://www.metservice.com/vaac/, http://www.ssd.noaa.gov/VAAC/OTH/NZ/messages.html); MIROVA (Middle InfraRed Observation of Volcanic Activity), a collaborative project between the Universities of Turin and Florence (Italy) supported by the Centre for Volcanic Risk of the Italian Civil Protection Department (URL: http://www.mirovaweb.it/); Global Sulfur Dioxide Monitoring Page, Atmospheric Chemistry and Dynamics Laboratory, NASA Goddard Space Flight Center (NASA/GSFC), 8800 Greenbelt Road, Goddard, Maryland, USA (URL: https://so2.gsfc.nasa.gov/); Copernicus Browser, Copernicus Data Space Ecosystem, European Space Agency (URL: https://dataspace.copernicus.eu/browser/).
Ibu
Indonesia
1.488°N, 127.63°E; summit elev. 1325 m
All times are local (unless otherwise noted)
Daily ash explosions continue, along with thermal anomalies in the crater, October 2022-May 2023
Persistent eruptive activity since April 2008 at Ibu, a stratovolcano on Indonesian’s Halmahera Island, has consisted of daily explosive ash emissions and plumes, along with observations of thermal anomalies (BGVN 47:04). The current eruption continued during October 2022-May 2023, described below, based on advisories issued by the Pusat Vulkanologi dan Mitigasi Bencana Geologi (PVMBG, also known as Indonesian Center for Volcanology and Geological Hazard Mitigation, CVGHM), daily reports by MAGMA Indonesia (a PVMBG platform), and the Darwin Volcanic Ash Advisory Centre (VAAC), and various satellite data. The Alert Level during the reporting period remained at 2 (on a scale of 1-4), except raised briefly to 3 on 27 May, and the public was warned to stay at least 2 km away from the active crater and 3.5 km away on the N side of the volcano.
According to MAGMA Indonesia, during October 2022-May 2023, daily gray-and-white ash plumes of variable densities rose 200-1,000 m above the summit and drifted in multiple directions. On 30 October and 11 November, plumes rose a maximum of 2 km and 1.5 km above the summit, respectively (figures 42 and 43). According to the Darwin VAAC, discrete ash emissions on 13 November rose to 2.1 km altitude, or 800 m above the summit, and drifted W, and multiple ash emissions on 15 November rose 1.4 km above the summit and drifted NE. Occasional larger ash explosions through May 2023 prompted PVMBG to issue Volcano Observatory Notice for Aviation (VONA) alerts (table 6); the Aviation Color Code remained at Orange throughout this period.
Table 6. Volcano Observatory Notice for Aviation (VONA) ash plume alerts for Ibu issued by PVMBG during October 2022-May 2023. Maximum height above the summit was estimated by a ground observer. VONAs in January-May 2023 all described the ash plumes as dense.
| Date |
Time (local) |
Max height above summit |
Direction |
| 17 Oct 2022 |
0858 |
800 m |
SW |
| 18 Oct 2022 |
1425 |
800 m |
S |
| 19 Oct 2022 |
2017 |
600 m |
SW |
| 21 Oct 2022 |
0916 |
800 m |
NW |
| 16 Jan 2023 |
1959 |
600 m |
NE |
| 22 Jan 2023 |
0942 |
1,000 m |
E |
| 29 Jan 2023 |
2138 |
1,000 m |
E |
| 10 May 2023 |
0940 |
800 m |
NW |
| 10 May 2023 |
2035 |
600 m |
E |
| 21 May 2023 |
2021 |
600 m |
W |
| 21 May 2023 |
2140 |
1,000 m |
W |
| 29 May 2023 |
1342 |
800 m |
N |
| 31 May 2023 |
1011 |
1,000 m |
SW |
Sentinel-2 L1C satellite images throughout the reporting period show two, sometimes three persistent thermal anomalies in the summit crater, with the most prominent hotspot from the top of a cone within the crater. Clear views were more common during March-April 2023, when a vent and lava flows on the NE flank of the intra-crater cone could be distinguished (figure 44). White-to-grayish emissions were also observed during brief periods when weather clouds allowed clear views.
The MIROVA space-based volcano hotspot detection system recorded almost daily thermal anomalies throughout the reporting period, though cloud cover often interfered with detections. Data from imaging spectroradiometers aboard NASA’s Aqua and Terra satellites and processed using the MODVOLC algorithm (MODIS-MODVOLC) recorded hotspots on one day during October 2022 and December 2022, two days in April 2023, three days in November 2022 and May 2023, and four days in March 2023.
Geologic Background. The truncated summit of Gunung Ibu stratovolcano along the NW coast of Halmahera Island has large nested summit craters. The inner crater, 1 km wide and 400 m deep, has contained several small crater lakes. The 1.2-km-wide outer crater is breached on the N, creating a steep-walled valley. A large cone grew ENE of the summit, and a smaller one to the WSW has fed a lava flow down the W flank. A group of maars is located below the N and W flanks. The first observed and recorded eruption was a small explosion from the summit crater in 1911. Eruptive activity began again in December 1998, producing a lava dome that eventually covered much of the floor of the inner summit crater along with ongoing explosive ash emissions.
Information Contacts: Pusat Vulkanologi dan Mitigasi Bencana Geologi (PVMBG, also known as Indonesian Center for Volcanology and Geological Hazard Mitigation, CVGHM), Jalan Diponegoro 57, Bandung 40122, Indonesia (URL: http://www.vsi.esdm.go.id/); MAGMA Indonesia (Multiplatform Application for Geohazard Mitigation and Assessment in Indonesia), Kementerian Energi dan Sumber Daya Mineral (URL: https://magma.esdm.go.id/v1); Copernicus Browser, Copernicus Data Space Ecosystem, European Space Agency (URL: https://dataspace.copernicus.eu/browser/); MIROVA (Middle InfraRed Observation of Volcanic Activity), a collaborative project between the Universities of Turin and Florence (Italy) supported by the Centre for Volcanic Risk of the Italian Civil Protection Department (URL: http://www.mirovaweb.it/); Hawai'i Institute of Geophysics and Planetology (HIGP) - MODVOLC Thermal Alerts System, School of Ocean and Earth Science and Technology (SOEST), Univ. of Hawai'i, 2525 Correa Road, Honolulu, HI 96822, USA (URL: http://modis.higp.hawaii.edu/).
Dukono
Indonesia
1.6992°N, 127.8783°E; summit elev. 1273 m
All times are local (unless otherwise noted)
Continuing ash emissions, SO2 plumes, and thermal signals during October 2022-May 2023
Dukono, a remote volcano on Indonesia’s Halmahera Island, has been erupting continuously since 1933, with frequent ash explosions and sulfur dioxide plumes (BGVN 46:11, 47:10). This activity continued during October 2022 through May 2023, based on reports from the Pusat Vulkanologi dan Mitigasi Bencana Geologi (PVMBG; also known as Indonesian Center for Volcanology and Geological Hazard Mitigation, CVGHM), the Darwin Volcanic Ash Advisory Centre (VAAC), and satellite data. During this period, the Alert Level remained at 2 (on a scale of 1-4) and the public was warned to remain outside of the 2-km exclusion zone. The highest reported plume of the period reached 9.4 km above the summit on 14 November 2022.
According to MAGMA Indonesia (a platform developed by PVMBG), white, gray, or dark plumes of variable densities were observed almost every day during the reporting period, except when fog obscured the volcano (figure 33). Plumes generally rose 25-450 m above the summit, but rose as high as 700-800 m on several days, somewhat lower than the maximum heights reached earlier in 2022 when plumes reached as high as 1 km. However, the Darwin VAAC reported that on 14 November 2022, a discrete ash plume rose 9.4 km above the summit (10.7 km altitude), accompanied by a strong hotspot and a sulfur dioxide signal observed in satellite imagery; a continuous ash plume that day and through the 15th rose to 2.1-2.4 km altitude and drifted NE.
Sentinel-2 images were obscured by weather clouds almost every viewing day during the reporting period. However, the few reasonably clear images showed a hotspot and white or gray emissions and plumes. Strong SO2 plumes from Dukono were present on many days during October 2022-May 2023, as detected using the TROPOMI instrument on the Sentinel-5P satellite (figure 34).
Geologic Background. Reports from this remote volcano in northernmost Halmahera are rare, but Dukono has been one of Indonesia's most active volcanoes. More-or-less continuous explosive eruptions, sometimes accompanied by lava flows, have occurred since 1933. During a major eruption in 1550 CE, a lava flow filled in the strait between Halmahera and the N-flank Gunung Mamuya cone. This complex volcano presents a broad, low profile with multiple summit peaks and overlapping craters. Malupang Wariang, 1 km SW of the summit crater complex, contains a 700 x 570 m crater that has also been active during historical time.
Information Contacts: Pusat Vulkanologi dan Mitigasi Bencana Geologi (PVMBG, also known as Indonesian Center for Volcanology and Geological Hazard Mitigation, CVGHM), Jalan Diponegoro 57, Bandung 40122, Indonesia (URL: http://www.vsi.esdm.go.id/); MAGMA Indonesia (Multiplatform Application for Geohazard Mitigation and Assessment in Indonesia), Kementerian Energi dan Sumber Daya Mineral (URL: https://magma.esdm.go.id/v1); Darwin Volcanic Ash Advisory Centre (VAAC), Bureau of Meteorology, Northern Territory Regional Office, PO Box 40050, Casuarina, NT 0811, Australia (URL: http://www.bom.gov.au/info/vaac/); NASA Global Sulfur Dioxide Monitoring Page, Atmospheric Chemistry and Dynamics Laboratory, NASA Goddard Space Flight Center (NASA/GSFC), 8800 Greenbelt Road, Goddard, Maryland, USA (URL: https://so2.gsfc.nasa.gov/); Sentinel Hub Playground (URL: https://www.sentinel-hub.com/explore/sentinel-playground).
Sabancaya
Peru
15.787°S, 71.857°W; summit elev. 5960 m
All times are local (unless otherwise noted)
Explosions, gas-and-ash plumes, and thermal activity persist during November 2022-April 2023
Sabancaya is located in Peru, NE of Ampato and SE of Hualca Hualca. Eruptions date back to 1750 and have been characterized by explosions, phreatic activity, ash plumes, and ashfall. The current eruption period began in November 2016 and has more recently consisted of daily explosions, gas-and-ash plumes, and thermal activity (BGVN 47:11). This report updates activity during November 2022 through April 2023 using information from Instituto Geophysico del Peru (IGP) that use weekly activity reports and various satellite data.
Intermittent low-to-moderate power thermal anomalies were reported by the MIROVA project during November 2022 through April 2023 (figure 119). There were few short gaps in thermal activity during mid-December 2022, late December-to-early January 2023, late January to mid-February, and late February. According to data recorded by the MODVOLC thermal algorithm, there were a total of eight thermal hotspots: three in November 2022, three in February 2023, one in March, and one in April. On clear weather days, some of this thermal anomaly was visible in infrared satellite imagery showing the active lava dome in the summit crater (figure 120). Almost daily moderate-to-strong sulfur dioxide plumes were recorded during the reporting period by the TROPOMI instrument on the Sentinel-5P satellite (figure 121). Many of these plumes exceeded 2 Dobson Units (DU) and drifted in multiple directions.
IGP reported that moderate activity during November and December 2022 continued; during November, an average number of explosions were reported each week: 30, 33, 36, and 35, and during December, it was 32, 40, 47, 52, and 67. Gas-and-ash plumes in November rose 3-3.5 km above the summit and drifted E, NE, SE, S, N, W, and SW. During December the gas-and-ash plumes rose 2-4 km above the summit and drifted in different directions. There were 1,259 volcanic earthquakes recorded during November and 1,693 during December. Seismicity also included volcano-tectonic-type events that indicate rock fracturing events. Slight inflation was observed in the N part of the volcano near Hualca Hualca (4 km N). Thermal activity was frequently reported in the crater at the active lava dome (figure 120).
Explosive activity continued during January and February 2023. The average number of explosions were reported each week during January (51, 50, 60, and 59) and February (43, 54, 51, and 50). Gas-and-ash plumes rose 1.6-2.9 km above the summit and drifted NW, SW, and W during January and rose 1.4-2.8 above the summit and drifted W, SW, E, SE, N, S, NW, and NE during February. IGP also detected 1,881 volcanic earthquakes during January and 1,661 during February. VT-type earthquakes were also reported. Minor inflation persisted near Hualca Hualca. Satellite imagery showed continuous thermal activity in the crater at the lava dome (figure 120).
During March, the average number of explosions each week was 46, 48, 31, 35, and 22 and during April, it was 29, 41, 31, and 27. Accompanying gas-and-ash plumes rose 1.7-2.6 km above the summit crater and drifted W, SW, NW, S, and SE during March. According to a Buenos Aires Volcano Ash Advisory Center (VAAC) notice, on 22 March at 1800 through 23 March an ash plume rose to 7 km altitude and drifted NW. By 0430 an ash plume rose to 7.6 km altitude and drifted W. On 24 and 26 March continuous ash emissions rose to 7.3 km altitude and drifted SW and on 28 March ash emissions rose to 7.6 km altitude. During April, gas-and-ash plumes rose 1.6-2.5 km above the summit and drifted W, SW, S, NW, NE, and E. Frequent volcanic earthquakes were recorded, with 1,828 in March and 1,077 in April, in addition to VT-type events. Thermal activity continued to be reported in the summit crater at the lava dome (figure 120).
Geologic Background. Sabancaya, located in the saddle NE of Ampato and SE of Hualca Hualca volcanoes, is the youngest of these volcanic centers and the only one to have erupted in historical time. The oldest of the three, Nevado Hualca Hualca, is of probable late-Pliocene to early Pleistocene age. The name Sabancaya (meaning "tongue of fire" in the Quechua language) first appeared in records in 1595 CE, suggesting activity prior to that date. Holocene activity has consisted of Plinian eruptions followed by emission of voluminous andesitic and dacitic lava flows, which form an extensive apron around the volcano on all sides but the south. Records of historical eruptions date back to 1750.
Information Contacts: Instituto Geofisico del Peru (IGP), Centro Vulcanológico Nacional (CENVUL), Calle Badajoz N° 169 Urb. Mayorazgo IV Etapa, Ate, Lima 15012, Perú (URL: https://www.igp.gob.pe/servicios/centro-vulcanologico-nacional/inicio); Buenos Aires Volcanic Ash Advisory Center (VAAC), Servicio Meteorológico Nacional-Fuerza Aérea Argentina, 25 de mayo 658, Buenos Aires, Argentina (URL: http://www.smn.gov.ar/vaac/buenosaires/inicio.php); MIROVA (Middle InfraRed Observation of Volcanic Activity), a collaborative project between the Universities of Turin and Florence (Italy) supported by the Centre for Volcanic Risk of the Italian Civil Protection Department (URL: http://www.mirovaweb.it/); Hawai'i Institute of Geophysics and Planetology (HIGP) - MODVOLC Thermal Alerts System, School of Ocean and Earth Science and Technology (SOEST), Univ. of Hawai'i, 2525 Correa Road, Honolulu, HI 96822, USA (URL: http://modis.higp.hawaii.edu/); NASA Global Sulfur Dioxide Monitoring Page, Atmospheric Chemistry and Dynamics Laboratory, NASA Goddard Space Flight Center (NASA/GSFC), 8800 Greenbelt Road, Goddard MD 20771, USA (URL: https://so2.gsfc.nasa.gov/); Copernicus Browser, Copernicus Data Space Ecosystem, European Space Agency (URL: https://dataspace.copernicus.eu/browser/).
Sheveluch
Russia
56.653°N, 161.36°E; summit elev. 3283 m
All times are local (unless otherwise noted)
Significant explosions destroyed part of the lava-dome complex during April 2023
Sheveluch (also spelled Shiveluch) in Kamchatka, has had at least 60 large eruptions during the last 10,000 years. The summit is truncated by a broad 9-km-wide caldera that is breached to the S, and many lava domes occur on the outer flanks. The lava dome complex was constructed within the large open caldera. Frequent collapses of the dome complex have produced debris avalanches; the resulting deposits cover much of the caldera floor. A major south-flank collapse during a 1964 Plinian explosion produced a scarp in which a “Young Sheveluch” dome began to form in 1980. Repeated episodes of dome formation and destruction since then have produced major and minor ash plumes, pyroclastic flows, block-and-ash flows, and “whaleback domes” of spine-like extrusions in 1993 and 2020 (BGVN 45:11). The current eruption period began in August 1999 and has more recently consisted of lava dome growth, explosions, ash plumes, and avalanches (BGVN 48:01). This report covers a significant explosive eruption during early-to-mid-April 2023 that generated a 20 km altitude ash plume, produced a strong sulfur dioxide plume, and destroyed part of the lava-dome complex; activity described during January through April 2023 use information primarily from the Kamchatka Volcanic Eruptions Response Team (KVERT) and various satellite data.
Satellite data. Activity during the majority of this reporting period was characterized by continued lava dome growth, strong fumarole activity, explosions, and hot avalanches. According to the MODVOLC Thermal Alerts System, 140 hotspots were detected through the reporting period, with 33 recorded in January 2023, 29 in February, 44 in March, and 34 in April. Frequent strong thermal activity was recorded during January 2023 through April, according to the MIROVA (Middle InfraRed Observation of Volcanic Activity) graph and resulted from the continuously growing lava dome (figure 94). A slightly stronger pulse in thermal activity was detected in early-to-mid-April, which represented the significant eruption that destroyed part of the lava-dome complex. Thermal anomalies were also visible in infrared satellite imagery at the summit crater (figure 95).
During January 2023 KVERT reported continued growth of the lava dome, accompanied by strong fumarolic activity, incandescence from the lava dome, explosions, ash plumes, and avalanches. Satellite data showed a daily thermal anomaly over the volcano. Video data showed ash plumes associated with collapses at the dome that generated avalanches that in turn produced ash plumes rising to 3.5 km altitude and drifting 40 km W on 4 January and rising to 7-7.5 km altitude and drifting 15 km SW on 5 January. A gas-and-steam plume containing some ash that was associated with avalanches rose to 5-6 km altitude and extended 52-92 km W on 7 January. Explosions that same day produced ash plumes that rose to 7-7.5 km altitude and drifted 10 km W. According to a Volcano Observatory Notice for Aviation (VONA) issued at 1344 on 19 January, explosions produced an ash cloud that was 15 x 25 km in size and rose to 9.6-10 km altitude, drifting 21-25 km W; as a result, the Aviation Color Code (ACC) was raised to Red (the highest level on a four-color scale). Another VONA issued at 1635 reported that no more ash plumes were observed, and the ACC was lowered to Orange (the second highest level on a four-color scale). On 22 January an ash plume from collapses and avalanches rose to 5 km altitude and drifted 25 km NE and SW; ash plumes associated with collapses extended 70 km NE on 27 and 31 January.
Lava dome growth, fumarolic activity, dome incandescence, and occasional explosions and avalanches continued during February and March. A daily thermal anomaly was visible in satellite data. Explosions on 1 February generated ash plumes that rose to 6.3-6.5 km altitude and extended 15 km NE. Video data showed an ash cloud from avalanches rising to 5.5 km altitude and drifting 5 km SE on 2 February. Satellite data showed gas-and-steam plumes containing some ash rose to 5-5.5 km altitude and drifted 68-110 km ENE and NE on 6 February, to 4.5-5 km altitude and drifted 35 km WNW on 22 February, and to 3.7-4 km altitude and drifted 47 km NE on 28 February. Scientists from the Kamchatka Volcanological Station (KVS) went on a field excursion on 25 February to document the growing lava dome, and although it was cloudy most of the day, nighttime incandescence was visible. Satellite data showed an ash plume extending up to 118 km E during 4-5 March. Video data from 1150 showed an ash cloud from avalanches rose to 3.7-5.5 km altitude and drifted 5-10 km ENE and E on 5 March. On 11 March an ash plume drifted 62 km E. On 27 March ash plumes rose to 3.5 km altitude and drifted 100 km E. Avalanches and constant incandescence at the lava dome was focused on the E and NE slopes on 28 March. A gas-and-steam plume containing some ash rose to 3.5 km altitude and moved 40 km E on 29 March. Ash plumes on 30 March rose to 3.5-3.7 km altitude and drifted 70 km NE.
Similar activity continued during April, with lava dome growth, strong fumarolic activity, incandescence in the dome, occasional explosions, and avalanches. A thermal anomaly persisted throughout the month. During 1-4 April weak ash plumes rose to 2.5-3 km altitude and extended 13-65 km SE and E.
Activity during 11 April 2023. The Institute of Volcanology and Seismology, Far Eastern Branch, Russian Academy of Sciences (IVS FEB RAS) reported a significant increase in seismicity around 0054 on 11 April, as reported by strong explosions detected on 11 April beginning at 0110 that sent ash plumes up to 7-10 km altitude and extended 100-435 km W, WNW, NNW, WSW, and SW. According to a Tokyo VAAC report the ash plume rose to 15.8 km altitude. By 0158 the plume extended over a 75 x 100 km area. According to an IVS FEB RAS report, the eruptive column was not vertical: the initial plume at 0120 on 11 April deviated to the NNE, at 0000 on 12 April, it drifted NW, and by 1900 it drifted SW. KVS reported that significant pulses of activity occurred at around 0200, 0320, and then a stronger phase around 0600. Levin Dmitry took a video from near Békés (3 km away) at around 0600 showing a rising plume; he also reported that a pyroclastic flow traveled across the road behind him as he left the area. According to IVS FEB RAS, the pyroclastic flow traveled several kilometers SSE, stopping a few hundred meters from a bridge on the road between Klyuchi and Petropavlovsk-Kamchatsky.
Ashfall was first observed in Klyuchi (45 km SW) at 0630, and a large, black ash plume blocked light by 0700. At 0729 KVERT issued a Volcano Observatory Notice for Aviation (VONA) raising the Aviation Color Code to Red (the highest level on a four-color scale). It also stated that a large ash plume had risen to 10 km altitude and drifted 100 km W. Near-constant lightning strikes were reported in the plume and sounds like thunderclaps were heard until about 1000. According to IVS FEB RAS the cloud was 200 km long and 76 km wide by 0830, and was spreading W at altitudes of 6-12 km. In the Klyuchi Village, the layer of both ash and snow reached 8.5 cm (figure 96); ashfall was also reported in Kozyrevsk (112 km SW) at 0930, Mayskoye, Anavgay, Atlasovo, Lazo, and Esso. Residents in Klyuchi reported continued darkness and ashfall at 1100. In some areas, ashfall was 6 cm deep and some residents reported dirty water coming from their plumbing. According to IVS FEB RAS, an ash cloud at 1150 rose to 5-20 km altitude and was 400 km long and 250 km wide, extending W. A VONA issued at 1155 reported that ash had risen to 10 km and drifted 340 km NNW and 240 km WSW. According to Simon Carn (Michigan Technological University), about 0.2 Tg of sulfur dioxide in the plume was measured in a satellite image from the TROPOMI instrument on the Sentinel-5P satellite acquired at 1343 that covered an area of about 189,000 km2 (figure 97). Satellite data at 1748 showed an ash plume that rose to 8 km altitude and drifted 430 km WSW and S, according to a VONA.
Activity during 12-15 April 2023. On 12 April at 0730 satellite images showed ash plumes rose to 7-8 km altitude and extended 600 km SW, 1,050 km ESE, and 1,300-3,000 km E. By 1710 that day, the explosions weakened. According to news sources, the ash-and-gas plumes drifted E toward the Aleutian Islands and reached the Gulf of Alaska by 13 April, causing flight disruptions. More than 100 flights involving Alaska airspace were cancelled due to the plume. Satellite data showed ash plumes rising to 4-5.5 km altitude and drifted 400-415 km SE and ESE on 13 April. KVS volcanologists observed the pyroclastic flow deposits and noted that steam rose from downed, smoldering trees. They also noted that the deposits were thin with very few large fragments, which differed from previous flows. The ash clouds traveled across the Pacific Ocean. Flight cancellations were also reported in NW Canada (British Columbia) during 13-14 April. During 14-15 April ash plumes rose to 6 km altitude and drifted 700 km NW.
Alaskan flight schedules were mostly back to normal by 15 April, with only minor delays and far less cancellations; a few cancellations continued to be reported in Canada. Clear weather on 15 April showed that most of the previous lava-dome complex was gone and a new crater roughly 1 km in diameter was observed (figure 98); gas-and-steam emissions were rising from this crater. Evidence suggested that there had been a directed blast to the SE, and pyroclastic flows traveled more than 20 km. An ash plume rose to 4.5-5.2 km altitude and drifted 93-870 km NW on 15 April.
Activity during 16-30 April 2023. Resuspended ash was lifted by the wind from the slopes and rose to 4 km altitude and drifted 224 km NW on 17 April. KVERT reported a plume of resuspended ash from the activity during 10-13 April on 19 April that rose to 3.5-4 km altitude and drifted 146-204 km WNW. During 21-22 April a plume stretched over the Scandinavian Peninsula. A gas-and-steam plume containing some ash rose to 3-3.5 km altitude and drifted 60 km SE on 30 April. A possible new lava dome was visible on the W slope of the volcano on 29-30 April (figure 99); satellite data showed two thermal anomalies, a bright one over the existing lava dome and a weaker one over the possible new one.
References. Girina, O., Loupian, E., Horvath, A., Melnikov, D., Manevich, A., Nuzhdaev, A., Bril, A., Ozerov, A., Kramareva, L., Sorokin, A., 2023, Analysis of the development of the paroxysmal eruption of Sheveluch volcano on April 10–13, 2023, based on data from various satellite systems, ??????????? ???????? ??? ?? ???????, 20(2).
Geologic Background. The high, isolated massif of Sheveluch volcano (also spelled Shiveluch) rises above the lowlands NNE of the Kliuchevskaya volcano group. The 1,300 km3 andesitic volcano is one of Kamchatka's largest and most active volcanic structures, with at least 60 large eruptions during the Holocene. The summit of roughly 65,000-year-old Stary Shiveluch is truncated by a broad 9-km-wide late-Pleistocene caldera breached to the south. Many lava domes occur on its outer flanks. The Molodoy Shiveluch lava dome complex was constructed during the Holocene within the large open caldera; Holocene lava dome extrusion also took place on the flanks of Stary Shiveluch. Widespread tephra layers from these eruptions have provided valuable time markers for dating volcanic events in Kamchatka. Frequent collapses of dome complexes, most recently in 1964, have produced debris avalanches whose deposits cover much of the floor of the breached caldera.
Information Contacts: Kamchatka Volcanic Eruptions Response Team (KVERT), Far Eastern Branch, Russian Academy of Sciences, 9 Piip Blvd., Petropavlovsk-Kamchatsky, 683006, Russia (URL: http://www.kscnet.ru/ivs/kvert/); Institute of Volcanology and Seismology, Far Eastern Branch, Russian Academy of Sciences (IVS FEB RAS), 9 Piip Blvd., Petropavlovsk-Kamchatsky 683006, Russia (URL: http://www.kscnet.ru/ivs/eng/); Kamchatka Volcanological Station, Kamchatka Branch of Geophysical Survey, (KB GS RAS), Klyuchi, Kamchatka Krai, Russia (URL: http://volkstat.ru/); Hawai'i Institute of Geophysics and Planetology (HIGP) - MODVOLC Thermal Alerts System, School of Ocean and Earth Science and Technology (SOEST), Univ. of Hawai'i, 2525 Correa Road, Honolulu, HI 96822, USA (URL: http://modis.higp.hawaii.edu/); MIROVA (Middle InfraRed Observation of Volcanic Activity), a collaborative project between the Universities of Turin and Florence (Italy) supported by the Centre for Volcanic Risk of the Italian Civil Protection Department (URL: http://www.mirovaweb.it/); Copernicus Browser, Copernicus Data Space Ecosystem, European Space Agency (URL: https://dataspace.copernicus.eu/browser/); Kam 24 News Agency, 683032, Kamchatka Territory, Petropavlovsk-Kamchatsky, Vysotnaya St., 2A (URL: https://kam24.ru/news/main/20230411/96657.html#.Cj5Jrky6.dpuf); Simon Carn, Geological and Mining Engineering and Sciences, Michigan Technological University, 1400 Townsend Drive, Houghton, MI 49931, USA (URL: http://www.volcarno.com/, Twitter: @simoncarn).
Bezymianny
Russia
55.972°N, 160.595°E; summit elev. 2882 m
All times are local (unless otherwise noted)
Explosions, ash plumes, lava flows, and avalanches during November 2022-April 2023
Bezymianny is located on the Kamchatka Peninsula of Russia as part of the Klyuchevskoy volcano group. Historic eruptions began in 1955 and have been characterized by dome growth, explosions, pyroclastic flows, ash plumes, and ashfall. During the 1955-56 eruption a large open crater was formed by collapse of the summit and an associated lateral blast. Subsequent episodic but ongoing lava-dome growth, accompanied by intermittent explosive activity and pyroclastic flows, has largely filled the 1956 crater. The current eruption period began in December 2016 and more recent activity has consisted of strong explosions, ash plumes, and thermal activity (BGVN 47:11). This report covers activity during November 2022 through April 2023, based on weekly and daily reports from the Kamchatka Volcano Eruptions Response Team (KVERT) and satellite data.
Activity during November and March 2023 was relatively low and mostly consisted of gas-and-steam emissions, occasional small collapses that generated avalanches along the lava dome slopes, and a persistent thermal anomaly over the volcano that was observed in satellite data on clear weather days. According to the Tokyo VAAC and KVERT, an explosion produced an ash plume that rose to 6 km altitude and drifted 25 km NE at 1825 on 29 March.
Gas-and-steam emissions, collapses generating avalanches, and thermal activity continued during April. According to two Volcano Observatory Notice for Aviation (VONA) issued on 2 and 6 April (local time) ash plumes rose to 3 km and 3.5-3.8 km altitude and drifted 35 km E and 140 km E, respectively. Satellite data from KVERT showed weak ash plumes extending up to 550 km E on 2 and 5-6 April.
A VONA issued at 0843 on 7 April described an ash plume that rose to 4.5-5 km altitude and drifted 250 km ESE. Later that day at 1326 satellite data showed an ash plume that rose to 5.5-6 km altitude and drifted 150 km ESE. A satellite image from 1600 showed an ash plume extending as far as 230 km ESE; KVERT noted that ash emissions were intensifying, likely due to avalanches from the growing lava dome. The Aviation Color Code (ACC) was raised to Red (the highest level on a four-color scale). At 1520 satellite data showed an ash plume rising to 5-5.5 km altitude and drifting 230 km ESE. That same day, Kamchatka Volcanological Station (KVS) volcanologists traveled to Ambon to collect ash; they reported that a notable eruption began at 1730, and within 20 minutes a large ash plume rose to 10 km altitude and drifted NW. KVERT reported that the strong explosive phase began at 1738. Video and satellite data taken at 1738 showed an ash plume that rose to 10-12 km altitude and drifted up to 2,800 km SE and E. Explosions were clearly audible 20 km away for 90 minutes, according to KVS. Significant amounts of ash fell at the Apakhonchich station, which turned the snow gray; ash continued to fall until the morning of 8 April. In a VONA issued at 0906 on 8 April, KVERT stated that the explosive eruption had ended; ash plumes had drifted 2,000 km E. The ACC was lowered to Orange (the third highest level on a four-color scale). The KVS team saw a lava flow on the active dome once the conditions were clear that same day (figure 53). On 20 April lava dome extrusion was reported; lava flows were noted on the flanks of the dome, and according to KVERT satellite data, a thermal anomaly was observed in the area. The ACC was lowered to Yellow (the second lowest on a four-color scale).
Satellite data showed an increase in thermal activity beginning in early April 2023. A total of 31 thermal hotspots were detected by the MODVOLC thermal algorithm on 4, 5, 7, and 12 April 2023. The elevated thermal activity resulted from an increase in explosive activity and the start of an active lava flow. The MIROVA (Middle InfraRed Observation of Volcanic Activity) volcano hotspot detection system based on the analysis of MODIS data also showed a pulse in thermal activity during the same time (figure 54). Infrared satellite imagery captured a continuous thermal anomaly at the summit crater, often accompanied by white gas-and-steam emissions (figure 55). On 4 April 2023 an active lava flow was observed descending the SE flank.
Geologic Background. The modern Bezymianny, much smaller than its massive neighbors Kamen and Kliuchevskoi on the Kamchatka Peninsula, was formed about 4,700 years ago over a late-Pleistocene lava-dome complex and an edifice built about 11,000-7,000 years ago. Three periods of intensified activity have occurred during the past 3,000 years. The latest period, which was preceded by a 1,000-year quiescence, began with the dramatic 1955-56 eruption. This eruption, similar to that of St. Helens in 1980, produced a large open crater that was formed by collapse of the summit and an associated lateral blast. Subsequent episodic but ongoing lava-dome growth, accompanied by intermittent explosive activity and pyroclastic flows, has largely filled the 1956 crater.
Information Contacts: Kamchatka Volcanic Eruptions Response Team (KVERT), Far Eastern Branch, Russian Academy of Sciences, 9 Piip Blvd., Petropavlovsk-Kamchatsky, 683006, Russia (URL: http://www.kscnet.ru/ivs/kvert/); Kamchatka Volcanological Station, Kamchatka Branch of Geophysical Survey, (KB GS RAS), Klyuchi, Kamchatka Krai, Russia (URL: http://volkstat.ru/); Hawai'i Institute of Geophysics and Planetology (HIGP) - MODVOLC Thermal Alerts System, School of Ocean and Earth Science and Technology (SOEST), Univ. of Hawai'i, 2525 Correa Road, Honolulu, HI 96822, USA (URL: http://modis.higp.hawaii.edu/); MIROVA (Middle InfraRed Observation of Volcanic Activity), a collaborative project between the Universities of Turin and Florence (Italy) supported by the Centre for Volcanic Risk of the Italian Civil Protection Department (URL: http://www.mirovaweb.it/); Copernicus Browser, Copernicus Data Space Ecosystem, European Space Agency (URL: https://dataspace.copernicus.eu/browser/).
Chikurachki
Russia
50.324°N, 155.461°E; summit elev. 1781 m
All times are local (unless otherwise noted)
New explosive eruption during late January-early February 2023
Chikurachki, located on Paramushir Island in the northern Kuriles, has had Plinian eruptions during the Holocene. Lava flows have reached the sea and formed capes on the NW coast; several young lava flows are also present on the E flank beneath a scoria deposit. Reported eruptions date back to 1690, with the most recent eruption period occurring during January through October 2022, characterized by occasional explosions, ash plumes, and thermal activity (BGVN 47:11). This report covers a new eruptive period during January through February 2023 that consisted of ash explosions and ash plumes, based on information from the Kamchatka Volcanic Eruptions Response Team (KVERT) and satellite data.
According to reports from KVERT, an explosive eruption began around 0630 on 29 January. Explosions generated ash plumes that rose to 3-3.5 km altitude and drifted 6-75 km SE and E, based on satellite data. As a result, the Aviation Color Code (ACC) was raised to Orange (the second highest level on a four-color scale). At 1406 and 1720 ash plumes were identified in satellite images that rose to 4.3 km altitude and extended 70 km E. By 2320 the ash plume had dissipated. A thermal anomaly was visible at the volcano on 31 January, according to a satellite image, and an ash plume was observed drifting 66 km NE.
Occasional explosions and ash plumes continued during early February. At 0850 on 1 February an ash plume rose to 3.5 km altitude and drifted 35 km NE. Satellite data showed an ash plume that rose to 3.2-3.5 km altitude and drifted 50 km NE at 1222 later that day (figure 22). A thermal anomaly was detected over the volcano during 5-6 February and ash plumes drifted as far as 125 km SE, E, and NE. Explosive events were reported at 0330 on 6 February that produced ash plumes rising to 4-4.5 km altitude and drifting 72-90 km N, NE, and ENE. KVERT noted that the last gas-and steam plume that contained some ash was observed on 8 February and drifted 55 km NE before the explosive eruption ended. The ACC was lowered to Yellow and then Green (the lowest level on a four-color scale) on 18 February.
Geologic Background. Chikurachki, the highest volcano on Paramushir Island in the northern Kuriles, is a relatively small cone constructed on a high Pleistocene edifice. Oxidized basaltic-to-andesitic scoria deposits covering the upper part of the young cone give it a distinctive red color. Frequent basaltic Plinian eruptions have occurred during the Holocene. Lava flows have reached the sea and formed capes on the NW coast; several young lava flows are also present on the E flank beneath a scoria deposit. The Tatarinov group of six volcanic centers is located immediately to the south, and the Lomonosov cinder cone group, the source of an early Holocene lava flow that reached the saddle between it and Fuss Peak to the west, lies at the southern end of the N-S-trending Chikurachki-Tatarinov complex. In contrast to the frequently active Chikurachki, the Tatarinov centers are extensively modified by erosion and have a more complex structure. Tephrochronology gives evidence of an eruption around 1690 CE from Tatarinov, although its southern cone contains a sulfur-encrusted crater with fumaroles that were active along the margin of a crater lake until 1959.
Information Contacts: Kamchatka Volcanic Eruptions Response Team (KVERT), Far East Division, Russian Academy of Sciences, 9 Piip Blvd., Petropavlovsk-Kamchatsky, 683006, Russia (URL: http://www.kscnet.ru/ivs/); Copernicus Browser, Copernicus Data Space Ecosystem, European Space Agency (URL: https://dataspace.copernicus.eu/browser/).
Search Bulletin Archive by Publication Date
Select a month and year from the drop-downs and click "Show Issue" to have that issue displayed in this tab.
The default month and year is the latest issue available.
Bulletin of the Global Volcanism Network - Volume 45, Number 04 (April 2020)
Managing Editor: Edward Venzke
Etna (Italy)
Strombolian explosions and ash emissions continue, October 2019-March 2020
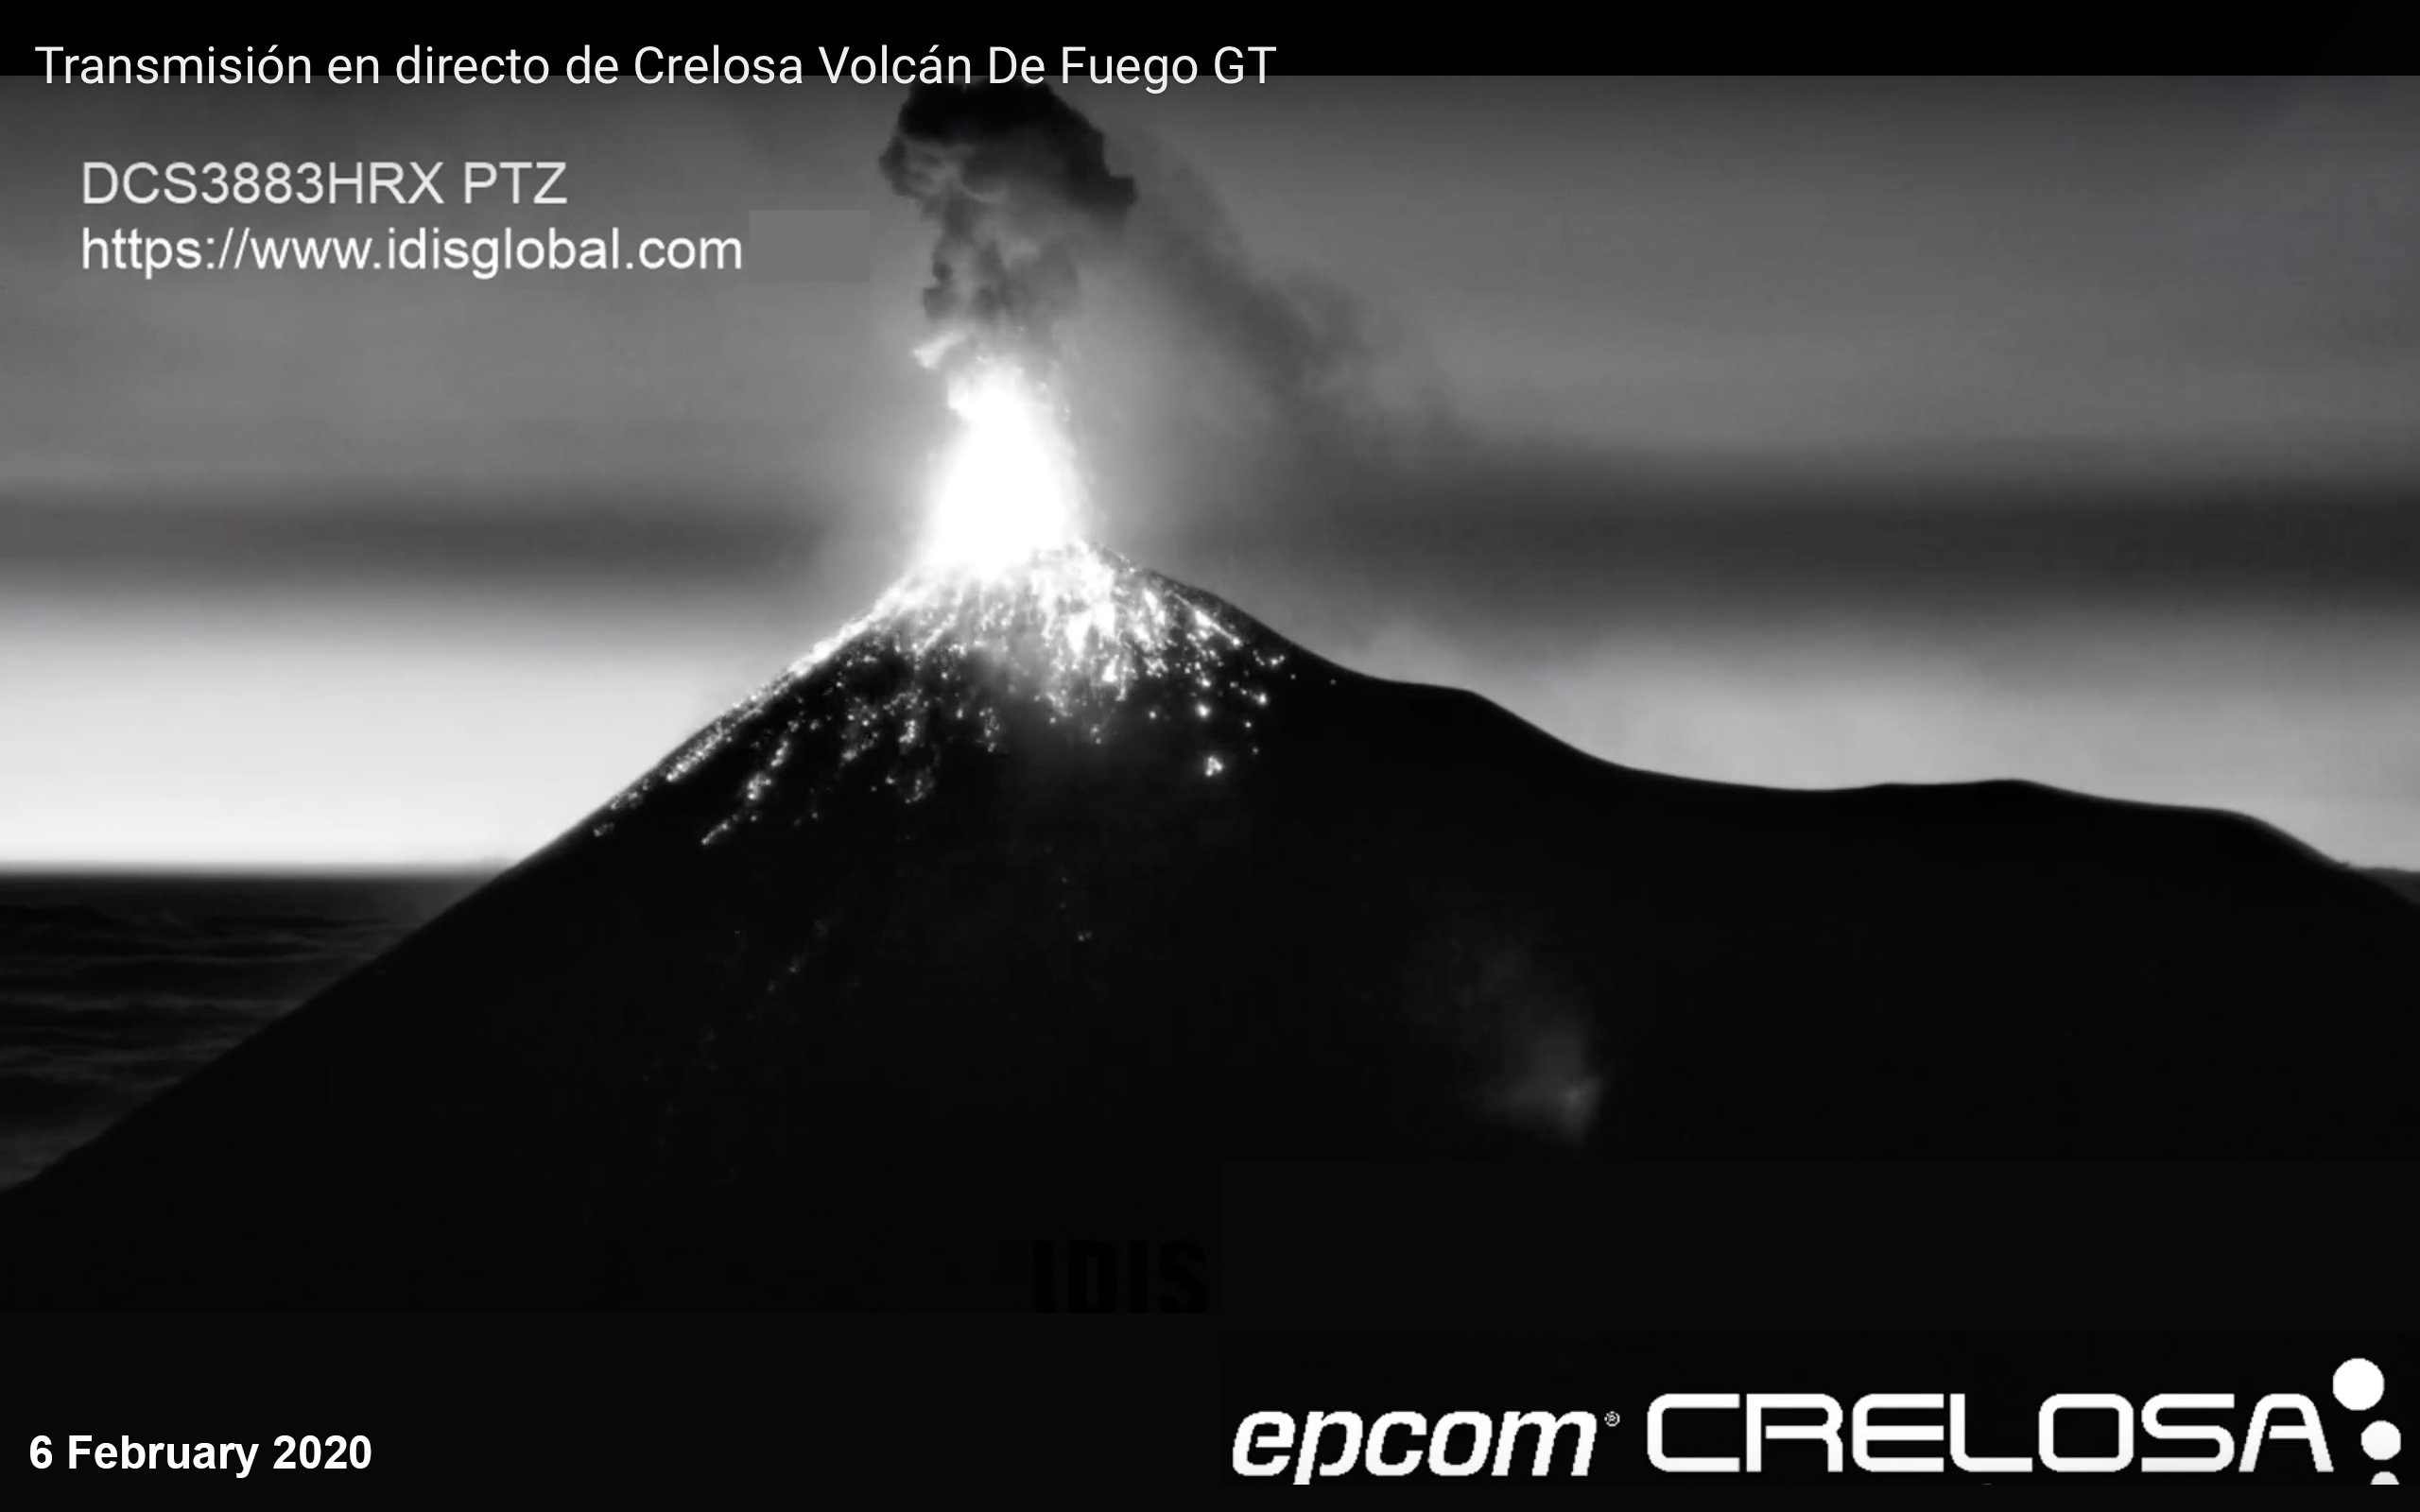
Fuego (Guatemala)
Ongoing ash explosions, block avalanches, and intermittent lava flows
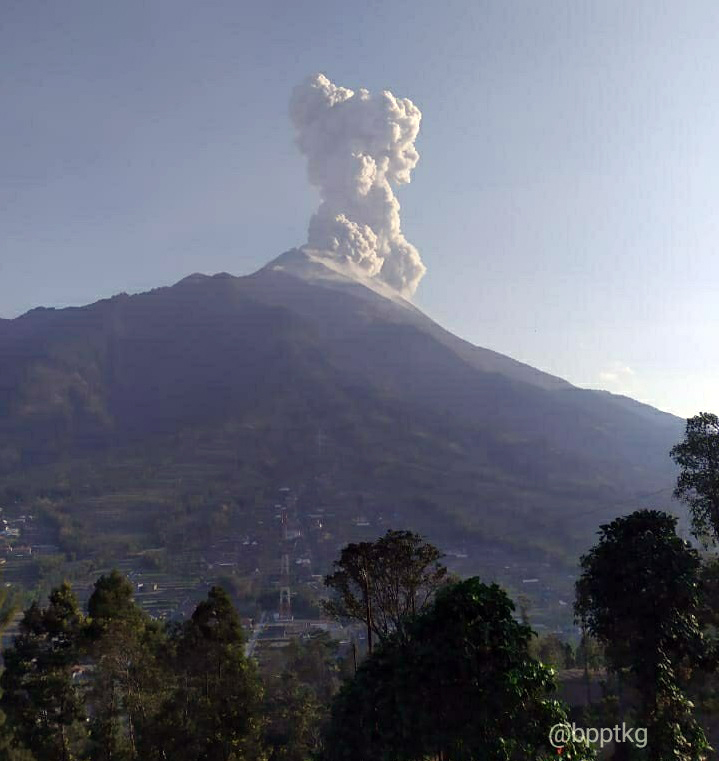
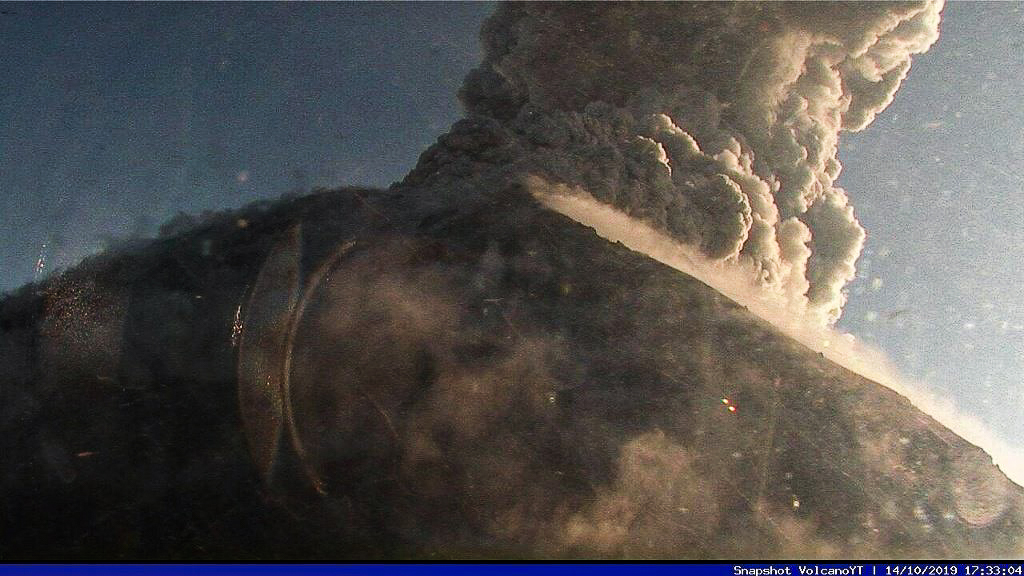
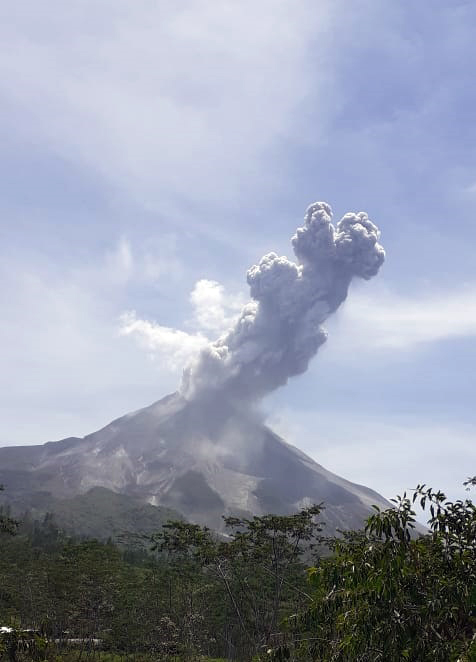
Merapi (Indonesia)
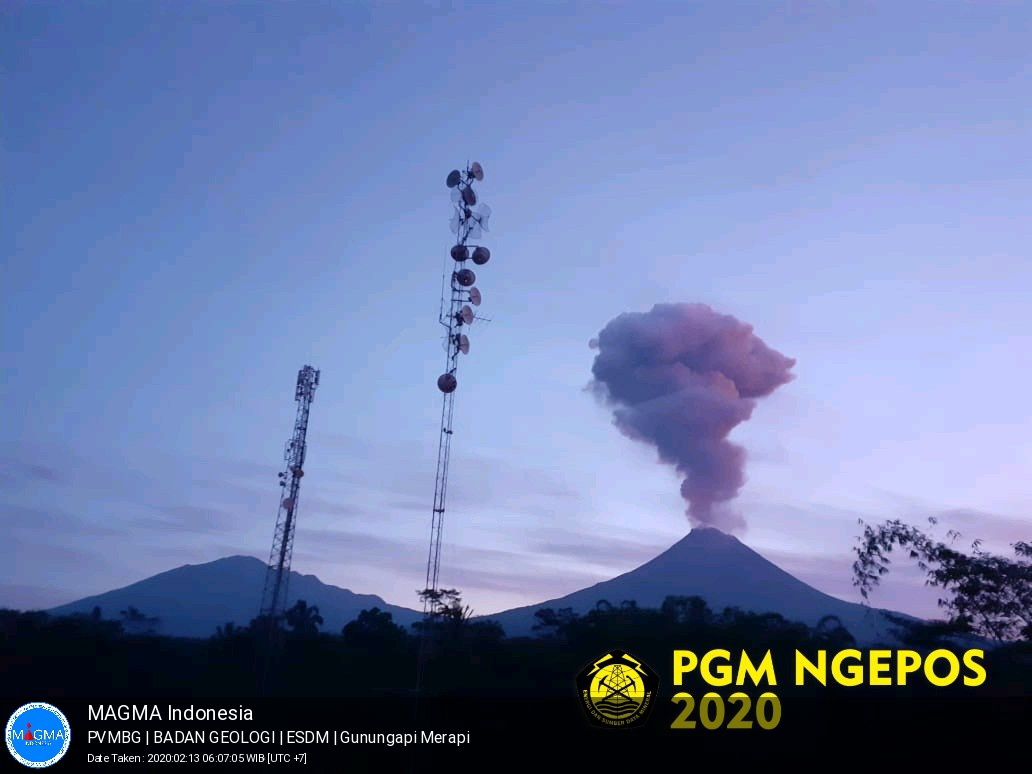
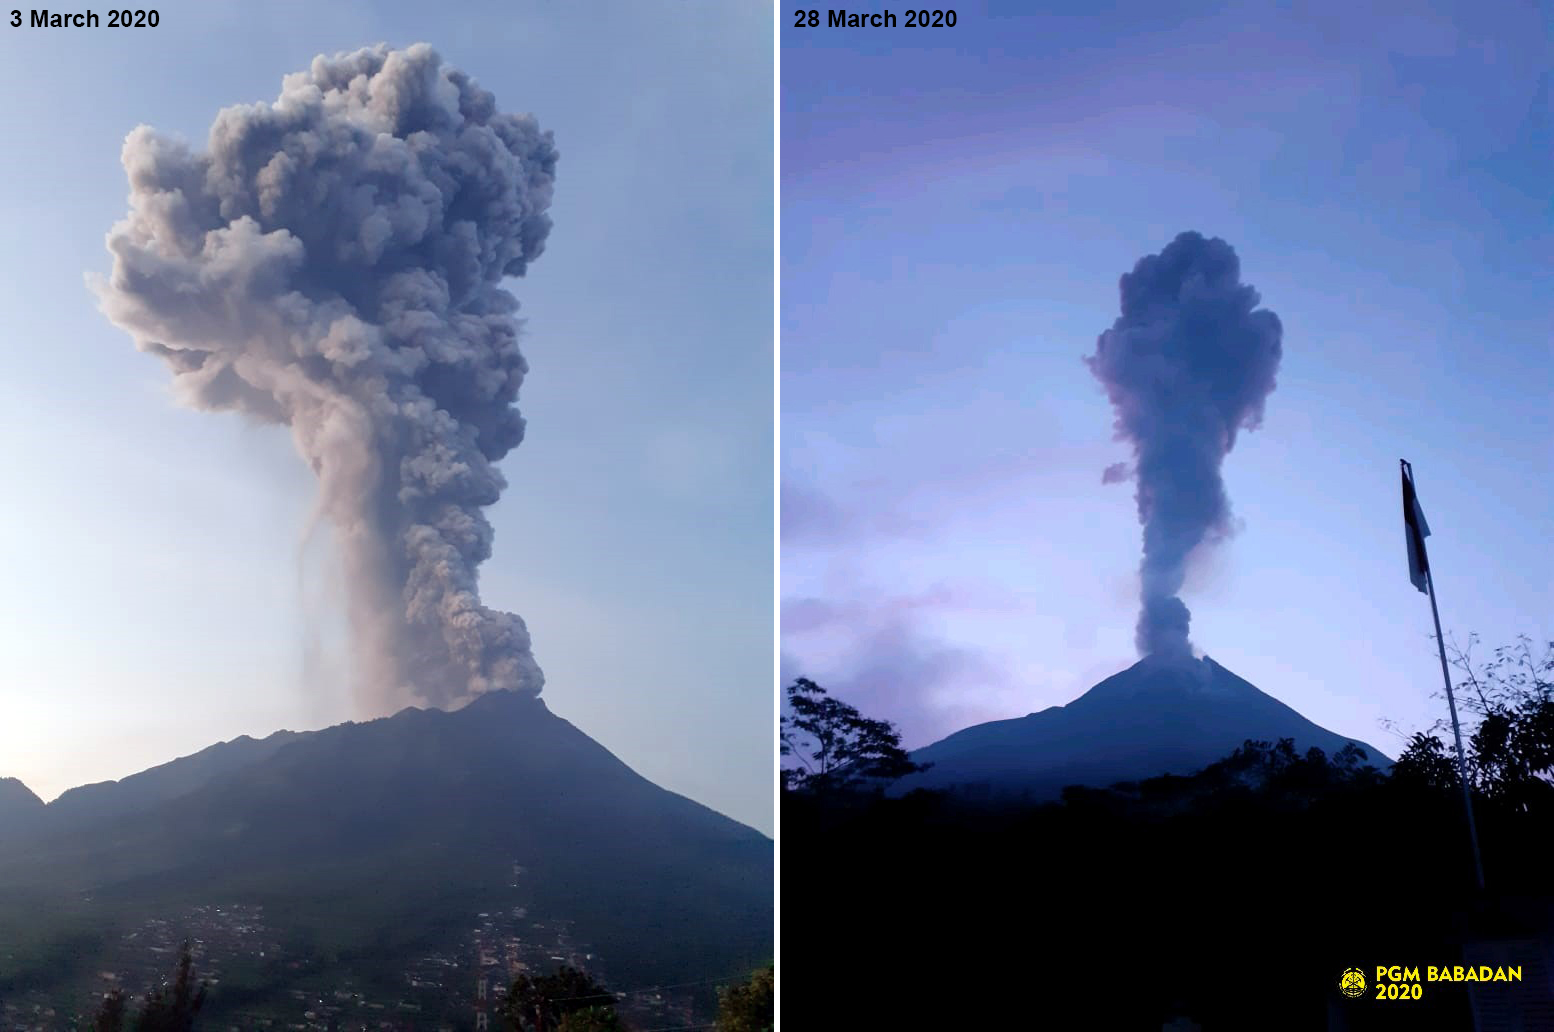
Explosions produced ash plumes, ashfall, and pyroclastic flows during October 2019-March 2020
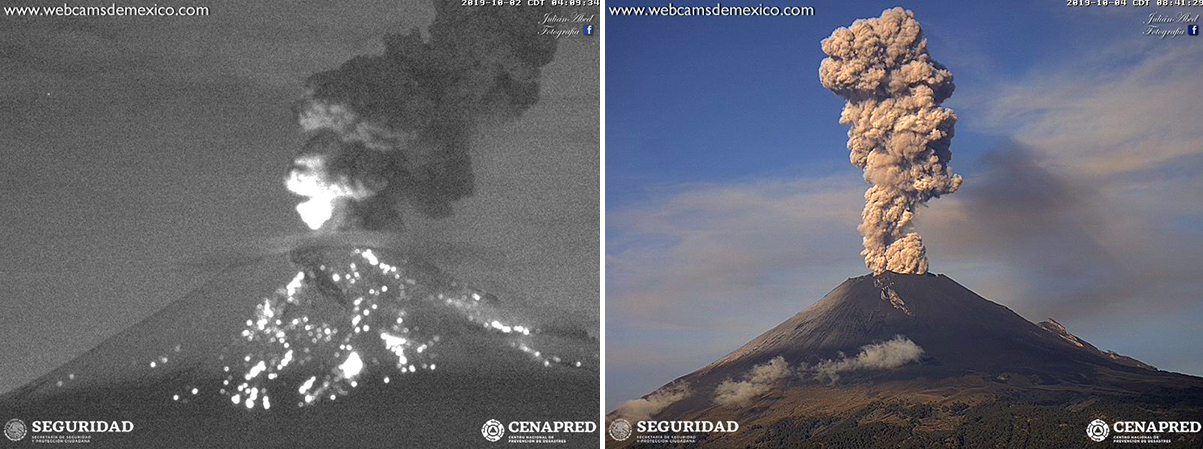
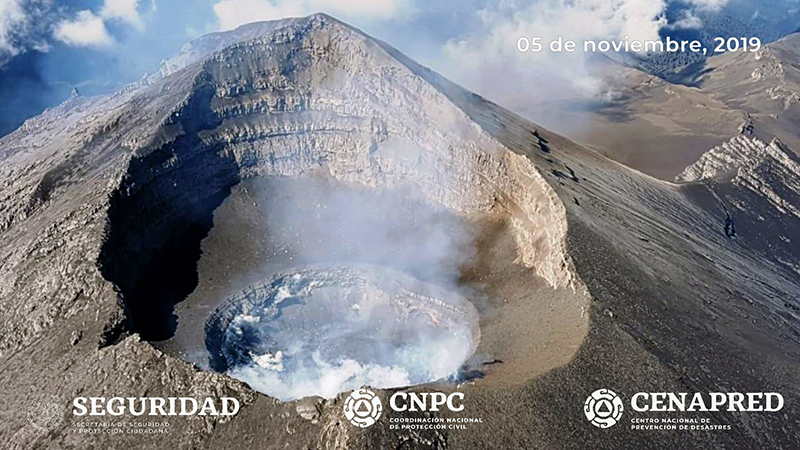
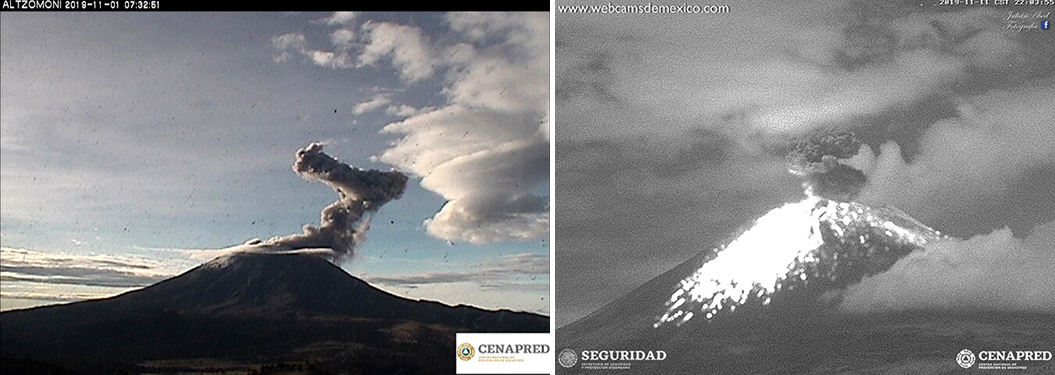
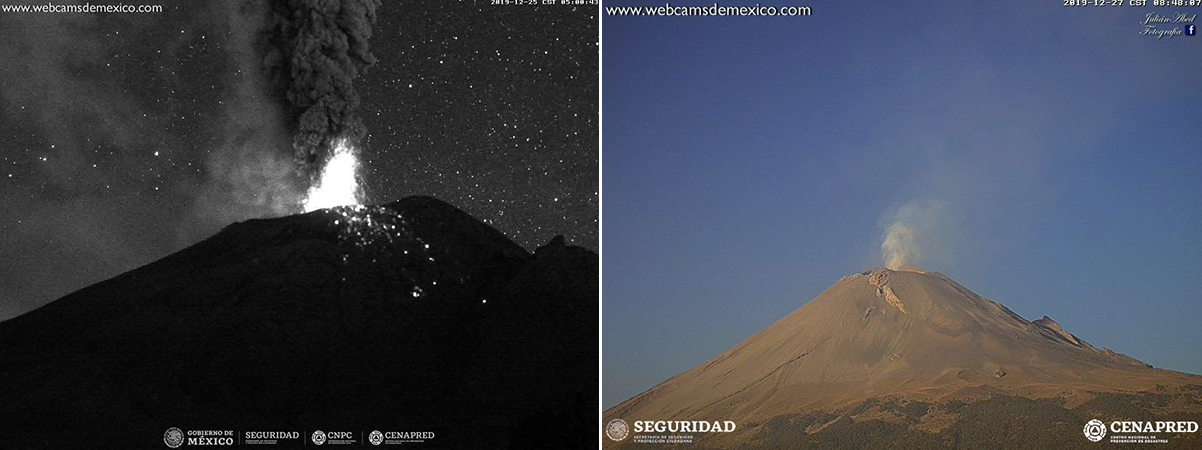
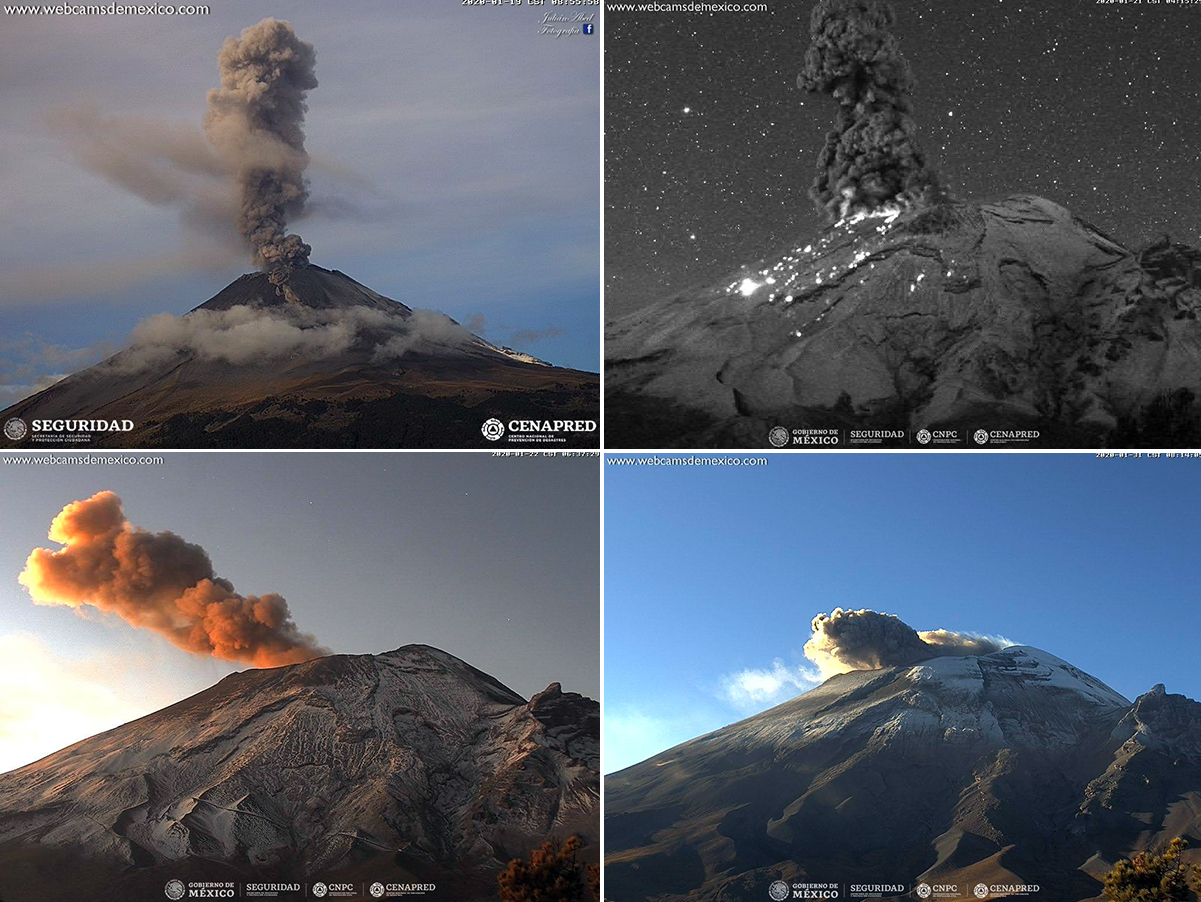
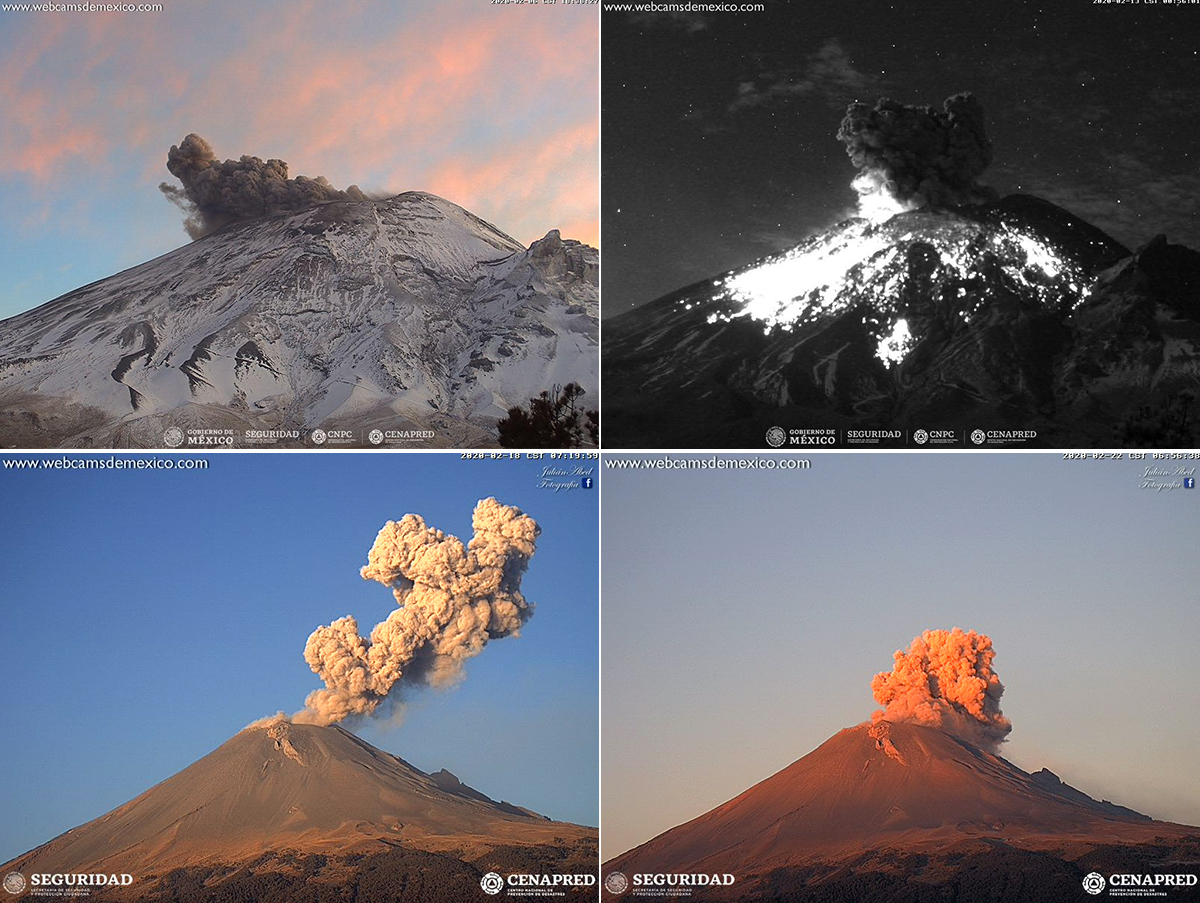
Popocatepetl (Mexico)
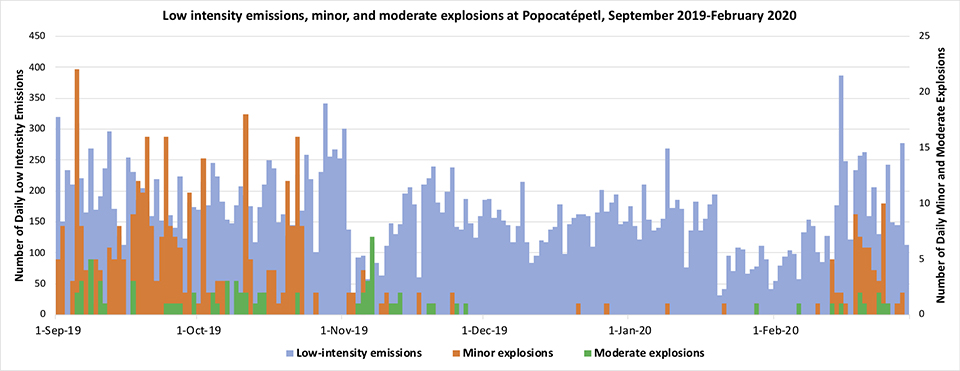
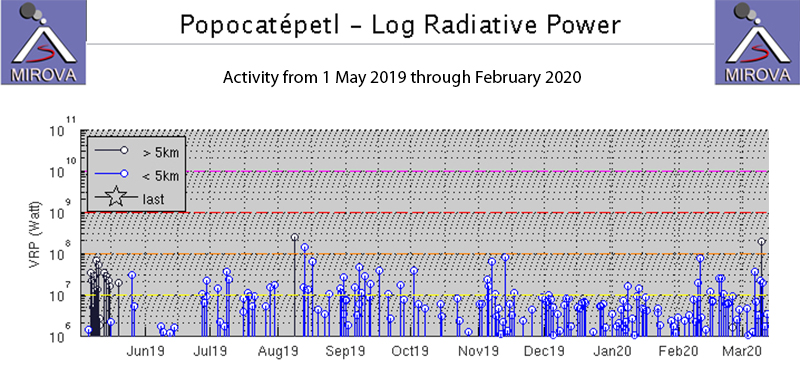
Dome growth and destruction continues along with ash emissions and ejecta, September 2019-February 2020
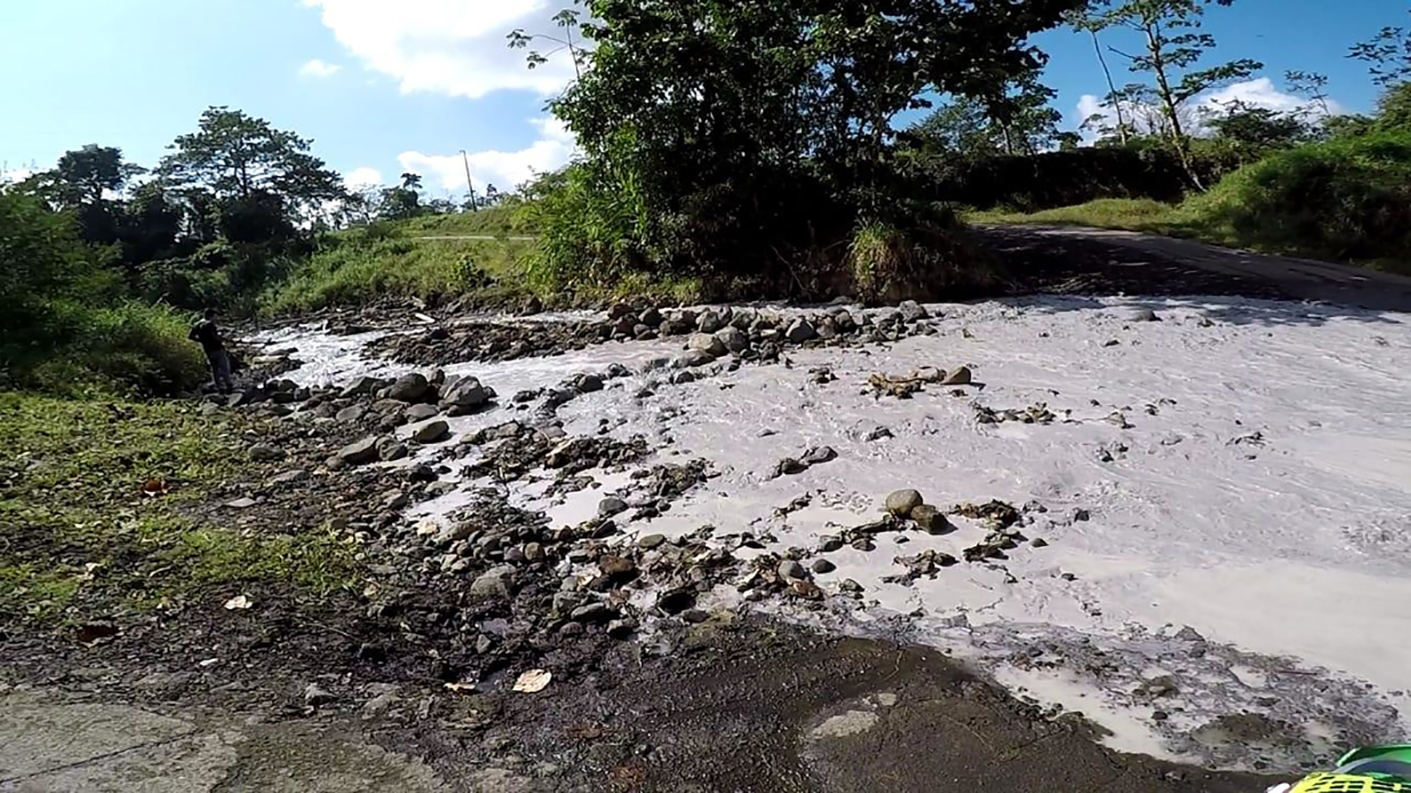
Rincon de la Vieja (Costa Rica)
Weak phreatic explosions during August 2019-March 2020; ash and lahars reported in late January
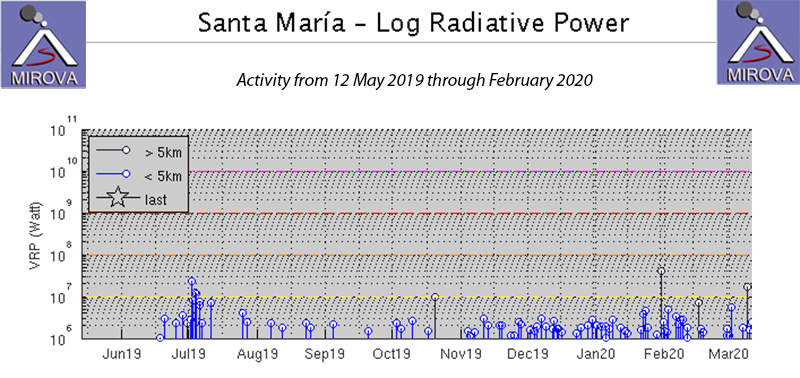
Santa Maria (Guatemala)
Daily explosions with ash plumes and block avalanches continue, September 2019-February 2020
Semeru (Indonesia)
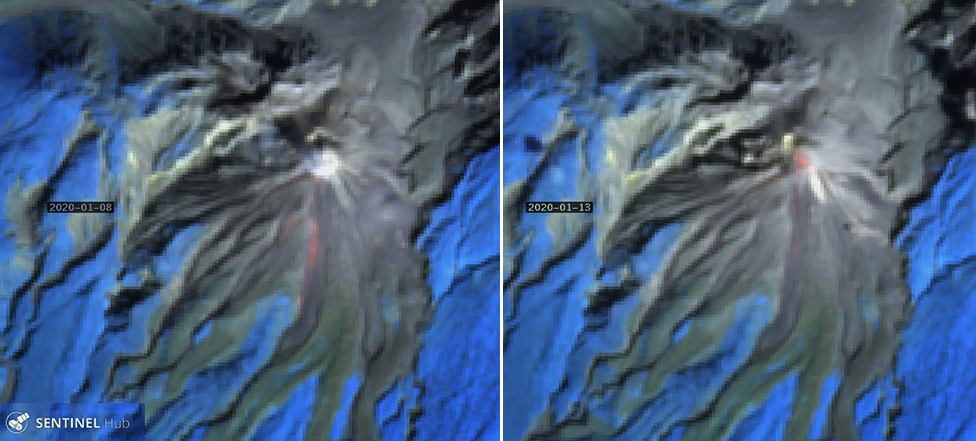
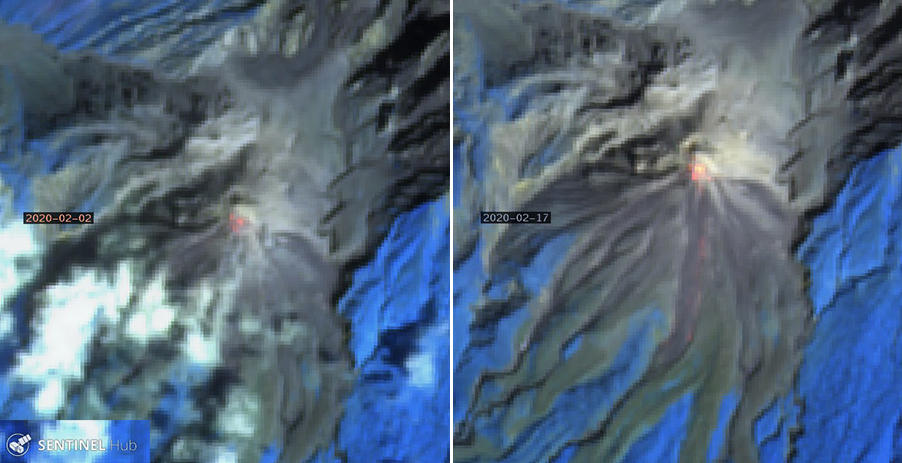
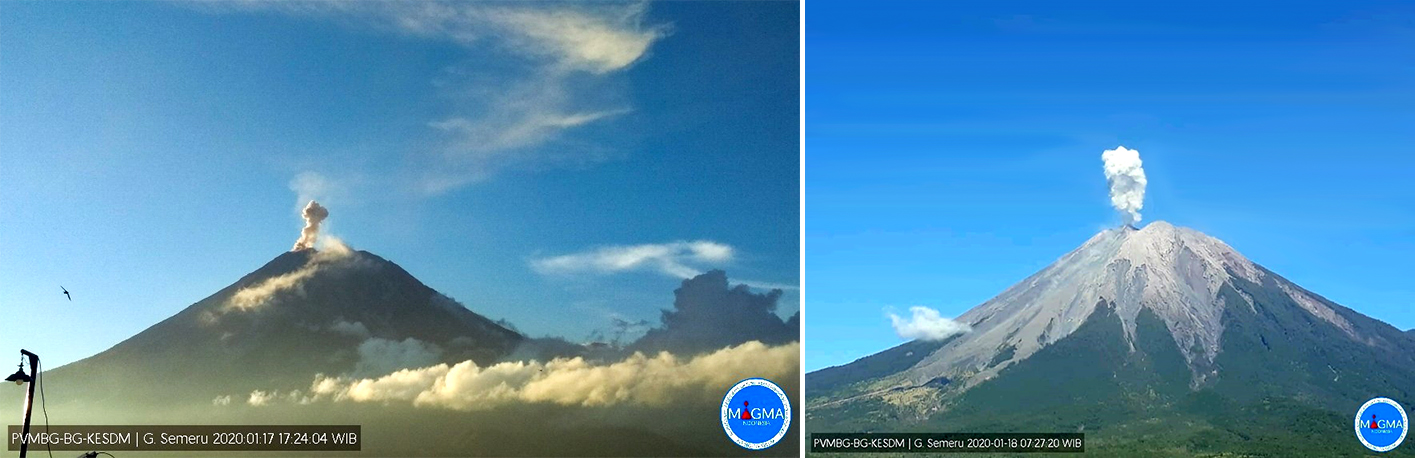
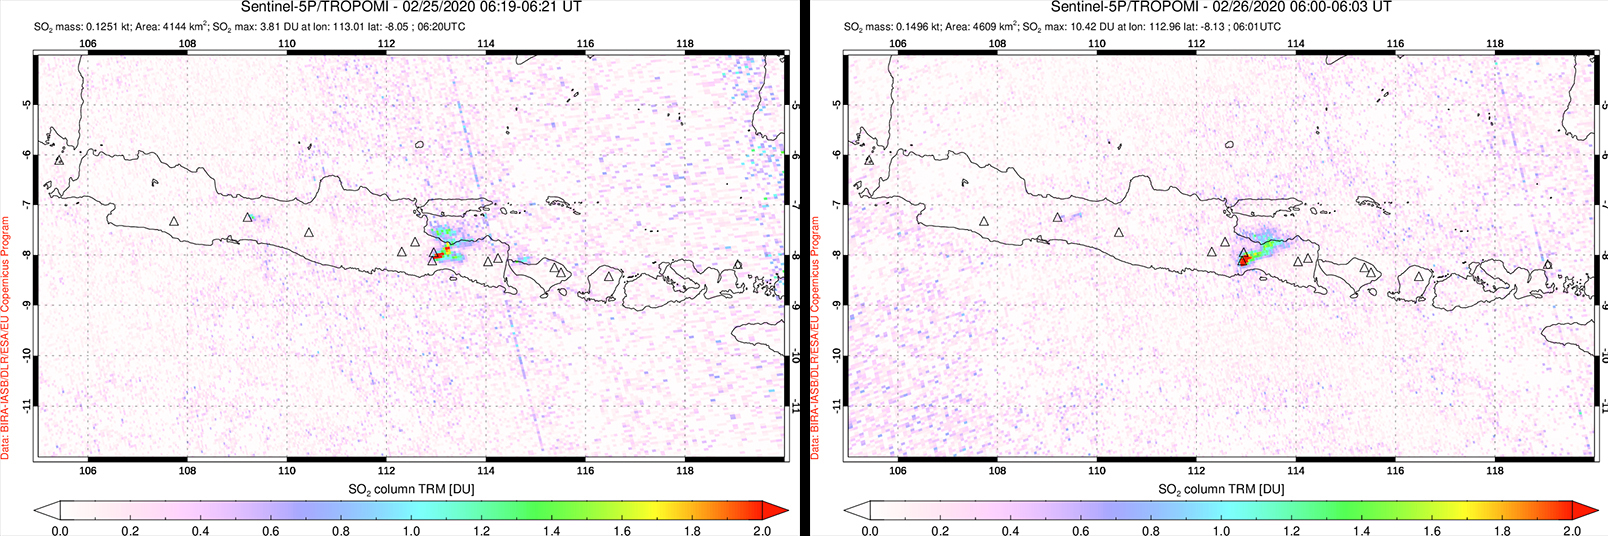
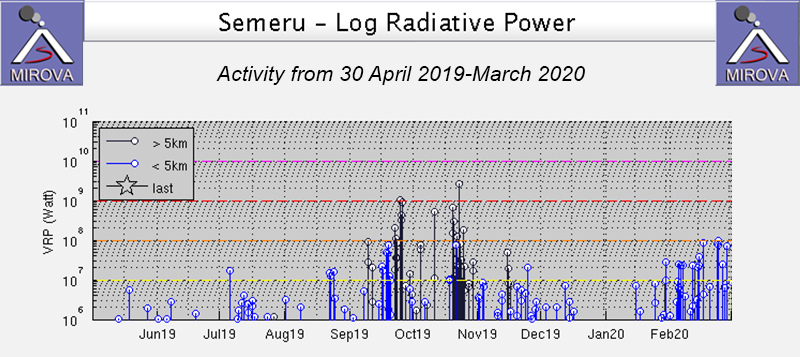
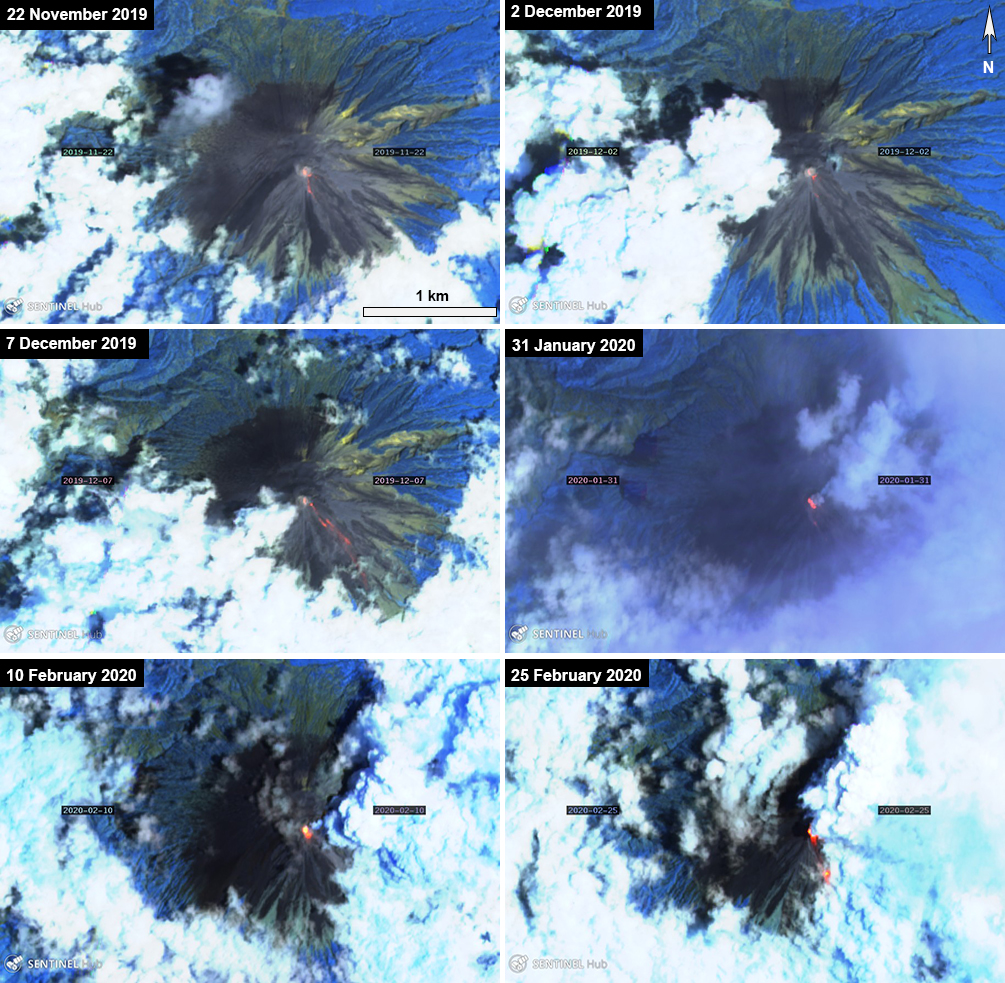
Ash plumes and thermal anomalies continue during September 2019-February 2020
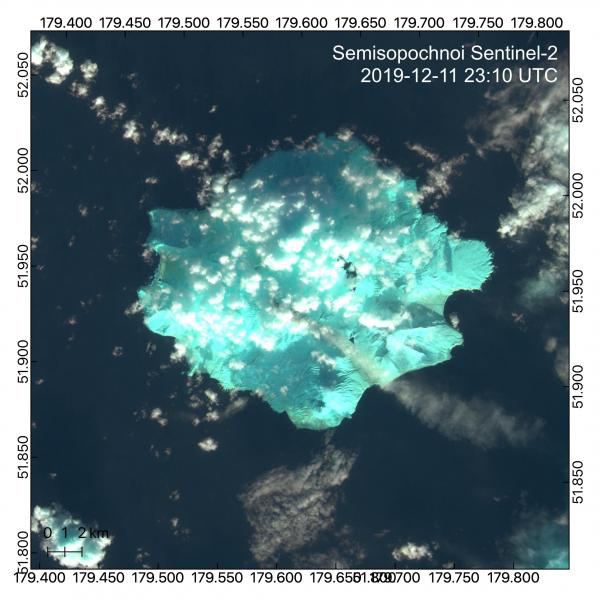
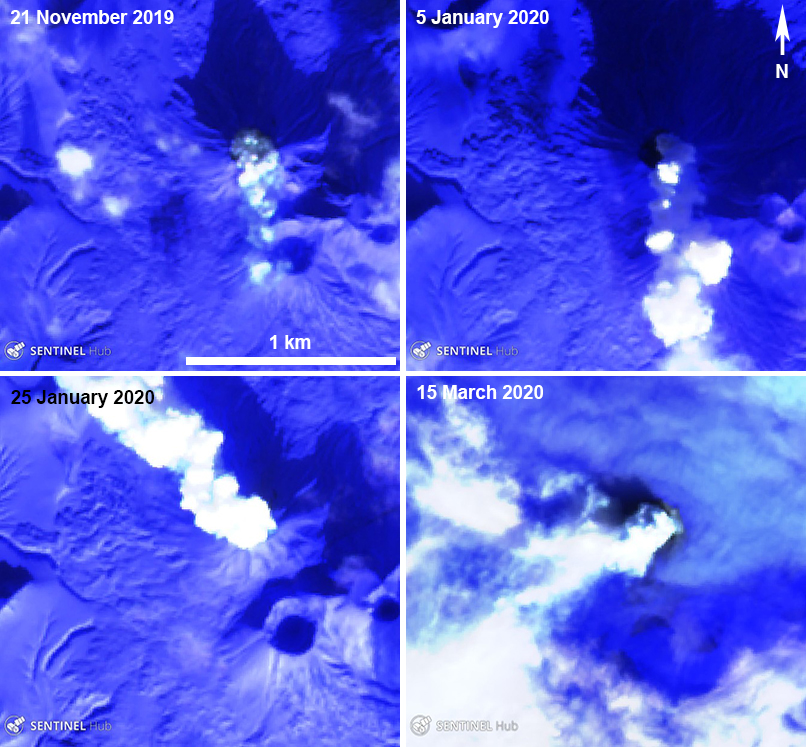
Semisopochnoi (United States)
Intermittent small explosions detected in December 2019 through mid-March 2020
Stromboli (Italy)
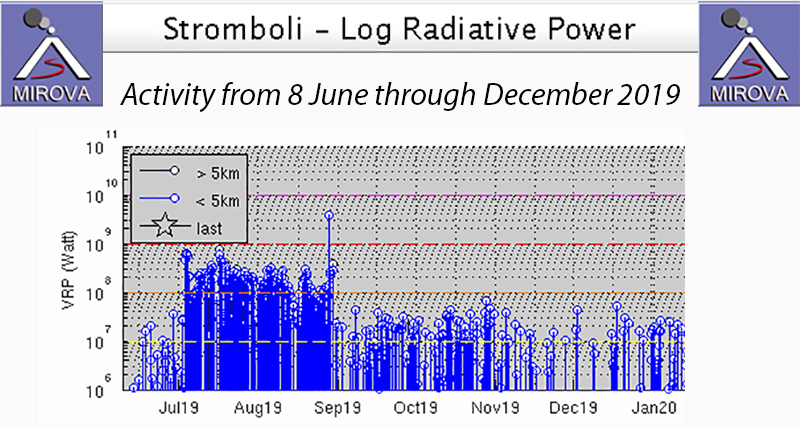
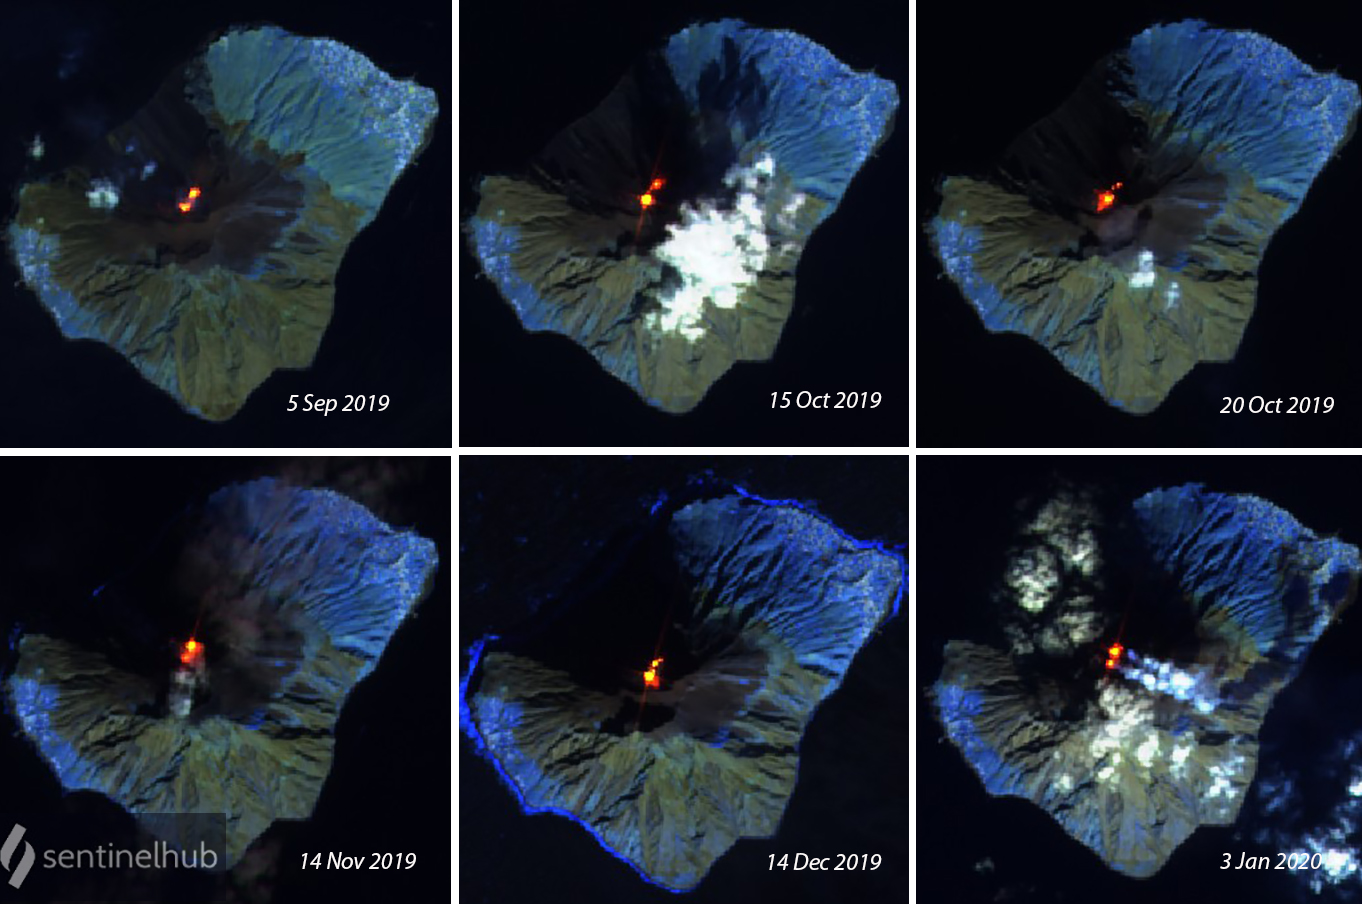
Strombolian activity continues at both summit crater areas, September-December 2019
Villarrica (Chile)
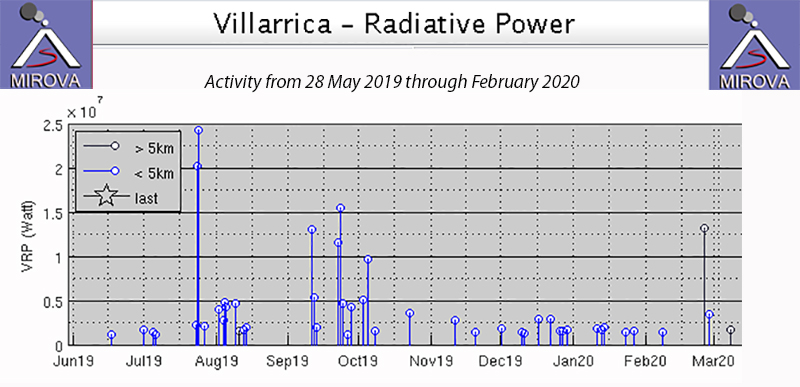
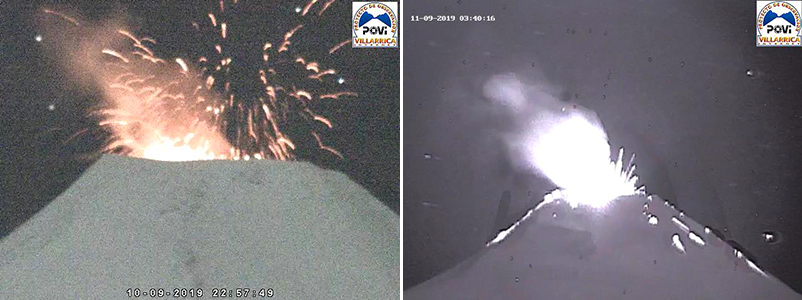
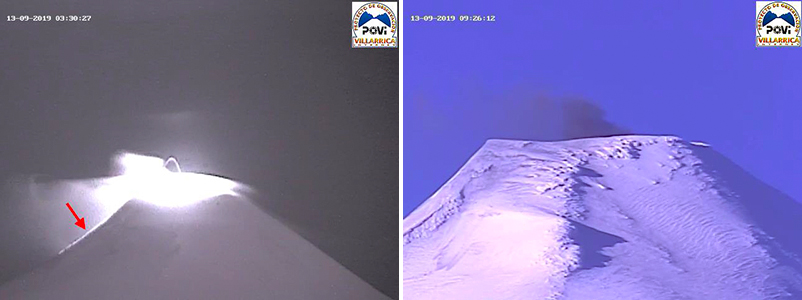
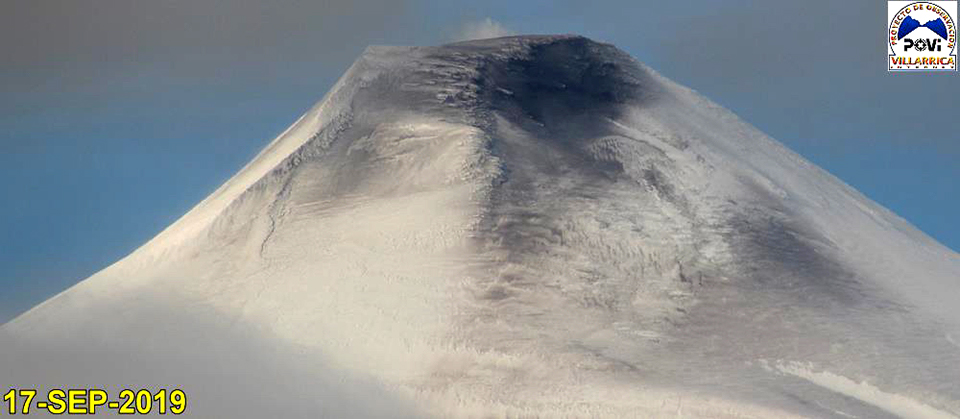
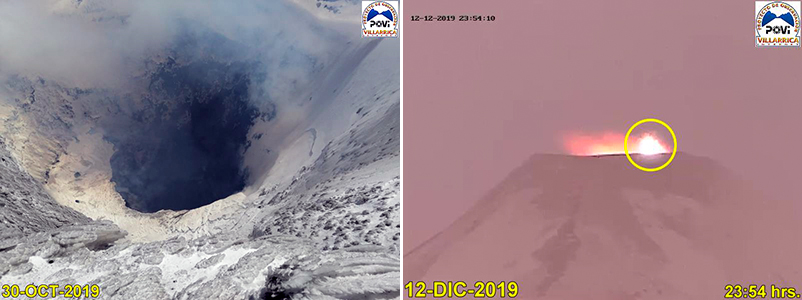
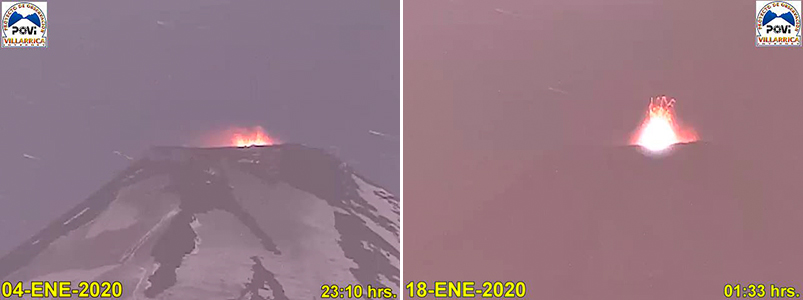
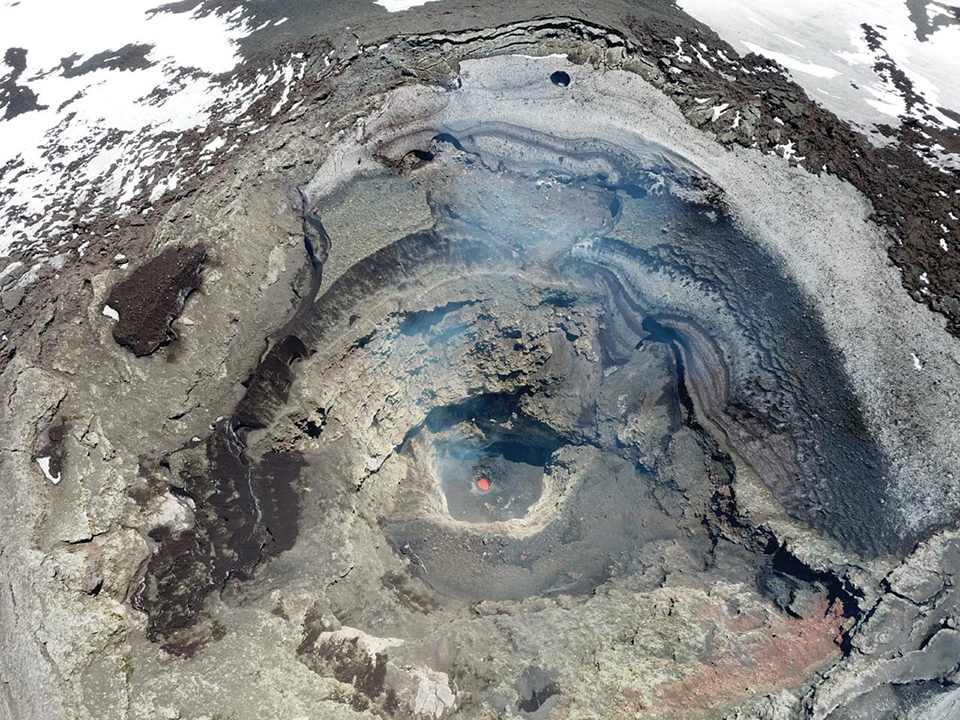
Brief increase in explosions, mid-September 2019; continued thermal activity through February 2020
Etna
Italy
37.748°N, 14.999°E; summit elev. 3357 m
All times are local (unless otherwise noted)
Strombolian explosions and ash emissions continue, October 2019-March 2020
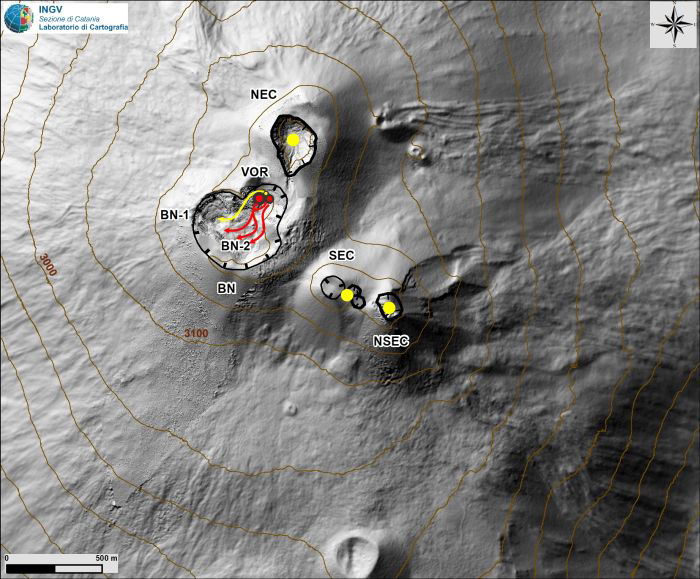
Mount Etna is a stratovolcano located on the island of Sicily, Italy, with historical eruptions that date back 3,500 years. The most recent eruptive period began in September 2013 and has continued through March 2020. Activity is characterized by Strombolian explosions, lava flows, and ash plumes that commonly occur from the summit area, including the Northeast Crater (NEC), the Voragine-Bocca Nuova (or Central) complex (VOR-BN), the Southeast Crater (SEC, formed in 1978), and the New Southeast Crater (NSEC, formed in 2011). The newest crater, referred to as the "cono della sella" (saddle cone), emerged during early 2017 in the area between SEC and NSEC. This reporting period covers information from October 2019 through March 2020 and includes frequent explosions and ash plumes. The primary source of information comes from the Osservatorio Etneo (OE), part of the Catania Branch of Italy's Istituo Nazionale di Geofisica e Vulcanologica (INGV).
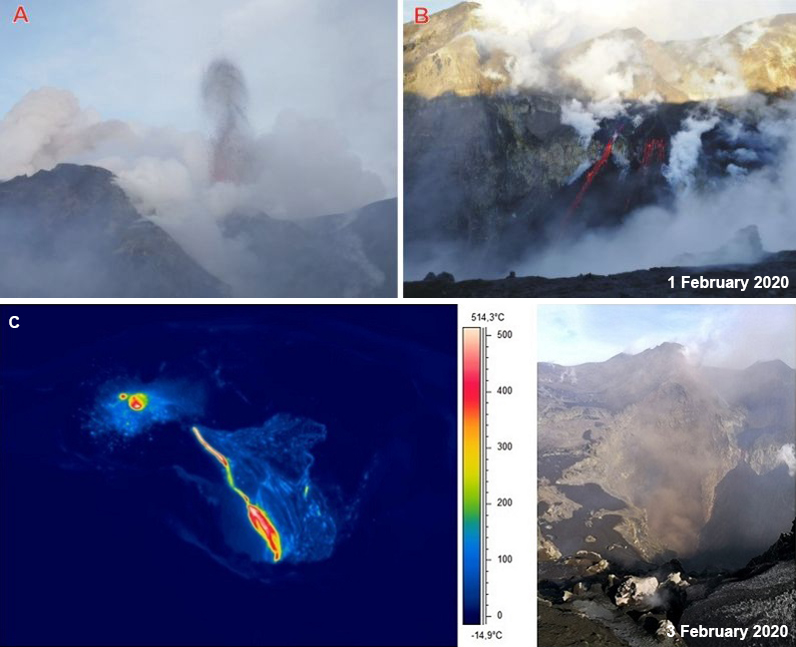
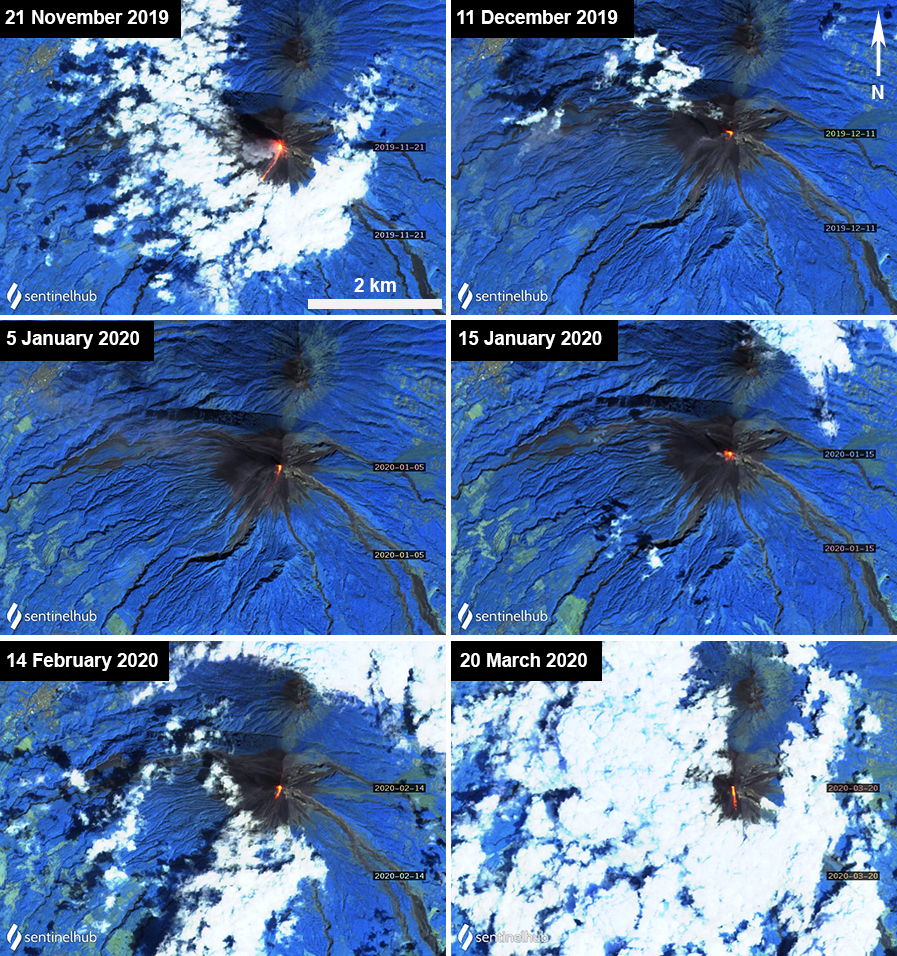
Summary of activity during October 2019-March 2020. Strombolian activity and gas-and-steam and ash emissions were frequently observed at Etna throughout the entire reporting period, according to INGV and Toulouse VAAC notices. Activity was largely located within the main cone (Voragine-Bocca Nuova complex), the Northeast Crater (NEC), and the New Southeast Crater (NSEC). On 1, 17, and 19 October, ash plumes rose to a maximum altitude of 5 km. Due to constant Strombolian explosions, ground observations showed that a scoria cone located on the floor of the VOR Crater had begun to grow in late November and again in late January 2020. A lava flow was first detected on 6 December at the base of the scoria cone in the VOR Crater, which traveled toward the adjacent BN Crater. Additional lava flows were observed intermittently throughout the reporting period in the same crater. On 13 March, another small scoria cone had formed in the main VOR-BN complex due to Strombolian explosions.
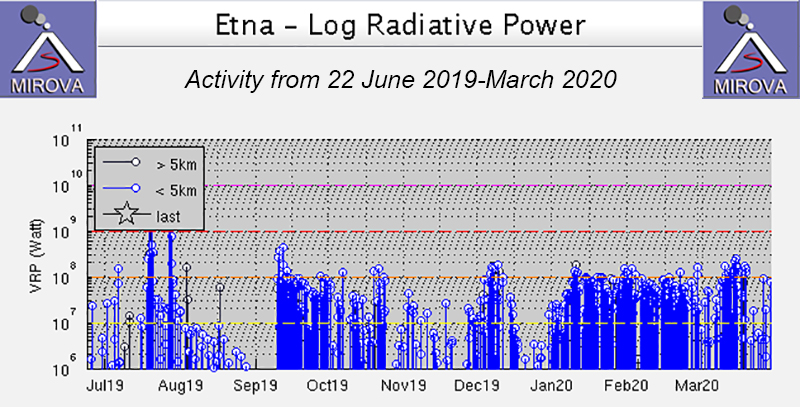
MIROVA (Middle InfraRed Observation of Volcanic Activity) analysis of MODIS satellite data shows multiple episodes of thermal activity varying in power from 22 June 2019 to March 2020 (figure 286). The power and frequency of these thermal anomalies significantly decreased between August to mid-September. The pulse of activity in mid-September reflected a lava flow from the VOR Crater (BGVN 44:10). By late October through November, thermal anomalies were relatively weaker and less frequent. The next pulse in thermal activity reflected in the MIROVA graph occurred in early December, followed by another shortly after in early January, both of which were due to new lava flows from the VOR Crater. After 9 January the thermal anomalies remained frequent and strong; active lava flows continued through March accompanied by Strombolian explosions, gas-and-steam, SO2, and ash emissions. The most recent distinct pulse in thermal activity was seen in mid-March; on 13 March, another lava flow formed, accompanied by an increase in seismicity. This lava flow, like the previous ones, also originated in the VOR Crater and traveled W toward the BN Crater.
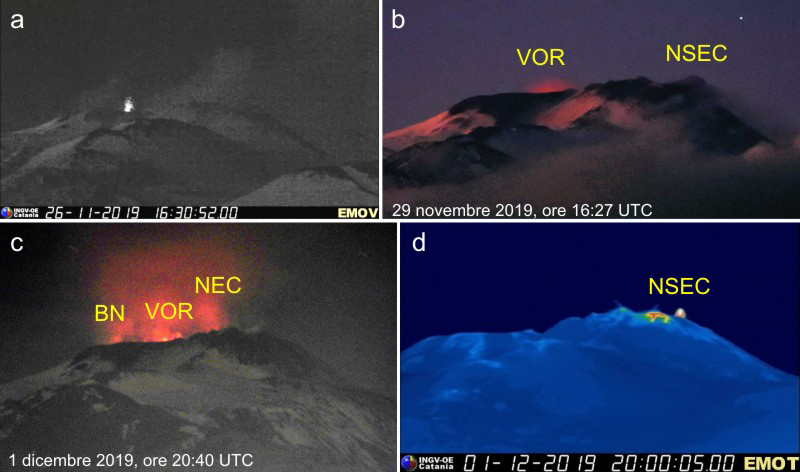
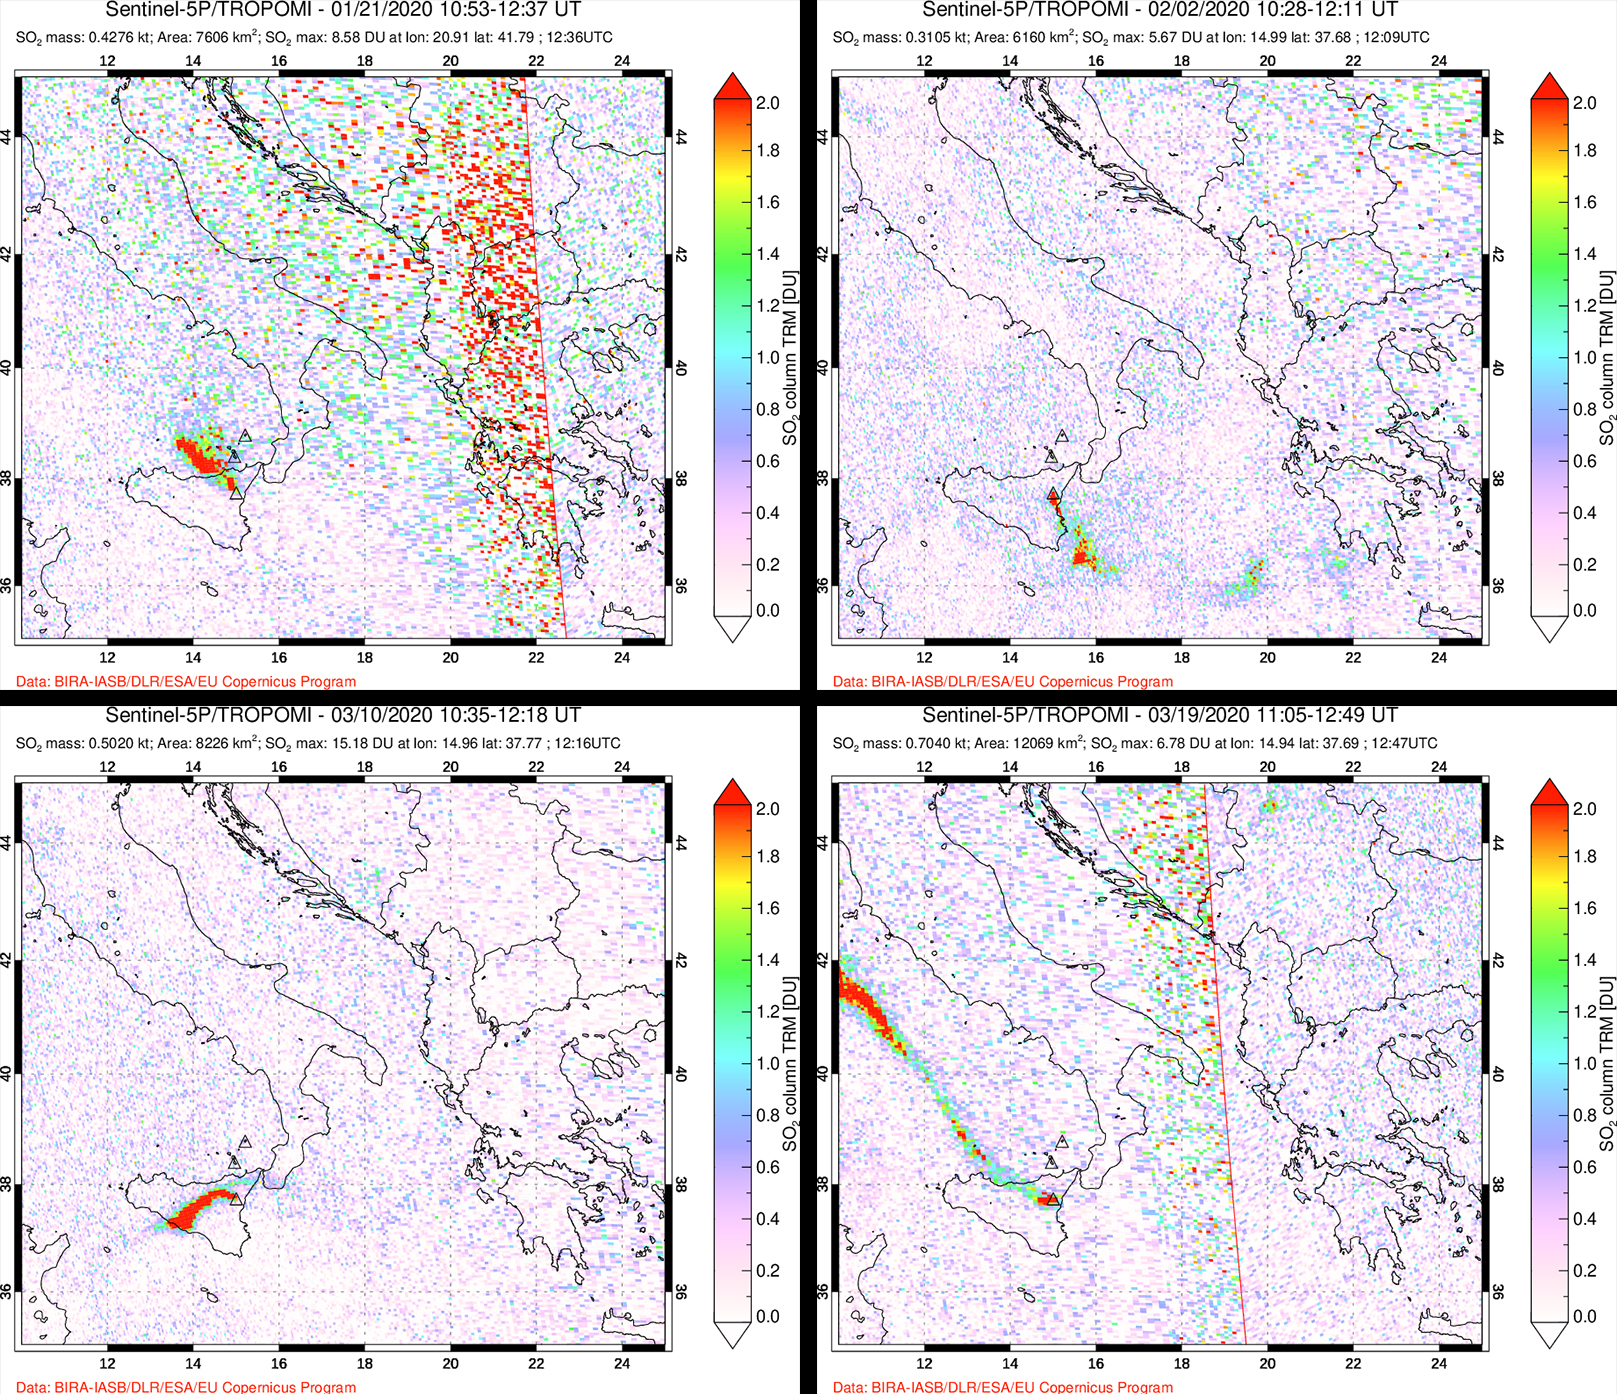
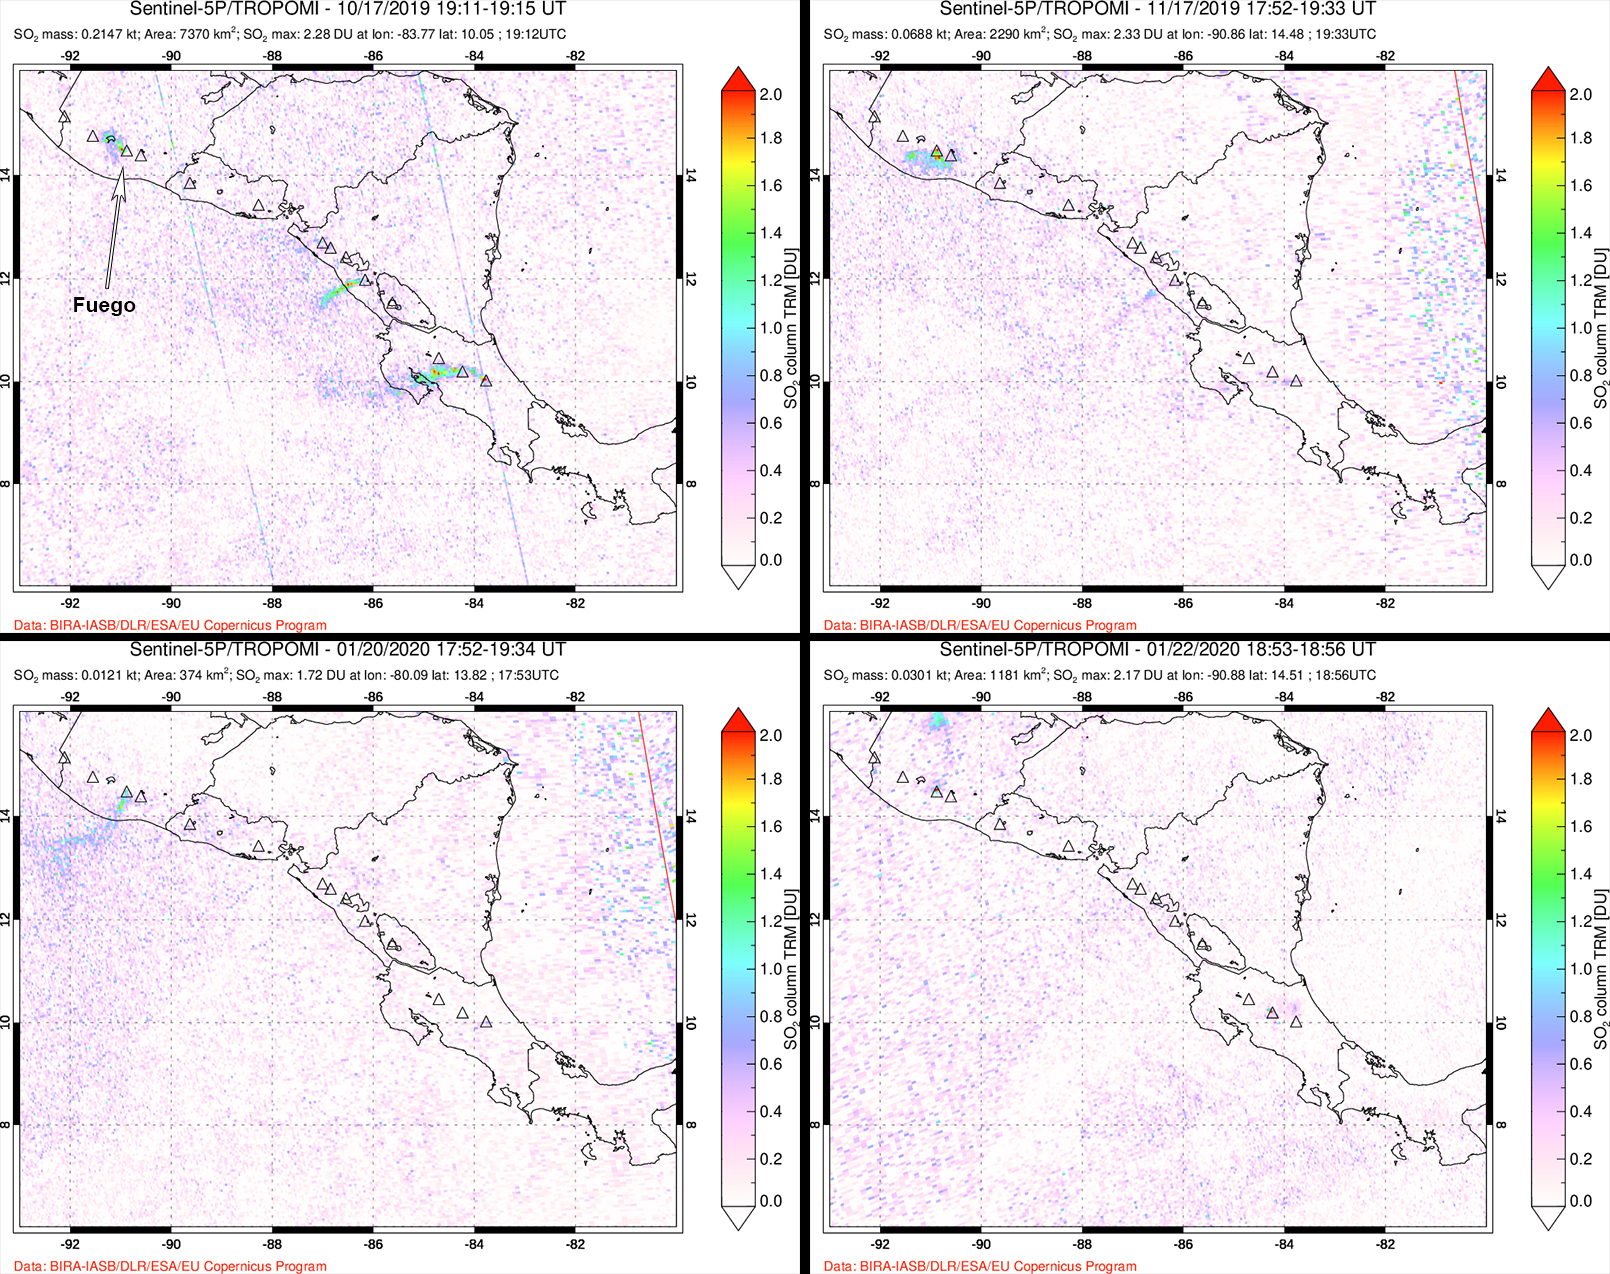
Activity during October-December 2019. During October 2019, VONA (Volcano Observatory Notice for Aviation) notices issued by INGV reported ash plumes rose to a maximum altitude of 5 km on 1, 17, and 19 October. Strombolian explosions occurred frequently. Explosions were detected primarily in the VOR-BN Craters, ejecting coarse pyroclastic material that fell back into the crater area and occasionally rising above the crater rim. Ash emissions rose from the VOR-BN and NEC while intense gas-and-steam emissions were observed in the NSEC (figure 287). Between 10-12 and 14-20 October fine ashfall was observed in Pedara, Mascalucia, Nicolosi, San Giovanni La Punta, and Catania. In addition to these ash emissions, the explosive Strombolian activity contributed to significant SO2 plumes that drifted in different directions (figure 288).
The INGV weekly bulletin covering activity between 25 October and 1 November 2019 reported that Strombolian explosions occurred at intervals of 5-10 minutes from within the VOR-BN and NEC, ejecting incandescent material above the crater rim, accompanied by modest ash emissions. In addition, gas-and-steam emissions were observed from all the summit craters. Field observations showed the cone in the crater floor of VOR that began to grow in mid-September 2019 had continued to grow throughout the month. During the week of 4-10 November, Strombolian activity within the Bocca Nuova Crater was accompanied by gas-and-steam emissions. The explosions in the VOR Crater occasionally ejected incandescent ejecta above the crater rim (figures 289 and 290). For the remainder of the month Strombolian explosions continued in the VOR-BN and NEC, producing sporadic ash emissions. Isolated and discontinuous explosions in the New Southeast Crater (NSEC) also produced fine ash, though gas-and-steam emissions still dominated the activity at this crater. Additionally, the explosions from these summit craters were frequently accompanied by strong SO2 emissions that drifted in different directions as discrete plumes.
Frequent Strombolian explosions continued through December 2019 within the VOR-BN, NEC, and NSEC Craters with sporadic ash emissions observed in the VOR-BN and NEC. On 6 December, Strombolian explosions increased in the NSEC; webcam images showed incandescent pyroclastic material ejected above the crater rim. On the morning of 6 December a lava flow was observed from the base of the scoria cone in the VOR Crater that traveled toward the adjacent Bocca Nuova Crater. INGV reported that a new vent opened on the side of the saddle cone (NSEC) on 11 December and produced explosions until 14 December.
Activity during January-March 2020. On 9 January 2020 an aerial flight organized by RAI Linea Bianca and the state police showed the VOR Crater continuing to produce lava that was flowing over the crater rim into the BN Crater with some explosive activity in the scoria cone. Explosive Strombolian activity produced strong and distinct SO2 plumes (figure 291) and ash emissions through March, according to the weekly INGV reports, VONA notices, and satellite imagery. Several ash emissions during 21-22 January rose from the vent that opened on 11 December. According to INGV’s weekly bulletin for 21-26 January, the scoria cone in the VOR crater produced Strombolian explosions that increased in frequency and contributed to rapid cone growth, particularly the N part of the cone. Lava traveled down the S flank of the cone and into the adjacent Bocca Nuova Crater, filling the E crater (BN-2) (figure 292). The NEC had discontinuous Strombolian activity and periodic, diffuse ash emissions.
Strombolian explosions continued into February 2020, accompanied by ash emissions and lava flows from the previous months (figure 293). During 17-23 February, INGV reported that some subsidence was observed in the central portion of the Bocca Nuova Crater. During 24 February to 1 March, the Strombolian explosions ejected lava from the VOR Crater up to 150-200 m above the vent as bombs fell on the W edge of the VOR crater rim (figure 294). Lava flows continued to move into the W part of the Bocca Nuova Crater.
During 9-15 March 2020 Strombolian activity was detected in the VOR Crater while discontinuous ash emissions rose from the NEC and NSEC. Bombs were found in the N saddle between the VOR and NSEC craters. On 9 March, a small scoria cone that had formed in the Bocca Nuova Crater and was ejecting bombs and lava tens of meters above the S crater rim. The lava flow from the VOR Crater was no longer advancing. A third scoria cone had formed on 13 March NE in the main VOR-BN complex due to the Strombolian explosions on 29 February. Another lava flow formed on 13 March, accompanied by an increase in seismicity. The weekly report for 16-22 March reported Strombolian activity detected in the VOR Crater and gas-and-steam and rare ash emissions observed in the NEC and NSEC (figure 295). Explosions in the Bocca Nuova Crater ejected spatter and bombs 100 m high.
Geologic Background. Mount Etna, towering above Catania on the island of Sicily, has one of the world's longest documented records of volcanism, dating back to 1500 BCE. Historical lava flows of basaltic composition cover much of the surface of this massive volcano, whose edifice is the highest and most voluminous in Italy. The Mongibello stratovolcano, truncated by several small calderas, was constructed during the late Pleistocene and Holocene over an older shield volcano. The most prominent morphological feature of Etna is the Valle del Bove, a 5 x 10 km caldera open to the east. Two styles of eruptive activity typically occur, sometimes simultaneously. Persistent explosive eruptions, sometimes with minor lava emissions, take place from one or more summit craters. Flank vents, typically with higher effusion rates, are less frequently active and originate from fissures that open progressively downward from near the summit (usually accompanied by Strombolian eruptions at the upper end). Cinder cones are commonly constructed over the vents of lower-flank lava flows. Lava flows extend to the foot of the volcano on all sides and have reached the sea over a broad area on the SE flank.
Information Contacts: Sezione di Catania - Osservatorio Etneo, Istituto Nazionale di Geofisica e Vulcanologia (INGV), Sezione di Catania, Piazza Roma 2, 95123 Catania, Italy (URL: http://www.ct.ingv.it/it/); Toulouse Volcanic Ash Advisory Center (VAAC), Météo-France, 42 Avenue Gaspard Coriolis, F-31057 Toulouse cedex, France (URL: http://www.meteo.fr/aeroweb/info/vaac/); MIROVA (Middle InfraRed Observation of Volcanic Activity), a collaborative project between the Universities of Turin and Florence (Italy) supported by the Centre for Volcanic Risk of the Italian Civil Protection Department (URL: http://www.mirovaweb.it/); Global Sulfur Dioxide Monitoring Page, Atmospheric Chemistry and Dynamics Laboratory, NASA Goddard Space Flight Center (NASA/GSFC), 8800 Greenbelt Road, Goddard, Maryland, USA (URL: https://so2.gsfc.nasa.gov/); Sentinel Hub Playground (URL: https://www.sentinel-hub.com/explore/sentinel-playground); Boris Behncke, Sonia Calvari, and Marco Neri, Istituto Nazionale di Geofisica e Vulcanologia (INGV), Sezione di Catania, Piazza Roma 2, 95123 Catania, Italy (URL: https://twitter.com/etnaboris, Image at https://twitter.com/etnaboris/status/1183640328760414209/photo/1).
Fuego
Guatemala
14.473°N, 90.88°W; summit elev. 3763 m
All times are local (unless otherwise noted)
Ongoing ash explosions, block avalanches, and intermittent lava flows
Fuego is a stratovolcano in Guatemala that has been erupting since 2002 with historical eruptions that date back to 1531. Volcanism is characterized by major ashfalls, pyroclastic flows, lava flows, and lahars. The previous report (BGVN 44:10) detailed activity that included multiple ash explosions, ash plumes, ashfall, active lava flows, and block avalanches. This report covers this continuing activity from October 2019 through March 2020 and consists of ash plumes, ashfall, incandescent ejecta, block avalanches, and lava flows. The primary source of information comes from the Instituto Nacional de Sismologia, Vulcanología, Meteorología e Hidrologia (INSIVUMEH), the Washington Volcanic Ash Advisory Center (VAAC), and various satellite data.
Summary of activity October 2019-March 2020. Daily activity persisted throughout October 2019-March 2020 (table 20) with multiple ash explosions recorded every hour, ash plumes that rose to a maximum of 4.8 km altitude each month drifting in multiple directions, incandescent ejecta reaching a 500 m above the crater resulting in block avalanches traveling down multiple drainages, and ashfall affecting communities in multiple directions. The highest rate of explosions occurred on 7 November with up to 25 per hour. Dominantly white fumaroles occurred frequently throughout this reporting period, rising to a maximum altitude of 4.5 km and drifting in multiple directions. Intermittent lava flows that reached a maximum length of 1.2 km were observed each month in the Seca (Santa Teresa) and Ceniza drainages (figure 128), but rarely in the Trinidad drainage. Thermal activity increased slightly in frequency and strength in late October and remained relatively consistent through mid-March as seen in the MIROVA analysis of MODIS satellite data (figure 129).
Table 20. Activity summary by month for Fuego with information compiled from INSIVUMEH daily reports.
| Month |
Ash plume heights (km) |
Ash plume distance (km) and direction |
Drainages affected by avalanche blocks |
Villages reporting ashfall |
| Oct 2019 |
4.3-4.8 km |
10-25 km, W-SW-S-NW |
Seca, Taniluyá, Ceniza, Trinidad, El Jute, Honda, and Las Lajas |
Panimaché I and II, Morelia, Santa Sofía, Porvenir, Finca Palo Verde, La Rochela, San Andrés Osuna, Sangre de Cristo, and San Pedro Yepocapa |
| Nov 2019 |
4.0-4.8 km |
10-20 km, W-SW-S-NW |
Seca, Taniluyá, Trinidad, Las Lajas, Honda, and Ceniza |
Panimaché I and II, Morelia, Santa Sofía, Porvenir, Sangre de Cristo, Finca Palo Verde, and San Pedro Yepocapa |
| Dec 2019 |
4.2-4.8 km |
10-25 km, W-SW-S-SE-N-NE |
Seca, Taniluya, Ceniza, Trinidad, and Las Lajas |
Morelia, Santa Sofía, Finca Palo Verde, El Porvenir, Sangre de Cristo, San Pedro Yepocapa, Panimaché I and II, La Rochela, and San Andrés Osuna |
| Jan 2020 |
4.3-4.8 km |
10-25 km, W-SW-S-N-NE-E |
Seca, Ceniza, Taniluyá, Trinidad, Honda, and Las Lajas |
Morelia, Santa Sofía, Sangre de Cristo, San Pedro Yepocapa, Panimaché I and II, El Porvenir, Finca Palo Verde, Rodeo, La Rochela, Alotenango, El Zapote, Trinidad, La Reina, Ceilán |
| Feb 2020 |
4.3-4.8 km |
8-25 km, W-SW-S-SE-E-NE-N-NW |
Seca, Ceniza, Taniluya, Trinidad, Las Lajas, Honda, La Rochela, El Zapote, and San Andrés Osuna |
Panimache I and II, Morelia, Santa Sofia, Sangre de Cristo, San Pedro Yepocapa, Rodeo, La Reina, Alotenango, Yucales, Siquinalá, Santa Lucia, El Porvenir, Finca Los Tarros, La Soledad, Buena Vista, La Cruz, Pajales, San Miguel Dueñas, Ciudad Vieja, San Miguel Escobar, San Pedro las Huertas, Antigua, La Rochela, and San Andrés Osuna |
| Mar 2020 |
4.3-4.8 km |
10-23 km, W-SW-S-SE-N-NW |
Seca, Ceniza, Trinidad, Taniluyá, Las Lajas, Honda, La Rochela, El Zapote, San Andrés Osuna, Morelia, Panimache, and Santa Sofia |
San Andrés Osuna, La Rochela, El Rodeo, Chuchu, Panimache I and II, Santa Sofia, Morelia, Finca Palo Verde, El Porvenir, Sangre de Cristo, La Cruz, San Pedro Yepocapa, La Conchita, La Soledad, Alotenango, Aldea la Cruz, Acatenango, Ceilan, Taniluyá, Ceniza, Las Lajas, Trinidad, Seca, and Honda |
Activity during October-December 2019. Activity in October 2019 consisted of 6-20 ash explosions per hour; ash plumes rose to 4.8 km altitude, drifting up to 25 km in multiple directions, resulting in ashfall in Panimaché I and II (8 km SW), Morelia (9 km SW), San Pedro Yepocapa (8 km NW), Sangre de Cristo (8 km WSW), Santa Sofía (12 km SW), El Porvenir (8 km ENE), Finca Palo Verde, La Rochela and San Andrés Osuna. The Washington VAAC issued multiple aviation advisories for a total of nine days in October. Continuous white gas-and-steam plumes reached 4.1-4.4 km altitude drifting generally W. Weak SO2 emissions were infrequently observed in satellite imagery during October and January 2020 (figure 130) Incandescent ejecta was frequently observed rising 200-400 m above the summit, which generated block avalanches that traveled down the Seca (W), Taniluyá (SW), Ceniza (SSW), Trinidad (S), El Jute, Honda, and Las Lajas (SE) drainages. During 3-7 October lahars descended the Ceniza, El Mineral, and Seca drainages, carrying tree branches, tree trunks, and blocks 1-3 m in diameter. During 6-8 and 13 October, active lava flows traveled up to 200 m down the Seca drainage.
During November 2019, the rate of explosions increased to 5-25 per hour, the latter of which occurred on 7 November. The explosions resulted in ash plumes that rose 4-4.8 km altitude, drifting 10-20 km in the W direction. Ashfall was observed in Panimaché I and II, Morelia, Santa Sofía, Porvenir, Sangre de Cristo, Finca Palo Verde, and San Pedro Yepocapa. Multiple Washington VAAC notices were issued for 11 days in November. Continuous white gas-and-steam plumes rose up to 4.5 km altitude drifting generally W. Incandescent ejecta rose 100-500 m above the crater, generating block avalanches in Seca, Taniluyá, Trinidad, Las Lajas, Honda, and Ceniza drainages. Lava flows were observed for a majority of the month into early December measuring 100-900 m long in the Seca and Ceniza drainages.
The number of explosions in December 2019 decreased compared to November, recording 8-19 per hour with incandescent ejecta rising 100-400 m above the crater. The explosions generated block avalanches that traveled in the Seca, Taniluya, Ceniza, Trinidad, and Las Lajas drainages throughout the month. Ash plumes continued to rise above the summit crater to 4.8 km drifting up to 25 km in multiple directions. The Washington VAAC issued multiple daily notices almost daily in December. A continuous lava flow observed during 6-15, 21-22, 24, and 26 November through 9 December measured 100-800 m long in the Seca and Ceniza drainages.
Activity during January-March 2020. Incandescent Strombolian explosions continued daily during January 2020, ejecting material up to 100-500 m above the crater. Ash plumes continued to rise to a maximum altitude of 4.8 km, resulting in ashfall in all directions affecting Morelia, Santa Sofía, Sangre de Cristo, San Pedro Yepocapa, Panimaché I and II, El Porvenir, Finca Palo Verde, Rodeo, La Rochela, Alotenango, El Zapote, Trinidad, La Reina, and Ceilán. The Washington VAAC issued multiple notices for a total of 12 days during January. Block avalanches resulting from the Strombolian explosions traveled down the Seca, Ceniza, Taniluyá, Trinidad, Honda, and Las Lajas drainages. An active lava flow in the Ceniza drainage measured 150-600 m long during 6-10 January.
During February 2020, INSIVUMEH reported a range of 4-16 explosions per hour, accompanied by incandescent material that rose 100-500 m above the crater (figure 131). Block avalanches traveled in the Santa Teresa, Seca, Ceniza, Taniluya, Trinidad, Las Lajas, Honda, La Rochela, El Zapote, and San Andrés Osuna drainages. Ash emissions from the explosions continued to rise 4.8 km altitude, drifting in multiple directions as far as 25 km and resulting in ashfall in the communities of Panimache I and II, Morelia, Santa Sofia, Sangre de Cristo, San Pedro Yepocapa, Rodeo, La Reina, Alotenango, Yucales, Siquinalá, Santa Lucia, El Porvenir, Finca Los Tarros, La Soledad, Buena Vista, La Cruz, Pajales, San Miguel Dueñas, Ciudad Vieja, San Miguel Escobar, San Pedro las Huertas, Antigua, La Rochela, and San Andrés Osuna. Washington VAAC notices were issued almost daily during the month. Lava flows were active in the Ceniza drainage during 13-20, 23-24, and 26-27 February measuring as long as 1.2 km.
Daily explosions and incandescent ejecta continued through March 2020, with 8-17 explosions per hour that rose up to 500 m above the crater. Block avalanches from the explosions were observed in the Seca, Ceniza, Trinidad, Taniluyá, Las Lajas, Honda, Santa Teresa, La Rochela, El Zapote, San Andrés Osuna, Morelia, Panimache, and Santa Sofia drainages. Accompanying ash plumes rose 4.8 km altitude, drifting in multiple directions mostly to the W as far as 23 km and resulting in ashfall in San Andrés Osuna, La Rochela, El Rodeo, Chuchu, Panimache I and II, Santa Sofia, Morelia, Finca Palo Verde, El Porvenir, Sangre de Cristo, La Cruz, San Pedro Yepocapa, La Conchita, La Soledad, Alotenango, Aldea la Cruz, Acatenango, Ceilan, Taniluyá, Ceniza, Las Lajas, Trinidad, Seca, and Honda. Multiple Washington VAAC notices were issued for a total of 15 days during March. Active lava flows were observed from 16-21 March in the Trinidad and Ceniza drainages measuring 400-1,200 m long and were accompanied by weak to moderate explosions. By 23 March, active lava flows were no longer observed.
Geologic Background. Volcán Fuego, one of Central America's most active volcanoes, is also one of three large stratovolcanoes overlooking Guatemala's former capital, Antigua. The scarp of an older edifice, Meseta, lies between Fuego and Acatenango to the north. Construction of Meseta dates back to about 230,000 years and continued until the late Pleistocene or early Holocene. Collapse of Meseta may have produced the massive Escuintla debris-avalanche deposit, which extends about 50 km onto the Pacific coastal plain. Growth of the modern Fuego volcano followed, continuing the southward migration of volcanism that began at the mostly andesitic Acatenango. Eruptions at Fuego have become more mafic with time, and most historical activity has produced basaltic rocks. Frequent vigorous historical eruptions have been recorded since the onset of the Spanish era in 1524, and have produced major ashfalls, along with occasional pyroclastic flows and lava flows.
Information Contacts: Instituto Nacional de Sismologia, Vulcanologia, Meteorologia e Hydrologia (INSIVUMEH), Unit of Volcanology, Geologic Department of Investigation and Services, 7a Av. 14-57, Zona 13, Guatemala City, Guatemala (URL: http://www.insivumeh.gob.gt/); MIROVA (Middle InfraRed Observation of Volcanic Activity), a collaborative project between the Universities of Turin and Florence (Italy) supported by the Centre for Volcanic Risk of the Italian Civil Protection Department (URL: http://www.mirovaweb.it/); Sentinel Hub Playground (URL: https://www.sentinel-hub.com/explore/sentinel-playground); Global Sulfur Dioxide Monitoring Page, Atmospheric Chemistry and Dynamics Laboratory, NASA Goddard Space Flight Center (NASA/GSFC), 8800 Greenbelt Road, Goddard, Maryland, USA (URL: https://so2.gsfc.nasa.gov/); Washington Volcanic Ash Advisory Center (VAAC), Satellite Analysis Branch (SAB), NOAA/NESDIS OSPO, NOAA Science Center Room 401, 5200 Auth Rd, Camp Springs, MD 20746, USA (URL: www.ospo.noaa.gov/Products/atmosphere/vaac, archive at: http://www.ssd.noaa.gov/VAAC/archive.html); Crelosa, 3ra. avenida. 8-66, Zona 14. Colonia El Campo, Guatemala Ciudad de Guatemala (URL: http://crelosa.com/, post at https://www.youtube.com/watch?v=1P4kWqxU2m0&feature=youtu.be).
Merapi
Indonesia
7.54°S, 110.446°E; summit elev. 2910 m
All times are local (unless otherwise noted)
Explosions produced ash plumes, ashfall, and pyroclastic flows during October 2019-March 2020
Merapi is a highly active stratovolcano located in Indonesia, just north of the city of Yogyakarta. The current eruption episode began in May 2018 and was characterized by phreatic explosions, ash plumes, block avalanches, and a newly active lava dome at the summit. This reporting period updates information from October 2019-March 2020 that includes explosions, pyroclastic flows, ash plumes, and ashfall. The primary reporting source of activity comes from Balai Penyelidikan dan Pengembangan Teknologi Kebencanaan Geologi (BPPTKG, the Center for Research and Development of Geological Disaster Technology, a branch of PVMBG) and Pusat Vulkanologi dan Mitigasi Bencana Geologi (PVMBG, also known as Indonesian Center for Volcanology and Geological Hazard Mitigation, CVGHM).
Some ongoing lava dome growth continued in October 2019 in the NE-SW direction measuring 100 m in length, 30 m in width, and 20 m in depth. Gas-and-steam emissions were frequent, reaching a maximum height of 700 m above the crater on 31 October. An explosion at 1631 on 14 October removed the NE-SW trending section of the lava dome and produced an ash plume that rose 3 km above the crater and extended SW for about 2 km (figures 90 and 91). The plume resulted in ashfall as far as 25 km to the SW. According to a Darwin VAAC notice, a thermal hotspot was detected in HIMAWARI-8 satellite imagery. A pyroclastic flow associated with the eruption traveled down the SW flank in the Gendol drainage. During 14-20 October lava flows from the crater generated block-and-ash flows that traveled 1 km SW, according to BPPTKG.
At 0621 on 9 November 2019, an eruption produced an ash plume that rose 1.5 km above the crater and drifted W. Ashfall was observed in the W region as far as 15 km from the summit in Wonolelo and Sawangan in Magelang Regency, as well as Tlogolele and Selo in Boyolali Regency. An associated pyroclastic flow traveled 2 km down the Gendol drainage on the SE flank. On 12 November aerial drone photographs were used to measure the volume of the lava dome, which was 407,000 m3. On 17 November, an eruption produced an ash plume that rose 1 km above the crater, resulting in ashfall as far as 15 km W from the summit in the Dukun District, Magelang Regency (figure 92). A pyroclastic flow accompanying the eruption traveled 1 km down the SE flank in the Gendol drainage. By 30 November low-frequency earthquakes and CO2 gas emissions had increased.
Volcanism was relatively low from 18 November 2019 through 12 February 2020, characterized primarily by gas-and-steam emissions and intermittent volcanic earthquakes. On 4 January a pyroclastic flow was recorded by the seismic network at 2036, but it wasn’t observed due to weather conditions. On 13 February an explosion was detected at 0516, which ejected incandescent material within a 1-km radius from the summit (figure 93). Ash plumes rose 2 km above the crater and drifted NW, resulting in ashfall within 10 km, primarily S of the summit; lightning was also seen in the plume. Ash was observed in Hargobinangun, Glagaharjo, and Kepuharjo. On 19 February aerial drone photographs were used to measure the change in the lava dome after the eruption; the volume of the lava had decreased, measuring 291,000 m3.
An explosion on 3 March at 0522 produced an ash plume that rose 6 km above the crater (figure 94), resulting in ashfall within 10 km of the summit, primarily to the NE in the Musuk and Cepogo Boyolali sub-districts and Mriyan Village, Boyolali (3 km from the summit). A pyroclastic flow accompanied this eruption, traveling down the SSE flank less than 2 km. Explosions continued to be detected on 25 and 27-28 March, resulting in ash plumes. The eruption on 27 March at 0530 produced an ash plume that rose 5 km above the crater, causing ashfall as far as 20 km to the W in the Mungkid subdistrict, Magelang Regency, and Banyubiru Village, Dukun District, Magelang Regency. An associated pyroclastic flow descended the SSE flank, traveling as far as 2 km. The ash plume from the 28 March eruption rose 2 km above the crater, causing ashfall within 5 km from the summit in the Krinjing subdistrict primarily to the W (figure 94).
Geologic Background. Merapi, one of Indonesia's most active volcanoes, lies in one of the world's most densely populated areas and dominates the landscape immediately north of the major city of Yogyakarta. It is the youngest and southernmost of a volcanic chain extending NNW to Ungaran volcano. Growth of Old Merapi during the Pleistocene ended with major edifice collapse perhaps about 2,000 years ago, leaving a large arcuate scarp cutting the eroded older Batulawang volcano. Subsequent growth of the steep-sided Young Merapi edifice, its upper part unvegetated due to frequent activity, began SW of the earlier collapse scarp. Pyroclastic flows and lahars accompanying growth and collapse of the steep-sided active summit lava dome have devastated cultivated lands on the western-to-southern flanks and caused many fatalities.
Information Contacts: Balai Penyelidikan dan Pengembangan Teknologi Kebencanaan Geologi (BPPTKG), Center for Research and Development of Geological Disaster Technology (URL: http://merapi.bgl.esdm.go.id/, Twitter: @BPPTKG); Pusat Vulkanologi dan Mitigasi Bencana Geologi (PVMBG, also known as Indonesian Center for Volcanology and Geological Hazard Mitigation, CVGHM), Jalan Diponegoro 57, Bandung 40122, Indonesia (URL: http://www.vsi.esdm.go.id/); Badan Nasional Penanggulangan Bencana (BNPB), National Disaster Management Agency, Graha BNPB - Jl. Scout Kav.38, East Jakarta 13120, Indonesia (URL: http://www.bnpb.go.id/, Twitter: https://twitter.com/BNPB_Indonesia); MAGMA Indonesia, Kementerian Energi dan Sumber Daya Mineral (URL: https://magma.vsi.esdm.go.id/); Darwin Volcanic Ash Advisory Centre (VAAC), Bureau of Meteorology, Northern Territory Regional Office, PO Box 40050, Casuarina, NT 0811, Australia (URL: http://www.bom.gov.au/info/vaac/); Jamie S. Sincioco, Phillipines (Twitter: @jaimessincioco, Image at https://twitter.com/jaimessincioco/status/1227966075519635456/photo/1).
Popocatepetl (Mexico) — April 2020 Cite this Report
Popocatepetl
Mexico
19.023°N, 98.622°W; summit elev. 5393 m
All times are local (unless otherwise noted)
Dome growth and destruction continues along with ash emissions and ejecta, September 2019-February 2020
Frequent historical eruptions have been reported from Mexico's Popocatépetl going back to the 14th century. Activity increased in the mid-1990s after about 50 years of quiescence, and the current eruption, ongoing since January 2005, has included numerous episodes of lava-dome growth and destruction within the 500-m-wide summit caldera. Multiple emissions of steam and gas occur daily, rising generally 1-3 km above the summit at about 5,400 m elevation; many contain small amounts of ash. Larger, more explosive events with ash plumes and incandescent ejecta landing on the flanks occur frequently. Activity through August 2019 was typical of the ongoing eruption with near-constant emissions of water vapor, gas, and minor ash, as well as multiple explosions with ash plumes and incandescent blocks scattered on the flanks (BGVN 44:09). This report covers similar activity from September 2019 through February 2020. Information comes from daily reports provided by México's Centro Nacional de Prevención de Desastres (CENAPRED); ash plumes are reported by the Washington Volcanic Ash Advisory Center (VAAC). Satellite visible and thermal imagery and SO2 data also provide helpful observations of activity.
Activity summary. Activity at Popocatépetl during September 2019-February 2020 continued at the high levels that have been ongoing for many years, characterized by hundreds of daily low-intensity emissions that included steam, gas, and small amounts of ash, and periods with multiple daily minor and moderate explosions that produce kilometer-plus-high ash plumes (figure 140). The Washington VAAC issued multiple daily volcanic ash advisories with plume altitudes around 6 km for many, although some were reported as high as 8.2 km. Hundreds of minutes of daily tremor activity often produced ash emissions as well. Incandescent ejecta landed 500-1,000 m from the summit frequently. The MIROVA thermal anomaly data showed near-constant moderate to high levels of thermal energy throughout the period (figure 141).
Sulfur dioxide emissions were measured with satellite instruments many days of each month from September 2019 thru February 2020. The intensity and drift directions varied significantly; some plumes remained detectable hundreds of kilometers from the volcano (figure 142). Plumes were detected almost daily in September, and on most days in October. They were measured at lower levels but often during November, and after pulses in early and late December only small plumes were visible during January 2020. Intermittent larger pulses returned in February. Dome growth and destruction in the summit crater continued throughout the period. A small dome was observed inside the summit crater in late September. Dome 85, 210-m-wide, was observed inside the summit crater in early November. Satellite imagery captured evidence of dome growth and ash emissions throughout the period (figure 143).
Activity during September-November 2019. On 1 September 2019 minor ashfall was reported in the communities of Atlautla, Ozumba, Juchitepec, and Tenango del Aire in the State of Mexico. The ash plumes rose less than 2 km above the summit and incandescent ejecta traveled less than 100 m from the summit crater. Twenty-two minor and three moderate explosions were recorded on 4-5 September along with minor ashfall in Juchitepec, Tenango del Aire, Tepetlixpa, and Atlautla. During a flyover on 5 September, officials did not observe a dome within the crater, and the dimensions remained the same as during the previous visit (350 m in diameter and 150 m deep) (figure 144). Ashfall was reported in Tlalmanalco and Amecameca on 6 September. The following day incandescent ejecta was visible on the flanks near the summit and ashfall was reported in Amecameca, Ayapango, and Tenango del Aire. The five moderate explosions on 8 September produced ash plumes that rose as high as 2 km above the summit, and incandescent ejecta on the flanks. Explosions on 10 September sent ejecta 500 m from the crater. Eight explosions during 20-21 September produced ejecta that traveled up to 1.5 km down the flanks (figure 145). During an overflight on 27 September specialists from the National Center for Disaster Prevention (CENAPRED ) of the National Coordination of Civil Protection and researchers from the Institute of Geophysics of UNAM observed a new dome 30 m in diameter; the overall crater had not changed size since the overflight in early September.
Fourteen explosions were reported on 2 October 2019. The last one produced an ash plume that rose 2 km above the summit and sent incandescent ejecta down the E slope (figure 146). Ashfall was reported in the municipalities of Atlautla Ozumba, Ayapango and Ecatzingo in the State of Mexico. Explosions on 3 and 4 October also produced ash plumes that rose between 1 and 2 km above the summit and sent ejecta onto the flanks. Additional incandescent ejecta was reported on 6, 7, 15, and 19 October. The communities of Amecameca, Tenango del Aire, Tlalmanalco, Cocotitlán, Temamatla, and Tláhuac reported ashfall on 10 October; Amecameca reported more ashfall on 12 October. On 22 October slight ashfall appeared in Amecameca, Tenango del Aire, Tlalmanalco, Ayapango, Temamatla, and Atlautla.
During 2-3 November 2019 there was 780 minutes of tremor reported in four different episodes. The seismicity was accompanied by ash emissions that drifted W and NW and produced ashfall in numerous communities, including Amecameca, Juchitepec, Ozumba, Tepetlixpa, and Atlautla in the State of México, in Ayapango and Cuautla in the State of Morelos, and in the municipalities of Tlahuac, Tlalpan, and Xochimilco in Mexico City. A moderate explosion on 4 November sent incandescent ejecta 2 km down the slopes and produced an ash plume that rose 1.5 km and drifted NW. Minor ashfall was reported in Tlalmanalco, Amecameca, and Tenango del Aire, State of Mexico. Similar ash plumes from explosions occurred the following day. Scientists from CENAPRED and the Institute of Geophysics of UNAM observed dome number 85 during an overflight on 5 November 2019. It had a diameter of 210 m and was 80 m thick, with an irregular surface (figure 147). Multiple explosions on 6 and 7 November produced incandescent ejecta; a moderate explosion late on 11 November produced ejecta that traveled 1.5 km from the summit and produced an ash plume 2 km high (figure 148). A lengthy period of constant ash emission that drifted E was reported on 18 November. A moderate explosion on 28 November sent incandescent fragments 1.5 km down the slopes and ash one km above the summit.
Activity during December 2019-February 2020. Throughout December 2019 weak emissions of steam and gas were reported daily, sometimes with minor amounts of ash, and minor explosions were only reported on 21 and 27 December. On 21 December two new high-resolution webcams were installed around Popocatépetl, one 5 km from the crater at the Tlamacas station, and the second in San Juan Tianguismanalco, 20 km away. Ash emissions and incandescent ejecta 800 m from the summit were observed on 25 December (figure 149). Incandescence at night was reported during 27-29 December.
Continuous emissions of water vapor and gas with low ash content were typical daily during January 2020. A moderate explosion on 9 January produced an ash plume that rose 3 km from the summit and drifted NE. In addition, incandescent ejecta traveled 1 km from the crater rim. A minor explosion on 21 January produced a 1.5-km-high plume with low ash content and incandescent ejecta that fell near the crater (figure 150). The first of two explosions late on 27 January produced ejecta that traveled 500 m and a 1-km-high ash plume. Constant incandescence was observed overnight on 29-30 January.
A moderate explosion on 5 February 2020 produced an ash plume that rose 1.5 km and drifted NNE. Explosions on 10 and 13 February sent ejecta 500 m down the flanks (figure 151). During an overflight on 18 February scientists noted that the internal crater maintained a diameter of 350 m and its approximate depth was 100-150 m; the crater was covered by tephra. For most of the second half of February the volcano had a continuous emission of gases with minor amounts of ash. In addition, multiple explosions produced ash plumes that rose 400-1,200 m above the crater and drifted in several different directions.
Geologic Background. Volcán Popocatépetl, whose name is the Aztec word for smoking mountain, rises 70 km SE of Mexico City to form North America's 2nd-highest volcano. The glacier-clad stratovolcano contains a steep-walled, 400 x 600 m wide crater. The generally symmetrical volcano is modified by the sharp-peaked Ventorrillo on the NW, a remnant of an earlier volcano. At least three previous major cones were destroyed by gravitational failure during the Pleistocene, producing massive debris-avalanche deposits covering broad areas to the south. The modern volcano was constructed south of the late-Pleistocene to Holocene El Fraile cone. Three major Plinian eruptions, the most recent of which took place about 800 CE, have occurred since the mid-Holocene, accompanied by pyroclastic flows and voluminous lahars that swept basins below the volcano. Frequent historical eruptions, first recorded in Aztec codices, have occurred since Pre-Columbian time.
Information Contacts: Centro Nacional de Prevención de Desastres (CENAPRED), Av. Delfín Madrigal No.665. Coyoacan, México D.F. 04360, México (URL: http://www.cenapred.unam.mx/), Daily Report Archive http://www.cenapred.unam.mx:8080/reportesVolcanGobMX/BuscarReportesVolcan); Washington Volcanic Ash Advisory Center (VAAC), Satellite Analysis Branch (SAB), NOAA/NESDIS OSPO, NOAA Science Center Room 401, 5200 Auth Rd, Camp Springs, MD 20746, USA (URL: www.ospo.noaa.gov/Products/atmosphere/vaac, archive at: http://www.ssd.noaa.gov/VAAC/archive.html); MIROVA (Middle InfraRed Observation of Volcanic Activity), a collaborative project between the Universities of Turin and Florence (Italy) supported by the Centre for Volcanic Risk of the Italian Civil Protection Department (URL: http://www.mirovaweb.it/); Global Sulfur Dioxide Monitoring Page, Atmospheric Chemistry and Dynamics Laboratory, NASA Goddard Space Flight Center (NASA/GSFC), 8800 Greenbelt Road, Goddard, Maryland, USA (URL: https://so2.gsfc.nasa.gov/); Sentinel Hub Playground (URL: https://www.sentinel-hub.com/explore/sentinel-playground).
Rincon de la Vieja (Costa Rica) — April 2020 Cite this Report
Rincon de la Vieja
Costa Rica
10.83°N, 85.324°W; summit elev. 1916 m
All times are local (unless otherwise noted)
Weak phreatic explosions during August 2019-March 2020; ash and lahars reported in late January
Rincón de la Vieja is a remote volcanic complex in Costa Rica containing an acid lake that has regularly generated weak phreatic explosions since 2011 (BGVN 44:08). The most recent eruptive period occurred during late March-early June 2019, primarily consisting of small phreatic explosions, minor deposits on the N crater rim, and gas-and-steam emissions. The report period of August 2019-March 2020 was characterized by similar activity, including small phreatic explosions, gas-and-steam plumes, ash and lake sediment ejecta, and volcanic tremors. The most significant activity during this time occurred on 30 January, where a phreatic explosion ejected ash and lake sediment above the crater rim, resulting in a pyroclastic flow which gradually turned into a lahar. Information for this reporting period of August 2019-March 2020 comes from the Observatorio Vulcanologico Sismologica de Costa Rica-Universidad Nacional (OVSICORI-UNA) using weekly bulletins.
According to OVSICORI-UNA, a small hydrothermal eruption was recorded on 1 August 2019. The seismicity was low with a few long period (LP) earthquakes around 1 August and intermittent background tremor. No explosions or emissions were reported through 11 September; seismicity remained low with an occasional LP earthquake and discontinuous tremor. The summit’s extension that has been recorded since the beginning of June stopped, and no significant deformation was observed in August.
Starting again in September 2019 and continuing intermittently through the reporting period, some deformation was observed at the base of the volcano as well as near the summit, according to OVSICORI-UNA. On 12 September an eruption occurred that was followed by volcanic tremors that continued through 15 September. In addition to these tremors, vigorous sustained gas-and-steam plumes were observed. The 16 September weekly bulletin did not describe any ejecta produced as a result of this event.
During 1-3 October small phreatic eruptions were accompanied by volcanic tremors that had decreased by 5 October. In November, volcanism and seismicity were relatively low and stable; few LP earthquakes were reported. This period of low activity remained through December. At the end of November, horizontal extension was observed at the summit, which continued through the first half of January.
Small phreatic eruptions were recorded on 2, 28, and 29 January 2020, with an increase in seismicity occurring on 27 January. On 30 January at 1213 a phreatic explosion produced a gas column that rose 1,500-2,000 m above the crater, with ash and lake sediment ejected up to 100 m above the crater. A news article posted by the Universidad de Costa Rica (UCR) noted that this explosion generated pyroclastic flows that traveled down the N flank for more than 2 km from the crater. As the pyroclastic flows moved through tributary channels, lahars were generated in the Pénjamo river, Zanjonuda gorge, and Azufrosa, traveling N for 4-10 km and passing through Buenos Aires de Upala (figure 29). Seismicity after this event decreased, though there were still some intermittent tremors.
On 17, 24, and 25 February and 11, 17, 19, 21, and 23 March, small phreatic eruptions were detected, according to OVSICORI-UNA. Geodetic measurements observed deformation consisting of horizontal extension and inflation near the summit in February-March. By the week of 30 March, the weekly bulletin reported 2-3 small eruptions accompanied by volcanic tremors occurred daily during most days of the week. None of these eruptions produced solid ejecta, pyroclastic flows, or lahars, according to the weekly OVSICORI-UNA bulletins during February-March 2020.
Geologic Background. Rincón de la Vieja, the largest volcano in NW Costa Rica, is a remote volcanic complex in the Guanacaste Range. The volcano consists of an elongated, arcuate NW-SE-trending ridge constructed within the 15-km-wide early Pleistocene Guachipelín caldera, whose rim is exposed on the south side. Sometimes known as the "Colossus of Guanacaste," it has an estimated volume of 130 km3 and contains at least nine major eruptive centers. Activity has migrated to the SE, where the youngest-looking craters are located. The twin cone of Santa María volcano, the highest peak of the complex, is located at the eastern end of a smaller, 5-km-wide caldera and has a 500-m-wide crater. A Plinian eruption producing the 0.25 km3 Río Blanca tephra about 3,500 years ago was the last major magmatic eruption. All subsequent eruptions, including numerous historical eruptions possibly dating back to the 16th century, have been from the prominent active crater containing a 500-m-wide acid lake located ENE of Von Seebach crater.
Information Contacts: Observatorio Vulcanologico Sismologica de Costa Rica-Universidad Nacional (OVSICORI-UNA), Apartado 86-3000, Heredia, Costa Rica (URL: http://www.ovsicori.una.ac.cr/, https://www.facebook.com/OVSICORI/); Luis Enrique Brenes Portuguéz, University of Costa Rica, Ciudad Universitaria Rodrigo Facio Brenes, San José, San Pedro, Costa Rica (URL: https://www.ucr.ac.cr/noticias/2020/01/30/actividad-del-volcan-rincon-de-la-vieja-es-normal-segun-experto.html).
Santa Maria (Guatemala) — April 2020 Cite this Report
Santa Maria
Guatemala
14.757°N, 91.552°W; summit elev. 3745 m
All times are local (unless otherwise noted)
Daily explosions with ash plumes and block avalanches continue, September 2019-February 2020
The dacitic Santiaguito lava-dome complex on the W flank of Guatemala's Santa María volcano has been growing and actively erupting since 1922. Ash explosions, pyroclastic, and lava flows have emerged from Caliente, the youngest of the four vents in the complex, for more than 40 years. A lava dome that appeared within the summit crater of Caliente in October 2016 has continued to grow, producing frequent block avalanches down the flanks. Daily explosions with ash plumes and block avalanches continued during September 2019-February 2020, the period covered in this report, with information primarily from Guatemala's INSIVUMEH (Instituto Nacional de Sismologia, Vulcanologia, Meterologia e Hidrologia) and the Washington VAAC (Volcanic Ash Advisory Center).
Constant fumarolic activity with steam and gas persisted from the Caliente dome throughout September 2019-February 2020. Explosions occurred multiple times per day, producing ash plumes that rose to altitudes of 3.1-3.5 km and usually drifted a few kilometers before dissipating. Several lahars during September and October carried volcanic blocks, ash, and debris down major drainages. Periodic ashfall was reported in communities within 10 km of the volcano. An increase in thermal activity beginning in November (figure 101) resulted in an increased number of observations of incandescence visible at night from the summit of Caliente through February 2020. Block avalanches occurred daily on the flanks of the dome, often reaching the base, stirring up small clouds of ash that drifted downwind.
Constant steam and gas fumarolic activity rose from the Caliente dome, drifting W, usually rising to 2.8-3.0 km altitude during September 2019. Multiple daily explosions with ash plumes rising to 2.9-3.4 km altitude drifted W or SW over the communities of San Marcos, Loma Linda Palajunoj, and Monte Claro (figure 102). Constant block avalanches fell to the base of the cone on the NE and SE flanks. The Washington VAAC reported an ash plume visible in satellite imagery on 10 September at 3.1 km altitude drifting W. On 14 September another plume was spotted moving WSW at 4.6 km altitude which dissipated quickly; the webcam captured another plume on 16 September. Ashfall on 27 September reached about 1 km from the volcano; it reached 1.5 km on 29 September. Lahars descended the Rio Cabello de Ángel on 2 and 24 September (figure 102). They were about 15 m wide, and 1-3 m deep, carrying blocks 1-2 m in diameter.
Througout October 2019, degassing of steam with minor gases occurred from the Caliente summit, rising to 2.9-3.0 km altitude and generally drifting SW. Weak explosions took place 1-5 times per hour, producing ash plumes that rose to 3.2-3.5 km altitude. Ashfall was reported in Monte Claro on 2 October. Nearly constant block avalanches descended the SE and S flanks, disturbing recent layers of fine ash and producing local ash clouds. Moderate explosions on 11 October produced ash plumes that rose to 3.5 km altitude and drifted W and SW about 1.5 km towards Río San Isidro (figure 103). The following day additional plumes drifted a similar distance to the SE. The Washington VAAC reported an ash emission visible in satellite imagery at 4.9 km altitude on 13 October drifting NNW. Ashfall was reported in Parcelamiento Monte Claro on 14 October. Some of the block avalanches observed on 14 October on the SE, S, and SW flanks were incandescent. Ash drifted 1.5 km W and SW on 17 October. Ashfall was reported near la finca Monte Claro on 25 and 28 October. A lahar descended the Río San Isidro, a tributary of the Río El Tambor on 7 October carrying blocks 1-2 m in diameter, tree trunks, and branches. It was about 16 m wide and 1-2 m deep. Additional lahars descended the rio Cabello de Angel on 23 and 24 October. They were about 15 m wide and 2 m deep, and carried ash and blocks 1-2 m in diameter, tree trunks, and branches.
During November 2019, steam plumes rose to 2.9-3.0 km altitude and generally drifted E. There were 1-3 explosions per hour; the ash plumes produced rose to altitudes of 3.1-3.5 km and often drifted SW, resulting in ashfall around the volcanic complex. Block avalanches descended the S and SW flanks every day. On 4 November ashfall was reported in the fincas (ranches) of El Faro, Santa Marta, El Viejo Palmar, and Las Marías, and the odor of sulfur was reported 10 km S. Incandescence was observed at the Caliente dome during the night of 5-6 November. Ash fell again in El Viejo Palmar, fincas La Florida, El Faro, and Santa Marta (5-6 km SW) on 7 November. Sulfur odor was also reported 8-10 km S on 16, 19, and 22 November. Fine-grained ash fell on 18 November in Loma Linda and San Marcos Palajunoj. On 29 November strong block avalanches descended in the SW flank, stirring up reddish ash that had fallen on the flanks (figure 104). The ash drifted up to 20 km SW.
White steam plumes rising to 2.9-3.0 km altitude drifted SE most days during December 2019. One to three explosions per hour produced ash plumes that rose to 3.1-3.5 km altitude and drifted W and SW producing ashfall on the flanks. Several strong block avalanches sent material down the SW flank. Ash from the explosions drifted about 1.5 km SW on 3 and 7 December. The Washington VAAC reported a small ash emission that rose to 4.9 km altitude and drifted WSW on 8 December, and another on 13 December that rose to 4.3 km altitude. Ashfall was reported up to 10 km S on 24 December. Incandescence was reported at the dome by INSIVUMEH eight times during the month, significantly more than during the recent previous months (figure 105).
Activity during January 2020 was similar to that during previous months. White plumes of steam rose from the Caliente dome to altitudes of 2.7-3.0 km and drifted SE; one to three explosions per hour produced ash plumes that rose to 3.2-3.4 km altitude and generally drifted about 1.5 km SW before dissipating. Frequent block avalanches on the SE flank caused smaller plumes that drifted SSW often over the ranches of San Marcos and Loma Linda Palajunoj. On 28 January ash plumes drifted W and SW over the communities of Calaguache, El Nuevo Palmar, and Las Marías. In addition to incandescence observed at the crater of Caliente dome at least nine times, thermal anomalies in satellite imagery were detected multiple times from the block avalanches on the S flank (figure 106).
The Washington VAAC reported an ash plume visible in satellite imagery at 4.6 km altitude drifting W on 3 February 2020. INSIVUMEH reported constant steam degassing that rose to 2.9-3.0 km altitude and drifted SW. In addition, 1-3 weak to moderate explosions per hour produced ash plumes to 3.1-3.5 km altitude that drifted about 1 km SW. Small amounts of ashfall around the volcano’s perimeter was common. The ash plumes on 5 February drifted NE over Santa María de Jesús. On 8 February the ash plumes drifted E and SE over the communities of Calaguache, El Nuevo Palmar, and Las Marías. Block avalanches on the S and SE flanks of Caliente dome continued, creating small ash clouds on the flank. Incandescence continued frequently at the crater and was also observed on the S flank in satellite imagery (figure 107).
Geologic Background. Symmetrical, forest-covered Santa María volcano is part of a chain of large stratovolcanoes that rise above the Pacific coastal plain of Guatemala. The sharp-topped, conical profile is cut on the SW flank by a 1.5-km-wide crater. The oval-shaped crater extends from just below the summit to the lower flank, and was formed during a catastrophic eruption in 1902. The renowned Plinian eruption of 1902 that devastated much of SW Guatemala followed a long repose period after construction of the large basaltic-andesite stratovolcano. The massive dacitic Santiaguito lava-dome complex has been growing at the base of the 1902 crater since 1922. Compound dome growth at Santiaguito has occurred episodically from four vents, with activity progressing E towards the most recent, Caliente. Dome growth has been accompanied by almost continuous minor explosions, with periodic lava extrusion, larger explosions, pyroclastic flows, and lahars.
Information Contacts: Instituto Nacional de Sismologia, Vulcanologia, Meteorologia e Hydrologia (INSIVUMEH), Unit of Volcanology, Geologic Department of Investigation and Services, 7a Av. 14-57, Zona 13, Guatemala City, Guatemala (URL: http://www.insivumeh.gob.gt/ ); Washington Volcanic Ash Advisory Center (VAAC), Satellite Analysis Branch (SAB), NOAA/NESDIS OSPO, NOAA Science Center Room 401, 5200 Auth Rd, Camp Springs, MD 20746, USA (URL: www.ospo.noaa.gov/Products/atmosphere/vaac, archive at: http://www.ssd.noaa.gov/VAAC/archive.html); Sentinel Hub Playground (URL: https://www.sentinel-hub.com/explore/sentinel-playground); MIROVA (Middle InfraRed Observation of Volcanic Activity), a collaborative project between the Universities of Turin and Florence (Italy) supported by the Centre for Volcanic Risk of the Italian Civil Protection Department (URL: http://www.mirovaweb.it/).
Semeru
Indonesia
8.108°S, 112.922°E; summit elev. 3657 m
All times are local (unless otherwise noted)
Ash plumes and thermal anomalies continue during September 2019-February 2020
Semeru is a stratovolcano located in East Java, Indonesia containing an active Jonggring-Seloko vent at the Mahameru summit. Common activity has consisted of ash plumes, pyroclastic flows and avalanches, and lava flows that travel down the SE flank. This report updates volcanism from September 2019 to February 2020 using primary information from the Pusat Vulkanologi dan Mitigasi Bencana Geologi (PVMBG, also known as Indonesian Center for Volcanology and Geological Hazard Mitigation, CVGHM) and the Darwin Volcanic Ash Advisory Centre (VAAC).
The dominant activity at Semeru for this reporting period consists of ash plumes, which were frequently reported by the Darwin VAAC. An eruption on 10 September 2019 produced an ash plume rising 4 km altitude drifting WNW, as seen in HIMAWARI-8 satellite imagery. Ash plumes continued to rise during 13-14 September. During the month of October the Darwin VAAC reported at least six ash plumes on 13, 14, 17-18, and 29-30 October rising to a maximum altitude of 4.6 km and moving primarily S and SW. Activity in November and December was relatively low, dominated mostly by strong and frequent thermal anomalies.
Volcanism increased in January 2020 starting with an eruption on 17 and 18 January that sent a gray ash plume up to 4.6 km altitude (figure 38). Eruptions continued from 20 to 26 January, producing ash plumes that rose up to 500 m above the crater that drifted in different directions. For the duration of the month and into February, ash plumes occurred intermittently. On 26 February, incandescent ejecta was ejected up to 50 m and traveled as far as 1000 m. Small sulfur dioxide emissions were detected in the Sentinel 5P/TROPOMI instrument during 25-27 February (figure 39). Lava flows during 27-29 February extended 200-1,000 m down the SE flank; gas-and-steam and SO2 emissions accompanied the flows. There were 15 shallow volcanic earthquakes detected on 29 February in addition to ash emissions rising 4.3 km altitude drifting ESE.
MIROVA (Middle InfraRed Observation of Volcanic Activity) analysis of MODIS satellite data showed relatively weak and intermittent thermal anomalies occurring during May to August 2019 (figure 40). The frequency and power of these thermal anomalies significantly increased during September to mid-December 2019 with a few hotspots occurring at distances greater than 5 km from the summit. These farther thermal anomalies to the N and NE of the volcano do not appear to be caused by volcanic activity. There was a brief break in activity during mid-December to mid-January 2020 before renewed activity was detected in early February 2020.
The MODVOLC algorithm detected 25 thermal hotspots during this reporting period, which took place during 25 September, 18 and 21 October 2019, 29 January, and 11, 14, 16, and 23 February 2020. Sentinel-2 thermal satellite imagery shows intermittent hotspots dominantly in the summit crater throughout this reporting period (figure 41).
Geologic Background. Semeru, the highest volcano on Java, and one of its most active, lies at the southern end of a volcanic massif extending north to the Tengger caldera. The steep-sided volcano, also referred to as Mahameru (Great Mountain), rises above coastal plains to the south. Gunung Semeru was constructed south of the overlapping Ajek-ajek and Jambangan calderas. A line of lake-filled maars was constructed along a N-S trend cutting through the summit, and cinder cones and lava domes occupy the eastern and NE flanks. Summit topography is complicated by the shifting of craters from NW to SE. Frequent 19th and 20th century eruptions were dominated by small-to-moderate explosions from the summit crater, with occasional lava flows and larger explosive eruptions accompanied by pyroclastic flows that have reached the lower flanks of the volcano.
Information Contacts: Pusat Vulkanologi dan Mitigasi Bencana Geologi (PVMBG, also known as Indonesian Center for Volcanology and Geological Hazard Mitigation, CVGHM), Jalan Diponegoro 57, Bandung 40122, Indonesia (URL: http://www.vsi.esdm.go.id/); MAGMA Indonesia, Kementerian Energi dan Sumber Daya Mineral (URL: https://magma.vsi.esdm.go.id/); Darwin Volcanic Ash Advisory Centre (VAAC), Bureau of Meteorology, Northern Territory Regional Office, PO Box 40050, Casuarina, NT 0811, Australia (URL: http://www.bom.gov.au/info/vaac/); MIROVA (Middle InfraRed Observation of Volcanic Activity), a collaborative project between the Universities of Turin and Florence (Italy) supported by the Centre for Volcanic Risk of the Italian Civil Protection Department (URL: http://www.mirovaweb.it/); Hawai'i Institute of Geophysics and Planetology (HIGP) - MODVOLC Thermal Alerts System, School of Ocean and Earth Science and Technology (SOEST), Univ. of Hawai'i, 2525 Correa Road, Honolulu, HI 96822, USA (URL: http://modis.higp.hawaii.edu/); Sentinel Hub Playground (URL: https://www.sentinel-hub.com/explore/sentinel-playground); Global Sulfur Dioxide Monitoring Page, Atmospheric Chemistry and Dynamics Laboratory, NASA Goddard Space Flight Center (NASA/GSFC), 8800 Greenbelt Road, Goddard, Maryland, USA (URL: https://so2.gsfc.nasa.gov/); Øystein Lund Andersen (Twitter: @OysteinLAnderse, https://twitter.com/OysteinLAnderse, URL: http://www.oysteinlundandersen.com).
Semisopochnoi (United States) — April 2020 Cite this Report
Semisopochnoi
United States
51.93°N, 179.58°E; summit elev. 1221 m
All times are local (unless otherwise noted)
Intermittent small explosions detected in December 2019 through mid-March 2020
Semisopochnoi is a remote stratovolcano located in the western Aleutians dominated by an 8 km-wide caldera containing the small (100 m diameter) Fenner Lake and a three-cone cluster: a northern cone known as the North cone of Mount Cerberus, an eastern cone known as the East cone of Mount Cerberus, and a southern cone known as the South cone of Mount Cerberus. Previous volcanism has included small explosions, ash deposits, and gas-and-steam emissions. This report updates activity during September 2019 through March 2020 using information from the Alaska Volcano Observatory (AVO). A new eruptive period began on 7 December 2019 and continued until mid-March 2020 with activity primarily focused in the North cone of Mount Cerberus.
During September-November 2019, low levels of unrest were characterized by intermittent weeks of elevated seismicity and gas-and-steam plumes visible on 8 September, 7-8 October, and 24 November. On 6 October an SO2 plume was visible in satellite imagery, according to AVO.
Seismicity increased on 5 December and was described as a strong tremor through 7 December. This tremor was associated with a small eruption on 7 December; intermittent explosions occurred and continued into the night. Increased seismicity was recorded throughout the rest of the month while AVO registered small explosions during 11-19 December. On 11-12 December, a gas-and-steam plume possibly containing some of ash extended 80 km (figure 2). Two more ash plumes were observed on 14 and 17 December, the latter of which extended 15 km SE. Sentinel-2 satellite images show gas-and-steam plumes rising from the North Cerberus crater intermittently at the end of 2019 and into early 2020 (figure 3).
The month of January 2020 was characterized by low levels of unrest due to intermittent low seismicity. Small explosions were reported during 14-17 February and a gas-and-steam plume was visible on 26 February. Seismic unrest occurred between 18 February-7 March. Gas-and-steam plumes were visible on 1, 9, 14-17, 20, and 21 March (figure 4). During 15-17 March, small explosions occurred, according to AVO. Additionally, clear satellite images showed gas-and-steam emissions and minor ash deposits around North Cerberus’ crater rim. After 17 March the explosions subsided and ash emissions were no longer observed. However, intermittent gas-and-steam emissions continued and seismicity remained elevated through the end of the month.
Geologic Background. Semisopochnoi, the largest subaerial volcano of the western Aleutians, is 20 km wide at sea level and contains an 8-km-wide caldera. It formed as a result of collapse of a low-angle, dominantly basaltic volcano following the eruption of a large volume of dacitic pumice. The high point of the island is Anvil Peak, a double-peaked late-Pleistocene cone that forms much of the island's northern part. The three-peaked Mount Cerberus (renamed Mount Young in 2023) was constructed within the caldera during the Holocene. Each of the peaks contains a summit crater; lava flows on the N flank appear younger than those on the south side. Other post-caldera volcanoes include the symmetrical Sugarloaf Peak SSE of the caldera and Lakeshore Cone, a small cinder cone at the edge of Fenner Lake in the NE part of the caldera. Most documented eruptions have originated from Young, although Coats (1950) considered that both Sugarloaf and Lakeshore Cone could have been recently active.
Information Contacts: Alaska Volcano Observatory (AVO), a cooperative program of a) U.S. Geological Survey, 4200 University Drive, Anchorage, AK 99508-4667 USA (URL: https://avo.alaska.edu/), b) Geophysical Institute, University of Alaska, PO Box 757320, Fairbanks, AK 99775-7320, USA, and c) Alaska Division of Geological & Geophysical Surveys, 794 University Ave., Suite 200, Fairbanks, AK 99709, USA (URL: http://dggs.alaska.gov/); Sentinel Hub Playground (URL: https://www.sentinel-hub.com/explore/sentinel-playground).
Stromboli
Italy
38.789°N, 15.213°E; summit elev. 924 m
All times are local (unless otherwise noted)
Strombolian activity continues at both summit crater areas, September-December 2019
Near-constant fountains of lava at Stromboli have served as a natural beacon in the Tyrrhenian Sea for at least 2,000 years. Eruptive activity at the summit consistently occurs from multiple vents at both a north crater area (N area) and a southern crater group (CS area) on the Terrazza Craterica at the head of the Sciara del Fuoco, a large scarp that runs from the summit down the NW side of the volcano-island (figure 168). Periodic lava flows emerge from the vents and flow down the scarp, sometimes reaching the sea; occasional large explosions produce ash plumes and pyroclastic flows. Thermal and visual cameras that monitor activity at the vents are located on the nearby Pizzo Sopra La Fossa, above the Terrazza Craterica, and at multiple locations on the flanks of the volcano. Detailed information for Stromboli is provided by Italy's Istituto Nazionale di Geofisica e Vulcanologia (INGV) as well as other satellite sources of data; September-December 2019 is covered in this report.
Activity was very consistent throughout the period of September-December 2019. Explosion rates ranged from 2-36 per hour and were of low to medium-high intensity, producing material that rose from less than 80 to over 150 m above the vents on occasion (table 7). The Strombolian activity in both crater areas often sent ejecta outside the crater rim onto the Terrazza Craterica, and also down the Sciara del Fuoco towards the coast. After the explosions of early July and late August, thermal activity decreased to more moderate levels that persisted throughout the period as seen in the MIROVA Log Radiative Power data (figure 169). Sentinel-2 satellite imagery supported descriptions of the constant glow at the summit, revealing incandescence at both summit areas, each showing repeating bursts of activity throughout the period (figure 170).
Table 7. Monthly summary of activity levels at Stromboli, September-December 2019. Low-intensity activity indicates ejecta rising less than 80 m, medium-intensity is ejecta rising less than 150 m, and high-intensity is ejecta rising over 200 m above the vent. Data courtesy of INGV.
| Month |
Activity |
| Sep 2019 |
Explosion rates varied from 11-36 events per hour and were of low- to medium intensity (producing 80-120 m high ejecta). Lapilli and bombs were typical from the N area, and coarse and finer-grained tephra (lapilli and ash) were most common in the CS area. The Strombolian activity in both crater areas often sent ejecta outside the crater rim onto the terrace, and also down the Sciara del Fuoco towards the coast. |
| Oct 2019 |
Typical Strombolian activity and degassing continued. Explosions rates varied from 2-21 events per hour. Low intensity activity was common in the N area (ejecta less than 80 m high) and low to moderate intensity activity was typical in the CS area, with a few explosions rising over 150 m high. Lapilli and bombs were typical from the N area, and coarse and finer-grained tephra (lapilli and ash) were most common in the CS area. Some of the explosions sent ejecta down the Sciara del Fuoco. |
| Nov 2019 |
Typical Strombolian activity and degassing continued. Explosion rates varied from 11-23 events per hour with ejecta rising usually 80-150 m above the vents. Occasional explosions rose 250 m high. In the N area, explosions were generally low intensity with coarse material (lapilli and bombs). In many explosions, ejecta covered the outer slopes of the area overlooking the Sciara del Fuoco, and some blocks rolled for a few hundred meters before stopping. In the CS area, coarse material was mixed with fine and some explosions sent ejecta onto the upper part of the Sciara del Fuoco. |
| Dec 2019 |
Strombolian activity and degassing continued. Explosion rates varied from 12-26 per hour. In the N area, explosion intensity was mainly medium-low (less than 150 m) with coarse ejecta while in the CS area it was usually medium-high (more than 150 m) with both coarse and fine ejecta. In many explosions, debris covered the outer slopes of the area overlooking the Sciara del Fuoco, and some blocks rolled for a few hundred meters before stopping. Spattering activity was noted in the southern vents of the N area. |
After a major explosion with a pyroclastic flow on 28 August 2019, followed by lava flows that reached the ocean in the following days (BGVN 44:09), activity diminished in early September to levels more typically seen in recent times. This included Strombolian activity from vents in both the N and CS areas that sent ejecta typically 80-150 m high. Ejecta from the N area generally consisted of lapilli and bombs, while the material from the CS area was often finer grained with significant amounts of lapilli and ash. The number of explosive events remained high in September, frequently reaching 25-30 events per hour. The ejecta periodically landed outside the craters on the Terrazza Craterica and even traveled partway down the Sciara del Fuoco. An inspection on 7 September by INGV revealed four eruptive vents in the N crater area and five in the S crater area (figure 171). The most active vents in the N area were N1 with mostly ash emissions and N2 with Strombolian explosions rich in incandescent coarse material that sometimes rose well above 150 m in height. In the S area, S1 and S2 produced jets of lava that often reached 100 m high. A small cone was observed around N2, having grown after the 28 August explosion. Between 11 and 13 September aerial surveys with drones produced detailed visual and thermal imagery of the summit (figure 172).
Strombolian activity from the N crater on 28 September and 1 October 2019 produced blocks and debris that rolled down the Sciara del Fuoco and reached the ocean (figure 173). Explosive activity from the CS crater area sometimes produced ejecta over 150 m high (figure 174). A survey on 26 November revealed that a layer of ash 5-10 cm thick had covered the bombs and blocks that were deposited on the Pizzo Sopra la Fossa during the explosions of 3 July and 28 August (figure 175). On the morning of 27 December a lava flow emerged from the CS area and traveled a few hundred meters down the Sciara del Fuoco. The frequency of explosive events remained relatively constant from September through December 2019 after decreasing from higher levels during July and August (figure 176).
Geologic Background. Spectacular incandescent nighttime explosions at Stromboli have long attracted visitors to the "Lighthouse of the Mediterranean" in the NE Aeolian Islands. This volcano has lent its name to the frequent mild explosive activity that has characterized its eruptions throughout much of historical time. The small island is the emergent summit of a volcano that grew in two main eruptive cycles, the last of which formed the western portion of the island. The Neostromboli eruptive period took place between about 13,000 and 5,000 years ago. The active summit vents are located at the head of the Sciara del Fuoco, a prominent scarp that formed about 5,000 years ago due to a series of slope failures which extends to below sea level. The modern volcano has been constructed within this scarp, which funnels pyroclastic ejecta and lava flows to the NW. Essentially continuous mild Strombolian explosions, sometimes accompanied by lava flows, have been recorded for more than a millennium.
Information Contacts: Istituto Nazionale di Geofisica e Vulcanologia (INGV), Sezione di Catania, Piazza Roma 2, 95123 Catania, Italy, (URL: http://www.ct.ingv.it/en/); MIROVA (Middle InfraRed Observation of Volcanic Activity), a collaborative project between the Universities of Turin and Florence (Italy) supported by the Centre for Volcanic Risk of the Italian Civil Protection Department (URL: http://www.mirovaweb.it/); Sentinel Hub Playground (URL: https://www.sentinel-hub.com/explore/sentinel-playground).
Villarrica
Chile
39.42°S, 71.93°W; summit elev. 2847 m
All times are local (unless otherwise noted)
Brief increase in explosions, mid-September 2019; continued thermal activity through February 2020
Historical eruptions at Chile's Villarrica, documented since 1558, have consisted largely of mild-to-moderate explosive activity with occasional lava effusion. An intermittently active lava lake at the summit has been the source of Strombolian activity, incandescent ejecta, and thermal anomalies for several decades; the current eruption has been ongoing since December 2014. Continuing activity during September 2019-February 2020 is covered in this report, with information provided by the Southern Andes Volcano Observatory (Observatorio Volcanológico de Los Andes del Sur, OVDAS), part of Chile's National Service of Geology and Mining (Servicio Nacional de Geología y Minería, SERNAGEOMIN), and Projecto Observación Villarrica Internet (POVI), part of the Fundacion Volcanes de Chile, a research group that studies volcanoes across Chile.
A brief period of heighted explosive activity in early September 2019 caused SERNAGEOMIN to raise the Alert Level from Yellow to Orange (on a four-color scale of Green-Yellow-Orange-Red) for several days. Increases in radiative power were visible in the MIROVA thermal anomaly data during September (figure 84). Although overall activity decreased after that, intermittent explosions were observed at the summit, and incandescence continued throughout September 2019-February 2020. Sentinel-2 satellite imagery indicated a strong thermal anomaly from the summit crater whenever the weather conditions permitted. In addition, ejecta periodically covered the area around the summit crater, and particulates often covered the snow beneath the narrow gas plume drifting S from the summit (figure 85).
SERNAGEOMIN raised the Alert Level from Green to Yellow in early August 2019 due to the increase in activity that included incandescent ejecta and bombs reaching 200 m from the summit crater (BGVN 44:09). An increase in seismic tremor activity on 8 September was accompanied by vigorous Strombolian explosions reported by POVI. The following day, SERNAGEOMIN raised the Alert Level from Yellow to Orange. Poor weather prevented visual observations of the summit on 8 and 9 September, but high levels of incandescence were observed briefly on 10 September. Incandescent ejecta reached 200 m from the crater rim late on 10 September (figure 86). Activity increased the next day with ejecta recorded 400 m from the crater, and the explosions were felt 12 km from the summit.
Explosions decreased in intensity by 13 September, but avalanches of incandescent material were visible on the E flank in the early morning hours (figure 87). Small black plumes later in the day were interpreted by POVI as the result of activity from landslides within the crater. Fine ash deposited on the N and NW flanks during 16-17 September was attributed to wind moving ash from within the crater, and not to new emissions from the crater (figure 88). SERNAGEOMIN lowered the Alert Level to Yellow on 16 September as tremor activity decreased significantly. Activity continued to decrease during the second half of September; incandescence was moderate with no avalanches observed, and intermittent emissions with small amounts of material were noted. Degassing of steam plumes rose up to 120 m above the crater.
Low-altitude degassing was typical activity during October-December 2019; occasionally steam and gas plumes rose 300 m above the summit, but they were generally less than 200 m high. Incandescence was visible at night when weather conditions permitted. Occasional Strombolian explosions were observed in the webcam (figure 89). During January and February 2020, similar activity was reported with steam plumes observed to heights of 300-400 m above the summit, and incandescence on nights where the summit was visible (figure 90). A drone overflight on 19 January produced a clear view into the summit crater revealing a 5-m-wide lava pit about 120 m down inside the crater (figure 91).
Geologic Background. The glacier-covered Villarrica stratovolcano, in the northern Lakes District of central Chile, is ~15 km south of the city of Pucon. A 2-km-wide caldera that formed about 3,500 years ago is located at the base of the presently active, dominantly basaltic to basaltic-andesite cone at the NW margin of a 6-km-wide Pleistocene caldera. More than 30 scoria cones and fissure vents are present on the flanks. Plinian eruptions and pyroclastic flows that have extended up to 20 km from the volcano were produced during the Holocene. Lava flows up to 18 km long have issued from summit and flank vents. Eruptions documented since 1558 CE have consisted largely of mild-to-moderate explosive activity with occasional lava effusion. Glaciers cover 40 km2 of the volcano, and lahars have damaged towns on its flanks.
Information Contacts: Servicio Nacional de Geología y Minería (SERNAGEOMIN), Observatorio Volcanológico de Los Andes del Sur (OVDAS), Avda Sta María No. 0104, Santiago, Chile (URL: http://www.sernageomin.cl/); Proyecto Observación Villarrica Internet (POVI) (URL: http://www.povi.cl/); MIROVA (Middle InfraRed Observation of Volcanic Activity), a collaborative project between the Universities of Turin and Florence (Italy) supported by the Centre for Volcanic Risk of the Italian Civil Protection Department (URL: http://www.mirovaweb.it/); Sentinel Hub Playground (URL: https://www.sentinel-hub.com/explore/sentinel-playground); Leighton M. Watson, Department of Earth Sciences at the University of Oregon, Eugene, OR 97403-1272, USA (URL: https://earthsciences.uoregon.edu/).