Recently Published Bulletin Reports
Kadovar (Papua New Guinea) An ash plume and weak thermal anomaly during May 2023
San Miguel (El Salvador) Small gas-and-ash explosions during March and May 2023
Ebeko (Russia) Continued explosions, ash plumes, and ashfall during October 2022-May 2023
Home Reef (Tonga) Discolored plumes continued during November 2022-April 2023
Semisopochnoi (United States) Occasional explosions, ash deposits, and gas-and-steam plumes during December 2022-May 2023
Ambae (Vanuatu) New lava flow, ash plumes, and sulfur dioxide plumes during February-May 2023
Ibu (Indonesia) Daily ash explosions continue, along with thermal anomalies in the crater, October 2022-May 2023
Dukono (Indonesia) Continuing ash emissions, SO2 plumes, and thermal signals during October 2022-May 2023
Sabancaya (Peru) Explosions, gas-and-ash plumes, and thermal activity persist during November 2022-April 2023
Sheveluch (Russia) Significant explosions destroyed part of the lava-dome complex during April 2023
Bezymianny (Russia) Explosions, ash plumes, lava flows, and avalanches during November 2022-April 2023
Chikurachki (Russia) New explosive eruption during late January-early February 2023
Kadovar (Papua New Guinea) — June 2023  Cite this Report
Kadovar
Papua New Guinea
3.608°S, 144.588°E; summit elev. 365 m
All times are local (unless otherwise noted)
An ash plume and weak thermal anomaly during May 2023
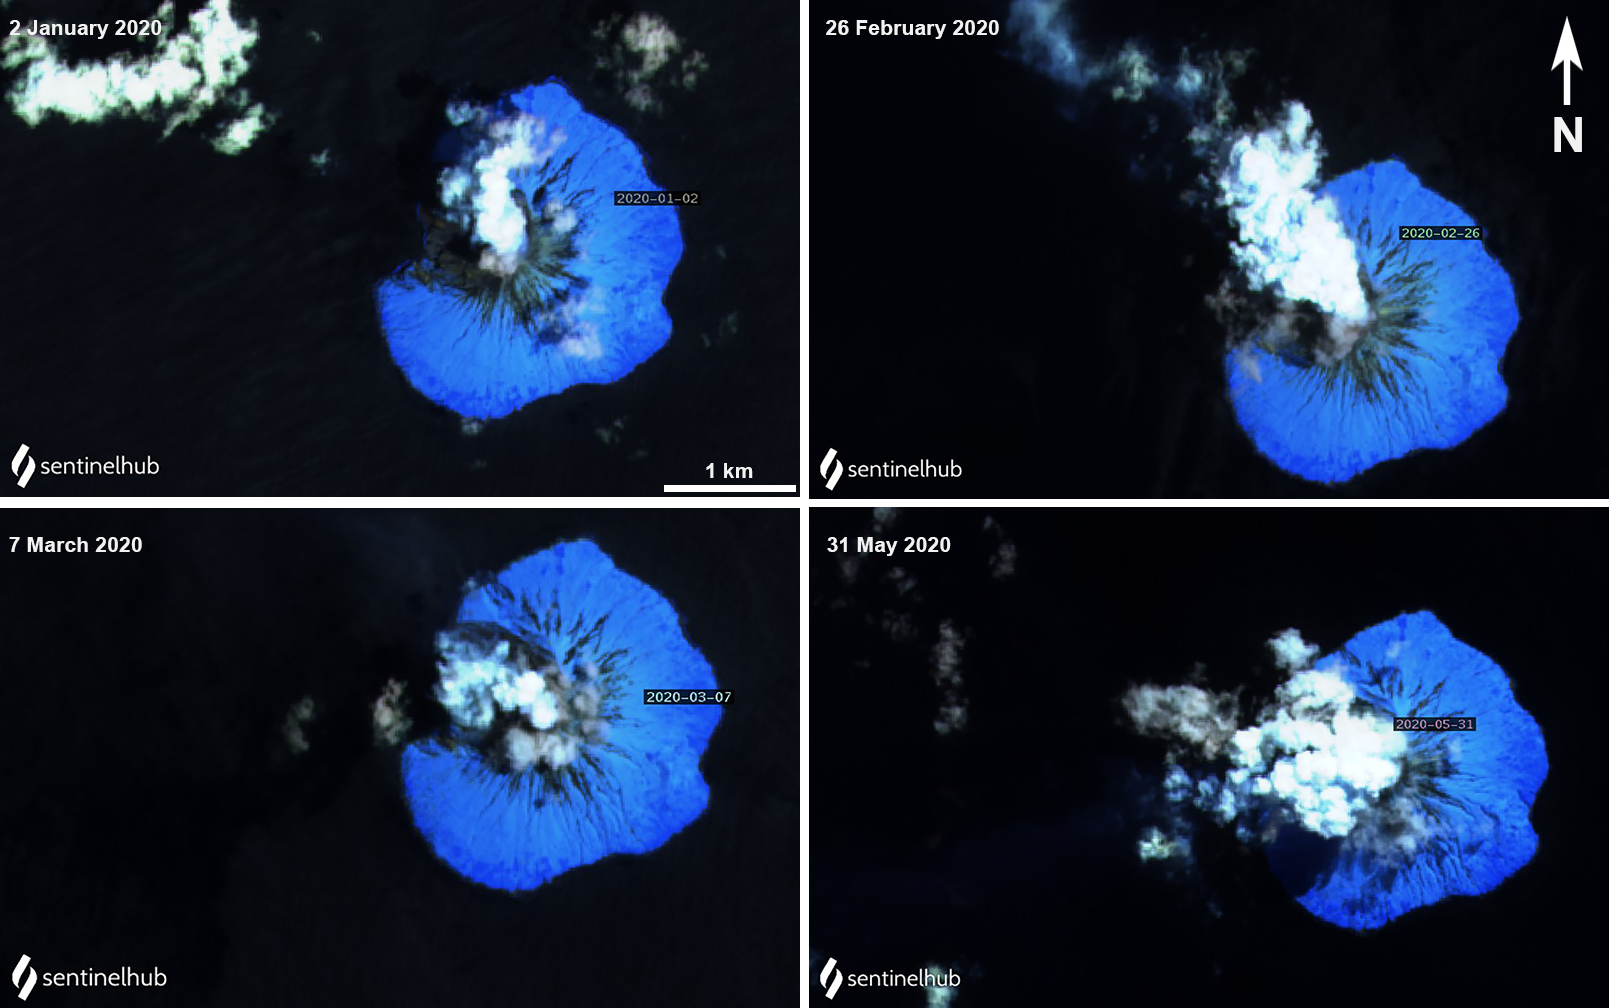
Kadovar is a 2-km-wide island that is the emergent summit of a Bismarck Sea stratovolcano. It lies off the coast of New Guinea, about 25 km N of the mouth of the Sepik River. Prior to an eruption that began in 2018, a lava dome formed the high point of the volcano, filling an arcuate landslide scarp open to the S. Submarine debris-avalanche deposits occur to the S of the island. The current eruption began in January 2018 and has comprised lava effusion from vents at the summit and at the E coast; more recent activity has consisted of ash plumes, weak thermal activity, and gas-and-steam plumes (BGVN 48:02). This report covers activity during February through May 2023 using information from the Darwin Volcanic Ash Advisory Center (VAAC) and satellite data.
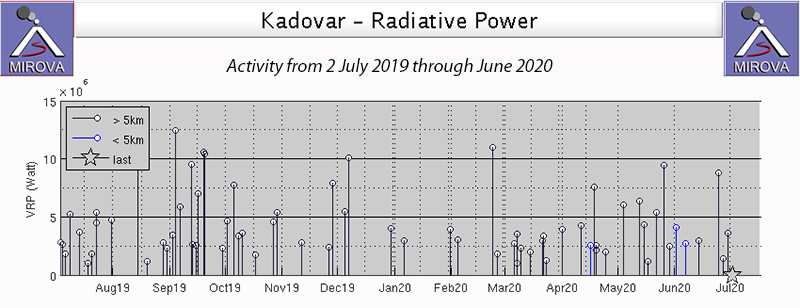
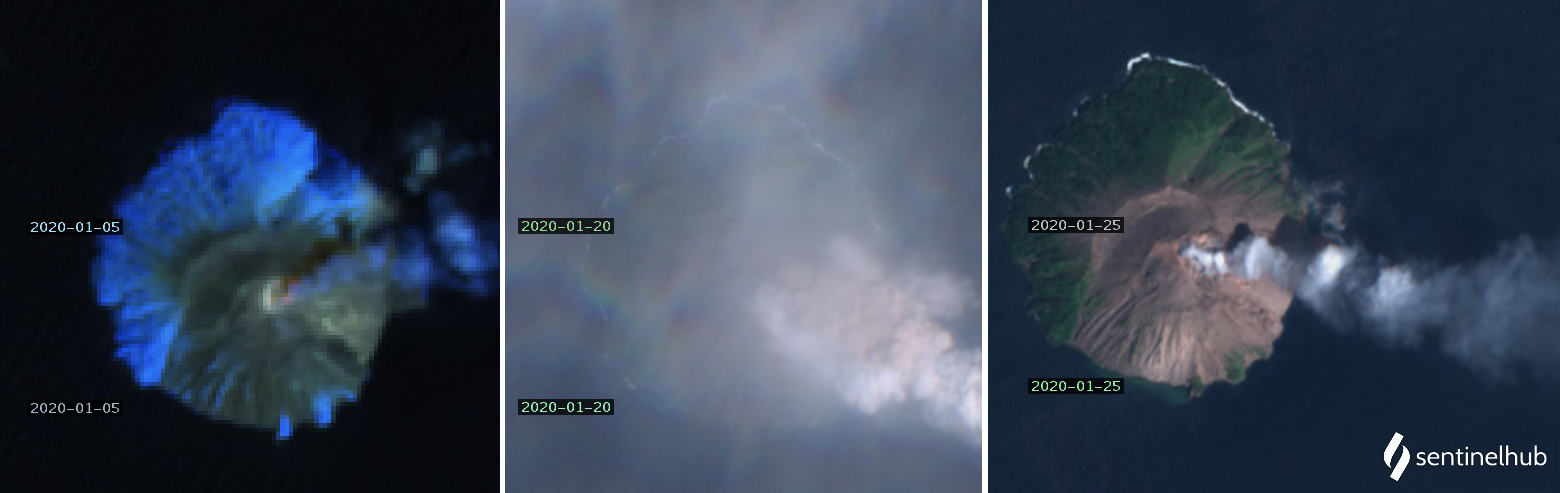
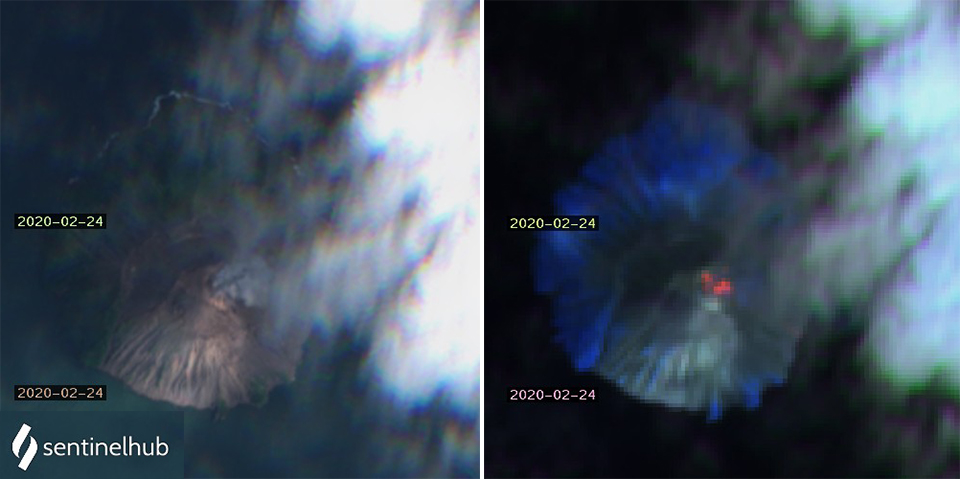
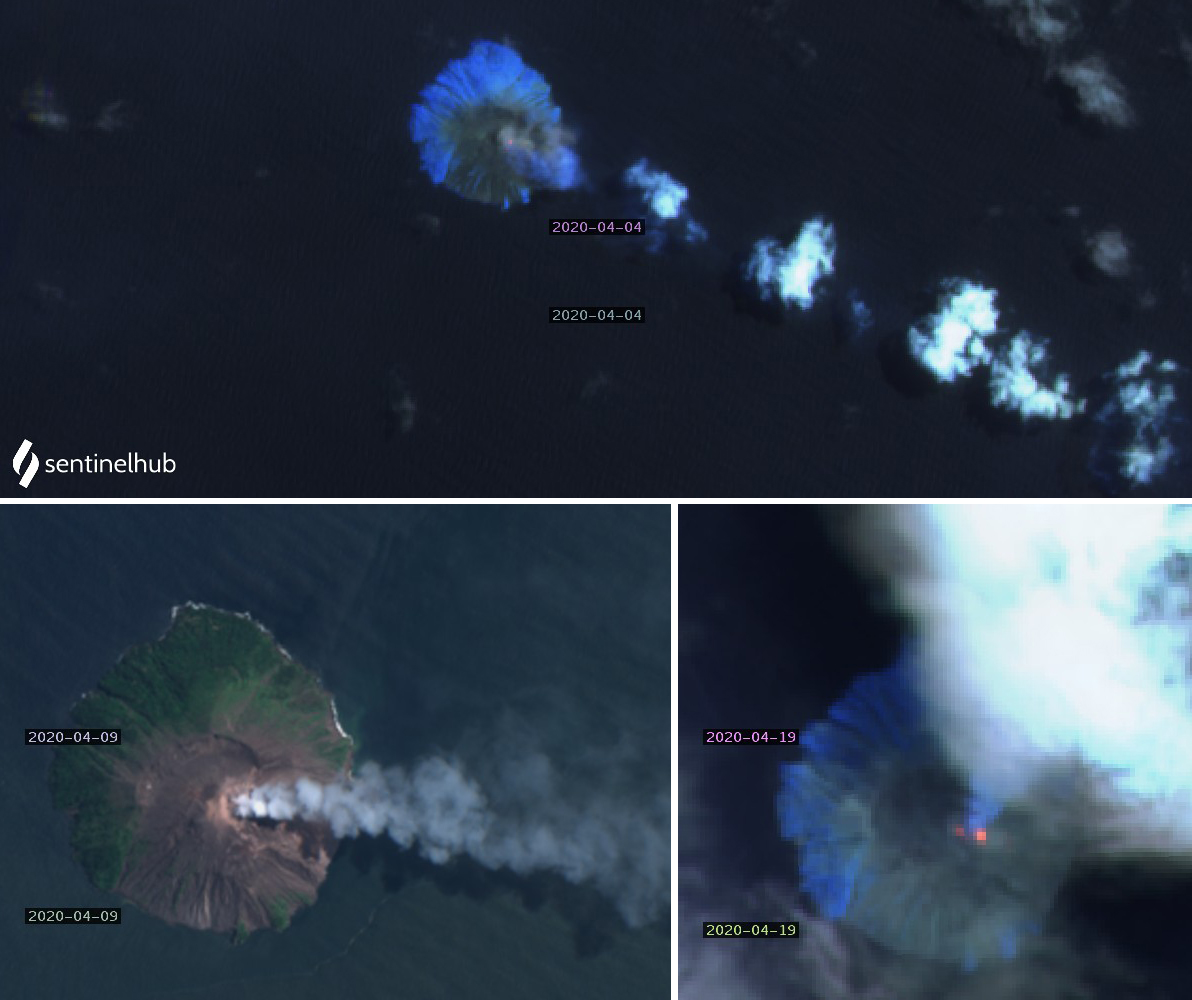
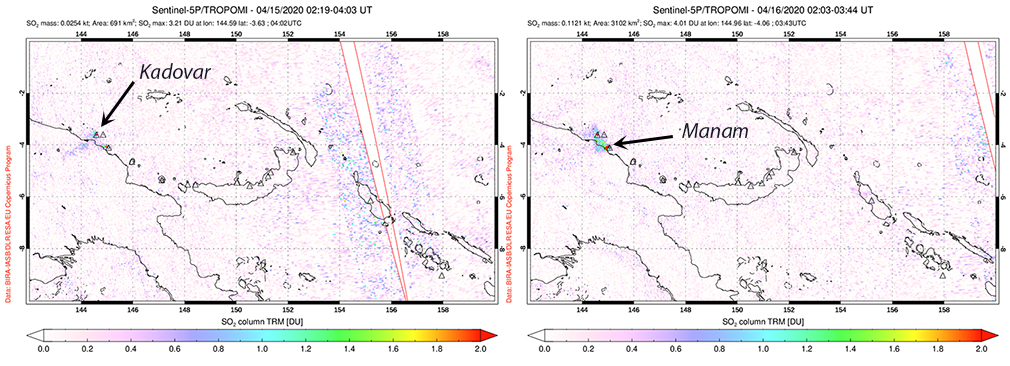
Activity during the reporting period was relatively low and mainly consisted of white gas-and-steam plumes that were visible in natural color satellite images on clear weather days (figure 67). According to a Darwin VAAC report, at 2040 on 6 May an ash plume rose to 4.6 km altitude and drifted W; by 2300 the plume had dissipated. MODIS satellite instruments using the MODVOLC thermal algorithm detected a single thermal hotspot on the SE side of the island on 7 May. Weak thermal activity was also detected in a satellite image on the E side of the island on 14 May, accompanied by a white gas-and-steam plume that drifted SE (figure 68).
Geologic Background. The 2-km-wide island of Kadovar is the emergent summit of a Bismarck Sea stratovolcano of Holocene age. It is part of the Schouten Islands, and lies off the coast of New Guinea, about 25 km N of the mouth of the Sepik River. Prior to an eruption that began in 2018, a lava dome formed the high point of the andesitic volcano, filling an arcuate landslide scarp open to the south; submarine debris-avalanche deposits occur in that direction. Thick lava flows with columnar jointing forms low cliffs along the coast. The youthful island lacks fringing or offshore reefs. A period of heightened thermal phenomena took place in 1976. An eruption began in January 2018 that included lava effusion from vents at the summit and at the E coast.
Information Contacts: Darwin Volcanic Ash Advisory Centre (VAAC), Bureau of Meteorology, Northern Territory Regional Office, PO Box 40050, Casuarina, NT 0811, Australia (URL: http://www.bom.gov.au/info/vaac/); Hawai'i Institute of Geophysics and Planetology (HIGP) - MODVOLC Thermal Alerts System, School of Ocean and Earth Science and Technology (SOEST), Univ. of Hawai'i, 2525 Correa Road, Honolulu, HI 96822, USA (URL: http://modis.higp.hawaii.edu/); Copernicus Browser, Copernicus Data Space Ecosystem, European Space Agency (URL: https://dataspace.copernicus.eu/browser/).
San Miguel (El Salvador) — June 2023 Cite this Report
San Miguel
El Salvador
13.434°N, 88.269°W; summit elev. 2130 m
All times are local (unless otherwise noted)
Small gas-and-ash explosions during March and May 2023
San Miguel in El Salvador is a broad, deep crater complex that has been frequently modified by eruptions recorded since the early 16th century and consists of the summit known locally as Chaparrastique. Flank eruptions have produced lava flows that extended to the N, NE, and SE during the 17-19th centuries. The most recent activity has consisted of minor ash eruptions from the summit crater. The current eruption period began in November 2022 and has been characterized by frequent phreatic explosions, gas-and-ash emissions, and sulfur dioxide plumes (BGVN 47:12). This report describes small gas-and-ash explosions during December 2022 through May 2023 based on special reports from the Ministero de Medio Ambiente y Recursos Naturales (MARN).
Activity has been relatively low since the last recorded explosions on 29 November 2022. Seismicity recorded by the San Miguel Volcano Station (VSM) located on the N flank at 1.7 km elevation had decreased by 7 December. Sulfur dioxide gas measurements taken with DOAS (Differential Optical Absorption Spectroscopy) mobile equipment were below typical previously recorded values: 300 tons per day (t/d). During December, small explosions were recorded by the seismic network and manifested as gas-and-steam emissions.
Gas-and-ash explosions in the crater occurred during January 2023, which were recorded by the seismic network. Sulfur dioxide values remained low, between 300-400 t/d through 10 March. At 0817 on 14 January a gas-and-ash emission was visible in webcam images, rising just above the crater rim. Some mornings during February, small gas-and-steam plumes were visible in the crater. On 7 March at 2252 MARN noted an increase in degassing from the central crater; gas emissions were constantly observed through the early morning hours on 8 March. During the early morning of 8 March through the afternoon on 9 March, 12 emissions were registered, some accompanied by ash. The last gas-and-ash emission was recorded at 1210 on 9 March; very fine ashfall was reported in El Tránsito (10 km S), La Morita (6 km W), and La Piedrita (3 km W). The smell of sulfur was reported in Piedra Azul (5 km SW). On 16 March MARN reported that gas-and-steam emissions decreased.
Low degassing and very low seismicity were reported during April; no explosions have been detected between 9 March and 27 May. The sulfur dioxide emissions remained between 350-400 t/d; during 13-20 April sulfur dioxide values fluctuated between 30-300 t/d. Activity remained low through most of May; on 23 May seismicity increased. An explosion was detected at 1647 on 27 May generated a gas-and-ash plume that rose 700 m high (figure 32); a decrease in seismicity and gas emissions followed. The DOAS station installed on the W flank recorded sulfur dioxide values that reached 400 t/d on 27 May; subsequent measurements showed a decrease to 268 t/d on 28 May and 100 t/d on 29 May.
Geologic Background. The symmetrical cone of San Miguel, one of the most active volcanoes in El Salvador, rises from near sea level to form one of the country's most prominent landmarks. A broad, deep, crater complex that has been frequently modified by eruptions recorded since the early 16th century caps the truncated unvegetated summit, also known locally as Chaparrastique. Flanks eruptions of the basaltic-andesitic volcano have produced many lava flows, including several during the 17th-19th centuries that extended to the N, NE, and SE. The SE-flank flows are the largest and form broad, sparsely vegetated lava fields crossed by highways and a railroad skirting the base of the volcano. Flank vent locations have migrated higher on the edifice during historical time, and the most recent activity has consisted of minor ash eruptions from the summit crater.
Information Contacts: Ministero de Medio Ambiente y Recursos Naturales (MARN), Km. 5½ Carretera a Nueva San Salvador, Avenida las Mercedes, San Salvador, El Salvador (URL: http://www.snet.gob.sv/ver/vulcanologia).
Ebeko
Russia
50.686°N, 156.014°E; summit elev. 1103 m
All times are local (unless otherwise noted)
Continued explosions, ash plumes, and ashfall during October 2022-May 2023
Ebeko, located on the N end of Paramushir Island in the Kuril Islands, consists of three summit craters along a SSW-NNE line at the northern end of a complex of five volcanic cones. Eruptions date back to the late 18th century and have been characterized as small-to-moderate explosions from the summit crater, accompanied by intense fumarolic activity. The current eruption period began in June 2022 and has recently consisted of frequent explosions, ash plumes, and thermal activity (BGVN 47:10). This report covers similar activity during October 2022 through May 2023, based on information from the Kamchatka Volcanic Eruptions Response Team (KVERT) and satellite data.
Activity during October consisted of explosive activity, ash plumes, and occasional thermal anomalies. Visual data by volcanologists from Severo-Kurilsk showed explosions producing ash clouds up to 2.1-3 km altitude which drifted E, N, NE, and SE during 1-8, 10, 16, and 18 October. KVERT issued several Volcano Observatory Notices for Aviation (VONA) on 7, 13-15, and 27 October 2022, stating that explosions generated ash plumes that rose to 2.3-4 km altitude and drifted 5 km E, NE, and SE. Ashfall was reported in Severo-Kurilsk (Paramushir Island, about 7 km E) on 7 and 13 October. Satellite data showed a thermal anomaly over the volcano on 15-16 October. Visual data showed ash plumes rising to 2.5-3.6 km altitude on 22, 25-29, and 31 October and moving NE due to constant explosions.
Similar activity continued during November, with explosions, ash plumes, and ashfall occurring. KVERT issued VONAs on 1-2, 4, 6-7, 9, 13, and 16 November that reported explosions and resulting ash plumes that rose to 1.7-3.6 km altitude and drifted 3-5 km SE, ESE, E, and NE. On 1 November ash plumes extended as far as 110 km SE. On 5, 8, 12, and 24-25 November explosions and ash plumes rose to 2-3.1 km altitude and drifted N and E. Ashfall was observed in Severo-Kurilsk on 7 and 16 November. A thermal anomaly was visible during 1-4, 16, and 20 November. Explosions during 26 November rose as high as 2.7 km altitude and drifted NE (figure 45).
Explosions and ash plumes continued to occur in December. During 1-2 and 4 December volcanologists from Severo-Kurilsk observed explosions that sent ash to 1.9-2.5 km altitude and drifted NE and SE (figure 46). VONAs were issued on 5, 9, and 16 December reporting that explosions generated ash plumes rising to 1.9 km, 2.6 km, and 2.4 km altitude and drifted 5 km SE, E, and NE, respectively. A thermal anomaly was visible in satellite imagery on 16 December. On 18 and 27-28 December explosions produced ash plumes that rose to 2.5 km altitude and drifted NE and SE. On 31 December an ash plume rose to 2 km altitude and drifted NE.
Explosions continued during January 2023, based on visual observations by volcanologists from Severo-Kurilsk. During 1-7 January explosions generated ash plumes that rose to 4 km altitude and drifted NE, E, W, and SE. According to VONAs issued by KVERT on 2, 4, 10, and 23 January, explosions produced ash plumes that rose to 2-4 km altitude and drifted 5 km N, NE, E, and ENE; the ash plume that rose to 4 km altitude occurred on 10 January (figure 47). Satellite data showed a thermal anomaly during 3-4, 10, 13, 16, 21, 22, and 31 January. KVERT reported that an ash cloud on 4 January moved 12 km NE. On 6 and 9-11 January explosions sent ash plumes to 4.5 km altitude and drifted W and ESE. On 13 January an ash plume rose to 3 km altitude and drifted SE. During 20-24 January ash plumes from explosions rose to 3.7 km altitude and drifted SE, N, and NE. On 21 January the ash plume drifted as far as 40 km NE. During 28-29 and 31 January and 1 February ash plumes rose to 4 km altitude and drifted NE.
During February, explosions, ash plumes, and ashfall were reported. During 1, 4-5 and 7-8 February explosions generated ash plumes that rose to 4.5 km altitude and drifted E and NE; ashfall was observed on 5 and 8 February. On 6 February an explosion produced an ash plume that rose to 3 km altitude and drifted 7 km E, causing ashfall in Severo-Kurilsk. A thermal anomaly was visible in satellite data on 8, 9, 13, and 21 February. Explosions on 9 and 12-13 February produced ash plumes that rose to 4 km altitude and drifted E and NE; the ash cloud on 12 February extended as far as 45 km E. On 22 February explosions sent ash to 3 km altitude that drifted E. During 24 and 26-27 February ash plumes rose to 4 km altitude and drifted E. On 28 February an explosion sent ash to 2.5-3 km altitude and drifted 5 km E; ashfall was observed in Severo-Kurilsk.
Activity continued during March; visual observations showed that explosions generated ash plumes that rose to 3.6 km altitude on 3, 5-7, and 9-12 March and drifted E, NE, and NW. Thermal anomalies were visible on 10, 13, and 29-30 March in satellite imagery. On 18, 21-23, 26, and 29-30 March explosions produced ash plumes that rose to 2.8 km altitude and drifted NE and E; the ash plumes during 22-23 March extended up to 76 km E. A VONA issued on 21 March reported an explosion that produced an ash plume that rose to 2.8 km altitude and drifted 5 km E. Another VONA issued on 23 March reported that satellite data showed an ash plume rising to 3 km altitude and drifted 14 km E.
Explosions during April continued to generate ash plumes. On 1 and 4 April an ash plume rose to 2.8-3.5 km altitude and drifted SE and NE. A thermal anomaly was visible in satellite imagery during 1-6 April. Satellite data showed ash plumes and clouds rising to 2-3 km altitude and drifting up to 12 km SW and E on 3 and 6 April (figure 48). KVERT issued VONAs on 3, 5, 14, 16 April describing explosions that produced ash plumes rising to 3 km, 3.5 km, 3.5 km, and 3 km altitude and drifting 5 km S, 5 km NE and SE, 72 km NNE, and 5 km NE, respectively. According to satellite data, the resulting ash cloud from the explosion on 14 April was 25 x 7 km in size and drifted 72-104 km NNE during 14-15 April. According to visual data by volcanologists from Severo-Kurilsk explosions sent ash up to 3.5 km altitude that drifted NE and E during 15-16, 22, 25-26, and 29 April.
The explosive eruption continued during May. Explosions during 3-4, 6-7, and 9-10 May generated ash plumes that rose to 4 km altitude and drifted SW and E. Satellite data showed a thermal anomaly on 3, 9, 13-14, and 24 May. During 12-16, 23-25, and 27-28 May ash plumes rose to 3.5 km altitude and drifted in different directions due to explosions. Two VONA notices were issued on 16 and 25 May, describing explosions that generated ash plumes rising to 3 km and 3.5 km altitude, respectively and extending 5 km E. The ash cloud on 25 May drifted 75 km SE.
Thermal activity in the summit crater, occasionally accompanied by ash plumes and ash deposits on the SE and E flanks due to frequent explosions, were visible in infrared and true color satellite images (figure 49).
Geologic Background. The flat-topped summit of the central cone of Ebeko volcano, one of the most active in the Kuril Islands, occupies the northern end of Paramushir Island. Three summit craters located along a SSW-NNE line form Ebeko volcano proper, at the northern end of a complex of five volcanic cones. Blocky lava flows extend west from Ebeko and SE from the neighboring Nezametnyi cone. The eastern part of the southern crater contains strong solfataras and a large boiling spring. The central crater is filled by a lake about 20 m deep whose shores are lined with steaming solfataras; the northern crater lies across a narrow, low barrier from the central crater and contains a small, cold crescentic lake. Historical activity, recorded since the late-18th century, has been restricted to small-to-moderate explosive eruptions from the summit craters. Intense fumarolic activity occurs in the summit craters, on the outer flanks of the cone, and in lateral explosion craters.
Information Contacts: Kamchatka Volcanic Eruptions Response Team (KVERT), Far Eastern Branch, Russian Academy of Sciences, 9 Piip Blvd., Petropavlovsk-Kamchatsky, 683006, Russia (URL: http://www.kscnet.ru/ivs/kvert/); MIROVA (Middle InfraRed Observation of Volcanic Activity), a collaborative project between the Universities of Turin and Florence (Italy) supported by the Centre for Volcanic Risk of the Italian Civil Protection Department (URL: http://www.mirovaweb.it/); Copernicus Browser, Copernicus Data Space Ecosystem, European Space Agency (URL: https://dataspace.copernicus.eu/browser/).
Home Reef
Tonga
18.992°S, 174.775°W; summit elev. -10 m
All times are local (unless otherwise noted)
Discolored plumes continued during November 2022-April 2023
Home Reef is a submarine volcano located in the central Tonga islands between Lateiki (Metis Shoal) and Late Island. The first recorded eruption occurred in the mid-19th century, when an ephemeral island formed. An eruption in 1984 produced a 12-km-high eruption plume, a large volume of floating pumice, and an ephemeral island 500 x 1,500 m wide, with cliffs 30-50 m high that enclosed a water-filled crater. Another island-forming eruption in 2006 produced widespread pumice rafts that drifted as far as Australia; by 2008 the island had eroded below sea level. The previous eruption occurred during October 2022 and was characterized by a new island-forming eruption, lava effusion, ash plumes, discolored water, and gas-and-steam plumes (BGVN 47:11). This report covers discolored water plumes during November 2022 through April 2023 using satellite data.
Discolored plumes continued during the reporting period and were observed in true color satellite images on clear weather days. Satellite images show light green-yellow discolored water extending W on 8 and 28 November 2022 (figure 31), and SW on 18 November. Light green-yellow plumes extended W on 3 December, S on 13 December, SW on 18 December, and W and S on 23 December (figure 31). On 12 January 2023 discolored green-yellow plumes extended to the NE, E, SE, and N. The plume moved SE on 17 January and NW on 22 January. Faint discolored water in February was visible moving NE on 1 February. A discolored plume extended NW on 8 and 28 March and NW on 13 March (figure 31). During April, clear weather showed green-blue discolored plumes moving S on 2 April, W on 7 April, and NE and S on 12 April. A strong green-yellow discolored plume extended E and NE on 22 April for several kilometers (figure 31).
Geologic Background. Home Reef, a submarine volcano midway between Metis Shoal and Late Island in the central Tonga islands, was first reported active in the mid-19th century, when an ephemeral island formed. An eruption in 1984 produced a 12-km-high eruption plume, large amounts of floating pumice, and an ephemeral 500 x 1,500 m island, with cliffs 30-50 m high that enclosed a water-filled crater. In 2006 an island-forming eruption produced widespread dacitic pumice rafts that drifted as far as Australia. Another island was built during a September-October 2022 eruption.
Information Contacts: Copernicus Browser, Copernicus Data Space Ecosystem, European Space Agency (URL: https://dataspace.copernicus.eu/browser/).
Semisopochnoi (United States) — June 2023 Cite this Report
Semisopochnoi
United States
51.93°N, 179.58°E; summit elev. 1221 m
All times are local (unless otherwise noted)
Occasional explosions, ash deposits, and gas-and-steam plumes during December 2022-May 2023
Semisopochnoi is located in the western Aleutians, is 20-km-wide at sea level, and contains an 8-km-wide caldera. The three-peaked Mount Young (formerly Cerberus) was constructed within the caldera during the Holocene. Each of these peaks contains a summit crater; the lava flows on the N flank appear younger than those on the S side. The current eruption period began in early February 2021 and has more recently consisted of intermittent explosions and ash emissions (BGVN 47:12). This report updates activity during December 2022 through May 2023 using daily, weekly, and special reports from the Alaska Volcano Observatory (AVO). AVO monitors the volcano using local seismic and infrasound sensors, satellite data, web cameras, and remote infrasound and lightning networks.
Activity during most of December 2022 was relatively quiet; according to AVO no eruptive or explosive activity was observed since 7 November 2022. Intermittent tremor and occasional small earthquakes were observed in geophysical data. Continuous gas-and-steam emissions were observed from the N crater of Mount Young in webcam images on clear weather days (figure 25). On 24 December, there was a slight increase in earthquake activity and several small possible explosion signals were detected in infrasound data. Eruptive activity resumed on 27 December at the N crater of Mount Young; AVO issued a Volcano Activity Notice (VAN) that reported minor ash deposits on the flanks of Mount Young that extended as far as 1 km from the vent, according to webcam images taken during 27-28 December (figure 26). No ash plumes were observed in webcam or satellite imagery, but a persistent gas-and-steam plume that might have contained some ash rose to 1.5 km altitude. As a result, AVO raised the Aviation Color Code (ACC) to Orange (the second highest level on a four-color scale) and the Volcano Alert Level (VAL) to Watch (the second highest level on a four-level scale). Possible explosions were detected during 21 December 2022 through 1 January 2023 and seismic tremor was recorded during 30-31 December.
During January 2023 eruptive activity continued at the active N crater of Mount Young. Minor ash deposits were observed on the flanks, extending about 2 km SSW, based on webcam images from 1 and 3 January. A possible explosion occurred during 1-2 January based on elevated seismicity recorded on local seismometers and an infrasound signal recorded minutes later by an array at Adak. Though no ash plumes were observed in webcam or satellite imagery, a persistent gas-and-steam plume rose to 1.5 km altitude that might have carried minor traces of ash. Ash deposits were accompanied by periods of elevated seismicity and infrasound signals from the local geophysical network, which AVO reported were likely due to weak explosive activity. Low-level explosive activity was also detected during 2-3 January, with minor gas-and-steam emissions and a new ash deposit that was visible in webcam images. Low-level explosive activity was detected in geophysical data during 4-5 January, with elevated seismicity and infrasound signals observed on local stations. Volcanic tremor was detected during 7-9 January and very weak explosive activity was detected in seismic and infrasound data on 9 January. Weak seismic and infrasound signals were recorded on 17 January, which indicated minor explosive activity, but no ash emissions were observed in clear webcam images; a gas-and-steam plume continued to rise to 1.5 km altitude. During 29-30 January, ash deposits near the summit were observed on fresh snow, according to webcam images.
The active N cone at Mount Young continued to produce a gas-and-steam plume during February, but no ash emissions or explosive events were detected. Seismicity remained elevated with faint tremor during early February. Gas-and-steam emissions from the N crater were observed in clear webcam images on 11-13 and 16 February; no explosive activity was detected in seismic, infrasound, or satellite data. Seismicity has also decreased, with no significant seismic tremor observed since 25 January. Therefore, the ACC was lowered to Yellow (the second lowest level on a four-color scale) and the VAL was lowered to Advisory (the second lowest level on a four-color scale) on 22 February.
Gas-and-steam emissions persisted during March from the N cone of Mount Young, based on clear webcam images. A few brief episodes of weak tremor were detected in seismic data, although seismicity decreased over the month. A gas-and-steam plume detected in satellite data extended 150 km on 18 March. Low-level ash emissions from the N cone at Mount Young were observed in several webcam images during 18-19 March, in addition to small explosions and volcanic tremor. The ACC was raised to Orange and the VAL increased to Watch on 19 March. A small explosion was detected in seismic and infrasound data on 21 March.
Low-level unrest continued during April, although cloudy weather often obscured views of the summit; periods of seismic tremor and local earthquakes were recorded. During 3-4 April a gas-and-steam plume was visible traveling more than 200 km overnight; no ash was evident in the plume, according to AVO. A gas-and-steam plume was observed during 4-6 April that extended 400 km but did not seem to contain ash. Small explosions were detected in seismic and infrasound data on 5 April. Occasional clear webcam images showed continuing gas-and-steam emissions rose from Mount Young, but no ash deposits were observed on the snow. On 19 April small explosions and tremor were detected in seismic and infrasound data. A period of seismic tremor was detected during 22-25 April, with possible weak explosions on 25 April. Ash deposits were visible near the crater rim, but it was unclear if these deposits were recent or due to older deposits.
Occasional small earthquakes were recorded during May, but there were no signs of explosive activity seen in geophysical data. Gas-and-steam emissions continued from the N crater of Mount Young, based on webcam images, and seismicity remained slightly elevated. A new, light ash deposit was visible during the morning of 5 May on fresh snow on the NW flank of Mount Young. During 10 May periods of volcanic tremor were observed. The ACC was lowered to Yellow and the VAL to Advisory on 17 May due to no additional evidence of activity.
Geologic Background. Semisopochnoi, the largest subaerial volcano of the western Aleutians, is 20 km wide at sea level and contains an 8-km-wide caldera. It formed as a result of collapse of a low-angle, dominantly basaltic volcano following the eruption of a large volume of dacitic pumice. The high point of the island is Anvil Peak, a double-peaked late-Pleistocene cone that forms much of the island's northern part. The three-peaked Mount Cerberus (renamed Mount Young in 2023) was constructed within the caldera during the Holocene. Each of the peaks contains a summit crater; lava flows on the N flank appear younger than those on the south side. Other post-caldera volcanoes include the symmetrical Sugarloaf Peak SSE of the caldera and Lakeshore Cone, a small cinder cone at the edge of Fenner Lake in the NE part of the caldera. Most documented eruptions have originated from Young, although Coats (1950) considered that both Sugarloaf and Lakeshore Cone could have been recently active.
Information Contacts: Alaska Volcano Observatory (AVO), a cooperative program of a) U.S. Geological Survey, 4200 University Drive, Anchorage, AK 99508-4667 USA (URL: https://avo.alaska.edu/), b) Geophysical Institute, University of Alaska, PO Box 757320, Fairbanks, AK 99775-7320, USA, and c) Alaska Division of Geological & Geophysical Surveys, 794 University Ave., Suite 200, Fairbanks, AK 99709, USA (URL: http://dggs.alaska.gov/).
Ambae
Vanuatu
15.389°S, 167.835°E; summit elev. 1496 m
All times are local (unless otherwise noted)
New lava flow, ash plumes, and sulfur dioxide plumes during February-May 2023
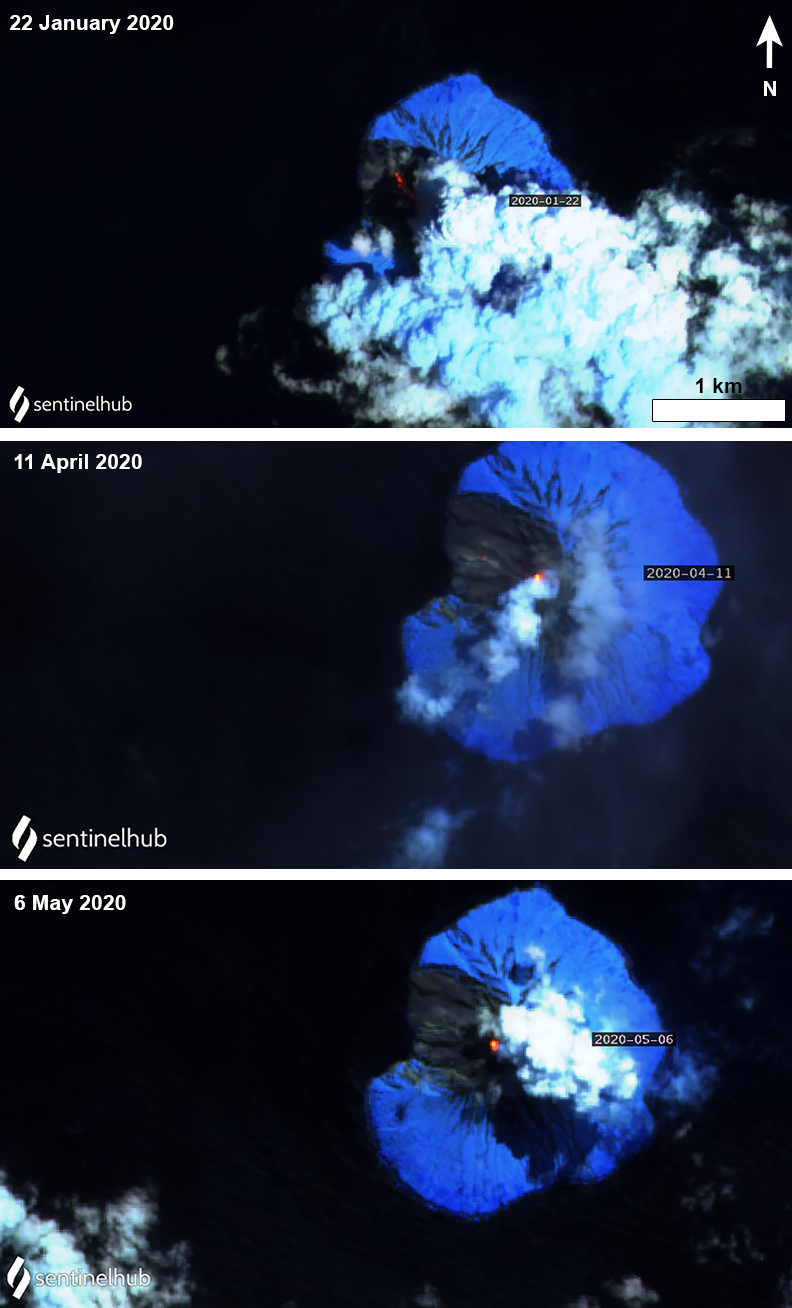
Ambae, also known as Aoba, is a large basaltic shield volcano in Vanuatu. A broad pyroclastic cone containing three crater lakes (Manaro Ngoru, Voui, and Manaro Lakua) is located at the summit within the youngest of at least two nested calderas. Periodic phreatic and pyroclastic explosions have been reported since the 16th century. A large eruption more than 400 years ago resulted in a volcanic cone within the summit crater that is now filled by Lake Voui; the similarly sized Lake Manaro fills the western third of the caldera. The previous eruption ended in August 2022 that was characterized by gas-and-steam and ash emissions and explosions of wet tephra (BGVN 47:10). This report covers a new eruption during February through May 2023 that consisted of a new lava flow, ash plumes, and sulfur dioxide emissions, using information from the Vanuatu Meteorology and Geo-Hazards Department (VMGD) and satellite data.
During the reporting period, the Alert Level remained at a 2 (on a scale of 0-5), which has been in place since December 2021. Activity during October 2022 through March 2023 remained relatively low and mostly consisted of gas-and-steam emissions in Lake Voui. VMGD reported that at 1300 on 15 November a satellite image captured a strong amount of sulfur dioxide rising above the volcano (figure 99), and that seismicity slightly increased. The southern and northern part of the island reported a strong sulfur dioxide smell and heard explosions. On 20 February 2023 a gas-and-ash plume rose 1.3 km above the summit and drifted SSW, according to a webcam image (figure 100). Gas-and-steam and possibly ash emissions continued on 23 February and volcanic earthquakes were recorded by the seismic network.
During April, volcanic earthquakes and gas-and-steam and ash emissions were reported from the cone in Lake Voui. VMGD reported that activity increased during 5-7 April; high gas-and-steam and ash plumes were visible, accompanied by nighttime incandescence. According to a Wellington VAAC report, a low-level ash plume rose as high as 2.5 km above the summit and drifted W and SW on 5 April, based on satellite imagery. Reports in Saratamata stated that a dark ash plume drifted to the WSW, but no loud explosion was heard. Webcam images from 2100 showed incandescence above the crater and reflected in the clouds. According to an aerial survey, field observations, and satellite data, water was no longer present in the lake. A lava flow was reported effusing from the vent and traveling N into the dry Lake Voui, which lasted three days. The next morning at 0745 on 6 April a gas-and-steam and ash plume rose 5.4 km above the summit and drifted ESE, based on information from VMGD (figure 101). The Wellington VAAC also reported that light ashfall was observed on the island. Intermittent gas-and-steam and ash emissions were visible on 7 April, some of which rose to an estimated 3 km above the summit and drifted E. Webcam images during 0107-0730 on 7 April showed continuing ash emissions. A gas-and-steam and ash plume rose 695 m above the summit crater at 0730 on 19 April and drifted ESE, based on a webcam image (figure 102).
According to visual and infrared satellite data, water was visible in Lake Voui as late as 24 March 2023 (figure 103). The vent in the caldera showed a gas-and-steam plume drifted SE. On 3 April thermal activity was first detected, accompanied by a gas-and-ash plume that drifted W (figure 103). The lava flow moved N within the dry lake and was shown cooling by 8 April. By 23 April much of the water in the lake had returned. Occasional sulfur dioxide plumes were detected by the TROPOMI instrument on the Sentinel-5P satellite that exceeded 2 Dobson Units (DU) and drifted in different directions (figure 104).
Geologic Background. The island of Ambae, also known as Aoba, is a massive 2,500 km3 basaltic shield that is the most voluminous volcano of the New Hebrides archipelago. A pronounced NE-SW-trending rift zone with numerous scoria cones gives the 16 x 38 km island an elongated form. A broad pyroclastic cone containing three crater lakes (Manaro Ngoru, Voui, and Manaro Lakua) is located at the summit within the youngest of at least two nested calderas, the largest of which is 6 km in diameter. That large central edifice is also called Manaro Voui or Lombenben volcano. Post-caldera explosive eruptions formed the summit craters about 360 years ago. A tuff cone was constructed within Lake Voui (or Vui) about 60 years later. The latest known flank eruption, about 300 years ago, destroyed the population of the Nduindui area near the western coast.
Information Contacts: Geo-Hazards Division, Vanuatu Meteorology and Geo-Hazards Department (VMGD), Ministry of Climate Change Adaptation, Meteorology, Geo-Hazards, Energy, Environment and Disaster Management, Private Mail Bag 9054, Lini Highway, Port Vila, Vanuatu (URL: http://www.vmgd.gov.vu/, https://www.facebook.com/VanuatuGeohazardsObservatory/); Wellington Volcanic Ash Advisory Centre (VAAC), Meteorological Service of New Zealand Ltd (MetService), PO Box 722, Wellington, New Zealand (URL: http://www.metservice.com/vaac/, http://www.ssd.noaa.gov/VAAC/OTH/NZ/messages.html); MIROVA (Middle InfraRed Observation of Volcanic Activity), a collaborative project between the Universities of Turin and Florence (Italy) supported by the Centre for Volcanic Risk of the Italian Civil Protection Department (URL: http://www.mirovaweb.it/); Global Sulfur Dioxide Monitoring Page, Atmospheric Chemistry and Dynamics Laboratory, NASA Goddard Space Flight Center (NASA/GSFC), 8800 Greenbelt Road, Goddard, Maryland, USA (URL: https://so2.gsfc.nasa.gov/); Copernicus Browser, Copernicus Data Space Ecosystem, European Space Agency (URL: https://dataspace.copernicus.eu/browser/).
Ibu
Indonesia
1.488°N, 127.63°E; summit elev. 1325 m
All times are local (unless otherwise noted)
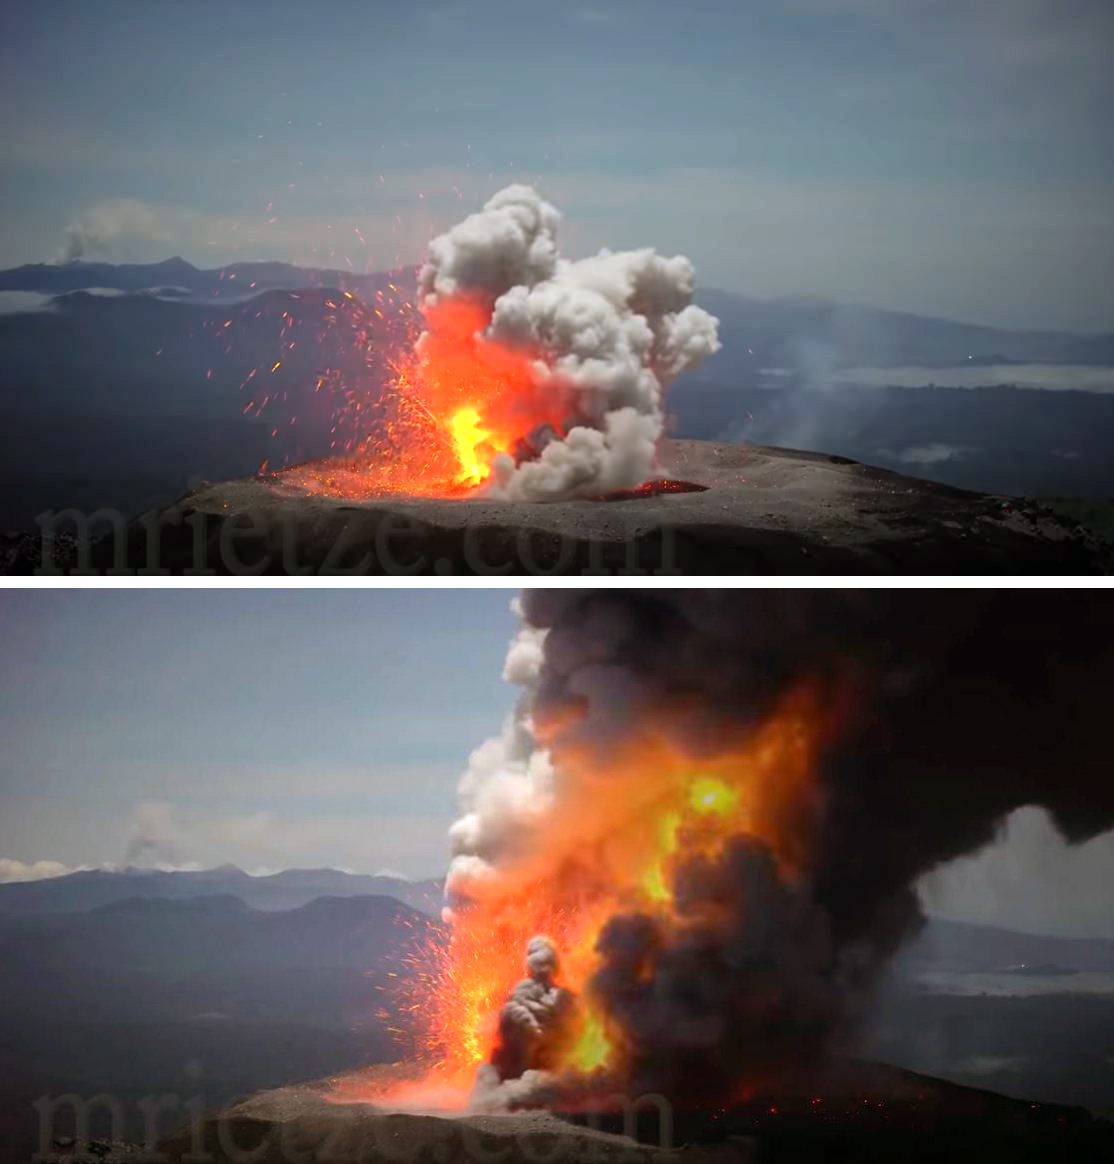
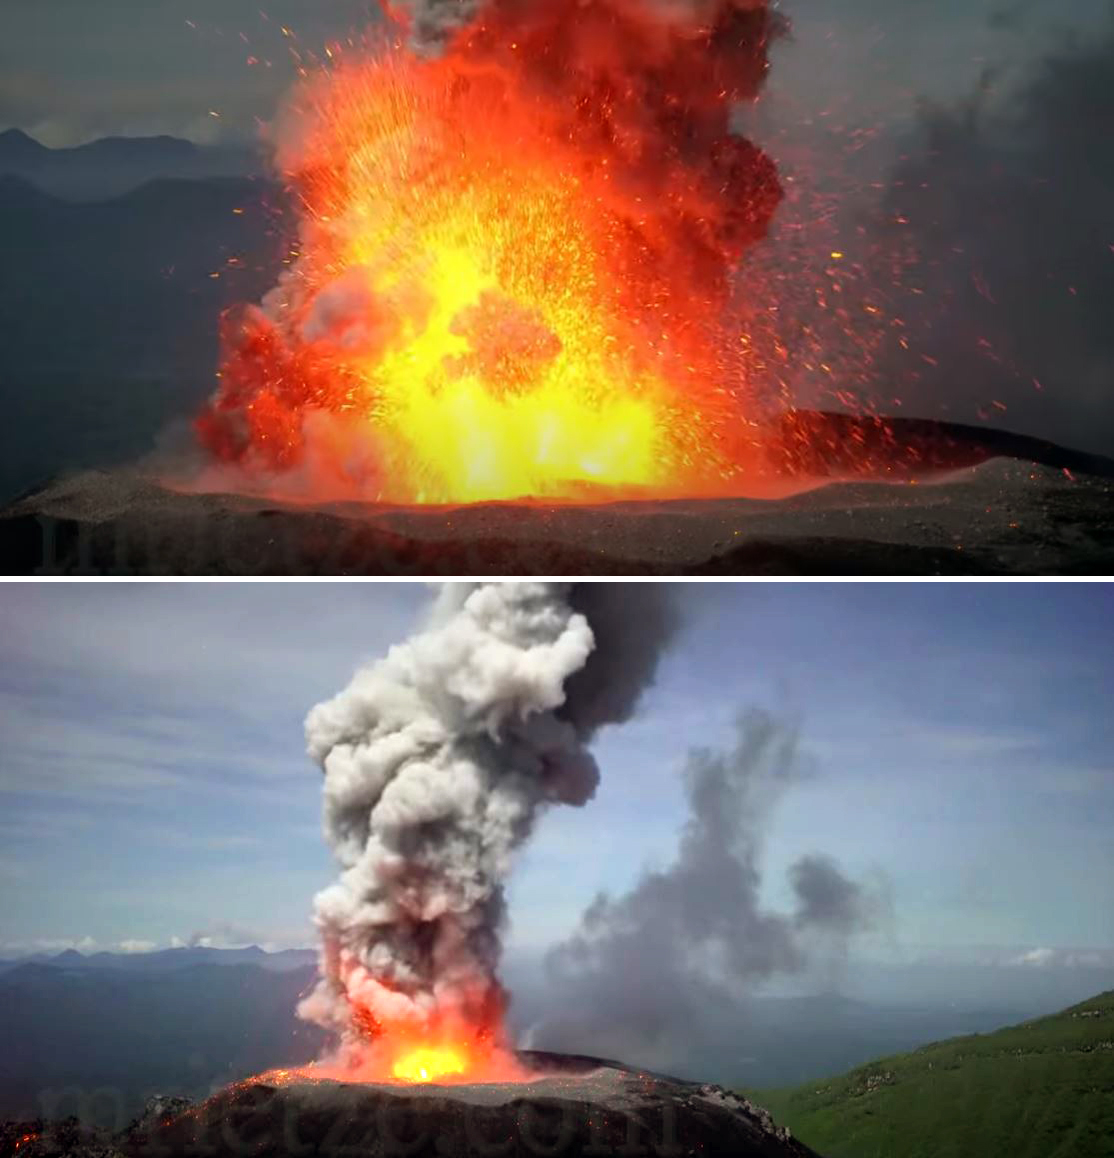
Daily ash explosions continue, along with thermal anomalies in the crater, October 2022-May 2023
Persistent eruptive activity since April 2008 at Ibu, a stratovolcano on Indonesian’s Halmahera Island, has consisted of daily explosive ash emissions and plumes, along with observations of thermal anomalies (BGVN 47:04). The current eruption continued during October 2022-May 2023, described below, based on advisories issued by the Pusat Vulkanologi dan Mitigasi Bencana Geologi (PVMBG, also known as Indonesian Center for Volcanology and Geological Hazard Mitigation, CVGHM), daily reports by MAGMA Indonesia (a PVMBG platform), and the Darwin Volcanic Ash Advisory Centre (VAAC), and various satellite data. The Alert Level during the reporting period remained at 2 (on a scale of 1-4), except raised briefly to 3 on 27 May, and the public was warned to stay at least 2 km away from the active crater and 3.5 km away on the N side of the volcano.
According to MAGMA Indonesia, during October 2022-May 2023, daily gray-and-white ash plumes of variable densities rose 200-1,000 m above the summit and drifted in multiple directions. On 30 October and 11 November, plumes rose a maximum of 2 km and 1.5 km above the summit, respectively (figures 42 and 43). According to the Darwin VAAC, discrete ash emissions on 13 November rose to 2.1 km altitude, or 800 m above the summit, and drifted W, and multiple ash emissions on 15 November rose 1.4 km above the summit and drifted NE. Occasional larger ash explosions through May 2023 prompted PVMBG to issue Volcano Observatory Notice for Aviation (VONA) alerts (table 6); the Aviation Color Code remained at Orange throughout this period.
Table 6. Volcano Observatory Notice for Aviation (VONA) ash plume alerts for Ibu issued by PVMBG during October 2022-May 2023. Maximum height above the summit was estimated by a ground observer. VONAs in January-May 2023 all described the ash plumes as dense.
| Date |
Time (local) |
Max height above summit |
Direction |
| 17 Oct 2022 |
0858 |
800 m |
SW |
| 18 Oct 2022 |
1425 |
800 m |
S |
| 19 Oct 2022 |
2017 |
600 m |
SW |
| 21 Oct 2022 |
0916 |
800 m |
NW |
| 16 Jan 2023 |
1959 |
600 m |
NE |
| 22 Jan 2023 |
0942 |
1,000 m |
E |
| 29 Jan 2023 |
2138 |
1,000 m |
E |
| 10 May 2023 |
0940 |
800 m |
NW |
| 10 May 2023 |
2035 |
600 m |
E |
| 21 May 2023 |
2021 |
600 m |
W |
| 21 May 2023 |
2140 |
1,000 m |
W |
| 29 May 2023 |
1342 |
800 m |
N |
| 31 May 2023 |
1011 |
1,000 m |
SW |
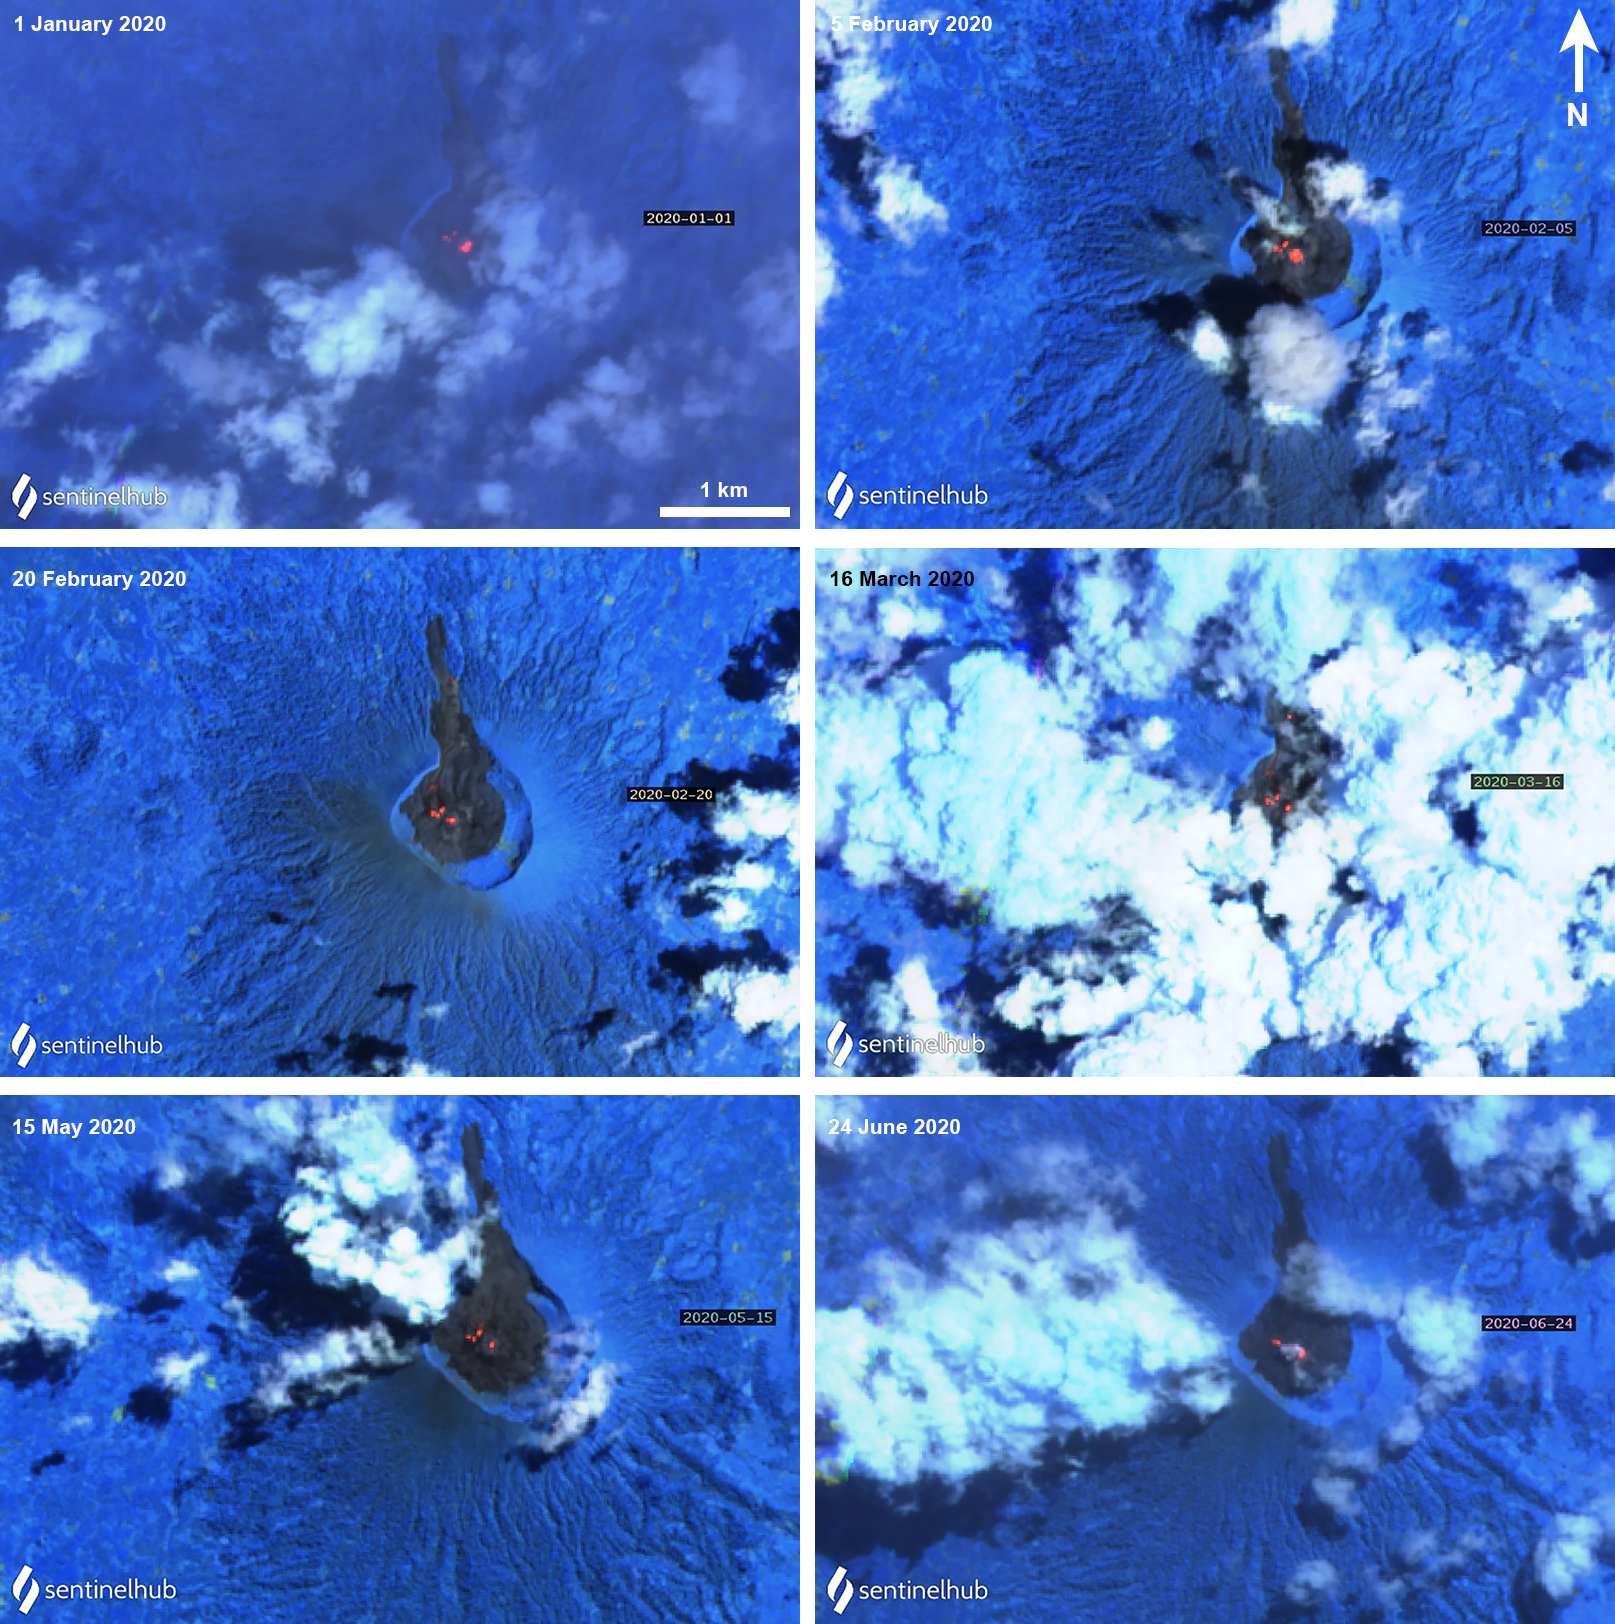
Sentinel-2 L1C satellite images throughout the reporting period show two, sometimes three persistent thermal anomalies in the summit crater, with the most prominent hotspot from the top of a cone within the crater. Clear views were more common during March-April 2023, when a vent and lava flows on the NE flank of the intra-crater cone could be distinguished (figure 44). White-to-grayish emissions were also observed during brief periods when weather clouds allowed clear views.
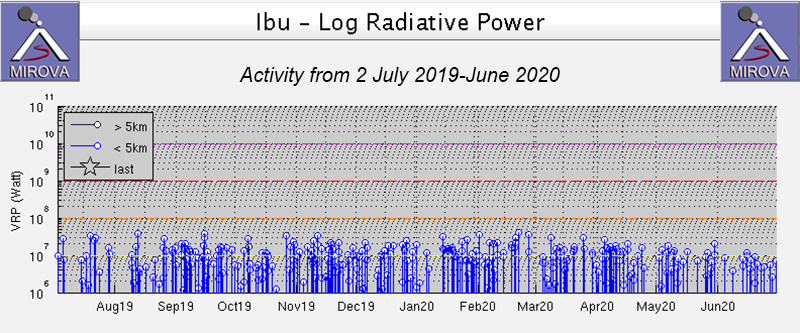
The MIROVA space-based volcano hotspot detection system recorded almost daily thermal anomalies throughout the reporting period, though cloud cover often interfered with detections. Data from imaging spectroradiometers aboard NASA’s Aqua and Terra satellites and processed using the MODVOLC algorithm (MODIS-MODVOLC) recorded hotspots on one day during October 2022 and December 2022, two days in April 2023, three days in November 2022 and May 2023, and four days in March 2023.
Geologic Background. The truncated summit of Gunung Ibu stratovolcano along the NW coast of Halmahera Island has large nested summit craters. The inner crater, 1 km wide and 400 m deep, has contained several small crater lakes. The 1.2-km-wide outer crater is breached on the N, creating a steep-walled valley. A large cone grew ENE of the summit, and a smaller one to the WSW has fed a lava flow down the W flank. A group of maars is located below the N and W flanks. The first observed and recorded eruption was a small explosion from the summit crater in 1911. Eruptive activity began again in December 1998, producing a lava dome that eventually covered much of the floor of the inner summit crater along with ongoing explosive ash emissions.
Information Contacts: Pusat Vulkanologi dan Mitigasi Bencana Geologi (PVMBG, also known as Indonesian Center for Volcanology and Geological Hazard Mitigation, CVGHM), Jalan Diponegoro 57, Bandung 40122, Indonesia (URL: http://www.vsi.esdm.go.id/); MAGMA Indonesia (Multiplatform Application for Geohazard Mitigation and Assessment in Indonesia), Kementerian Energi dan Sumber Daya Mineral (URL: https://magma.esdm.go.id/v1); Copernicus Browser, Copernicus Data Space Ecosystem, European Space Agency (URL: https://dataspace.copernicus.eu/browser/); MIROVA (Middle InfraRed Observation of Volcanic Activity), a collaborative project between the Universities of Turin and Florence (Italy) supported by the Centre for Volcanic Risk of the Italian Civil Protection Department (URL: http://www.mirovaweb.it/); Hawai'i Institute of Geophysics and Planetology (HIGP) - MODVOLC Thermal Alerts System, School of Ocean and Earth Science and Technology (SOEST), Univ. of Hawai'i, 2525 Correa Road, Honolulu, HI 96822, USA (URL: http://modis.higp.hawaii.edu/).
Dukono
Indonesia
1.6992°N, 127.8783°E; summit elev. 1273 m
All times are local (unless otherwise noted)
Continuing ash emissions, SO2 plumes, and thermal signals during October 2022-May 2023
Dukono, a remote volcano on Indonesia’s Halmahera Island, has been erupting continuously since 1933, with frequent ash explosions and sulfur dioxide plumes (BGVN 46:11, 47:10). This activity continued during October 2022 through May 2023, based on reports from the Pusat Vulkanologi dan Mitigasi Bencana Geologi (PVMBG; also known as Indonesian Center for Volcanology and Geological Hazard Mitigation, CVGHM), the Darwin Volcanic Ash Advisory Centre (VAAC), and satellite data. During this period, the Alert Level remained at 2 (on a scale of 1-4) and the public was warned to remain outside of the 2-km exclusion zone. The highest reported plume of the period reached 9.4 km above the summit on 14 November 2022.
According to MAGMA Indonesia (a platform developed by PVMBG), white, gray, or dark plumes of variable densities were observed almost every day during the reporting period, except when fog obscured the volcano (figure 33). Plumes generally rose 25-450 m above the summit, but rose as high as 700-800 m on several days, somewhat lower than the maximum heights reached earlier in 2022 when plumes reached as high as 1 km. However, the Darwin VAAC reported that on 14 November 2022, a discrete ash plume rose 9.4 km above the summit (10.7 km altitude), accompanied by a strong hotspot and a sulfur dioxide signal observed in satellite imagery; a continuous ash plume that day and through the 15th rose to 2.1-2.4 km altitude and drifted NE.
Sentinel-2 images were obscured by weather clouds almost every viewing day during the reporting period. However, the few reasonably clear images showed a hotspot and white or gray emissions and plumes. Strong SO2 plumes from Dukono were present on many days during October 2022-May 2023, as detected using the TROPOMI instrument on the Sentinel-5P satellite (figure 34).
Geologic Background. Reports from this remote volcano in northernmost Halmahera are rare, but Dukono has been one of Indonesia's most active volcanoes. More-or-less continuous explosive eruptions, sometimes accompanied by lava flows, have occurred since 1933. During a major eruption in 1550 CE, a lava flow filled in the strait between Halmahera and the N-flank Gunung Mamuya cone. This complex volcano presents a broad, low profile with multiple summit peaks and overlapping craters. Malupang Wariang, 1 km SW of the summit crater complex, contains a 700 x 570 m crater that has also been active during historical time.
Information Contacts: Pusat Vulkanologi dan Mitigasi Bencana Geologi (PVMBG, also known as Indonesian Center for Volcanology and Geological Hazard Mitigation, CVGHM), Jalan Diponegoro 57, Bandung 40122, Indonesia (URL: http://www.vsi.esdm.go.id/); MAGMA Indonesia (Multiplatform Application for Geohazard Mitigation and Assessment in Indonesia), Kementerian Energi dan Sumber Daya Mineral (URL: https://magma.esdm.go.id/v1); Darwin Volcanic Ash Advisory Centre (VAAC), Bureau of Meteorology, Northern Territory Regional Office, PO Box 40050, Casuarina, NT 0811, Australia (URL: http://www.bom.gov.au/info/vaac/); NASA Global Sulfur Dioxide Monitoring Page, Atmospheric Chemistry and Dynamics Laboratory, NASA Goddard Space Flight Center (NASA/GSFC), 8800 Greenbelt Road, Goddard, Maryland, USA (URL: https://so2.gsfc.nasa.gov/); Sentinel Hub Playground (URL: https://www.sentinel-hub.com/explore/sentinel-playground).
Sabancaya
Peru
15.787°S, 71.857°W; summit elev. 5960 m
All times are local (unless otherwise noted)
Explosions, gas-and-ash plumes, and thermal activity persist during November 2022-April 2023
Sabancaya is located in Peru, NE of Ampato and SE of Hualca Hualca. Eruptions date back to 1750 and have been characterized by explosions, phreatic activity, ash plumes, and ashfall. The current eruption period began in November 2016 and has more recently consisted of daily explosions, gas-and-ash plumes, and thermal activity (BGVN 47:11). This report updates activity during November 2022 through April 2023 using information from Instituto Geophysico del Peru (IGP) that use weekly activity reports and various satellite data.
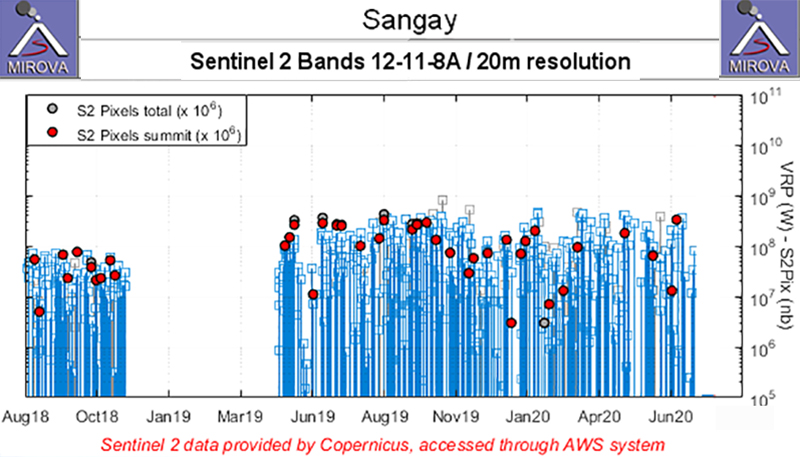
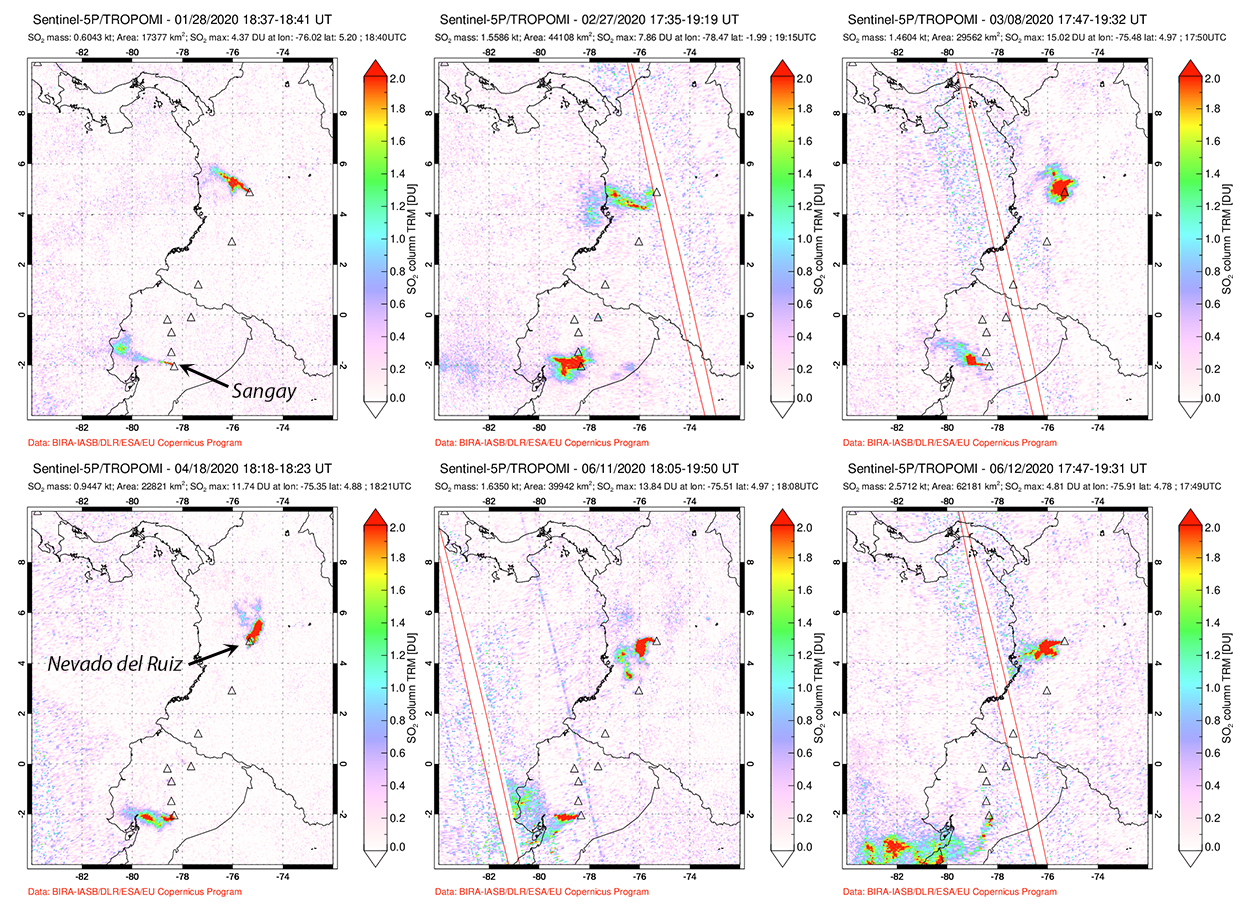
Intermittent low-to-moderate power thermal anomalies were reported by the MIROVA project during November 2022 through April 2023 (figure 119). There were few short gaps in thermal activity during mid-December 2022, late December-to-early January 2023, late January to mid-February, and late February. According to data recorded by the MODVOLC thermal algorithm, there were a total of eight thermal hotspots: three in November 2022, three in February 2023, one in March, and one in April. On clear weather days, some of this thermal anomaly was visible in infrared satellite imagery showing the active lava dome in the summit crater (figure 120). Almost daily moderate-to-strong sulfur dioxide plumes were recorded during the reporting period by the TROPOMI instrument on the Sentinel-5P satellite (figure 121). Many of these plumes exceeded 2 Dobson Units (DU) and drifted in multiple directions.
IGP reported that moderate activity during November and December 2022 continued; during November, an average number of explosions were reported each week: 30, 33, 36, and 35, and during December, it was 32, 40, 47, 52, and 67. Gas-and-ash plumes in November rose 3-3.5 km above the summit and drifted E, NE, SE, S, N, W, and SW. During December the gas-and-ash plumes rose 2-4 km above the summit and drifted in different directions. There were 1,259 volcanic earthquakes recorded during November and 1,693 during December. Seismicity also included volcano-tectonic-type events that indicate rock fracturing events. Slight inflation was observed in the N part of the volcano near Hualca Hualca (4 km N). Thermal activity was frequently reported in the crater at the active lava dome (figure 120).
Explosive activity continued during January and February 2023. The average number of explosions were reported each week during January (51, 50, 60, and 59) and February (43, 54, 51, and 50). Gas-and-ash plumes rose 1.6-2.9 km above the summit and drifted NW, SW, and W during January and rose 1.4-2.8 above the summit and drifted W, SW, E, SE, N, S, NW, and NE during February. IGP also detected 1,881 volcanic earthquakes during January and 1,661 during February. VT-type earthquakes were also reported. Minor inflation persisted near Hualca Hualca. Satellite imagery showed continuous thermal activity in the crater at the lava dome (figure 120).
During March, the average number of explosions each week was 46, 48, 31, 35, and 22 and during April, it was 29, 41, 31, and 27. Accompanying gas-and-ash plumes rose 1.7-2.6 km above the summit crater and drifted W, SW, NW, S, and SE during March. According to a Buenos Aires Volcano Ash Advisory Center (VAAC) notice, on 22 March at 1800 through 23 March an ash plume rose to 7 km altitude and drifted NW. By 0430 an ash plume rose to 7.6 km altitude and drifted W. On 24 and 26 March continuous ash emissions rose to 7.3 km altitude and drifted SW and on 28 March ash emissions rose to 7.6 km altitude. During April, gas-and-ash plumes rose 1.6-2.5 km above the summit and drifted W, SW, S, NW, NE, and E. Frequent volcanic earthquakes were recorded, with 1,828 in March and 1,077 in April, in addition to VT-type events. Thermal activity continued to be reported in the summit crater at the lava dome (figure 120).
Geologic Background. Sabancaya, located in the saddle NE of Ampato and SE of Hualca Hualca volcanoes, is the youngest of these volcanic centers and the only one to have erupted in historical time. The oldest of the three, Nevado Hualca Hualca, is of probable late-Pliocene to early Pleistocene age. The name Sabancaya (meaning "tongue of fire" in the Quechua language) first appeared in records in 1595 CE, suggesting activity prior to that date. Holocene activity has consisted of Plinian eruptions followed by emission of voluminous andesitic and dacitic lava flows, which form an extensive apron around the volcano on all sides but the south. Records of historical eruptions date back to 1750.
Information Contacts: Instituto Geofisico del Peru (IGP), Centro Vulcanológico Nacional (CENVUL), Calle Badajoz N° 169 Urb. Mayorazgo IV Etapa, Ate, Lima 15012, Perú (URL: https://www.igp.gob.pe/servicios/centro-vulcanologico-nacional/inicio); Buenos Aires Volcanic Ash Advisory Center (VAAC), Servicio Meteorológico Nacional-Fuerza Aérea Argentina, 25 de mayo 658, Buenos Aires, Argentina (URL: http://www.smn.gov.ar/vaac/buenosaires/inicio.php); MIROVA (Middle InfraRed Observation of Volcanic Activity), a collaborative project between the Universities of Turin and Florence (Italy) supported by the Centre for Volcanic Risk of the Italian Civil Protection Department (URL: http://www.mirovaweb.it/); Hawai'i Institute of Geophysics and Planetology (HIGP) - MODVOLC Thermal Alerts System, School of Ocean and Earth Science and Technology (SOEST), Univ. of Hawai'i, 2525 Correa Road, Honolulu, HI 96822, USA (URL: http://modis.higp.hawaii.edu/); NASA Global Sulfur Dioxide Monitoring Page, Atmospheric Chemistry and Dynamics Laboratory, NASA Goddard Space Flight Center (NASA/GSFC), 8800 Greenbelt Road, Goddard MD 20771, USA (URL: https://so2.gsfc.nasa.gov/); Copernicus Browser, Copernicus Data Space Ecosystem, European Space Agency (URL: https://dataspace.copernicus.eu/browser/).
Sheveluch
Russia
56.653°N, 161.36°E; summit elev. 3283 m
All times are local (unless otherwise noted)
Significant explosions destroyed part of the lava-dome complex during April 2023
Sheveluch (also spelled Shiveluch) in Kamchatka, has had at least 60 large eruptions during the last 10,000 years. The summit is truncated by a broad 9-km-wide caldera that is breached to the S, and many lava domes occur on the outer flanks. The lava dome complex was constructed within the large open caldera. Frequent collapses of the dome complex have produced debris avalanches; the resulting deposits cover much of the caldera floor. A major south-flank collapse during a 1964 Plinian explosion produced a scarp in which a “Young Sheveluch” dome began to form in 1980. Repeated episodes of dome formation and destruction since then have produced major and minor ash plumes, pyroclastic flows, block-and-ash flows, and “whaleback domes” of spine-like extrusions in 1993 and 2020 (BGVN 45:11). The current eruption period began in August 1999 and has more recently consisted of lava dome growth, explosions, ash plumes, and avalanches (BGVN 48:01). This report covers a significant explosive eruption during early-to-mid-April 2023 that generated a 20 km altitude ash plume, produced a strong sulfur dioxide plume, and destroyed part of the lava-dome complex; activity described during January through April 2023 use information primarily from the Kamchatka Volcanic Eruptions Response Team (KVERT) and various satellite data.
Satellite data. Activity during the majority of this reporting period was characterized by continued lava dome growth, strong fumarole activity, explosions, and hot avalanches. According to the MODVOLC Thermal Alerts System, 140 hotspots were detected through the reporting period, with 33 recorded in January 2023, 29 in February, 44 in March, and 34 in April. Frequent strong thermal activity was recorded during January 2023 through April, according to the MIROVA (Middle InfraRed Observation of Volcanic Activity) graph and resulted from the continuously growing lava dome (figure 94). A slightly stronger pulse in thermal activity was detected in early-to-mid-April, which represented the significant eruption that destroyed part of the lava-dome complex. Thermal anomalies were also visible in infrared satellite imagery at the summit crater (figure 95).
During January 2023 KVERT reported continued growth of the lava dome, accompanied by strong fumarolic activity, incandescence from the lava dome, explosions, ash plumes, and avalanches. Satellite data showed a daily thermal anomaly over the volcano. Video data showed ash plumes associated with collapses at the dome that generated avalanches that in turn produced ash plumes rising to 3.5 km altitude and drifting 40 km W on 4 January and rising to 7-7.5 km altitude and drifting 15 km SW on 5 January. A gas-and-steam plume containing some ash that was associated with avalanches rose to 5-6 km altitude and extended 52-92 km W on 7 January. Explosions that same day produced ash plumes that rose to 7-7.5 km altitude and drifted 10 km W. According to a Volcano Observatory Notice for Aviation (VONA) issued at 1344 on 19 January, explosions produced an ash cloud that was 15 x 25 km in size and rose to 9.6-10 km altitude, drifting 21-25 km W; as a result, the Aviation Color Code (ACC) was raised to Red (the highest level on a four-color scale). Another VONA issued at 1635 reported that no more ash plumes were observed, and the ACC was lowered to Orange (the second highest level on a four-color scale). On 22 January an ash plume from collapses and avalanches rose to 5 km altitude and drifted 25 km NE and SW; ash plumes associated with collapses extended 70 km NE on 27 and 31 January.
Lava dome growth, fumarolic activity, dome incandescence, and occasional explosions and avalanches continued during February and March. A daily thermal anomaly was visible in satellite data. Explosions on 1 February generated ash plumes that rose to 6.3-6.5 km altitude and extended 15 km NE. Video data showed an ash cloud from avalanches rising to 5.5 km altitude and drifting 5 km SE on 2 February. Satellite data showed gas-and-steam plumes containing some ash rose to 5-5.5 km altitude and drifted 68-110 km ENE and NE on 6 February, to 4.5-5 km altitude and drifted 35 km WNW on 22 February, and to 3.7-4 km altitude and drifted 47 km NE on 28 February. Scientists from the Kamchatka Volcanological Station (KVS) went on a field excursion on 25 February to document the growing lava dome, and although it was cloudy most of the day, nighttime incandescence was visible. Satellite data showed an ash plume extending up to 118 km E during 4-5 March. Video data from 1150 showed an ash cloud from avalanches rose to 3.7-5.5 km altitude and drifted 5-10 km ENE and E on 5 March. On 11 March an ash plume drifted 62 km E. On 27 March ash plumes rose to 3.5 km altitude and drifted 100 km E. Avalanches and constant incandescence at the lava dome was focused on the E and NE slopes on 28 March. A gas-and-steam plume containing some ash rose to 3.5 km altitude and moved 40 km E on 29 March. Ash plumes on 30 March rose to 3.5-3.7 km altitude and drifted 70 km NE.
Similar activity continued during April, with lava dome growth, strong fumarolic activity, incandescence in the dome, occasional explosions, and avalanches. A thermal anomaly persisted throughout the month. During 1-4 April weak ash plumes rose to 2.5-3 km altitude and extended 13-65 km SE and E.
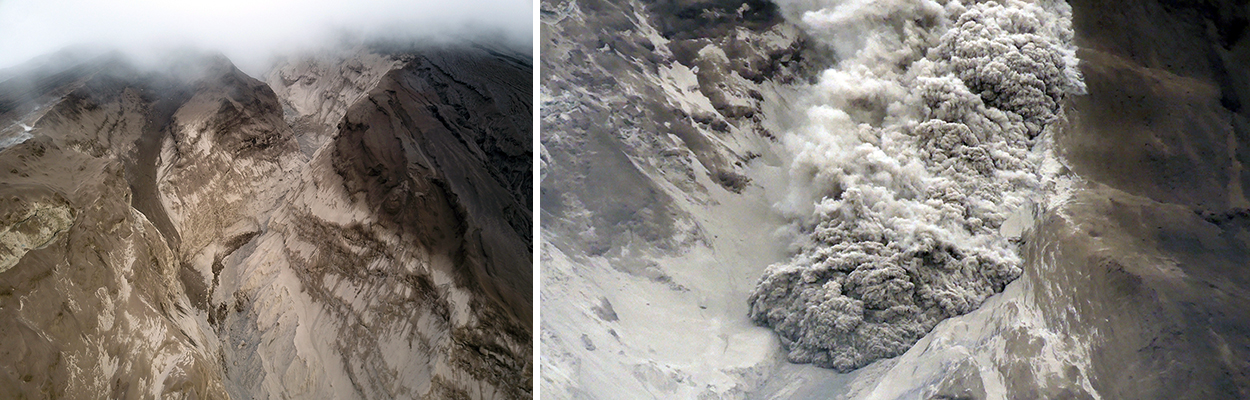
Activity during 11 April 2023. The Institute of Volcanology and Seismology, Far Eastern Branch, Russian Academy of Sciences (IVS FEB RAS) reported a significant increase in seismicity around 0054 on 11 April, as reported by strong explosions detected on 11 April beginning at 0110 that sent ash plumes up to 7-10 km altitude and extended 100-435 km W, WNW, NNW, WSW, and SW. According to a Tokyo VAAC report the ash plume rose to 15.8 km altitude. By 0158 the plume extended over a 75 x 100 km area. According to an IVS FEB RAS report, the eruptive column was not vertical: the initial plume at 0120 on 11 April deviated to the NNE, at 0000 on 12 April, it drifted NW, and by 1900 it drifted SW. KVS reported that significant pulses of activity occurred at around 0200, 0320, and then a stronger phase around 0600. Levin Dmitry took a video from near Békés (3 km away) at around 0600 showing a rising plume; he also reported that a pyroclastic flow traveled across the road behind him as he left the area. According to IVS FEB RAS, the pyroclastic flow traveled several kilometers SSE, stopping a few hundred meters from a bridge on the road between Klyuchi and Petropavlovsk-Kamchatsky.
Ashfall was first observed in Klyuchi (45 km SW) at 0630, and a large, black ash plume blocked light by 0700. At 0729 KVERT issued a Volcano Observatory Notice for Aviation (VONA) raising the Aviation Color Code to Red (the highest level on a four-color scale). It also stated that a large ash plume had risen to 10 km altitude and drifted 100 km W. Near-constant lightning strikes were reported in the plume and sounds like thunderclaps were heard until about 1000. According to IVS FEB RAS the cloud was 200 km long and 76 km wide by 0830, and was spreading W at altitudes of 6-12 km. In the Klyuchi Village, the layer of both ash and snow reached 8.5 cm (figure 96); ashfall was also reported in Kozyrevsk (112 km SW) at 0930, Mayskoye, Anavgay, Atlasovo, Lazo, and Esso. Residents in Klyuchi reported continued darkness and ashfall at 1100. In some areas, ashfall was 6 cm deep and some residents reported dirty water coming from their plumbing. According to IVS FEB RAS, an ash cloud at 1150 rose to 5-20 km altitude and was 400 km long and 250 km wide, extending W. A VONA issued at 1155 reported that ash had risen to 10 km and drifted 340 km NNW and 240 km WSW. According to Simon Carn (Michigan Technological University), about 0.2 Tg of sulfur dioxide in the plume was measured in a satellite image from the TROPOMI instrument on the Sentinel-5P satellite acquired at 1343 that covered an area of about 189,000 km2 (figure 97). Satellite data at 1748 showed an ash plume that rose to 8 km altitude and drifted 430 km WSW and S, according to a VONA.
Activity during 12-15 April 2023. On 12 April at 0730 satellite images showed ash plumes rose to 7-8 km altitude and extended 600 km SW, 1,050 km ESE, and 1,300-3,000 km E. By 1710 that day, the explosions weakened. According to news sources, the ash-and-gas plumes drifted E toward the Aleutian Islands and reached the Gulf of Alaska by 13 April, causing flight disruptions. More than 100 flights involving Alaska airspace were cancelled due to the plume. Satellite data showed ash plumes rising to 4-5.5 km altitude and drifted 400-415 km SE and ESE on 13 April. KVS volcanologists observed the pyroclastic flow deposits and noted that steam rose from downed, smoldering trees. They also noted that the deposits were thin with very few large fragments, which differed from previous flows. The ash clouds traveled across the Pacific Ocean. Flight cancellations were also reported in NW Canada (British Columbia) during 13-14 April. During 14-15 April ash plumes rose to 6 km altitude and drifted 700 km NW.
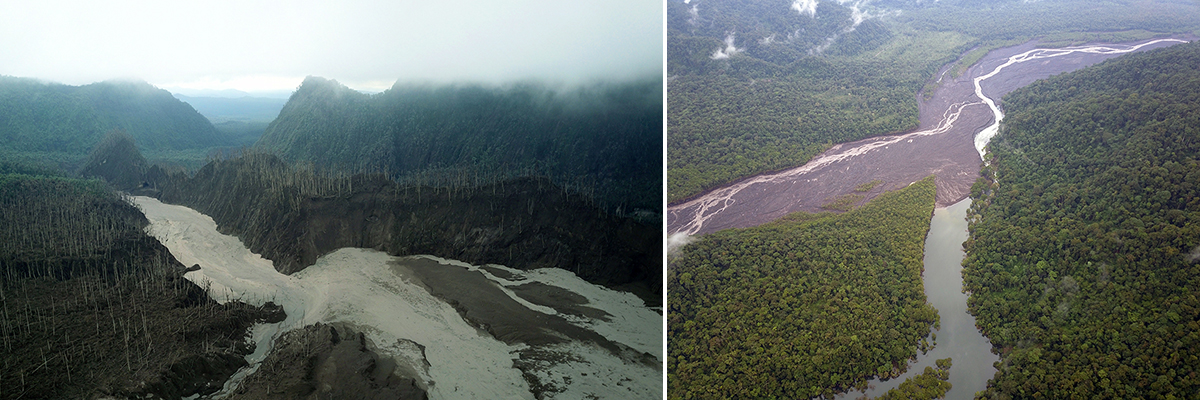
Alaskan flight schedules were mostly back to normal by 15 April, with only minor delays and far less cancellations; a few cancellations continued to be reported in Canada. Clear weather on 15 April showed that most of the previous lava-dome complex was gone and a new crater roughly 1 km in diameter was observed (figure 98); gas-and-steam emissions were rising from this crater. Evidence suggested that there had been a directed blast to the SE, and pyroclastic flows traveled more than 20 km. An ash plume rose to 4.5-5.2 km altitude and drifted 93-870 km NW on 15 April.
Activity during 16-30 April 2023. Resuspended ash was lifted by the wind from the slopes and rose to 4 km altitude and drifted 224 km NW on 17 April. KVERT reported a plume of resuspended ash from the activity during 10-13 April on 19 April that rose to 3.5-4 km altitude and drifted 146-204 km WNW. During 21-22 April a plume stretched over the Scandinavian Peninsula. A gas-and-steam plume containing some ash rose to 3-3.5 km altitude and drifted 60 km SE on 30 April. A possible new lava dome was visible on the W slope of the volcano on 29-30 April (figure 99); satellite data showed two thermal anomalies, a bright one over the existing lava dome and a weaker one over the possible new one.
References. Girina, O., Loupian, E., Horvath, A., Melnikov, D., Manevich, A., Nuzhdaev, A., Bril, A., Ozerov, A., Kramareva, L., Sorokin, A., 2023, Analysis of the development of the paroxysmal eruption of Sheveluch volcano on April 10–13, 2023, based on data from various satellite systems, ??????????? ???????? ??? ?? ???????, 20(2).
Geologic Background. The high, isolated massif of Sheveluch volcano (also spelled Shiveluch) rises above the lowlands NNE of the Kliuchevskaya volcano group. The 1,300 km3 andesitic volcano is one of Kamchatka's largest and most active volcanic structures, with at least 60 large eruptions during the Holocene. The summit of roughly 65,000-year-old Stary Shiveluch is truncated by a broad 9-km-wide late-Pleistocene caldera breached to the south. Many lava domes occur on its outer flanks. The Molodoy Shiveluch lava dome complex was constructed during the Holocene within the large open caldera; Holocene lava dome extrusion also took place on the flanks of Stary Shiveluch. Widespread tephra layers from these eruptions have provided valuable time markers for dating volcanic events in Kamchatka. Frequent collapses of dome complexes, most recently in 1964, have produced debris avalanches whose deposits cover much of the floor of the breached caldera.
Information Contacts: Kamchatka Volcanic Eruptions Response Team (KVERT), Far Eastern Branch, Russian Academy of Sciences, 9 Piip Blvd., Petropavlovsk-Kamchatsky, 683006, Russia (URL: http://www.kscnet.ru/ivs/kvert/); Institute of Volcanology and Seismology, Far Eastern Branch, Russian Academy of Sciences (IVS FEB RAS), 9 Piip Blvd., Petropavlovsk-Kamchatsky 683006, Russia (URL: http://www.kscnet.ru/ivs/eng/); Kamchatka Volcanological Station, Kamchatka Branch of Geophysical Survey, (KB GS RAS), Klyuchi, Kamchatka Krai, Russia (URL: http://volkstat.ru/); Hawai'i Institute of Geophysics and Planetology (HIGP) - MODVOLC Thermal Alerts System, School of Ocean and Earth Science and Technology (SOEST), Univ. of Hawai'i, 2525 Correa Road, Honolulu, HI 96822, USA (URL: http://modis.higp.hawaii.edu/); MIROVA (Middle InfraRed Observation of Volcanic Activity), a collaborative project between the Universities of Turin and Florence (Italy) supported by the Centre for Volcanic Risk of the Italian Civil Protection Department (URL: http://www.mirovaweb.it/); Copernicus Browser, Copernicus Data Space Ecosystem, European Space Agency (URL: https://dataspace.copernicus.eu/browser/); Kam 24 News Agency, 683032, Kamchatka Territory, Petropavlovsk-Kamchatsky, Vysotnaya St., 2A (URL: https://kam24.ru/news/main/20230411/96657.html#.Cj5Jrky6.dpuf); Simon Carn, Geological and Mining Engineering and Sciences, Michigan Technological University, 1400 Townsend Drive, Houghton, MI 49931, USA (URL: http://www.volcarno.com/, Twitter: @simoncarn).
Bezymianny
Russia
55.972°N, 160.595°E; summit elev. 2882 m
All times are local (unless otherwise noted)
Explosions, ash plumes, lava flows, and avalanches during November 2022-April 2023
Bezymianny is located on the Kamchatka Peninsula of Russia as part of the Klyuchevskoy volcano group. Historic eruptions began in 1955 and have been characterized by dome growth, explosions, pyroclastic flows, ash plumes, and ashfall. During the 1955-56 eruption a large open crater was formed by collapse of the summit and an associated lateral blast. Subsequent episodic but ongoing lava-dome growth, accompanied by intermittent explosive activity and pyroclastic flows, has largely filled the 1956 crater. The current eruption period began in December 2016 and more recent activity has consisted of strong explosions, ash plumes, and thermal activity (BGVN 47:11). This report covers activity during November 2022 through April 2023, based on weekly and daily reports from the Kamchatka Volcano Eruptions Response Team (KVERT) and satellite data.
Activity during November and March 2023 was relatively low and mostly consisted of gas-and-steam emissions, occasional small collapses that generated avalanches along the lava dome slopes, and a persistent thermal anomaly over the volcano that was observed in satellite data on clear weather days. According to the Tokyo VAAC and KVERT, an explosion produced an ash plume that rose to 6 km altitude and drifted 25 km NE at 1825 on 29 March.
Gas-and-steam emissions, collapses generating avalanches, and thermal activity continued during April. According to two Volcano Observatory Notice for Aviation (VONA) issued on 2 and 6 April (local time) ash plumes rose to 3 km and 3.5-3.8 km altitude and drifted 35 km E and 140 km E, respectively. Satellite data from KVERT showed weak ash plumes extending up to 550 km E on 2 and 5-6 April.
A VONA issued at 0843 on 7 April described an ash plume that rose to 4.5-5 km altitude and drifted 250 km ESE. Later that day at 1326 satellite data showed an ash plume that rose to 5.5-6 km altitude and drifted 150 km ESE. A satellite image from 1600 showed an ash plume extending as far as 230 km ESE; KVERT noted that ash emissions were intensifying, likely due to avalanches from the growing lava dome. The Aviation Color Code (ACC) was raised to Red (the highest level on a four-color scale). At 1520 satellite data showed an ash plume rising to 5-5.5 km altitude and drifting 230 km ESE. That same day, Kamchatka Volcanological Station (KVS) volcanologists traveled to Ambon to collect ash; they reported that a notable eruption began at 1730, and within 20 minutes a large ash plume rose to 10 km altitude and drifted NW. KVERT reported that the strong explosive phase began at 1738. Video and satellite data taken at 1738 showed an ash plume that rose to 10-12 km altitude and drifted up to 2,800 km SE and E. Explosions were clearly audible 20 km away for 90 minutes, according to KVS. Significant amounts of ash fell at the Apakhonchich station, which turned the snow gray; ash continued to fall until the morning of 8 April. In a VONA issued at 0906 on 8 April, KVERT stated that the explosive eruption had ended; ash plumes had drifted 2,000 km E. The ACC was lowered to Orange (the third highest level on a four-color scale). The KVS team saw a lava flow on the active dome once the conditions were clear that same day (figure 53). On 20 April lava dome extrusion was reported; lava flows were noted on the flanks of the dome, and according to KVERT satellite data, a thermal anomaly was observed in the area. The ACC was lowered to Yellow (the second lowest on a four-color scale).
Satellite data showed an increase in thermal activity beginning in early April 2023. A total of 31 thermal hotspots were detected by the MODVOLC thermal algorithm on 4, 5, 7, and 12 April 2023. The elevated thermal activity resulted from an increase in explosive activity and the start of an active lava flow. The MIROVA (Middle InfraRed Observation of Volcanic Activity) volcano hotspot detection system based on the analysis of MODIS data also showed a pulse in thermal activity during the same time (figure 54). Infrared satellite imagery captured a continuous thermal anomaly at the summit crater, often accompanied by white gas-and-steam emissions (figure 55). On 4 April 2023 an active lava flow was observed descending the SE flank.
Geologic Background. The modern Bezymianny, much smaller than its massive neighbors Kamen and Kliuchevskoi on the Kamchatka Peninsula, was formed about 4,700 years ago over a late-Pleistocene lava-dome complex and an edifice built about 11,000-7,000 years ago. Three periods of intensified activity have occurred during the past 3,000 years. The latest period, which was preceded by a 1,000-year quiescence, began with the dramatic 1955-56 eruption. This eruption, similar to that of St. Helens in 1980, produced a large open crater that was formed by collapse of the summit and an associated lateral blast. Subsequent episodic but ongoing lava-dome growth, accompanied by intermittent explosive activity and pyroclastic flows, has largely filled the 1956 crater.
Information Contacts: Kamchatka Volcanic Eruptions Response Team (KVERT), Far Eastern Branch, Russian Academy of Sciences, 9 Piip Blvd., Petropavlovsk-Kamchatsky, 683006, Russia (URL: http://www.kscnet.ru/ivs/kvert/); Kamchatka Volcanological Station, Kamchatka Branch of Geophysical Survey, (KB GS RAS), Klyuchi, Kamchatka Krai, Russia (URL: http://volkstat.ru/); Hawai'i Institute of Geophysics and Planetology (HIGP) - MODVOLC Thermal Alerts System, School of Ocean and Earth Science and Technology (SOEST), Univ. of Hawai'i, 2525 Correa Road, Honolulu, HI 96822, USA (URL: http://modis.higp.hawaii.edu/); MIROVA (Middle InfraRed Observation of Volcanic Activity), a collaborative project between the Universities of Turin and Florence (Italy) supported by the Centre for Volcanic Risk of the Italian Civil Protection Department (URL: http://www.mirovaweb.it/); Copernicus Browser, Copernicus Data Space Ecosystem, European Space Agency (URL: https://dataspace.copernicus.eu/browser/).
Chikurachki
Russia
50.324°N, 155.461°E; summit elev. 1781 m
All times are local (unless otherwise noted)
New explosive eruption during late January-early February 2023
Chikurachki, located on Paramushir Island in the northern Kuriles, has had Plinian eruptions during the Holocene. Lava flows have reached the sea and formed capes on the NW coast; several young lava flows are also present on the E flank beneath a scoria deposit. Reported eruptions date back to 1690, with the most recent eruption period occurring during January through October 2022, characterized by occasional explosions, ash plumes, and thermal activity (BGVN 47:11). This report covers a new eruptive period during January through February 2023 that consisted of ash explosions and ash plumes, based on information from the Kamchatka Volcanic Eruptions Response Team (KVERT) and satellite data.
According to reports from KVERT, an explosive eruption began around 0630 on 29 January. Explosions generated ash plumes that rose to 3-3.5 km altitude and drifted 6-75 km SE and E, based on satellite data. As a result, the Aviation Color Code (ACC) was raised to Orange (the second highest level on a four-color scale). At 1406 and 1720 ash plumes were identified in satellite images that rose to 4.3 km altitude and extended 70 km E. By 2320 the ash plume had dissipated. A thermal anomaly was visible at the volcano on 31 January, according to a satellite image, and an ash plume was observed drifting 66 km NE.
Occasional explosions and ash plumes continued during early February. At 0850 on 1 February an ash plume rose to 3.5 km altitude and drifted 35 km NE. Satellite data showed an ash plume that rose to 3.2-3.5 km altitude and drifted 50 km NE at 1222 later that day (figure 22). A thermal anomaly was detected over the volcano during 5-6 February and ash plumes drifted as far as 125 km SE, E, and NE. Explosive events were reported at 0330 on 6 February that produced ash plumes rising to 4-4.5 km altitude and drifting 72-90 km N, NE, and ENE. KVERT noted that the last gas-and steam plume that contained some ash was observed on 8 February and drifted 55 km NE before the explosive eruption ended. The ACC was lowered to Yellow and then Green (the lowest level on a four-color scale) on 18 February.
Geologic Background. Chikurachki, the highest volcano on Paramushir Island in the northern Kuriles, is a relatively small cone constructed on a high Pleistocene edifice. Oxidized basaltic-to-andesitic scoria deposits covering the upper part of the young cone give it a distinctive red color. Frequent basaltic Plinian eruptions have occurred during the Holocene. Lava flows have reached the sea and formed capes on the NW coast; several young lava flows are also present on the E flank beneath a scoria deposit. The Tatarinov group of six volcanic centers is located immediately to the south, and the Lomonosov cinder cone group, the source of an early Holocene lava flow that reached the saddle between it and Fuss Peak to the west, lies at the southern end of the N-S-trending Chikurachki-Tatarinov complex. In contrast to the frequently active Chikurachki, the Tatarinov centers are extensively modified by erosion and have a more complex structure. Tephrochronology gives evidence of an eruption around 1690 CE from Tatarinov, although its southern cone contains a sulfur-encrusted crater with fumaroles that were active along the margin of a crater lake until 1959.
Information Contacts: Kamchatka Volcanic Eruptions Response Team (KVERT), Far East Division, Russian Academy of Sciences, 9 Piip Blvd., Petropavlovsk-Kamchatsky, 683006, Russia (URL: http://www.kscnet.ru/ivs/); Copernicus Browser, Copernicus Data Space Ecosystem, European Space Agency (URL: https://dataspace.copernicus.eu/browser/).
Search Bulletin Archive by Publication Date
Select a month and year from the drop-downs and click "Show Issue" to have that issue displayed in this tab.
The default month and year is the latest issue available.
Bulletin of the Global Volcanism Network - Volume 45, Number 07 (July 2020)
Managing Editor: Edward Venzke
Aira (Japan)
Near-daily explosions with ash plumes continue, large block ejected 3 km from Minamidake crater on 4 June 2020
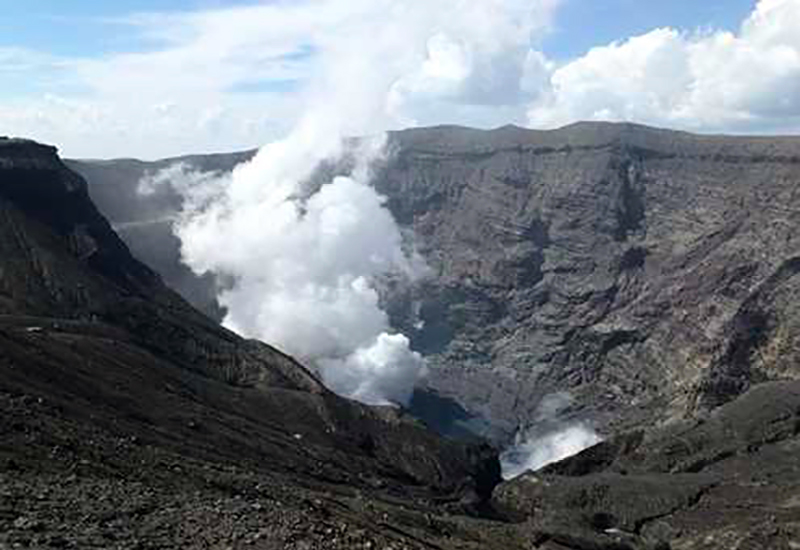
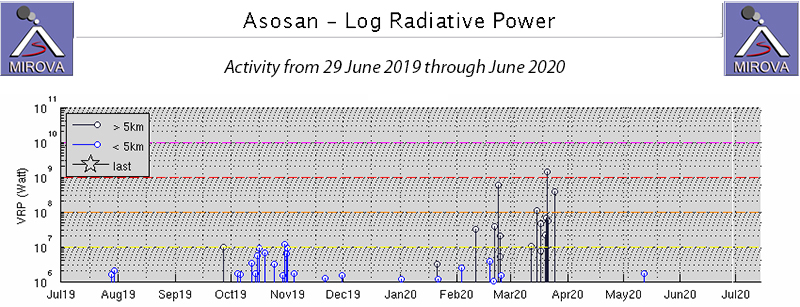
Asosan (Japan)
Daily ash emissions continue through mid-June 2020 when activity decreases
Bagana (Papua New Guinea)
Ash plumes during 29 February-2 March and 1 May 2020
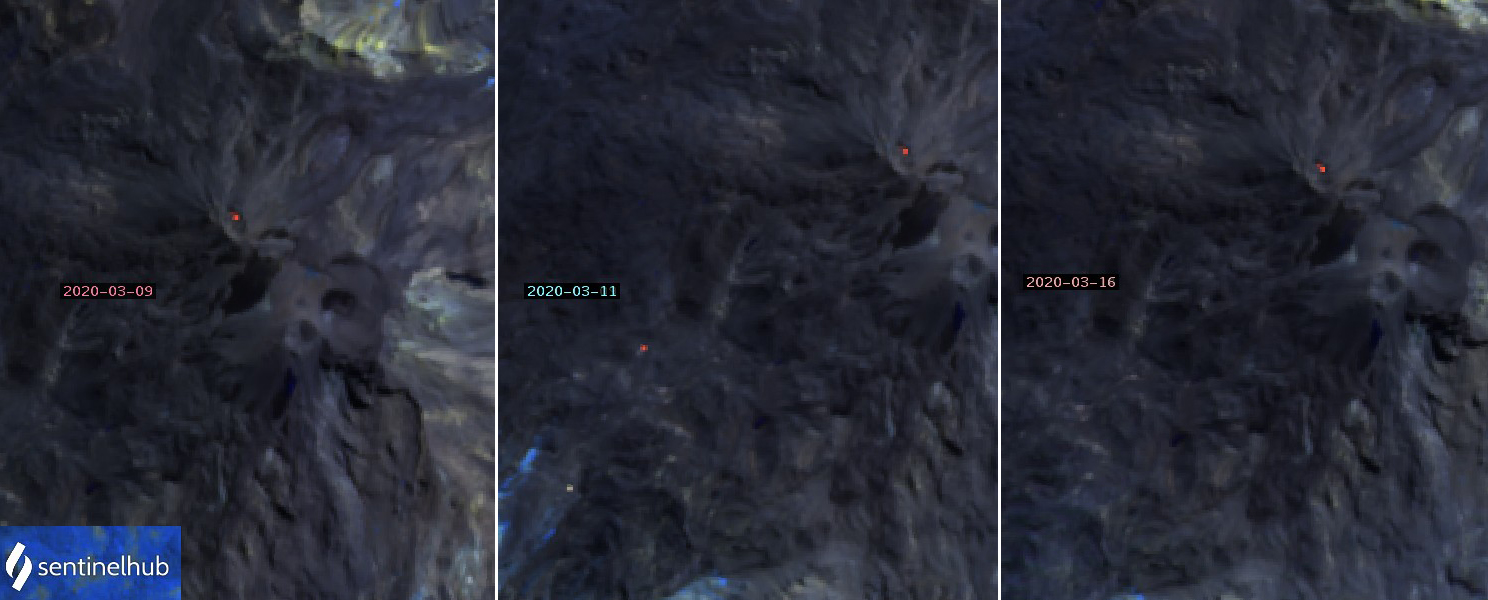
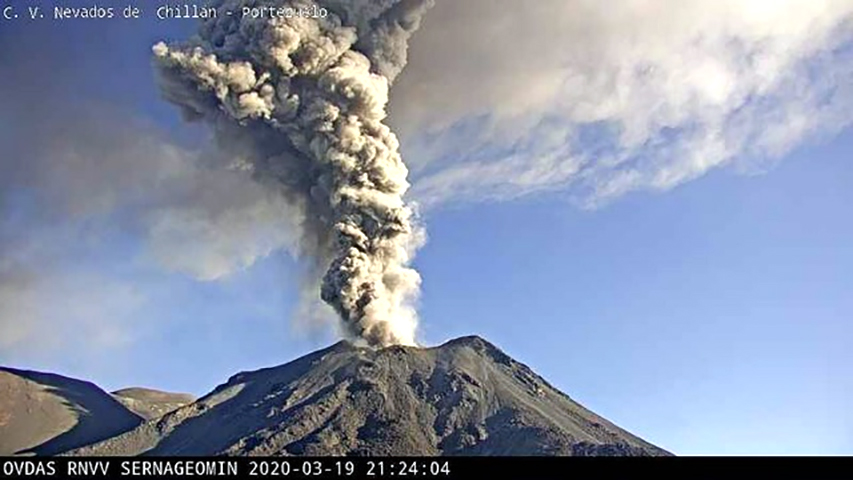
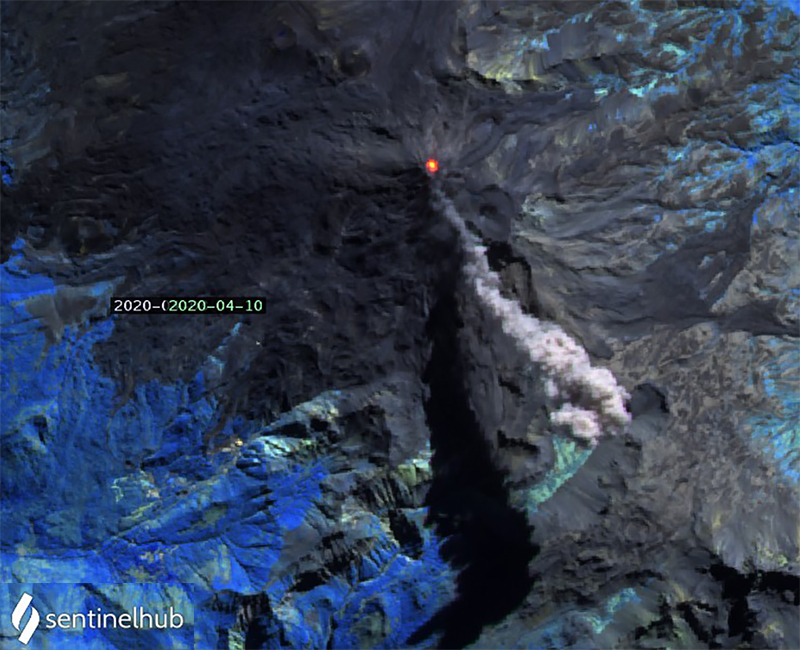
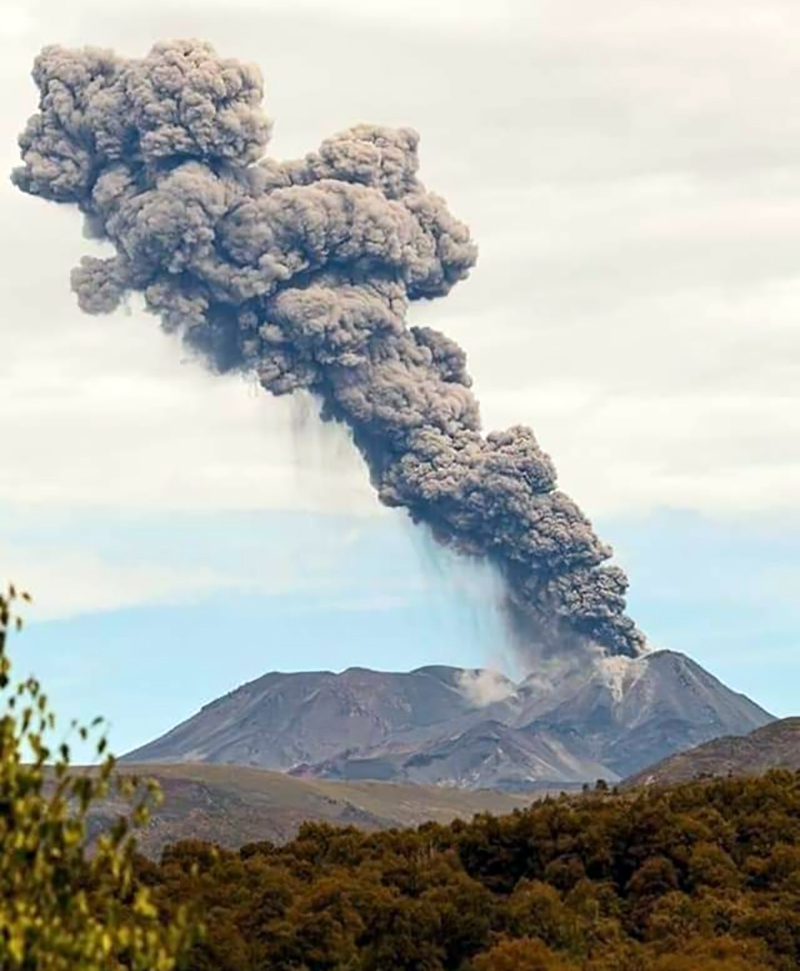
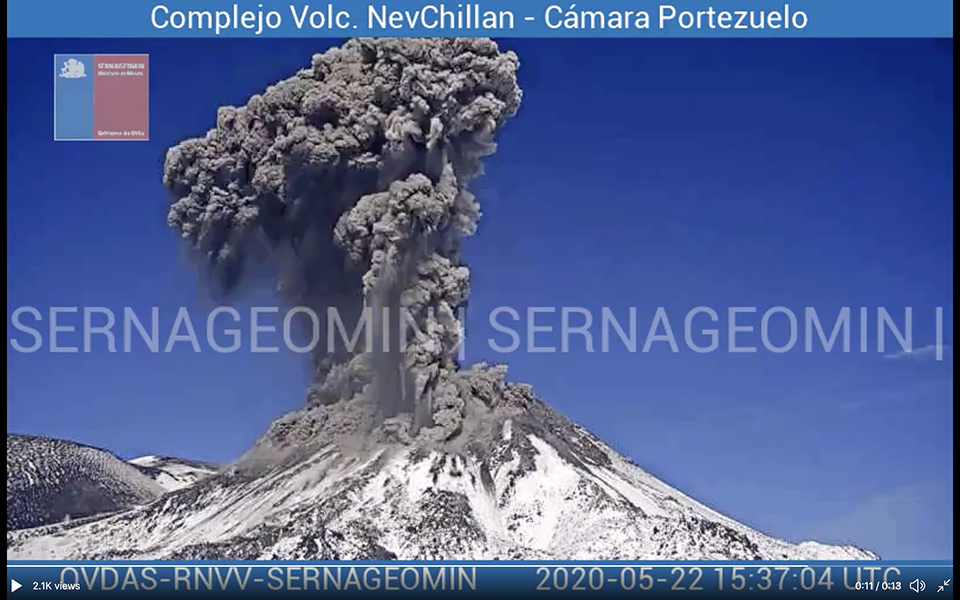
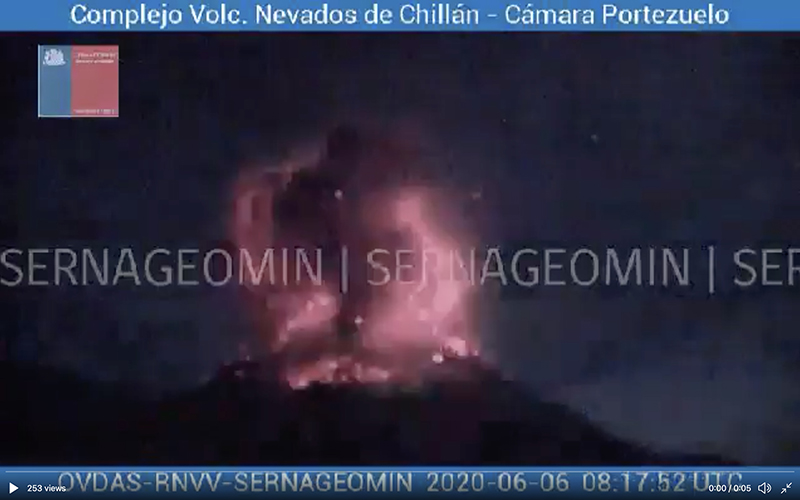
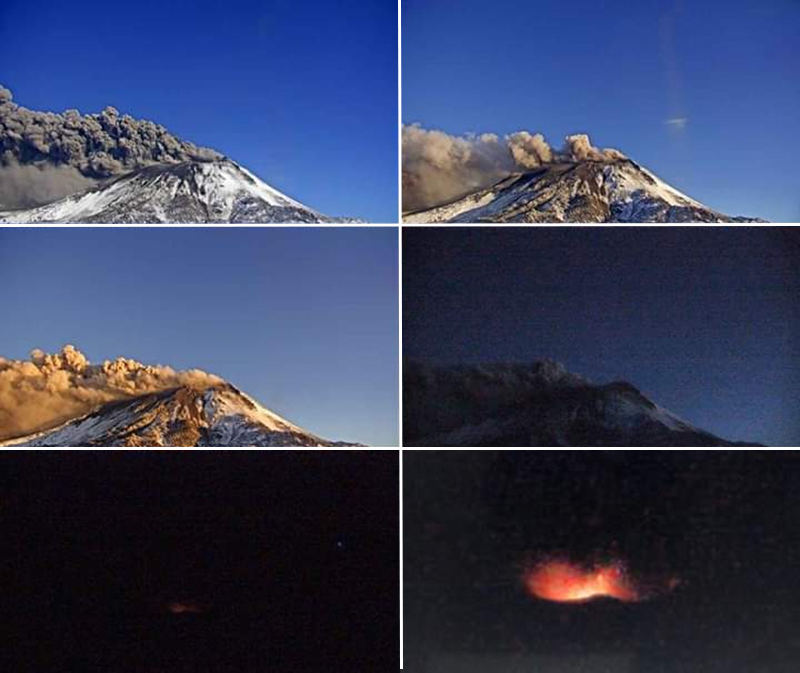
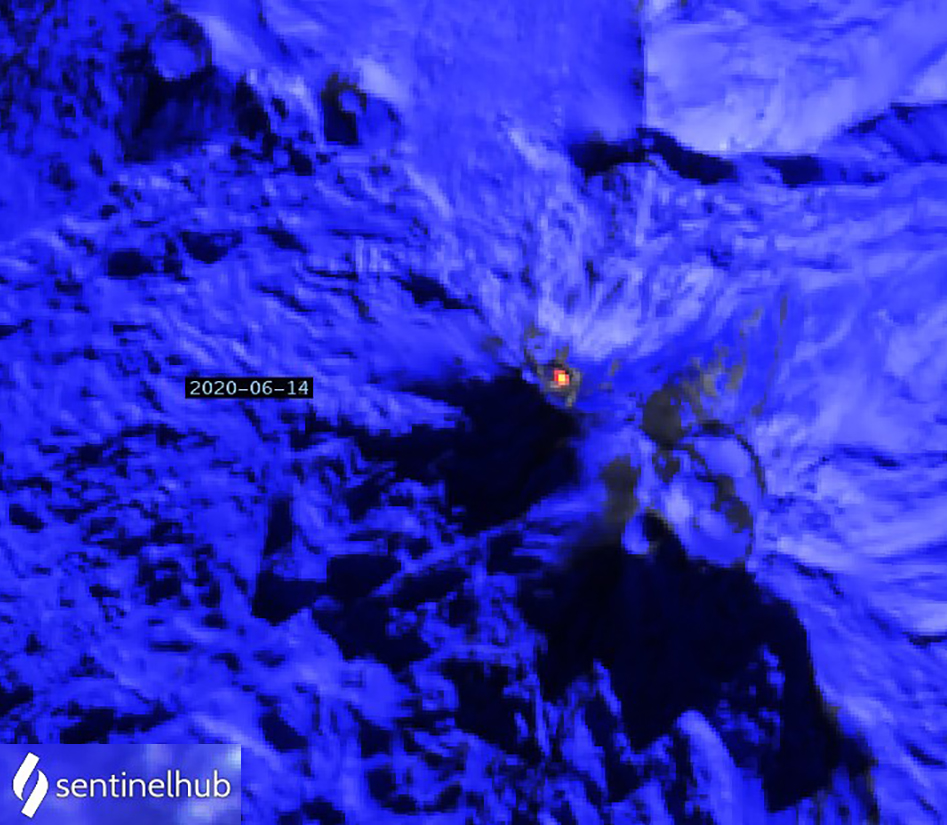
Chillan, Nevados de (Chile)
Explosions and pyroclastic flows continue; new dome emerges from Nicanor crater in June 2020
Ibu (Indonesia)
Frequent ash emissions and summit incandescence; Strombolian explosions in March 2020
Kadovar (Papua New Guinea)
Intermittent ash plumes and persistent summit thermal anomalies, January-June 2020
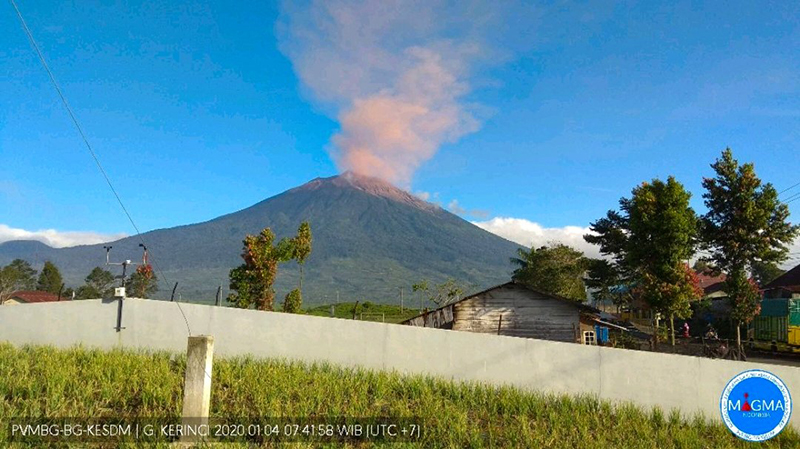
Kerinci (Indonesia)
Intermittent ash emissions during January-early May 2020
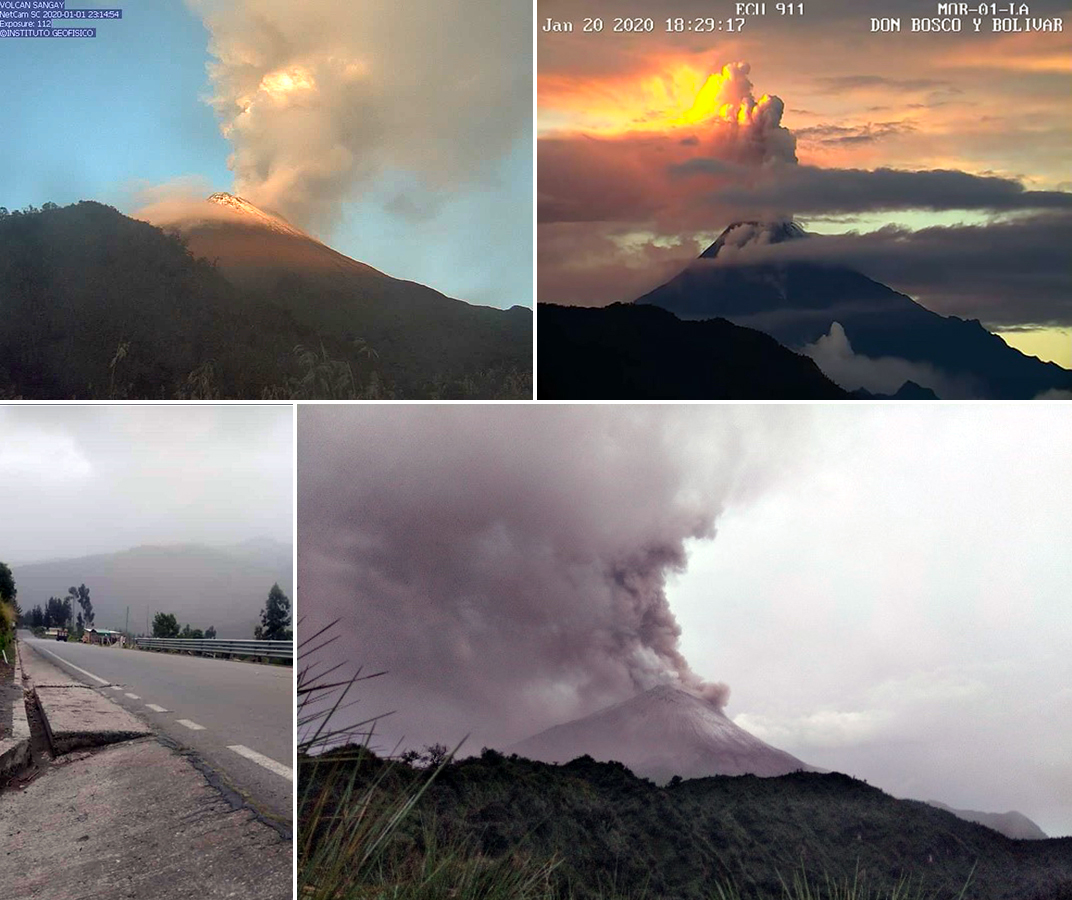
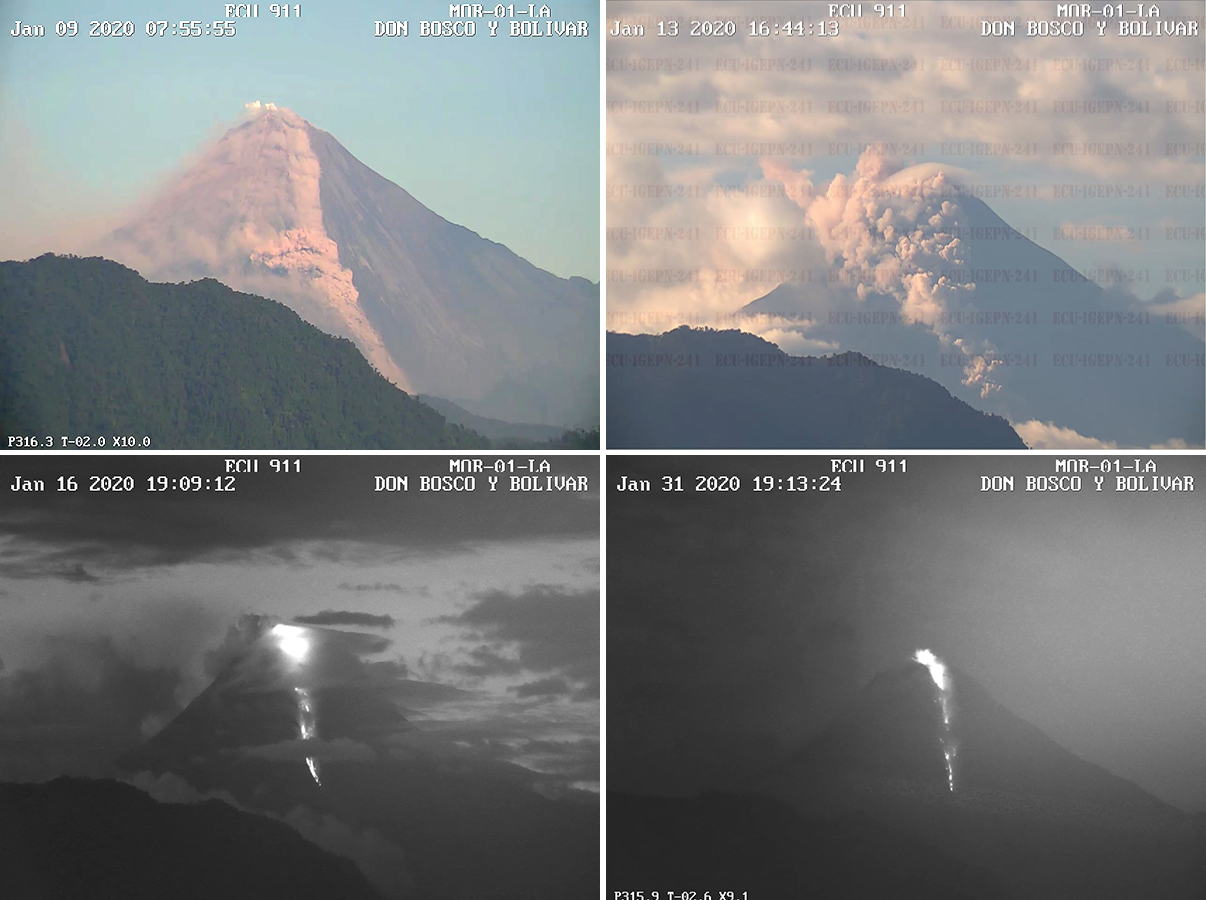
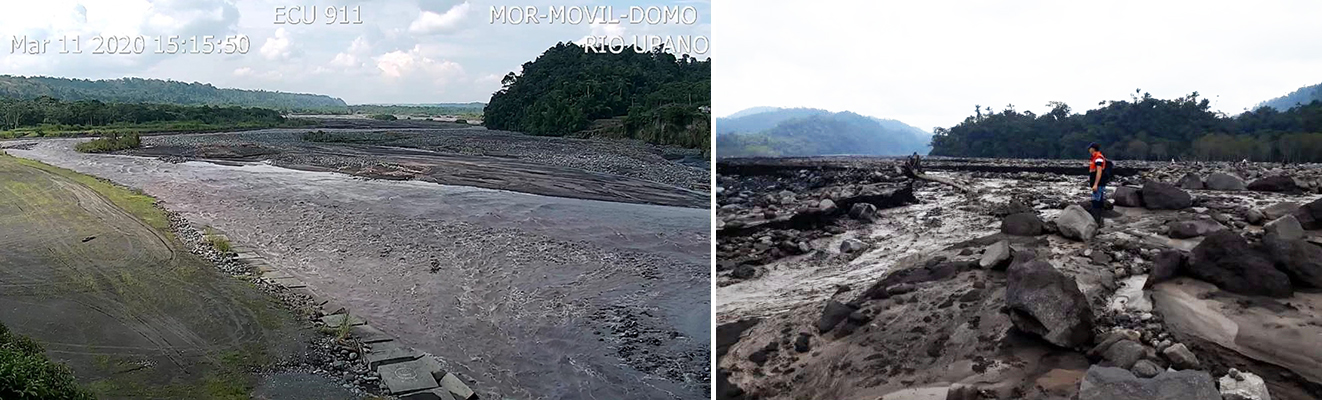
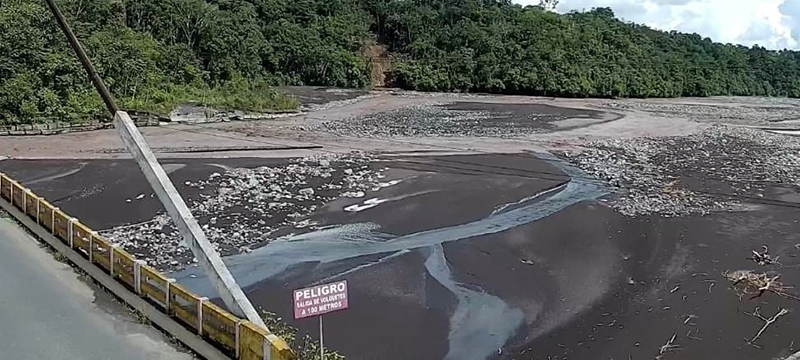
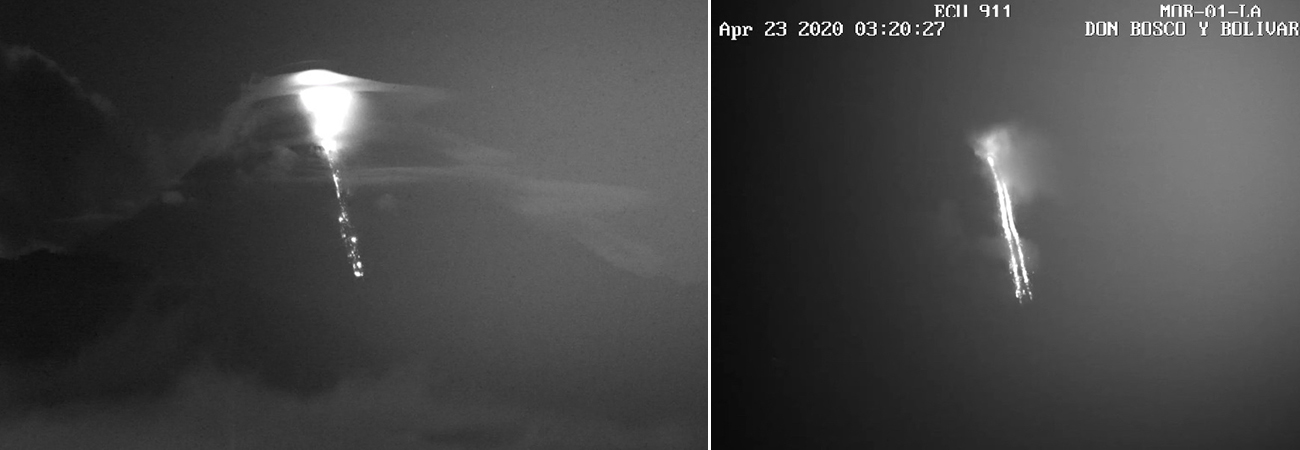
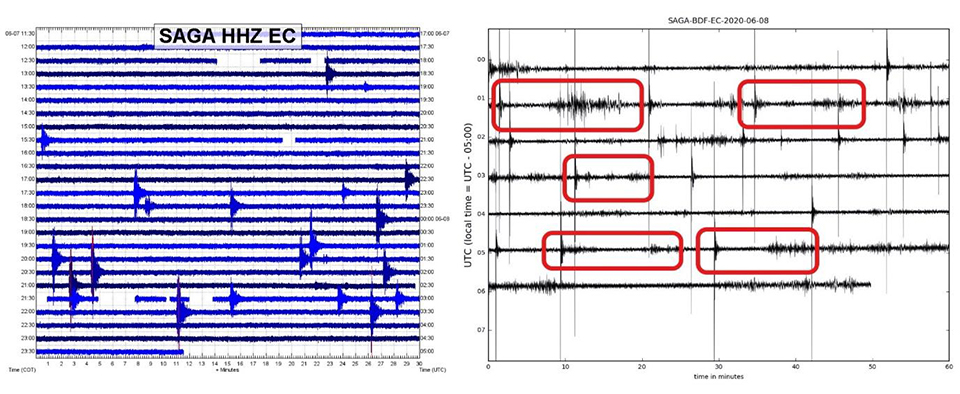
Sangay (Ecuador)
Daily ash plumes and frequent pyroclastic flows produce ashfall and lahars, January-June 2020
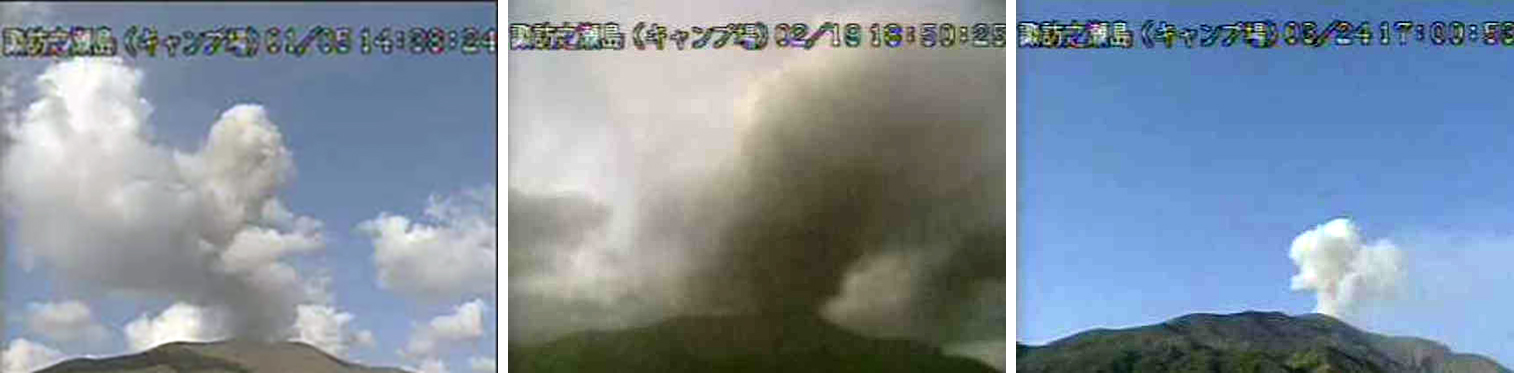
Suwanosejima (Japan)
Frequent explosions, ash plumes, and summit incandescence in January-June 2020
Tinakula (Solomon Islands)
Intermittent small thermal anomalies and gas-and-steam plumes during January-June 2020
Aira
Japan
31.5772°N, 130.6589°E; summit elev. 1117 m
All times are local (unless otherwise noted)
Near-daily explosions with ash plumes continue, large block ejected 3 km from Minamidake crater on 4 June 2020
Sakurajima rises from Kagoshima Bay, which fills the Aira Caldera near the southern tip of Japan's Kyushu Island. Frequent explosive and occasional effusive activity has been ongoing for centuries. The Minamidake summit cone has been the location of persistent activity since 1955; the adjacent Showa crater on its E flank has also been intermittently active since 2006. Numerous explosions and ash-bearing emissions have been occurring each month at either Minamidake or Showa crater since the latest eruptive episode began in late March 2017. This report covers ongoing activity at Minamidake from January through June 2020; the Japan Meteorological Agency (JMA) provides regular reports on activity, and the Tokyo VAAC (Volcanic Ash Advisory Center) issues tens of reports each month about the frequent ash plumes.
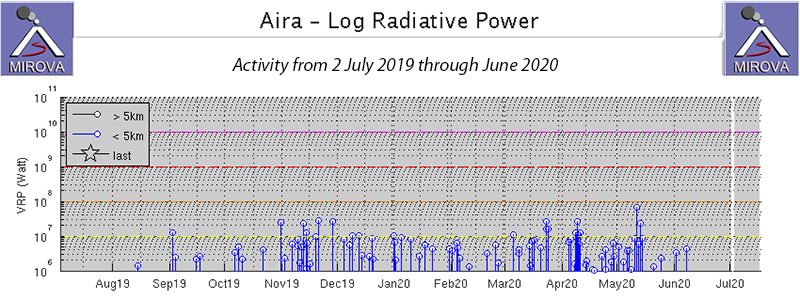
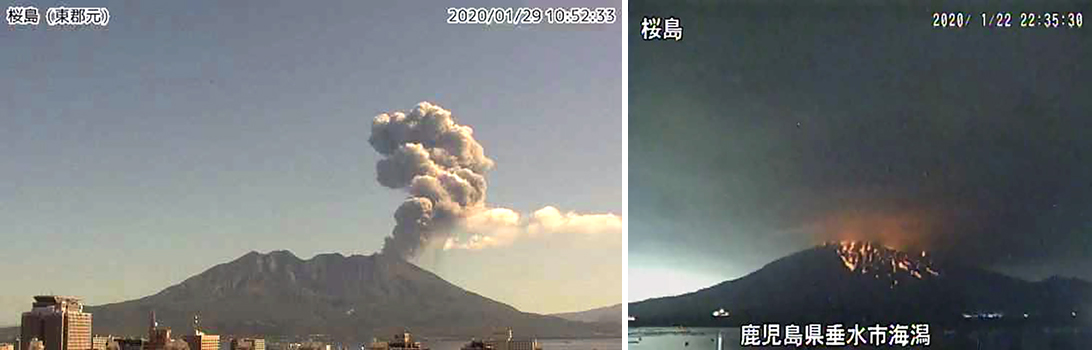
Activity continued during January-June 2020 at Minamidake crater with tens of explosions each month. The Tokyo VAAC issued multiple daily reports of ash emissions during January and February. Less activity occurred during the first half of March but picked up again with multiple daily reports from mid-March through mid-April. Emissions were more intermittent but continued through early June, when activity decreased significantly. JMA reported explosions with ash plumes rising 2.5-4.2 km above the summit, and ejecta traveling generally up to 1,700 m from the crater, although a big explosion in early June send a large block of tephra 3 km from the crater (table 23). Thermal anomalies were visible in satellite imagery on a few days most months and were persistent in the MIROVA thermal anomaly data from November 2019 through early June 2020 (figure 94). Incandescence was often visible at night in the webcams through early June; the Showa crater remained quiet throughout the period.
Table 23. Monthly summary of eruptive events recorded at Sakurajima's Minamidake crater within the Aira Caldera, January through June 2020. The number of events that were explosive in nature are in parentheses. No events were recorded at the Showa crater during this time. Ashfall is measured at the Kagoshima Local Meteorological Observatory (KLMO), 10 km W of Showa crater. Data courtesy of JMA (January to June 2020 monthly reports).
| Month |
Ash emissions (explosive) |
Max plume height above crater |
Max ejecta distance from crater |
Total amount of ashfall (g/m2) |
Total ashfall previous month |
| Jan 2020 |
104 (65) |
2.5 km |
1,700 m |
75 (12 days) |
280,000 tons |
| Feb 2020 |
129 (67) |
2.6 km |
1,800 m |
21 (14 days) |
230,000 tons |
| Mar 2020 |
26 (10) |
3.0 km |
1,700 m |
3 (8 days) |
360,000 tons |
| Apr 2020 |
51 (14) |
3.8 km |
1,700 m |
less than 0.5 (2 days) |
160,000 tons |
| May 2020 |
51 (24) |
4.2 km |
1,300 m |
19 (8 days) |
280,000 tons |
| Jun 2020 |
28 (16) |
3.7 km |
3,000 m |
71 (9 days) |
150,000 tons |
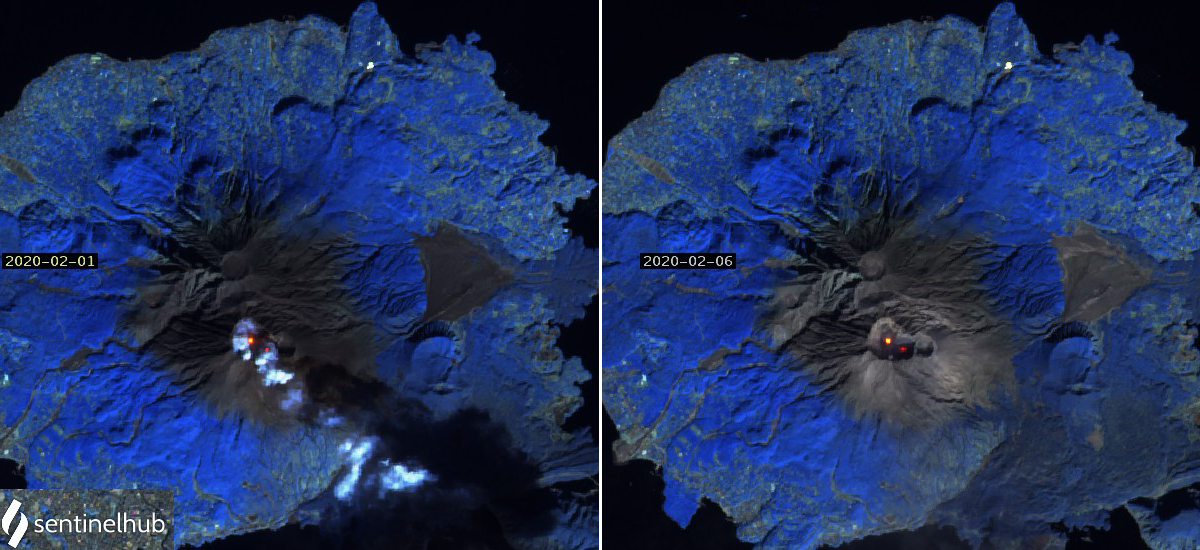
Explosions continued at Minamidake crater during January 2020 with 65 ash plumes reported. The highest ash plume rose 2.5 km above the crater on 30 January, and incandescent ejecta reached up to 1,700 m from the Minamidake crater on 22 and 29 January (figure 95). Slight inflation of the volcano since September 2019 continued to be measured with inclinometers and extensometers on Sakurajima Island. Field surveys conducted on 15, 20, and 31 January measured the amount of sulfur dioxide gas released as very high at 3,400-4,700 tons per day, as compared with 1,000-3,000 tons in December 2019.
About the same number of explosions produced ash plumes during February 2020 (67) as in January (65) (figure 96). On 10 February a large block was ejected 1,800 m from the crater, the first to reach that far since 5 February 2016. The tallest plume, on 26 February rose 2.6 km above the crater. Sentinel-2 satellite imagery indicated two distinct thermal anomalies within the Minamidake crater on both 1 and 6 February (figure 97). Activity diminished during March 2020 with only 10 explosions out of 26 eruptive events. On 21 March a large bomb reached 1,700 m from the crater. The tallest ash plume rose 3 km above the crater on 17 March. Scientists noted during an overflight on 16 March that a small steam plume was rising from the inner wall on the south side of the Showa crater; a larger steam plume rose to 300 m above the Minamidake crater and drifted S (figure 98). Sulfur dioxide emissions were similar in February (1,900 to 3,100 tons) and March (1,300 to 3,400 tons per day).
During April 2020, ejecta again reached as far as 1,700 m from the crater; 14 explosions were identified from the 51 reported eruptive events, an increase from March. The tallest plume, on 4 April, rose 3.8 km above the crater (figure 99). The same number of eruptive events occurred during May 2020, but 24 were explosive in nature. A large plume on 9 May rose to 4.2 km above the rim of Minamidake crater, the tallest of the period (figure 100). On 20 May, incandescent ejecta reached 1,300 m from the summit. Sulfur dioxide emissions during April (1,700-2,100 tons per day) and May (1,200-2,700 tons per day) were slightly lower than previous months.
A major explosion on 4 June 2020 produced 137 Pa of air vibration at the Seto 2 observation point on Sakurajima Island. It was the first time that air vibrations exceeding 100 Pa have been observed at the Seto 2 station since the 21 May 2015 explosion at the Showa crater. The ash plume associated with the explosion rose 1.5 km above the crater rim. During an 8 June field survey conducted in Higashisakurajima-cho, Kagoshima City, a large impact crater believed to be associated with this explosion was located near the coast 3 km SSW from Minamidake. The crater formed by the ejected block was about 6 m in diameter and 2 m deep (figure 101); fragments found nearby were 10-20 cm in diameter (figure 102). A nearby roof was also damaged by the blocks. Smaller bombs were found in Kurokami-cho, Kagoshima City, around 4- 5 km E of Minamidake on 5 June; the largest fragment was 5 cm in diameter. Multiple ash plumes rose to 3 km or more above the summit during the first ten days of June; explosions on 4 and 5 June reached 3.7 km above the crater (figure 103). Larger than normal inflation and deflation before and after the explosions was recorded during early June in the inclinometers and extensometers located on the island. Incandescence at the summit was observed at night through the first half of June. The Tokyo VAAC issued multiple daily ash advisories during 1-10 June after which activity declined abruptly. Two brief explosions on 23 June and one on 28 June were the only two additional ash explosions reported in June.
Geologic Background. The Aira caldera in the northern half of Kagoshima Bay contains the post-caldera Sakurajima volcano, one of Japan's most active. Eruption of the voluminous Ito pyroclastic flow accompanied formation of the 17 x 23 km caldera about 22,000 years ago. The smaller Wakamiko caldera was formed during the early Holocene in the NE corner of the caldera, along with several post-caldera cones. The construction of Sakurajima began about 13,000 years ago on the southern rim and built an island that was joined to the Osumi Peninsula during the major explosive and effusive eruption of 1914. Activity at the Kitadake summit cone ended about 4,850 years ago, after which eruptions took place at Minamidake. Frequent eruptions since the 8th century have deposited ash on the city of Kagoshima, located across Kagoshima Bay only 8 km from the summit. The largest recorded eruption took place during 1471-76.
Information Contacts: Japan Meteorological Agency (JMA), 1-3-4 Otemachi, Chiyoda-ku, Tokyo 100-8122, Japan (URL: http://www.jma.go.jp/jma/indexe.html); MIROVA (Middle InfraRed Observation of Volcanic Activity), a collaborative project between the Universities of Turin and Florence (Italy) supported by the Centre for Volcanic Risk of the Italian Civil Protection Department (URL: http://www.mirovaweb.it/); Tokyo Volcanic Ash Advisory Center (VAAC), 1-3-4 Otemachi, Chiyoda-ku, Tokyo 100-8122, Japan (URL: http://ds.data.jma.go.jp/svd/vaac/data/); Sentinel Hub Playground (URL: https://www.sentinel-hub.com/explore/sentinel-playground).
Asosan
Japan
32.8849°N, 131.085°E; summit elev. 1592 m
All times are local (unless otherwise noted)
Daily ash emissions continue through mid-June 2020 when activity decreases
Japan's 24-km-wide Asosan caldera on the island of Kyushu has been active throughout the Holocene. Nakadake has been the most active of 17 central cones for 2,000 years; all historical activity is from Nakadake Crater 1. The largest ash plume in 20 years occurred on 8 October 2016. Asosan remained quiet until renewed activity from Crater 1 began in mid-April 2019; explosions with ash plumes continued through the first half of 2020 and are covered in this report. The Japan Meteorological Agency (JMA) provides monthly reports of activity; the Tokyo Volcanic Ash Advisory Center (VAAC) issues aviation alerts reporting on possible ash plumes, and Sentinel-2 satellite images provide data on ash emissions and thermal activity.
The Tokyo VAAC issued multiple daily reports of ash plumes from Nakadake Crater 1 from 1 January-14 June 2020. They were commonly at 1.8-2.1 km altitude, and often drifted E or S. JMA reported that ashfall continued downwind from the ash plumes until mid-June; seismic activity was relatively high during January and February and decreased steadily after that time. The measured SO2 emissions ranged from 1,000-4,900 tons per day through mid-June and dropped to 500 tons per day during the second half of June. Intermittent thermal activity was recorded at the crater through mid-May.
Explosive activity during January-June 2020. Ash plumes rose up to 1.1 km above the crater rim at Nakadake Crater 1 during January 2020 (figure 70). Ashfall was confirmed downwind of an explosion on 7 January. During February, ash plumes rose up to 1.7 km above the crater, and ashfall was again reported downwind. The crater camera provided by the Aso Volcano Museum occasionally observed incandescence at the floor of the crater during both months. Incandescence was also occasionally observed with the Kusasenri webcam (3 km W) and was seen on 20 February from a webcam in Minamiaso village (8 km SW).
During March 2020, ash plumes rose as high as 1.3 km. Ashfall was reported on 9 March in Ichinomiyamachi, Aso City (figure 71). In field surveys conducted on the 18th and 25th, there was no visible water inside the crater, and high-temperature grayish-white plumes were observed. The temperature at the base of the plume was measured at 300°C (figure 72).
Occasional incandescence was observed at the bottom of the crater during April and May 2020; ash plumes rose 1.1 km above the crater on most days in April and were slightly higher, rising to 1.8 km during May, although activity was more intermittent (figure 73). A brief increase in SO2 activity was reported by JMA during field surveys on 7 and 8 May; satellite data captured small plumes of SO2 on 1 and 6 May (figure 74). A brief increase in tremor amplitude was reported by JMA on 16 May.
The last report of ash emissions at Nakadake Crater 1 from the Tokyo VAAC was on 14 June 2020. JMA also reported that no eruption was observed after mid-June. On 8 June they reported an ash plume that rose 1.4 km above the crater. During a field survey on 16 June, only steam was observed at the crater; the plume rose about 100 m (figure 75). In addition, a small plume of steam rose from a fumarole on the S crater wall.
Thermal activity during January-June 2020. Sentinel-2 satellite data indicated thermal anomalies present at Nakadake Crater 1 on 2 January, 6 and 21 February, 16 April, and 11 May (figure 76). In addition, thermal anomalies from agricultural fires appeared in satellite images on 11 February, 7 and 17 March (figure 77). The fires were around 5 km from the crater, thus they appear on the MIROVA thermal anomaly graph in black, but are likely unrelated to volcanic activity (figure 78). No thermal anomalies were recorded in satellite data from the Nakadake Crater 1 after 11 May, and none appeared in the MIROVA data as well.
Geologic Background. The 24-km-wide Asosan caldera was formed during four major explosive eruptions from 300,000 to 90,000 years ago. These produced voluminous pyroclastic flows that covered much of Kyushu. The last of these, the Aso-4 eruption, produced more than 600 km3 of airfall tephra and pyroclastic-flow deposits. A group of 17 central cones was constructed in the middle of the caldera, one of which, Nakadake, is one of Japan's most active volcanoes. It was the location of Japan's first documented historical eruption in 553 CE. The Nakadake complex has remained active throughout the Holocene. Several other cones have been active during the Holocene, including the Kometsuka scoria cone as recently as about 210 CE. Historical eruptions have largely consisted of basaltic to basaltic-andesite ash emission with periodic strombolian and phreatomagmatic activity. The summit crater of Nakadake is accessible by toll road and cable car, and is one of Kyushu's most popular tourist destinations.
Information Contacts: Japan Meteorological Agency (JMA), 1-3-4 Otemachi, Chiyoda-ku, Tokyo 100-8122, Japan (URL: http://www.jma.go.jp/jma/indexe.html); Global Sulfur Dioxide Monitoring Page, Atmospheric Chemistry and Dynamics Laboratory, NASA Goddard Space Flight Center (NASA/GSFC), 8800 Greenbelt Road, Goddard, Maryland, USA (URL: https://so2.gsfc.nasa.gov/); MIROVA (Middle InfraRed Observation of Volcanic Activity), a collaborative project between the Universities of Turin and Florence (Italy) supported by the Centre for Volcanic Risk of the Italian Civil Protection Department (URL: http://www.mirovaweb.it/); Sentinel Hub Playground (URL: https://www.sentinel-hub.com/explore/sentinel-playground).
Bagana (Papua New Guinea) — July 2020 Cite this Report
Bagana
Papua New Guinea
6.137°S, 155.196°E; summit elev. 1855 m
All times are local (unless otherwise noted)
Ash plumes during 29 February-2 March and 1 May 2020
Bagana lies in a nearly inaccessible mountainous tropical rainforest area of Bougainville Island in Papua New Guinea and is primarily monitored by satellite imagery of ash plumes and thermal anomalies. After a state of elevated activity that lasted through December 2018 (BGVN 43:05, 44:06, 44:12), the volcano entered a quieter period that persisted through at least May 2020. This report focuses on activity between December 2019 and May 2020.
Atmospheric clouds often obscured satellite views of the volcano during the reporting period. When the volcano could be observed, light-colored gas plumes were often observed (figure 35). Based on satellite and wind model data, the Darwin Volcanic Ash Advisory Centre (VAAC) reported that during 29 February-2 March ash plumes rose to an altitude of 1.8-2.1 km and drifted SW and N. On 1 May an ash plume rose to an altitude of 3 km and drifted NW and W. According to both Darwin VAAC volcanic ash advisories, the Aviation Color Code was Orange (second highest of four hazard levels).
During the reporting period, the MIROVA (Middle InfraRed Observation of Volcanic Activity) volcano hotspot detection system recorded only intermittent thermal anomalies, all of which were of low radiative power. Sulfur dioxide emissions detected by satellite-based instruments over this reporting period were at low levels.
Geologic Background. Bagana volcano, in a remote portion of central Bougainville Island, is frequently active. This massive symmetrical cone was largely constructed by an accumulation of viscous andesitic lava flows. The entire edifice could have been constructed in about 300 years at its present rate of lava production. Eruptive activity is characterized by non-explosive effusion of viscous lava that maintains a small lava dome in the summit crater, although occasional explosive activity produces pyroclastic flows. Lava flows with tongue-shaped lobes up to 50 m thick and prominent levees descend the flanks on all sides.
Information Contacts: Darwin Volcanic Ash Advisory Centre (VAAC), Bureau of Meteorology, Northern Territory Regional Office, PO Box 40050, Casuarina, NT 0811, Australia (URL: http://www.bom.gov.au/info/vaac/); Sentinel Hub Playground (URL: https://www.sentinel-hub.com/explore/sentinel-playground); MIROVA (Middle InfraRed Observation of Volcanic Activity), a collaborative project between the Universities of Turin and Florence (Italy) supported by the Centre for Volcanic Risk of the Italian Civil Protection Department (URL: http://www.mirovaweb.it/); Global Sulfur Dioxide Monitoring Page, Atmospheric Chemistry and Dynamics Laboratory, NASA Goddard Space Flight Center (NASA/GSFC), 8800 Greenbelt Road, Goddard, Maryland, USA (URL: https://so2.gsfc.nasa.gov/).
Nevados de Chillan (Chile) — July 2020 Cite this Report
Nevados de Chillan
Chile
36.868°S, 71.378°W; summit elev. 3180 m
All times are local (unless otherwise noted)
Explosions and pyroclastic flows continue; new dome emerges from Nicanor crater in June 2020
Nevados de Chillán is a complex of late-Pleistocene to Holocene stratovolcanoes in the Chilean Central Andes. An eruption started with a phreatic explosion and ash emission on 8 January 2016 from a new crater (Nicanor) on the E flank of the Nuevo crater, itself on the NW flank of the large Volcán Viejo stratovolcano. Strombolian explosions and ash emissions continued throughout 2016 and 2017; a lava dome within the Nicanor crater was confirmed in early January 2018. Explosions and pyroclastic flows continued during 2018 and 2019, with several lava flows appearing in late 2019. This report covers continuing activity from January-June 2020 when ongoing explosive events produced ash plumes, pyroclastic flows, and the growth of new dome inside the crater. Information for this report is provided primarily by Chile's Servicio Nacional de Geología y Minería (SERNAGEOMIN)-Observatorio Volcanológico de Los Andes del Sur (OVDAS), and by the Buenos Aires Volcanic Ash Advisory Center (VAAC).
Explosions with ash plumes rising up to three kilometers above the summit area were intermittent from late January through early June 2020. Some of the larger explosions produced pyroclastic flows that traveled down multiple flanks. Thermal anomalies within the Nicanor crater were recorded in satellite data several times each month from February through June. A reduction in overall activity led SERNAGEOMIN to lower the Alert Level from Orange to Yellow (on a 4-level, Green-Yellow-Orange-Red scale) during the first week of March, although tens of explosions with ash plumes were still recorded during March and April. Explosive activity diminished in early June and SERNAGEOMIN reported the growth of a new dome inside the Nicanor crater. By the end of June, a new flow had extended about 100 m down the N flank. Thermal activity recorded by the MIROVA project showed a drop in thermal energy in mid-December 2019 after the lava flows of September-November stopped advancing. A decrease in activity in January and February 2020 was followed by an increase in thermal and explosive activity in March and April. Renewed thermal activity from the growth of a new dome inside the Nicanor crater was recorded beginning in mid-June (figure 52).
Weak gas emissions were reported daily during January 2020 until a series of explosions began on the 21st. The first explosion rose 100 m above the active crater; the following day, the highest explosion rose 1.6 km above the crater. The Buenos Aires VAAC reported pulse emissions visible in satellite imagery on 21 and 24 January that rose to 3.9-4.3 km altitude and drifted SE and NE, respectively. Intermittent explosions continued through 26 January. Incandescent ejecta was observed during the night of 28-29 January. The VAAC reported an isolated emission on 29 January that rose to 5.2 km altitude and drifted E. A larger explosion on 30 January produced an ash plume that SERNAGEOMIN reported at 3.4 km above the crater (figure 53). It produced pyroclastic flows that traveled down ravines on the NNE and SE flanks. The Washington VAAC reported on behalf of the Buenos Aires VAAC that an emission was observed in satellite imagery on 30 January that rose to 4.9 km altitude and was moving rapidly E, reaching 15 km from the summit at midday. The altitude of the ash plume was revised two hours later to 7.3 km, drifting NNE and rapidly dissipating. Satellite images identified two areas of thermal anomalies within the Nicanor crater that day. One was the same emission center (CE4) identified in November 2019, and the second was a new emission center (CE5) located 60 m NW.
When the weather permitted, low-altitude mostly white degassing was seen during February 2020, often with traces of fine-grained particulate material. Incandescence at the crater was observed overnight during 4-5 February. The Buenos Aires VAAC reported an emission on 14 February visible in the webcam. The next day, an emission was visible in satellite imagery at 3.9 km altitude that drifted E. Episodes of pulsating white and gray plumes were first observed by SERNAGEOMIN beginning on 18 February and continued through 25 February (figure 54). The Buenos Aires VAAC reported pulses of ash emissions moving SE on 18 February at 4.3 km altitude. Ash drifted E the next day at 3.9 km altitude and a faint plume was briefly observed on 20 February drifting N at 3.7 km altitude before dissipating. Sporadic pulses of ash moved SE from the volcano on 22 February at 4.3 km altitude, briefly observed in satellite imagery before dissipating. Thermal anomalies were visible from the Nicanor crater in Sentinel-2 satellite imagery on 23 and 28 February.
Only low-altitude degassing of mostly steam was reported for the first half of March 2020. When SERNAGEOMIN lowered the Alert Level from Orange to Yellow on 5 March, they reduced the affected area from 5 km NE and 3 km SW of the crater to a radius of 2 km around the active crater. Thermal anomalies were recorded at the Nicanor crater in Sentinel-2 imagery on 4, 9, 11, 16, and 19 March (figure 55). A new series of explosions began on 19 March; 44 events were recorded during the second half of the month (figure 56). Webcams captured multiple explosions with dense ash plumes; on 25 and 30 March the plumes rose more than 2 km above the crater. Fine-grained ashfall occurred in Las Trancas (10 km SW) on 25 March. Pyroclastic flows on 25 and 30 March traveled 300 m NE, SE, and SW from the crater. Incandescence was observed at night multiple times after 20 March. The Buenos Aires VAAC reported several discrete pulses of ash that rose to 4.3 km altitude and drifted SE on 20 and 21 March, SW on 25 March, and SE on 29 and 30 March. Another ash emission rose to 5.5 km altitude later on 30 March and drifted SE.
In their semi-monthly reports for April 2020, SERNAGEOMIN reported 94 explosive events during the first half of the month and 49 during the second half; many produced dense ash plumes. The Buenos Aires VAAC reported frequent intermittent ash emissions during 1-13 April reaching altitudes of 3.7-4.3 km (figure 57). They reported the plume on 8 April visible in satellite imagery at 7.3 km altitude drifting SE. An emission on 13 April was also visible in satellite imagery at 6.1 km altitude drifting NE.
During the second half of April 2020, SERNAGEOMIN reported that only one plume exceeded 2 km in height; on 21 April, it rose to 2.4 km above the crater (figure 58). The Buenos Aires VAAC reported isolated pulses of ash on 18, 26, 28, and 30 April. During the second half of April SERNAGEOMIN also reported that a pyroclastic flow traveled about 1,200 m from the crater rim down the SE flank. The ash from the pyroclastic flow drifted SE and S as far as 3.5 km. Satellite images showed continued activity from multiple emission centers around the crater. Pronounced scarps were noted on the internal walls of the crater, attributed to the deepening of the crater from explosive activity.
Intermittent explosive activity continued during May 2020. The plumes contained abundant particulate material and were accompanied by periodic pyroclastic flows and incandescent ejecta around the active crater, especially visible at night. The Buenos Aires VAAC reported several sporadic weak ash emissions during the first week of May that rose to 3.7-5.2 km altitude and drifted NE. SERNAGEOMIN reported that only one explosion produced an ash emission that rose more than two km above the crater during the first two weeks of the month; on 6 May it rose to 2.5 km above the crater and drifted NE. They also observed pyroclastic flows on the E and SE flanks that day. Additional pyroclastic flows traveled 450 m down the S flank during the first half of the month, and similar deposits were observed to the N and NE. Satellite observations showed various emission points along the NW-trending lineament at the summit and multiple erosion scarps. Major erosion was noted at the NE rim of the crater along with an increase in degassing around the rim.
During the second half of May 2020 most of the ash plumes rose less than 2 km above the crater; a plume from one explosion on 22 May rose 2.2 km above the crater; the Buenos Aires VAAC reported the plume at 5.5 km altitude drifting NW (figure 59). Continuing pyroclastic emissions deposited material as far as 1.5 km from the crater rim on the NNW flank. There were also multiple pyroclastic deposits up to 500 m from the crater directed N and NE during the period. SERNAGEOMIN reported an increase in steam degassing between Nuevo-Nicanor and Nicanor-Arrau craters.
Webcam images during the first two weeks of June 2020 indicated multiple incandescent explosions. On 3 and 4 June plumes from explosions reached heights of over 1.25 km above the crater; the Buenos Aires VAAC reported them drifting NW at 3.9 km altitude. Incandescent ejecta on 6 June rose 760 m above the vent and drifted NE. In addition, pyroclastic flows were distributed on the N, NW, E and SE flanks. Significant daytime and nighttime incandescence was reported on 6, 9, and 10 June (figure 60). The VAAC reported emission pulses on 6 and 9 June drifting E and SE at 4.3 km altitude.
SERNAGEOMIN reported that beginning on the afternoon of 9 June 2020 a tremor-type seismic signal was first recorded, associated with continuous emission of gas and dark gray ash that drifted SE (figure 61). A little over an hour later another tremor signal began that lasted for about four hours, followed by smaller discrete explosions. A hybrid-type earthquake in the early morning of 10 June was followed by a series of explosions that ejected gas and particulate matter from the active crater. The vent where the emissions occurred was located within the Nicanor crater close to the Arrau crater; it had been degassing since 30 May.
After the explosions on the afternoon of 9 June, a number of other nearby vents became active. In particular, the vent located between the Nuevo and Nicanor craters began emitting material for the first time during this eruptive cycle. The explosion also generated pyroclastic flows that traveled less than 50 m in multiple directions away from the vent. Abundant incandescent material was reported during the explosion early on 10 June. Deformation measurements showed inflation over the previous 12 days.
SERNAGEOMIN identified a surface feature in satellite imagery on 11 June 2020 that they interpreted as a new effusive lava dome. It was elliptical with dimensions of about 85 x 120 m. In addition to a thermal anomaly attributed to the dome, they noted three other thermal anomalies between the Nuevo, Arrau, and Nicanor craters. They reported that within four days the base of the active crater was filled with effusive material. Seismometers recorded tremor activity after 11 June that was interpreted as associated with lava effusion. Incandescent emissions were visible at night around the active crater. Sentinel-2 satellite imagery recorded a bright thermal anomaly inside the Nicanor crater on 14 June (figure 62).
A special report from SERNAGEOMIN on 24 June 2020 noted that vertical inflation had increased during the previous few weeks. After 20 June the inflation rate reached 2.49 cm/month, which was considered high. The accumulated inflation measured since July 2019 was 22.5 cm. Satellite imagery continued to show the growth of the dome, and SERNAGEOMIN scientists estimated that it reached the E edge of the Nicanor crater on 23 June. Based on these images, they estimated an eruptive rate of 0.1-0.3 m3/s, about two orders of magnitude faster than the Gil-Cruz dome that emerged between December 2018 and early 2019.
Webcams revealed continued low-level explosive activity and incandescence visible both during the day and at night. By the end of June, webcams recorded a lava flow that extended 94 m down the N flank from the Nicanor crater and continued to advance. Small explosions with abundant pyroclastic debris produced recurring incandescence at night. Satellite infrared imagery indicated thermal radiance from effusive material that covered an area of 37,000 m2, largely filling the crater. DEM analysis suggested that the size of the crater had tripled in volume since December 2019 due largely to erosion from explosive activity since May 2020. Sentinel-2 satellite imagery showed a bright thermal anomaly inside the crater on 27 June.
Geologic Background. The compound volcano of Nevados de Chillán is one of the most active of the Central Andes. Three late-Pleistocene to Holocene stratovolcanoes were constructed along a NNW-SSE line within three nested Pleistocene calderas, which produced ignimbrite sheets extending more than 100 km into the Central Depression of Chile. The dominantly andesitic Cerro Blanco (Volcán Nevado) stratovolcano is located at the NW end of the massif. Volcán Viejo (Volcán Chillán), which was the main active vent during the 17th-19th centuries, occupies the SE end. The Volcán Nuevo lava-dome complex formed during 1906-1945 on the NW flank of Viejo. The Volcán Arrau dome complex was then constructed on the SE side of Volcán Nuevo between 1973 and 1986, and eventually exceeded its height. Smaller domes or cones are present in the 5-km valley between the two major edifices.
Information Contacts: Servicio Nacional de Geología y Minería (SERNAGEOMIN), Observatorio Volcanológico de Los Andes del Sur (OVDAS), Avda Sta María No. 0104, Santiago, Chile (URL: http://www.sernageomin.cl/, https://twitter.com/Sernageomin);
MIROVA (Middle InfraRed Observation of Volcanic Activity), a collaborative project between the Universities of Turin and Florence (Italy) supported by the Centre for Volcanic Risk of the Italian Civil Protection Department (URL: http://www.mirovaweb.it/);
Buenos Aires Volcanic Ash Advisory Center (VAAC), Servicio Meteorológico Nacional-Fuerza Aérea Argentina, 25 de mayo 658, Buenos Aires, Argentina (URL: http://www.smn.gov.ar/vaac/buenosaires/inicio.php);
Sentinel Hub Playground (URL: https://www.sentinel-hub.com/explore/sentinel-playground);
#EmergenciasÑuble (URL: https://twitter.com/urgenciasnuble/status/1222943399185207296);
T13, Channel 13 Press Department (URL: https://twitter.com/T13/status/1222951071443771394);
Chillanonlinenoticia (URL: https://twitter.com/ChillanOnline/status/1240754211932995595);
Noticias Valpo Express (URL: https://twitter.com/NoticiasValpoEx/status/1252715033131388928);
Sismo Alerta Mexicana (URL: https://twitter.com/Sismoalertamex/status/1269351579095691265);
Volcanology Chile (URL: https://twitter.com/volcanologiachl/status/1270548008191643651).
Ibu
Indonesia
1.488°N, 127.63°E; summit elev. 1325 m
All times are local (unless otherwise noted)
Frequent ash emissions and summit incandescence; Strombolian explosions in March 2020
Ibu is an active stratovolcano located along the NW coast of Halmahera Island in Indonesia. Volcanism has recently been characterized by frequent ash explosions, ash plumes, and small lava flows within the crater throughout 2019 (BGVN 45:01). Activity continues, consisting of frequent white-and-gray emissions, ash explosions, ash plumes, and lava flows. This report updates activity through June 2020, using data from the Pusat Vulkanologi dan Mitigasi Bencana Geologi (PVMBG, also known as Indonesian Center for Volcanology and Geological Hazard Mitigation, CVGHM), Darwin Volcanic Ash Advisory Centre (VAAC), and various satellites.
Volcanism during the entire reporting period dominantly consisted of white-and-gray emissions that rose 200-800 m above the summit drifting in multiple directions. The ash plume with the maximum altitude of 13.7 km altitude occurred on 16 May 2020. Sentinel-2 thermal satellite imagery detected multiple smaller hotspots within the crater throughout the reporting period.
Continuous ash emissions were reported on 6 February rising to 2.1 km altitude drifting E, accompanied by a hotspot visible in infrared satellite imagery. On 16 February, a ground observer reported an eruption that produced an ash plume rising 800 m above the summit drifting W, according to a Darwin VAAC notice. Ash plumes continued through the month, drifting in multiple directions and rising up to 2.1 km altitude. During 8-10 March, video footage captured multiple Strombolian explosions that ejected incandescent material and produced ash plumes from the summit (figures 21 and 22). Occasionally volcanic lightning was observed within the ash column, as recorded in video footage by Martin Rietze. This event was also documented by a Darwin VAAC notice, which stated that multiple ash emissions rose 2.1 km altitude drifting SE. PVMBG published a VONA notice on 10 March at 1044 reporting ash plumes rising 400 m above the summit. PVMBG and Darwin VAAC notices described intermittent eruptions on 26, 28, and 29 March, all of which produced ash plumes rising 300-800 m above the summit.
A majority of days in April included white-and-gray emissions rising up to 800 m above the summit. A ground observer reported an eruption on 9 April, according to a Darwin VAAC report, and a hotspot was observed in HIMAWARI-8 satellite imagery. Minor eruptions were reported intermittently during mid-April and early to mid-May. On 12 May at 1052 a VONA from PVMBG reported an ash plume 800-1,100 m above the summit. A large short-lived eruption on 16 May produced an ash plume that rose to a maximum of 13.7 km altitude and drifted S, according to the Darwin VAAC report. By June, volcanism consisted predominantly of white-and-gray emissions rising 800 m above the summit, with an ash eruption on 15 June. This eruptive event resulted in an ash plume that rose 1.8 km altitude drifting WNW and was accompanied by a hotspot detected in HIMAWARI-8 satellite imagery, according to a Darwin VAAC notice.
The MIROVA (Middle InfraRed Observation of Volcanic Activity) system detected frequent hotspots during July 2019 through June 2020 (figure 23). In comparison, the MODVOLC thermal alerts recorded a total of 24 thermal signatures over the course of 19 different days between January and June. Many thermal signatures were captured as small thermal hotspots in Sentinel-2 thermal satellite imagery within the crater (figure 24).
Geologic Background. The truncated summit of Gunung Ibu stratovolcano along the NW coast of Halmahera Island has large nested summit craters. The inner crater, 1 km wide and 400 m deep, has contained several small crater lakes. The 1.2-km-wide outer crater is breached on the N, creating a steep-walled valley. A large cone grew ENE of the summit, and a smaller one to the WSW has fed a lava flow down the W flank. A group of maars is located below the N and W flanks. The first observed and recorded eruption was a small explosion from the summit crater in 1911. Eruptive activity began again in December 1998, producing a lava dome that eventually covered much of the floor of the inner summit crater along with ongoing explosive ash emissions.
Information Contacts: Pusat Vulkanologi dan Mitigasi Bencana Geologi (PVMBG, also known as Indonesian Center for Volcanology and Geological Hazard Mitigation, CVGHM), Jalan Diponegoro 57, Bandung 40122, Indonesia (URL: http://www.vsi.esdm.go.id/); MIROVA (Middle InfraRed Observation of Volcanic Activity), a collaborative project between the Universities of Turin and Florence (Italy) supported by the Centre for Volcanic Risk of the Italian Civil Protection Department (URL: http://www.mirovaweb.it/); Hawai'i Institute of Geophysics and Planetology (HIGP) - MODVOLC Thermal Alerts System, School of Ocean and Earth Science and Technology (SOEST), Univ. of Hawai'i, 2525 Correa Road, Honolulu, HI 96822, USA (URL: http://modis.higp.hawaii.edu/); Sentinel Hub Playground (URL: https://www.sentinel-hub.com/explore/sentinel-playground); Martin Rietze, Taubenstr. 1, D-82223 Eichenau, Germany (URL: https://mrietze.com/, https://www.youtube.com/channel/UC5LzAA_nyNWEUfpcUFOCpJw/videos, video at https://www.youtube.com/watch?v=qMkfT1e4HQQ).
Kadovar (Papua New Guinea) — July 2020 Cite this Report
Kadovar
Papua New Guinea
3.608°S, 144.588°E; summit elev. 365 m
All times are local (unless otherwise noted)
Intermittent ash plumes and persistent summit thermal anomalies, January-June 2020
The steeply sloped 1.4-km-diameter Kadovar Island is located in the Bismark Sea offshore from the mainland of Papua New Guinea about 25 km NNE from the mouth of the Sepik River. Its first confirmed observed eruption began in early January 2018, with ash plumes and lava extrusion resulting in the evacuation of around 600 residents from the N side of the island (BGVN 43:03). A dome appeared at the base of the E flank during March-May 2018 (Planka et al., 2019); by November activity had migrated to a new dome growing near the summit on the E flank. Pulsating steam plumes, thermal anomalies, and periodic ash emissions continued throughout 2019 (BGVN 44:05, 45:01), and from January-June 2020, the period covered in this report. Information was provided by the Rabaul Volcano Observatory (RVO), the Darwin Volcanic Ash Advisory Center (VAAC), satellite sources, and photographs from visitors.
Activity during January-June 2020. Intermittent ash plumes, pulsating gas and steam plumes, and thermal anomalies continued at Kadovar during January-June 2020. MIROVA thermal data suggested persistent low-level anomalies throughout the period (figure 45). Sentinel-2 satellite data confirmed thermal anomalies at the summit on 5 and 25 January 2020, and an ash emission on 20 January (figure 46). Persistent pulsating steam plumes were visible whenever the skies were clear enough to see the volcano.
On 2 February 2020 the Darwin VAAC reported a minor eruption plume that rose to 1.5 km altitude and drifted ESE for a few hours. Another plume was clearly discernible in satellite imagery on 5 February at 2.1 km altitude moving SE. RVO issued an information bulletin on 7 February reporting that, since the beginning of January, the eruption had continued with frequent Vulcanian explosions from the Main Vent with a recurrence interval of hours to days. Rocks and ash were ejected 300-400 m above the vent. Rumbling could be heard from Blupblup (Rubrub) island, 15 km E, and residents there also observed incandescence at night. On clear days the plume was sometimes visible from Wewak, on the mainland 100 km W. Additional vents produced variable amounts of steam. The Darwin VAAC reported continuous volcanic ash rising to 1.5 km on 22 February that extended ESE until it was obscured by a meteoric cloud; it dissipated early the next day. A small double ash plume and two strong thermal anomalies at the summit were visible in satellite imagery on 24 February (figure 47).
The Darwin VAAC reported continuous ash emissions beginning on 13 March 2020 that rose to 1.5 km altitude and drifted SE. The plume was visible intermittently in satellite imagery for about 36 hours before dissipating. During April, pulsating steam plumes rose from two vents at the summit, and thermal anomalies appeared at both vents in satellite data (figure 48). Small but distinct SO2 anomalies were visible in satellite data on 15 and 16 April (figure 49).
Two summit vents remained active throughout May and June 2020, producing pulsating steam plumes that were visible for tens of kilometers and thermal anomalies visible in satellite data (figure 50). A strong thermal anomaly was visible beneath meteoric clouds on 8 June.
Visitor observations on 21 October 2019. Claudio Jung visited Kadovar on 21 October 2019. Shortly before arriving on the island an ash plume rose tens of meters above the summit and drifted W (figure 51). From the NW side of the summit crater rim, Jung saw the actively growing dome on the side of a larger dome, and steam and gas issuing from the growing dome (figure 52). The crater rim was covered with dead vegetation, ash, and large bombs from recent explosions (figure 53). The summit dome had minor fumarolic activity around the summit area and dead vegetation halfway up the flank (figure 54) while the fresh blocky lava of the actively growing dome on the E side of the summit produced significant steam and gas emissions. The growing dome produced periodic pulses of dense steam during his visit (figure 55).
Reference: Planka S, Walter T R, Martinis S, Cescab S, 2019, Growth and collapse of a littoral lava dome during the 2018/19 eruption of Kadovar Volcano, Papua New Guinea, analyzed by multi-sensor satellite imagery, Journal of Volcanology and Geothermal Research, v. 388, 15 December 2019, 106704, https://doi.org/10.1016/j.jvolgeores.2019.106704.
Geologic Background. The 2-km-wide island of Kadovar is the emergent summit of a Bismarck Sea stratovolcano of Holocene age. It is part of the Schouten Islands, and lies off the coast of New Guinea, about 25 km N of the mouth of the Sepik River. Prior to an eruption that began in 2018, a lava dome formed the high point of the andesitic volcano, filling an arcuate landslide scarp open to the south; submarine debris-avalanche deposits occur in that direction. Thick lava flows with columnar jointing forms low cliffs along the coast. The youthful island lacks fringing or offshore reefs. A period of heightened thermal phenomena took place in 1976. An eruption began in January 2018 that included lava effusion from vents at the summit and at the E coast.
Information Contacts: Rabaul Volcano Observatory (RVO), Geohazards Management Division, Department of Mineral Policy and Geohazards Management (DMPGM), PO Box 3386, Kokopo, East New Britain Province, Papua New Guinea; Darwin Volcanic Ash Advisory Centre (VAAC), Bureau of Meteorology, Northern Territory Regional Office, PO Box 40050, Casuarina, NT 0811, Australia (URL: http://www.bom.gov.au/info/vaac/); Sentinel Hub Playground (URL: https://www.sentinel-hub.com/explore/sentinel-playground); MIROVA (Middle InfraRed Observation of Volcanic Activity), a collaborative project between the Universities of Turin and Florence (Italy) supported by the Centre for Volcanic Risk of the Italian Civil Protection Department (URL: http://www.mirovaweb.it/); NASA Global Sulfur Dioxide Monitoring Page, Atmospheric Chemistry and Dynamics Laboratory, NASA Goddard Space Flight Center (NASA/GSFC), 8800 Greenbelt Road, Goddard, Maryland, USA (URL: https://so2.gsfc.nasa.gov/); Claudio Jung (URL: https://www.instagram.com/jung.claudio/).
Kerinci
Indonesia
1.697°S, 101.264°E; summit elev. 3800 m
All times are local (unless otherwise noted)
Intermittent ash emissions during January-early May 2020
Kerinci is a stratovolcano located in Sumatra, Indonesia that has been characterized by explosive eruptions with ash plumes and gas-and-steam emissions. The most recent eruptive episode began in April 2018 which has included intermittent explosions and ash plumes. The previous report (BGVN 44:12) described more recent activity consisting of intermittent gas-and-steam and ash plumes which occurred during June through early November 2019. This volcanism continued through May 2020, though little to no activity was reported during December 2019. The primary source of information for this report comes from Pusat Vulkanologi dan Mitigasi Bencana Geologi (PVMBG, also known as Indonesian Center for Volcanology and Geological Hazard Mitigation, CVGHM) and the Darwin Volcanic Ash Advisory Centre (VAAC).
Activity during December 2019 consisted of white gas-and-steam emissions rising 100-500 m above the summit. White and brown emissions continued intermittently through May 2020, rising to a maximum altitude of 1 km above the summit on 14 April. During 3-6 and 8-9 January 2020, the Darwin VAAC and PVMBG issued notices reporting brown volcanic ash rising 150-600 m above the summit drifting S and ESE (figure 19). PVMBG published a VONA notice on 24 January at 0828 reporting ash rising 400 m above the summit. Brown emissions continued intermittently throughout the reporting period. On 1 February, volcanic ash was observed rising 300-960 m above the summit and drifting NE; PVMBG reported continuing brown emissions during 1-3 February. During 16-17 February, two VONA notices reported that brown ash plumes rose 150-400 m above the summit and drifted SW accompanied by consistent white gas-and-steam emissions (figure 20).
During 1-16 and 25-26 March 2020 brown ash emissions were frequently observed rising 100-500 m above the summit drifting in multiple directions. During 6-8 and 10-15, April brown ash emissions were reported 50-1,000 m above the summit. The most recent Darwin VAAC and VONA notices were published on 14 April, reporting volcanic ash rising 400 and 600 m above the summit, respectively; however, PVMBG reported brown emissions rising up to 1,000 m. By 25-27 April brown ash emissions rose 50-300 m above the summit. Intermittent white gas-and-steam emissions continued through May. The last brown emissions seen in May were reported on the 7th rising 50-100 m above the summit.
Geologic Background. Gunung Kerinci in central Sumatra forms Indonesia's highest volcano and is one of the most active in Sumatra. It is capped by an unvegetated young summit cone that was constructed NE of an older crater remnant. There is a deep 600-m-wide summit crater often partially filled by a small crater lake that lies on the NE crater floor, opposite the SW-rim summit. The massive 13 x 25 km wide volcano towers 2400-3300 m above surrounding plains and is elongated in a N-S direction. Frequently active, Kerinci has been the source of numerous moderate explosive eruptions since its first recorded eruption in 1838.
Information Contacts: Pusat Vulkanologi dan Mitigasi Bencana Geologi (PVMBG, also known as Indonesian Center for Volcanology and Geological Hazard Mitigation, CVGHM), Jalan Diponegoro 57, Bandung 40122, Indonesia (URL: http://www.vsi.esdm.go.id/); Darwin Volcanic Ash Advisory Centre (VAAC), Bureau of Meteorology, Northern Territory Regional Office, PO Box 40050, Casuarina, NT 0811, Australia (URL: http://www.bom.gov.au/info/vaac/); MAGMA Indonesia, Kementerian Energi dan Sumber Daya Mineral (URL: https://magma.vsi.esdm.go.id/); Sentinel Hub Playground (URL: https://www.sentinel-hub.com/explore/sentinel-playground); Øystein Lund Andersen (Twitter: @OysteinLAnderse, https://twitter.com/OysteinLAnderse, URL: http://www.oysteinlundandersen.com, images at https://twitter.com/OysteinLAnderse/status/1213658331564269569/photo/1 and https://twitter.com/OysteinLAnderse/status/1230419965209018369/photo/1).
Sangay
Ecuador
2.005°S, 78.341°W; summit elev. 5286 m
All times are local (unless otherwise noted)
Daily ash plumes and frequent pyroclastic flows produce ashfall and lahars, January-June 2020
Frequent activity at Ecuador's Sangay has included pyroclastic flows, lava flows, ash plumes, and lahars reported since 1628. Its remoteness on the east side of the Andean crest make ground observations difficult; remote cameras and satellites provide important information on activity. The current eruption began in March 2019 and continued through December 2019 with activity focused on the Cráter Central and the Ñuñurco (southeast) vent; they produced explosions with ash plumes, lava flows, and pyroclastic flows and block avalanches. In addition, volcanic debris was remobilized in the Volcan river causing significant damming downstream. This report covers ongoing similar activity from January through June 2020. Information is provided by Ecuador's Instituto Geofísico, Escuela Politécnica Nacional (IG-EPN), and a number of sources of remote data including the Washington Volcanic Ash Advisory Center (VAAC), the Italian MIROVA Volcano HotSpot Detection System, and Sentinel-2 satellite imagery. Visitors also provided excellent ground and drone-based images and information.
Throughout January-June 2020, multiple daily reports from the Washington Volcanic Ash Advisory Center (VAAC) indicated ash plumes rising from the summit, generally 500-1,100 m. Each month one or more plumes rose over 2,000 m. The plumes usually drifted SW or W, and ashfall was reported in communities 25-90 km away several times during January-March and again in June. In addition to explosions with ash plumes, pyroclastic flows and incandescent blocks frequently descended a large, deep ravine on the SE flank. Ash from the pyroclastic flows rose a few hundred meters and drifted away from the volcano. Incandescence was visible on clear nights at the summit and in the ravine. The MIROVA log radiative power graph showed continued moderate and high levels of thermal energy throughout the period (figure 57). Sangay also had small but persistent daily SO2 signatures during January-June 2020 with larger pulses one or more days each month (figure 58). IG-EPN published data in June 2020 about the overall activity since May 2019, indicating increases throughout the period in seismic event frequency, SO2 emissions, ash plume frequency, and thermal energy (figure 59).
Activity during January-March 2020. IG-EPN and the Washington VAAC reported multiple daily ash emissions throughout January 2020. Gas and ash emissions generally rose 500-1,500 m above the summit, most often drifting W or SW. Ashfall was reported on 8 January in the communities of Sevilla (90 km SSW), Pumallacta and Achupallas (60 km SW) and Cebadas (35 km WNW). On 16 January ash fell in the Chimborazo province in the communities of Atillo, Ichobamba, and Palmira (45 km W). Ash on 28 January drifted NW, with minor ashfall reported in Púngala (25 km NW) and other nearby communities. The town of Alao (20 km NW) reported on 30 January that all of the vegetation in the region was covered with fine white ash; Cebadas and Palmira also noted minor ashfall (figure 60).
A major ravine on the SE flank has been the site of ongoing block avalanches and pyroclastic flows since the latest eruption began in March 2019. The pyroclastic flows down the ravine appeared incandescent at night; during the day they created ash clouds that drifted SW. Satellite imagery recorded incandescence and dense ash from pyroclastic flows in the ravine on 7 January (figure 61). They were also reported by IG on the 9th, 13th, 26th, and 28th. Incandescent blocks were reported in the ravine several times during the month. The webcam captured images on 31 January of large incandescent blocks descending the entire length of the ravine to the base of the mountain (figure 62). Large amounts of ash and debris were remobilized as lahars during heavy rains on the 25th and 28th.
Observations by visitors to the volcano during 9-17 January 2020 included pyroclastic flows, ash emissions, and incandescent debris descending the SE flank ravine during the brief periods when skies were not completely overcast (figure 63 and 64). More often there was ash-filled rain and explosions heard as far as 16 km from the volcano, along with the sounds of lahars generated from the frequent rainfall mobilizing debris from the pyroclastic flows. The confluence of the Rio Upano and Rio Volcan is 23 km SE of the summit and debris from the lahars has created a natural dam on the Rio Upano that periodically backs up water and inundates the adjacent forest (figure 65). A different expedition to Sangay during 26 January-1 February 2020 by IG personnel to repair and maintain the remote monitoring station and collect samples was successful, after which the station was once again transmitting data to IG-EPN in Quito (figure 66).
During February 2020, multiple daily VAAC reports of ash emissions continued (figure 67). Plumes generally rose 500-1,100 m above the summit and drifted W, although on 26 February emissions were reported to 1,770 m. Ashfall was reported in Macas (40 km SE) on 1 February, and in the communities of Pistishi (65 km SW), Chunchi (70 km SW), Pumallacta (60 k. SW), Alausí (60 km SW), Guamote (40 km WNW) and adjacent areas of the Chimborazo province on 5 February. The Ecuadorian Red Cross reported ash from Sangay in the provinces of Cañar and Azuay (60-100 km SW) on 25 February. Cebadas and Guamote reported moderate ashfall the following day. The communities of Cacha (50 km NW) and Punín (45 km NW) reported trace amounts of ashfall on 29 February. Incandescent blocks were seen on the SE flank multiples times throughout the month. A pyroclastic flow was recorded on the SE flank early on 6 February; additional pyroclastic flows were observed later that day on the SW flank. On 23 February a seismic station on the flank recorded a high-frequency signal typical of lahars.
A significant ash emission on 1 March 2020 was reported about 2 km above the summit, drifting SW. Multiple ash emissions continued daily during the month, generally rising 570-1,170 m high. An emission on 12 March also rose 2 km above the summit. Trace ashfall was reported in Cebadas (35 km WNW) on 12 March. The community of Huamboya, located 40 km ENE of Sangay in the province of Morona-Santiago reported ashfall on 17 March. On 19 and 21 March ashfall was seen on the surface of cars in Macas to the SE. (figure 68). Ash was also reported on the 21st in de Santa María De Tunants (Sinaí) located E of Sangay. Ash fell again in Macas on 23 March and was also reported in General Proaño (40 km SE). The wind changed direction the next day and caused ashfall on 24 March to the SW in Cuenca and Azogues (100 km SW).
Incandescence from the dome at the crater and on the SE flank was noted by IG on 3, 4, and 13 March. Remobilized ash from a pyroclastic flow was reported drifting SW on 13 March. The incandescent path of the flow was still visible that evening. Numerous lahars were recorded seismically during the month, including on days 5, 6, 8, 11, 15, 30 and 31. Images from the Rio Upano on 11 March confirmed an increase from the normal flow rate (figure 69) inferred to be from volcanic debris. Morona-Santiago province officials reported on 14 March that a new dam had formed at the confluence of the Upano and Volcano rivers that decreased the flow downstream; by 16 March it had given way and flow had returned to normal levels.
Activity during April-June 2020. Lahar activity continued during April 2020; they were reported seven times on 2, 5, 7, 11, 12, 19, and 30 April. A significant reduction in the flow of the Upano River at the entrance bridge to the city of Macas was reported 9 April, likely due to a new dam on the river upstream from where the Volcan river joins it caused by lahars related to ash emissions and pyroclastic flows (figure 70). The flow rate returned to normal the following day. Ash emissions were reported most days of the month, commonly rising 500-1,100 m above the summit and drifting W. Incandescent blocks or flows were visible on the SE flank on 4, 10, 12, 15-16, and 20-23 April (figure 71).
Activity during May 2020 included multiple daily ash emissions that drifted W and numerous lahars from plentiful rain carrying ash and debris downstream. Although there were only a few visible observations of ash plumes due to clouds, the Washington VAAC reported plumes visible in satellite imagery throughout the month. Plumes rose 570-1,170 m above the summit most days; the highest reported rose to 2,000 m above the summit on 14 May. Two lahars occurred in the early morning on 1 May and one the next day. A lahar signal lasted for three hours on 4 May. Two lahar signals were recorded on the 7th, and three on the 9th. Lahars were also recorded on 16-17, 20-22, 26-27, and 30 May. Incandescence on the SE flank was only noted three times, but it was cloudy nearly every day.
An increase in thermal and overall eruptive activity was reported during June 2020. On 1 and 2 June the webcam captured lava flows and remobilization of the deposits on the SE flank in the early morning and late at night. Incandescence was visible multiple days each week. Lahars were reported on 4 and 5 June. The frequent daily ash emissions during June generally rose to 570-1,200 m above the summit and drifted usually SW or W. The number of explosions and ash emissions increased during the evening of 7 June. IG interpreted the seismic signals from the explosions as an indication of the rise of a new pulse of magma (figure 72). The infrasound sensor log from 8 June also recorded longer duration tremor signals that were interpreted as resulting from the descent of pyroclastic flows in the SE ravine.
On the evening of 8 June ashfall was reported in the parish of Cebadas and in the Alausí Canton to the W and SW of Sangay. There were several reports of gas and ash emissions to 1,770 m above the summit the next morning on 9 June, followed by reports of ashfall in the provinces of Guayas, Santa Elena, Los Ríos, Morona Santiago, and Chimborazo. Ashfall continued in the afternoon and was reported in Alausí, Chunchi, Guamote, and Chillanes. That night, which was clear, the webcam captured images of pyroclastic flows down the SE-flank ravine; IG attributed the increase in activity to the collapse of one or more lava fronts. On the evening of 10 June additional ashfall was reported in the towns of Alausí, Chunchi, and Guamote (figure 73); satellite imagery indicated an ash plume drifting W and incandescence from pyroclastic flows in the SE-flank ravine the same day (figure 74).
Ashfall continued on 11 June and was reported in Guayaquil, Guamote, Chunchi, Riobamba, Guaranda, Chimbo, Echandía, and Chillanes. The highest ash plume of the report period rose to 2,800 m above the summit that day and drifted SW. That evening the SNGRE (Servicio Nacional de Gestion de Riesgos y Emergencias) reported ash fall in the Alausí canton. IG noted the increase in intensity of activity and reported that the ash plume of 11 June drifted more than 600 km W (figure 75). Ash emissions on 12 and 13 June drifted SW and NW and resulted in ashfall in the provinces of Chimborazo, Cotopaxi, Tungurahua, and Bolívar. On 14 June, the accumulation of ash interfered with the transmission of information from the seismic station. Lahars were reported each day during 15-17 and 19-21 June. Trace amounts of ashfall were reported in Macas to the SE on 25 June.
During an overflight of Sangay on 24 June IG personnel observed that activity was characterized by small explosions from the summit vent and pyroclastic flows down the SE-flank ravine. The explosions produced small gas plumes with a high ash content that did not rise more than 500 m above the summit and drifted W (figure 76). The pyroclastic flows were restricted to the ravine on the SE flank, although the ash from the flows rose rapidly and reached about 200 m above the surface of the ravine and also drifted W (figure 77).
Infrared imagery taken during the overflight on 24 June identified three significant thermal anomalies in the large ravine on the SE flank (figure 78). Analysis by IG scientists suggested that the upper anomaly 1 (125°C) was associated with explosive activity that was observed during the flight. Anomaly 2 (147°C), a short distance below Anomaly 1, was possibly related to effusive activity of a small flow, and Anomaly 3 (165°C) near the base of the ravine that was associated with pyroclastic flow deposits. The extent of the changes at the summit of Sangay and along the SE flank since the beginning of the eruption that started in March 2019 were clearly visible when images from May 2019 were compared with images from the 24 June 2020 overflight (figure 79). The upper part of the ravine was nearly 400 m wide by the end of June.
Geologic Background. The isolated Sangay volcano, located east of the Andean crest, is the southernmost of Ecuador's volcanoes and its most active. The steep-sided, glacier-covered, dominantly andesitic volcano grew within the open calderas of two previous edifices which were destroyed by collapse to the east, producing large debris avalanches that reached the Amazonian lowlands. The modern edifice dates back to at least 14,000 years ago. It towers above the tropical jungle on the east side; on the other sides flat plains of ash have been eroded by heavy rains into steep-walled canyons up to 600 m deep. The earliest report of an eruption was in 1628. Almost continuous eruptions were reported from 1728 until 1916, and again from 1934 to the present. The almost constant activity has caused frequent changes to the morphology of the summit crater complex.
Information Contacts: Instituto Geofísico, Escuela Politécnica Nacional (IG-EPN), Casilla 17-01-2759, Quito, Ecuador (URL: http://www.igepn.edu.ec/); Global Sulfur Dioxide Monitoring Page, Atmospheric Chemistry and Dynamics Laboratory, NASA Goddard Space Flight Center (NASA/GSFC), 8800 Greenbelt Road, Goddard, Maryland, USA (URL: https://so2.gsfc.nasa.gov/); Washington Volcanic Ash Advisory Center (VAAC), Satellite Analysis Branch (SAB), NOAA/NESDIS OSPO, NOAA Science Center Room 401, 5200 Auth Rd, Camp Springs, MD 20746, USA (URL: www.ospo.noaa.gov/Products/atmosphere/vaac, archive at: http://www.ssd.noaa.gov/VAAC/archive.html); MIROVA (Middle InfraRed Observation of Volcanic Activity), a collaborative project between the Universities of Turin and Florence (Italy) supported by the Centre for Volcanic Risk of the Italian Civil Protection Department (URL: http://www.mirovaweb.it/); Sentinel Hub Playground (URL: https://www.sentinel-hub.com/explore/sentinel-playground); Arnold Binas (URL: https://www.doroadventures.com).
Suwanosejima (Japan) — July 2020 Cite this Report
Suwanosejima
Japan
29.638°N, 129.714°E; summit elev. 796 m
All times are local (unless otherwise noted)
Frequent explosions, ash plumes, and summit incandescence in January-June 2020
Suwanosejima is an active stratovolcano located in the northern Ryukyu Islands. Volcanism has previously been characterized by Strombolian explosions, ash plumes, and summit incandescence (BGVN 45:01), which continues to occur intermittently. A majority of this activity originates from vents within the large Otake summit crater. This report updates information during January through June 2020 using monthly reports from the Japan Meteorological Agency (JMA), the Tokyo Volcanic Ash Advisory Center (VAAC), and various satellite data.
During 3-10 January 2020, 13 explosions were detected from the Otake crater rising to 1.4 km altitude; material was ejected as far as 600 m away and ashfall was reported in areas 4 km SSW, according to JMA. Occasional small eruptive events continued during 12-17 January, which resulted in ash plumes that rose 1 km above the crater rim and ashfall was again reported 4 km SSW. Crater incandescence was visible nightly during 17-24 January, while white plumes rose as high as 700 m above the crater rim.
Nightly incandescence during 7-29 February, and 1-6 March, was accompanied by intermittent explosions that produced ash plumes rising up to 1.2 km above the crater rim (figure 44); activity during early February resulted in ashfall 4 km SSW. On 19 February an eruption produced a gray-white ash plume that rose 1.6 km above the crater (figure 45), resulting in ashfall in Toshima village (4 km SSW), according to JMA. Explosive events during 23-24 February ejected blocks onto the flanks. Two explosions were recorded during 1-6 March, which sent ash plumes as high as 900-1,000 m above the crater rim and ejected large blocks 300 m from the crater.
Nightly incandescence continued to be visible during 13-31 March, 1-10 and 17-24 April, 1-8, 15-31 May, 1-5 and 12-30 June 2020; activity during the latter part of March was relatively low and consisted of few explosive events. In contrast, incandescence was frequently accompanied by explosions in April and May. On 28 April at 0432 an eruption produced an ash plume that rose 1.6 km above the crater rim and drifted SE and E, and ejected blocks as far as 800 m from the crater. The MODVOLC thermal alerts algorithm also detected four thermal signatures during this eruption within the summit crater. An explosion at 1214 on 29 April caused glass in windows to vibrate up to 4 km SSW away while ash emissions continued to be observed following the explosion the previous day, according to the Tokyo VAAC.
During 1-8 May explosions occurred twice a day, producing ash plumes that rose as high as 1 km above the crater rim and ejecting material 400 m from the crater. An explosion on 29 May at 0210 produced an off-white plume that rose as high as 500 m above the crater rim and ejected large blocks up to 200 m above the rim. On 5 June an explosion produced gray-white plumes rising 1 km above the crater. Small eruptive events continued in late June, producing ash plumes that rose as high as 900 m above the crater rim.
MIROVA (Middle InfraRed Observation of Volcanic Activity) analysis of MODIS satellite data showed relatively stronger thermal anomalies in late February and late April 2020 with an additional six weaker thermal anomalies detected in early January (2), early February (1), mid-April (2), and mid-May (1) (figure 46). Sentinel-2 thermal satellite imagery in late January through mid-April showed two distinct thermal hotspots within the summit crater (figure 47).
Geologic Background. The 8-km-long island of Suwanosejima in the northern Ryukyu Islands consists of an andesitic stratovolcano with two active summit craters. The summit is truncated by a large breached crater extending to the sea on the E flank that was formed by edifice collapse. One of Japan's most frequently active volcanoes, it was in a state of intermittent Strombolian activity from Otake, the NE summit crater, between 1949 and 1996, after which periods of inactivity lengthened. The largest recorded eruption took place in 1813-14, when thick scoria deposits covered residential areas, and the SW crater produced two lava flows that reached the western coast. At the end of the eruption the summit of Otake collapsed, forming a large debris avalanche and creating an open collapse scarp extending to the eastern coast. The island remained uninhabited for about 70 years after the 1813-1814 eruption. Lava flows reached the eastern coast of the island in 1884. Only about 50 people live on the island.
Information Contacts: Japan Meteorological Agency (JMA), 1-3-4 Otemachi, Chiyoda-ku, Tokyo 100-8122, Japan (URL: http://www.jma.go.jp/jma/indexe.html); Tokyo Volcanic Ash Advisory Center (VAAC), 1-3-4 Otemachi, Chiyoda-ku, Tokyo 100-8122, Japan (URL: http://ds.data.jma.go.jp/svd/vaac/data/); MIROVA (Middle InfraRed Observation of Volcanic Activity), a collaborative project between the Universities of Turin and Florence (Italy) supported by the Centre for Volcanic Risk of the Italian Civil Protection Department (URL: http://www.mirovaweb.it/); Hawai'i Institute of Geophysics and Planetology (HIGP) - MODVOLC Thermal Alerts System, School of Ocean and Earth Science and Technology (SOEST), Univ. of Hawai'i, 2525 Correa Road, Honolulu, HI 96822, USA (URL: http://modis.higp.hawaii.edu/); Sentinel Hub Playground (URL: https://www.sentinel-hub.com/explore/sentinel-playground).
Tinakula (Solomon Islands) — July 2020 Cite this Report
Tinakula
Solomon Islands
10.386°S, 165.804°E; summit elev. 796 m
All times are local (unless otherwise noted)
Intermittent small thermal anomalies and gas-and-steam plumes during January-June 2020
Tinakula is a remote stratovolcano located 100 km NE of the Solomon Trench at the N end of the Santa Cruz. In 1971, an eruption with lava flows and ash explosions caused the small population to evacuate the island. Volcanism has previously been characterized by an ash explosion in October 2017 and the most recent eruptive period that began in December 2018 with renewed thermal activity. Activity since then has consisted of intermittent thermal activity and dense gas-and-steam plumes (BGVN 45:01), which continues into the current reporting period. This report updates information from January-June 2020 using primary source information from various satellite data, as ground observations are rarely available.
MIROVA (Middle InfraRed Observation of Volcanic Activity) analysis of MODIS satellite data showed weak, intermittent, but ongoing thermal activity during January-June 2020 (figure 41). A small cluster of slightly stronger thermal signatures was detected in late February to early March, which is correlated to MODVOLC thermal alert data; four thermal hotspots were recorded on 20, 27, and 29 February and 1 March. However, observations using Sentinel-2 satellite imagery were often obscured by clouds. In addition to the weak thermal signatures, dense gas-and-steam plumes were observed in Sentinel-2 satellite imagery rising from the summit during this reporting period (figure 42).
Three distinct thermal anomalies were observed in Sentinel-2 thermal satellite imagery on 22 January, 11 April, and 6 May 2020, accompanied by some gas-and-steam emissions (figure 43). The hotspot on 22 January was slightly weaker than the other two days, and was seen on the W flank, compared to the other two that were observed in the summit crater. According to MODVOLC thermal alerts, a hotspot was recorded on 6 May, which corresponded to a Sentinel-2 thermal satellite image with a notable anomaly in the summit crater (figure 43). On 10 June no thermal anomaly was seen in Sentinel-2 satellite imagery due to the presence of clouds; however, what appeared to be a dense gas-and-steam plume was extending W from the summit.
Geologic Background. The small 3.5-km-wide island of Tinakula is the exposed summit of a massive stratovolcano at the NW end of the Santa Cruz islands. It has a breached summit crater that extends from the summit to below sea level. Landslides enlarged this scarp in 1965, creating an embayment on the NW coast. The Mendana cone is located on the SE side. The dominantly andesitic volcano has frequently been observed in eruption since the era of Spanish exploration began in 1595. In about 1840, an explosive eruption apparently produced pyroclastic flows that swept all sides of the island, killing its inhabitants. Recorded eruptions have frequently originated from a cone constructed within the large breached crater. These have left the upper flanks and the steep apron of lava flows and volcaniclastic debris within the breach unvegetated.
Information Contacts: MIROVA (Middle InfraRed Observation of Volcanic Activity), a collaborative project between the Universities of Turin and Florence (Italy) supported by the Centre for Volcanic Risk of the Italian Civil Protection Department (URL: http://www.mirovaweb.it/); Hawai'i Institute of Geophysics and Planetology (HIGP) - MODVOLC Thermal Alerts System, School of Ocean and Earth Science and Technology (SOEST), Univ. of Hawai'i, 2525 Correa Road, Honolulu, HI 96822, USA (URL: http://modis.higp.hawaii.edu/); Sentinel Hub Playground (URL: https://www.sentinel-hub.com/explore/sentinel-playground).