Report on Kilauea (United States) — February 2013
Bulletin of the Global Volcanism Network, vol. 38, no. 2 (February 2013)
Managing Editor: Richard Wunderman.
Kilauea (United States) 2009 highlights: Waikupanaha ocean entry ceases, lava enters Halema`uma`u
Please cite this report as:
Global Volcanism Program, 2013. Report on Kilauea (United States) (Wunderman, R., ed.). Bulletin of the Global Volcanism Network, 38:2. Smithsonian Institution. https://doi.org/10.5479/si.GVP.BGVN201302-332010
Kilauea
United States
19.421°N, 155.287°W; summit elev. 1222 m
All times are local (unless otherwise noted)
This report discusses eruptive highlights at Kīlauea during 2009, with occasional reference to earlier and later events. Within the E rift zone, Pu`u `O`o crater was relatively quiet during 2009, while lava flows escaping from the Thanksgiving Eve Breakout (TEB) tube system continued to feed emissions along the SE coast. Along the E portion of the TEB system, the Waikupanaha ocean entry remained active for up to 363 days during 2009 before ceasing altogether on 4 January 2010. Along the W branches and ocean entries of the TEB tube system, lava emissions halted in July 2009.
At Kīlauea's summit, lava returned to the active vent within Halema`uma`u crater in January 2009, ending a pause in lava emissions there that began in December 2008. The active vent's shape was explored using Lidar, and in mid-2009 the lava lake's surface sat ~200 m below the floor of Halema`uma`u crater. The active vent underwent numerous cycles of lava rise, surface cooling, and collapse. Unless otherwise noted, all information in this report is from USGS Hawaiian Volcano Observatory (HVO) reports.
Pu`u `O`o crater quiescence. During the first four months of 2009, heavy fuming at Pu`u `O`o prevented visual observation of areas within the crater. HVO reported gas-rushing noises, but nothing unusual in available views from Forward Looking Infrared Radiometer (FLIR) thermal imaging. FLIR instruments detect infrared radiation, and produce calibrated thermal videos and still images.
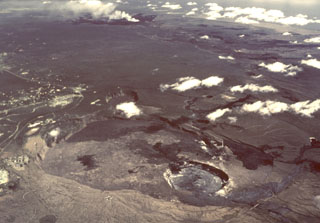
On 15 May, favorable wind directions provided clear views of the crater floor. Observers reported patches of less broken, ponded surfaces near locations previously observed as spattering vents, as well as a V-shaped trough that ran SW-NE traversing the length of the crater (figure 197). They also observed an incandescent, fuming vent emitting puffing sounds in the NE part of the crater (also heard during a later visit in June), and an unseen vent distinguished by sounds on the W end of the crater floor (figure 197). Until October, further observation was limited to FLIR imagery, showing a few small, hot vents on the crater floor.
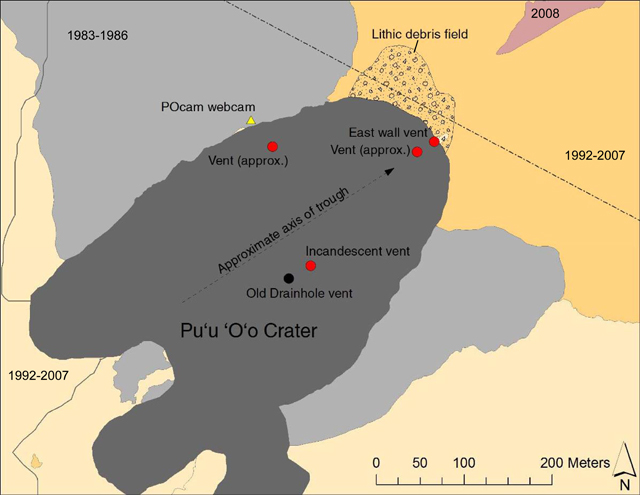 |
Figure 197. Map of Pu`u `O`o crater (dark gray) and vicinity showing active vents during 2009 (red dots) and the V-shaped trough (dashed line) that was observed on 15 May 2009. The webcam (POcam) location on the crater's rim is indicated by the yellow triangle. Other mapped units correspond to previous flow fields emplaced in 1983-1986 (light gray), 1992-2007 (tan and orange), and 2008 (pink, top right); during 1986-1992, lava flows were emplaced outside of the mapped area. A small lithic debris field observed on the NE rim on 2 December 2009 is also indicated. Courtesy of USGS-HVO. |
Crater glow at Pu`u `O`o was observed via webcam on most nights during the last three months of 2009. Ground observation on 2 December revealed a small (estimated3) surficial deposit of lithic lapilli and small blocks on the NE rim from a small explosion estimated to have occurred as early as 23 September (figure 197). The lithic debris was most likely sourced from one of the nearby vents on the NE crater wall.
During 2009 (and possibly since August 2007), a series of collapses removed a significant portion of the N crater rim. HVO reported that the series of collapses removed some of the highest points of the summit of the Pu`u `O`o rim, thus lowering the local elevation by a few meters.
Flow field and coastal plain breakouts and changes. Lava flows emplaced during 2009 covered an area of 6.5 km2, most of which covered previous lava flows; only 0.8 km2 of vegetated land (chiefly forested kipukas within the flow field) was overrun by lava (2009 flow field changes are shown in figure 198).
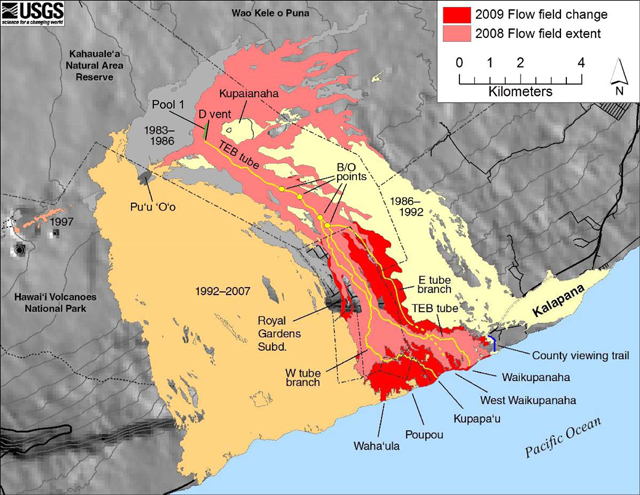 |
Figure 198. Map of the changes to Pu`u `O`o's 21 July 2007 eruption flow field during 2009. The pre-existing (July 2007-2008) extent of the flow field is shown in pink, and the 2009 flow field additions are shown in red. Note that the portions of 2009 lava flows that overran the 2008 flow field extent are not represented, only changes to the extent of the July 2007-2008 flow field in 2009. The TEB tube system is shown in yellow with points where lava escaped to the surface, breakout points, indicated ('B/O points'). Ocean entries are indicated and labeled along the coast. Pool 1 (green) indicates the location of a lava lake roof collapse (discussed in text). Flow fields active during 1983-86 are shown in light gray, 1986-92 shown in light yellow, and 1992-2007 shown in orange. Courtesy of USGS-HVO. |
The TEB vent and rootless shields (a pile of lava flows built over a known lava tube rather than over a conduit feeding magma; explained in BGVN 27:03) showed little change in early 2009, with small (most <300 m long) breakout-fed lava flows occurring occasionally during February and March on the fault scarp and cliffs (pali) in the Royal Gardens subdivision (figure 198) and the upper flow field. In early March, a breakout-fed lava flow reached the ocean, establishing the Kupapa`u ocean entry, which was active for a few months (discussed below) and consisted of several points where lava entered the sea (entry points). The long-lived Waikupanaha ocean entry (active since 5 March 2008) frequently produced littoral explosions and underwent delta collapses.
Other short-lived ocean entries occurred during this time, stemming from coastal plain breakouts from the W branch of the TEB tube system. These breakouts often slowed or stopped in harmony with deflation-inflation (DI) events at the summit. DI events, measured by tiltmeters at Kīlauea's summit, are thought to result from changes in magma supply to a storage reservoir less than 1 km deep and just E of Halema`uma`u crater. These fluctuations often propagate through the magmatic system, and are usually measured by another tiltmeter at Pu`u `O`o crater a few hours later. Typically occurring over weekly timescales during 2009 (up to a few days of deflation, followed by up to a few days of inflation; figure 199), DI events often correlate to pulses and/or pauses in lava emission at E rift zone vents.
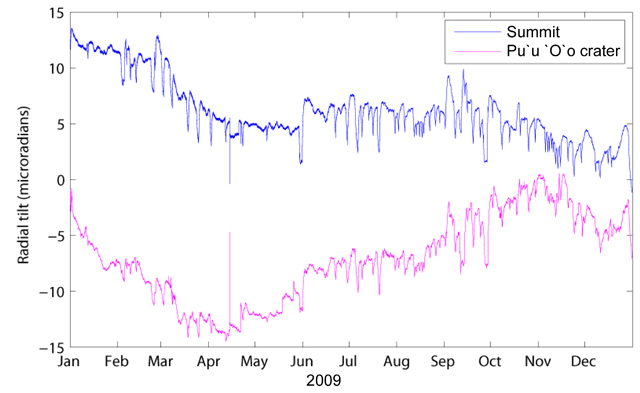 |
Figure 199. Radial deformation recorded by tiltmeters at Kīlauea's summit (blue) and Pu`u `O`o crater (pink) during 2009. The sawtooth patterns delineate what have come to be called deflation-inflation (DI) events, which typically occurred over weekly timescales during 2009. The timing and behavior of DI events often coincided with vent collapses at Kīlauea's summit and decreases or pauses in lava effusion along the E rift zone. Courtesy of USGS-HVO. |
On 8 March 2009, the pool 1 lava lake roof (labeled in figure 198, feeding a perched lava channel - a lava channel with walls built up from previous overflows - from the 21 July 2007 fissure eruption, BGVN 34:03) collapsed. Subsequent cooling and further collapses during 11-19 March caused the channel to seal. No further active lava was observed in pool 1.
By 29 April, surface lava flows leading to the Kupapa`u ocean entry were no longer visible. This observation was taken to indicate that a tube branch leading to the Kupapa`u entry had been established. Later, during May-June, the multiple entries at Kupapa`u coalesced into one entry point. This entry was weaker and less persistant than the Waikupanaha entry and never formed a significant delta. Lava flows at the Kupapa`u entry pulsated in a manner closely correlated to DI events, unlike flows at the Waikupanaha entry, and the Kupapa`u ocean entry ceased by 21 July.
The onset of a strong DI event correlated with a breakout on June 1 from the Waikupanaha branch of the TEB tube system. Although beginning slowly, it remained active through mid-August. As is common, the flows slowed during deflation stages of DI events, and advanced further during inflation stages.
The Waikupanaha entry underwent common delta collapses throughout the year. The vigor of lava effusion at the entry, however, made up for the area lost to collapses, and the size of the delta continued to increase. The only known pause in lava entering the sea at Waikupanaha during 2009 occurred during a DI event, when the entry stopped for two days during 28-29 September.
On 31 October, surface lava flows reached the ocean ~700 m W of Waikupanaha, and established the W Waikupanaha entry. The new entry point was fed by an inferred secondary lava tube crossing over the main Waikupanaha tube branch (see the dashed portion of the yellow line labeled 'E Tube Branch', figure 198). Following the termination of the W Waikupanaha entry on 17 December, HVO concluded that its feeder tube had eroded down into the main Waikupanaha tube, thus tapping off its supply. Breakouts and surface flows during the end of the year continued to be affected by DI events.
Second longest ocean entry ceases. A large and prolonged DI event at Kīlauea's summit in December correlated with a brief pause in lava effusion at the E rift zone. As a result, by 4 January 2010, lava ceased entering the ocean at Waikupanaha after 22 months of near-continuous lava entry. This was the second longest ocean entry in the history of the eruption, being about half a month shorter than the 2005-2007 E Lae`apuki entry.
Lava lake returns to Kīlauea's summit. A lull in activity at Halema`uma`u crater began in mid-December 2008; on 14 January 2009, rockfall sounds returned to the summit, attributed to rising lava digesting talus slopes along the steep walled vent. Four days later, gas-rushing sounds, increased temperature, and collapses of the vent rim (figure 200) occurred, dusting nearby areas with ash and further marking the summit's re-awakening.
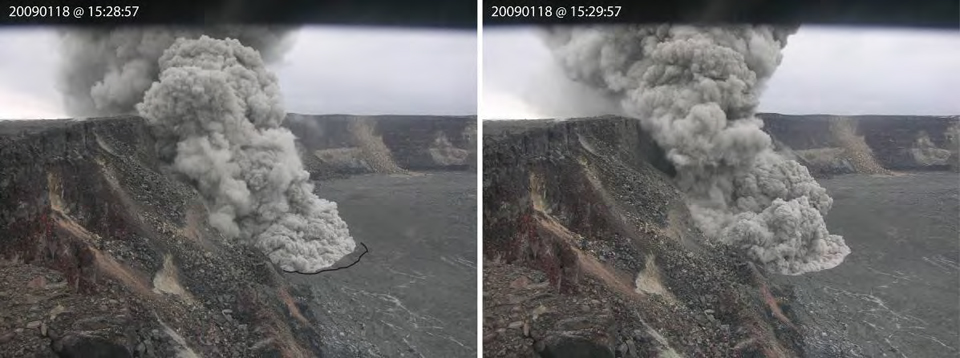 |
Figure 200. Time lapse photographs of a collapse of a portion of the Halema`uma`u vent rim, Kīlauea, taken one minute apart (at 1528 and 1529) on 18 January 2009. The black line in the left frame indicates the area of collapse, which is absent in the right frame. Courtesy of USGS-HVO. |
Vent glow, temperature increases, gas-rushing noises, and production of vitric ash continued during early 2009, indicating fresh lava had ascended to a shallow level in the vent. These eruption related processes fluctuated in a manner that suggested that they were moderated by in-falling crater walls burying the vent bottom.
Onset of a DI event on 3 February correlated with the retreat of the lava within the vent, removing support for the rubble clogging the vent cavity and collapsing the rubble into the cavity. This disturbance was accompanied by an ash plume that was sustained for 8 minutes. FLIR images captured the following day disclosed a lava lake situated deep within the vent (the rubble clogging the vent cavity was gone). HVO noted upwelling on the lake's E side, draining and filling events (figure 201) and spattering from the lake. Similar fluctuations at Halema`uma`u occurred in concert with DI events through late April.
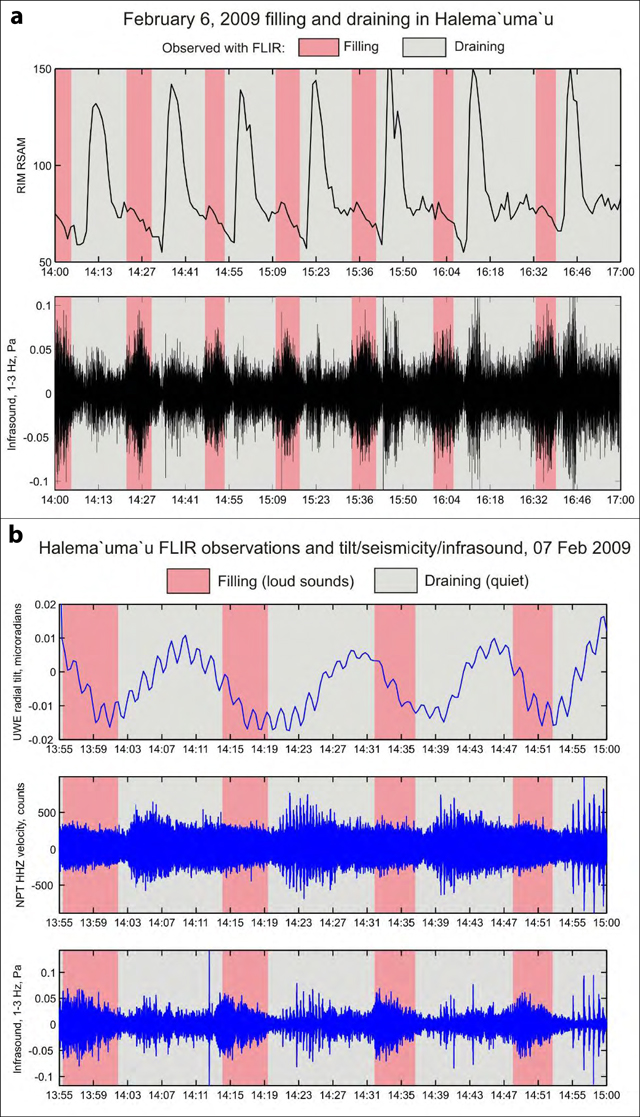 |
Figure 201. Observational and geophysical data highlight filling (pink) and draining (gray) cycles at Kīlauea's summit vent within Halema`uma`u crater. (a) Filling and draining cycles over 3 hours on 6 February 2009 were observed with FLIR, and compared with seismicity (Realtime Seismic Amplitude Measurement - RSAM - , top) and infrasound (sound at lower than audible frequencies, bottom). RSAM provides rapid analysis of ground-motion amplitudes across multiple stations; measurements are unitless and usually reported as 'RSAM units'. (b) Filling and draining cycles over ~1 hour on 7 February 2009 were observed via acoustic noises and compared with tilt (top), seismicity (middle, reported in instrument counts, here representing the seismometer response to the vertical component of ground motion velocity), and infrasound (bottom). Courtesy of USGS-HVO. |
On 28-29 April 2009, a series of collapses at the vent within Halema`uma`u dislodged rubble and tephra covering the lava surface within the vent. As a result, for the next two months, particle emissions became > 50% juvenile (figure 202). Tephra emissions (juvenile, or glassy, and lithic components) have been measured nearly daily at Halema`uma`u since April 2008 by collecting passively emitted tephra (i.e. derived from non-explosive activity) in an array of buckets deployed around the vent. The resulting assessments led to the compilation of isomass maps and calculations of the total mass emitted (Swanson and others, 2009). By 6 May, bubbling and churning at the lava lake surface was visible with the naked eye.
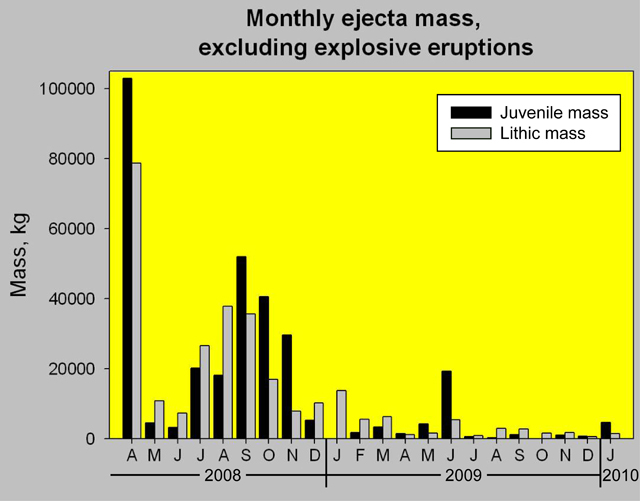 |
Figure 202. Calculated monthly ejected mass of tephra from Kīlauea's summit during April 2008-January 2010. The histogram excludes any explosive eruptions during that period. Collected tephra were assigned to one of two components: juvenile (glass, shown in black) and lithic (lava, shown in gray). Note that more than half of the mass ejected during May-June 2009 was juvenile, following a series of collapses on 28-29 April. See text or Swanson and others (2009) for a description of the daily tephra emission measurement technique. Courtesy of USGS-HVO. |
A strong DI event in early June (reflected in the E rift zone by breakouts on the pali on 1 June, see above) marked the peak of lava activity within Halema`uma`u crater during 2009. The vent's lava lake showed strong upwelling in the NE, at times forming a dome-shaped fountain. The surface of the lava lake was circulating rapidly enough to prevent any significant crust from forming. The lava lake's circulation and activity slowed near the end of June and its surface appeared almost completely crusted over. A tripod mounted Lidar (T-Lidar) survey of the vent during 10-12 June indicated that the lava surface was ~207 m below the floor of Halema`uma`u crater (figure 203).
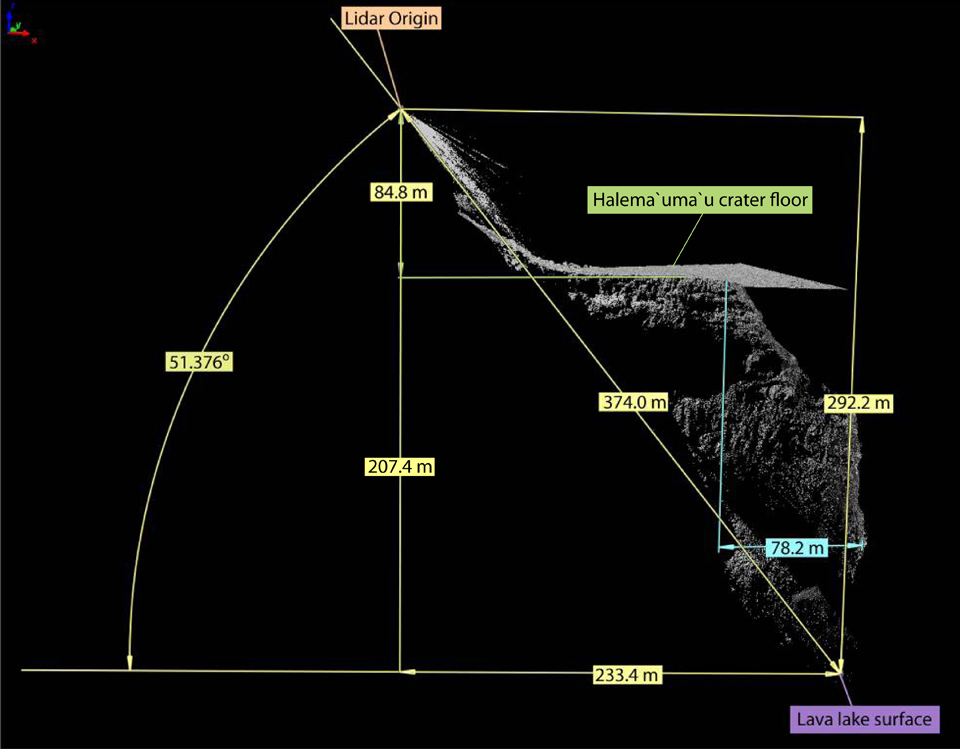 |
Figure 203. 2-D projection of 3-D reconstruction of the Halema`uma`u crater vent as measured by a T-Lidar survey on 10-12 June 2009. The reconstruction (gray) is shown on a black background. The T-Lidar was shot from the Halema`uma`u crater rim, adjacent to the active vent. The plane projected here trends approximately NNE-SSW. The lava surface (indicated in purple at the bottom) was measured to be ~207 m below the floor of Halema`uma`u crater (indicated in green). Various other dimensions of the vent's geometry are shown. Image by Todd Ericksen, University of Hawaii-Manoa; courtesy of USGS-HVO. |
On 30 June, a series of significant collapses of the vent wall again clogged the vent with rubble. For the following several days, lava appeared through the rubble and established a ponded surface. The lava retreated during a DI event on 4 July, and the vent became very quiet until mid-August. On the night of 9 August, the vent emitted a faint glow. Areas of degassing appeared within days, but the vent floor lacked visible molten material.
On 13 September, lava reappeared briefly, but a DI event a few days later coincided with another vent-wall collapse, again covering the lava surface. The vent floor collapsed further on 26 September, and two days later, lava had re-entered the vent and webcam videos confirmed the filling and draining behavior of the lava surface. This collapse coincided with a strong hybrid earthquake with large very-long-period waveforms. Hybrid earthquakes at Kīlauea typically begin as high-frequency earthquakes (similar to local earthquakes or rockfalls), then transition to long- and sometimes very-long-period oscillations. During 2009, hybrid earthquakes (i.e. the 26 September event) and ongoing very-long-period tremor at Kīlauea's summit suggested a source location beneath the summit, and within ~500 m above or below sea level.
The lava level within the vent fluctuated until the lava surface froze and sealed shut. It collapsed again on 18 November, revealing a fresh and mobile lava surface. Similar fluctuations and crusting of the lava surface continued through the end of 2009, when the lava level again dropped out of view deep below the Halema`uma`u crater floor.
2009 deformation trends. Satellite based radar interferometry determined that broad-scale deformation at Kīlauea during 2009 was marked by subsidence of the summit and E rift zone (figure 204; see the report on Mauna Loa, BGVN 37:05, for an explanation of the technique). This pattern was interpreted as deflation of the magma system, with displacement of the S flank towards the sea. Deflation also occurred in the E rift zone, but ceased by September. 64 DI events were recorded during 2009, a record number of short-lived DI events since they have been monitored. The largest and longest DI events tended to coincide with decreases or pauses in lava effusion in the E rift zone, and vent collapses at the summit (discussed above, figure 199).
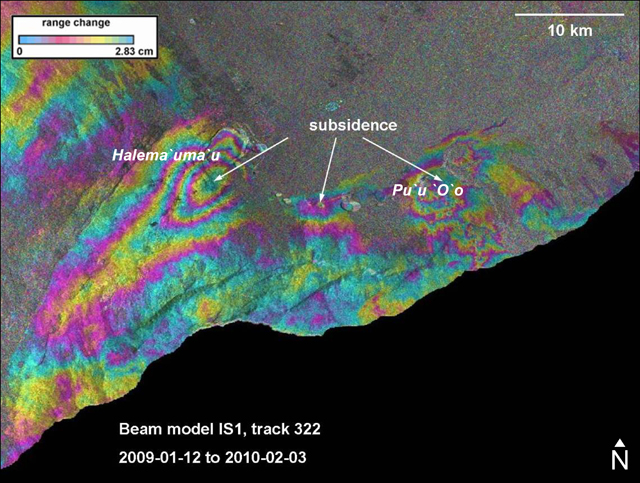 |
Figure 204. Subsidence and deflation of Kīlauea and the E rift zone during 2009, as seen in an ENVISAT interferrogram spanning 12 January 2009 to 3 February 2010. Approximately 8 cm of subsidence occurred at Kīlauea's summit (Halema`uma`u crater, which is labeled), and ~6 cm of subsidence occurred in the E rift zone near Pu`u `O`o crater. Colored stripes indicate offsets as shown in the scale, top right (see Mauna Loa report in BGVN 37:05 for an explanation of the technique). The image was acquired with an incidence angle of 18° with the ground, looking W to E. Courtesy of USGS-HVO. |
Hexahydrite spherules discovered at Kīlauea's summit.While collecting Pele's hair on 30 March, HVO scientists discovered and collected small (less than 3 mm diameter), extremely fragile, white spherules that were stuck into wads of Pele's hair (figure 205).
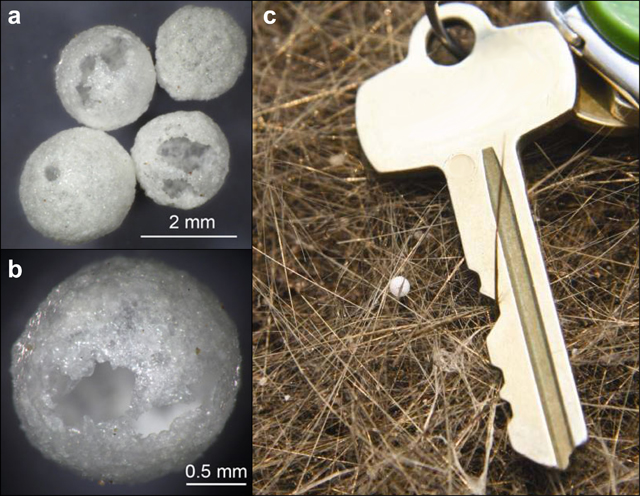 |
Figure 205. Hexahydrite (MgSO4·6H2O) spherules discovered and collected from just S of Kīlauea's summit vent in 2009. Photomicrographs (a, b) with scales show surface and textural details of the spherules. An in-situ photograph (c, key for scale) shows the spherules as they were found, within wads of Pele's hair. From Hon and Orr (2011). |
X-ray diffraction revealed that the spherules were nearly pure magnesium-sulfate hexahydrite (MgSO4·6H2O). Hon and Orr (2011) proposed that the spherules form from the percolation of rainwater through vesicular vent rocks, enriching the water in soluble sulfates. Magnesium sulfate resists precipitation owing to its higher solubility, and most other hydrothermal minerals would precipitate from the enriched fluid sooner. Hon and Orr (2011) suggested that boiling of the residual magnesium sulfate enriched fluids formed a foam of magnesium sulfate-coated bubbles, which formed the spherules when the bubbles were subsequently entrained into the eruptive plume.
Petrologic trends, shallow magma mixing. Through long-term petrologic monitoring and analysis of Kīlauea's summit and E rift zone lavas, HVO scientists noted that the weight percent MgO (an indicator of the temperature of tapped magmas) of E rift zone lavas indicated well-buffered, shallow magma conditions that were maintained by "near-continuous recharge and eruption." Similarly, textural and compositional evidence highlighted pre-eruptive magma mixing between a shallow, cooler, degassed component and a gaseous, hotter, recharge magma component. Combined, the two components are erupted as a hybrid lava at the E rift zone.
Interestingly, since 2001, increased magma supply (interpreted from cross-summit extension distance) has correlated with an increase in the shallower, degassed magma component in the E rift zone lavas (interpreted from MgO weight percent; figure 206). HVO reported that this inverse relationship (higher magma supply coincident with cooler erupted lavas) is explained by more efficient flushing of the shallow edifice during times of increased magma supply.
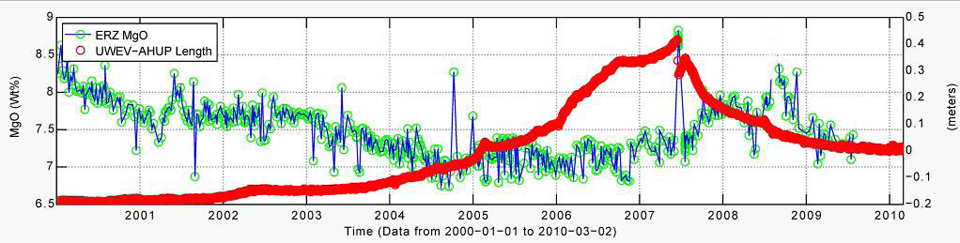 |
Figure 206. MgO weight percent (green points and blue trend, left axis) plotted versus Kīlauea's cross-summit extension distance (red, right axis) during 2000-2009 shows an inverse relationship between magma supply (i.e. variations in cross-summit extension) and the temperature of erupted lavas (i.e. variation in MgO weight percent). Courtesy of USGS-HVO. |
Summit gas emissions exceed health standards. Based on Flyspec measurements, the total SO2 emissions from Kīlauea in 2009 (~0.72 x 10⁶ tons) were 35% less than in 2008 (the highest annual SO2 emissions since measurements began in 1979, correlating to the opening of a new vent in Halema`uma`u crater; BGVN 35:01). Of the total 2009 emissions, ~60% and ~40% were attributed to the E rift and the summit, respectively (figure 207). Although 2009 emissions were down from the previous year, a record number of Ambient Air Quality exceedences occurred at the summit during 2009 (figure 208).
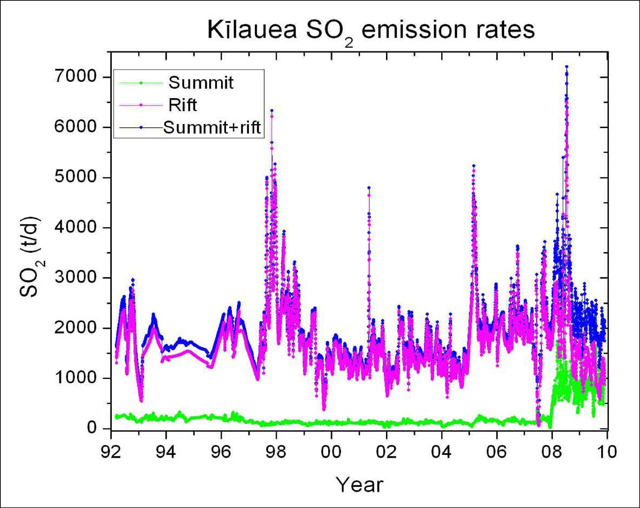 |
Figure 207. Daily average SO2 emissions from Kīlauea's summit (green) and from the E rift (pink) during 1992-2009. The total daily average emissions are shown in blue. 2008 marked an increase in emissions from the summit (and the highest annual SO2 emissions since measurements began in 1979) correlating with the opening of a new vent in Halema`uma`u crater (BGVN 35:01). In 2009, although total emissions were down 35% from 2008, summit emissions remained elevated. Courtesy of USGS-HVO. |
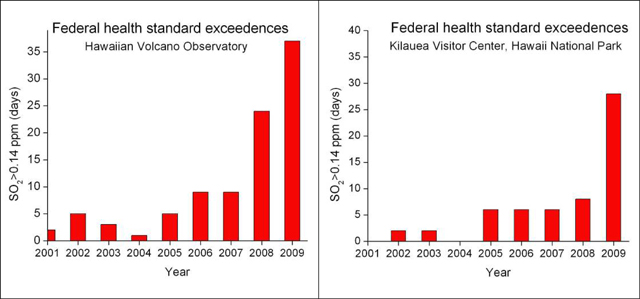 |
Figure 208. Histograms show the number of days per year that the Ambient Air Quality standard was exeeded, as monitored at the HVO building (left) and at the Kīlauea Visitor Center (right) since 2001. Since air quality monitoring began, the standard was exceeded most often in 2009. Courtesy of USGS-HVO. |
Vog health concerns. A recent clinic study by Longo and others (2010) highlighted the health effects of increased volcanic air pollution (volcanic smog, or 'vog') exposure at Kīlauea, and identified population subgroups who are more susceptible to the effects of vog. They found that periods of increased vog emission and exposure coincide with increases in medical visits for "cough, headache, acute pharyngitis, and acute airway problems." Among previously identified population subgroups with increased susceptibility to health problems from exposure to vog, Longo and others (2010) found a specific correlation with Pacific Islander children living in exposed rural communities. The native children showed higher rates of acute respiratory effects both in times of low- and high-vog emissions. Longo and others (2010) suggested that this unique population showed the highest vulnerability due to physiological and genetic contributions, as well as the built environment and a lack of prevention efforts for vog exposure.
References. Hon, K., and Orr, T., 2011, Hydrothermal hexahydrite spherules erupted during the 2008-2010 summit eruption of Kīlauea Volcano, Hawai`i, Bulletin of Volcanology, 73(9), pgs. 1369-1375.
Longo, B.M., Yang, W., Green, J.B., Crosby, F.L., and Crosby, V.L., 2010, Acute health effects associated with exposure to volcanic air pollution (vog) from increased activity at Kīlauea in 2008, Journal of Toxicology and Environmental Health, Part A, 73(20), pgs. 1370-1381.
Swanson, D., Wooten, K., and Orr, T.R., 2009, Mass flux of tephra sampled frequently during the ongoing Halema'uma'u eruption [abs.], Eos, Transactions, American Geophysical Union, v. 90, no. 52 (fall meeting supplement), abstract no. V52B-01.
Geological Summary. Kilauea overlaps the E flank of the massive Mauna Loa shield volcano in the island of Hawaii. Eruptions are prominent in Polynesian legends; written documentation since 1820 records frequent summit and flank lava flow eruptions interspersed with periods of long-term lava lake activity at Halemaumau crater in the summit caldera until 1924. The 3 x 5 km caldera was formed in several stages about 1,500 years ago and during the 18th century; eruptions have also originated from the lengthy East and Southwest rift zones, which extend to the ocean in both directions. About 90% of the surface of the basaltic shield volcano is formed of lava flows less than about 1,100 years old; 70% of the surface is younger than 600 years. The long-term eruption from the East rift zone between 1983 and 2018 produced lava flows covering more than 100 km2, destroyed hundreds of houses, and added new coastline.
Information Contacts: Michael Poland, Hawaiian Volcano Observatory (HVO), U.S. Geological Survey, PO Box 51, Hawai'i National Park, HI 96718, USA (URL: https://volcanoes.usgs.gov/observatories/hvo/).