Report on Kilauea (United States) — August 2016
Bulletin of the Global Volcanism Network, vol. 41, no. 8 (August 2016)
Managing Editor: Edward Venzke.
Edited by A. Elizabeth Crafford.
Kilauea (United States) June 27th flow ceases; new flow from Pu'u 'O'o Crater's E flank heads SE
Please cite this report as:
Global Volcanism Program, 2016. Report on Kilauea (United States) (Crafford, A.E., and Venzke, E., eds.). Bulletin of the Global Volcanism Network, 41:8. Smithsonian Institution. https://doi.org/10.5479/si.GVP.BGVN201608-332010
Kilauea
United States
19.421°N, 155.287°W; summit elev. 1222 m
All times are local (unless otherwise noted)
Hawaii's Kīlauea volcano continues the long-term eruptive activity that began in 1983 with lava flows from the East Rift Zone (ERZ) and convecting lava inside Halema'uma'u crater. The US Geological Survey's (USGS) Hawaiian Volcano Observatory (HVO) has been monitoring and researching the volcano for over a century since its founding in 1912. HVO provided quarterly reports of activity for January-June 2016, which are summarized below.
The lava lake at Halema'uma'u continued to rise and fall, with regular rockfalls and veneer collapses that sent spatter onto the Overlook on a number of occasions. The June 27th lava flow officially ended in early June 2016 after a new flow emerged from a side vent of Pu'u 'O'o in late May. That flow headed SE toward the ocean into areas where lava flows had not been active since 2013.
Activity at Halema'uma'u. Typical activity continued at Halema'uma'u for the first half of 2016. Rockfalls and veneer collapses from the crater wall caused short-lived (minutes to hours) spattering episodes around the lake margins, and the continuing north-to-south lava lake circulation led to intermittent spattering at the SE sink, (the SE corner of the lake where downwelling occurs).
Days-long oscillations in the lava lake level correlated with changes in summit pressure, as represented by the regular DI (Deflation-Inflation) events. At its lowest (20 February), the lava lake was ~50 m below the crater floor. The lake rose into view from the Jagger overlook multiple times throughout the period (28-29 February, 2 March, 3-4 April; 4 May, 16-17, 24, and 28 June). At its highest (4 April), the lava lake was ~22 m below the rim of the crater (i.e., the floor of Halema'uma'u).
Several vent rim collapses occurred during the period, including two (2 January at 1417 HST and 8 January at 0351 HST) that were large enough to trigger explosive events and very-long-period (VLP) seismicity. The 2 January event was caused by a collapse from the east wall, ejecting lapilli and small bombs onto the Halema'uma'u rim at the visitor's overlook. The 8 January event, triggered by a rockfall from the SE wall directly above the SE sink, was much larger, bombarding the overlook area with lapilli and bombs.
Other significant collapses occurred at 0318 on 4 January (NE rim), at 0023 on 14 February (NW rim), and at 0047 on 21 February (NNW rim). These were accompanied by VLPs and small explosions, but no material larger than ash reached the Halema'uma'u rim.
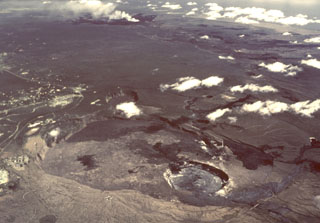
Activity at Pu'u 'O'o. There were several lava flows within the current crater at Pu'u 'O'o during the period. These flows were fed from the vent in the NE embayment and the two vents in the S embayment (figure 258), and added a few meters of fill to the crater. The larger flows erupted on 1 January, 8-9 February, 24 February, 29 February, 2-6 March, and 23-24 March. From 29 April to 14 May, flows again erupted intermittently onto the crater floor from those same vents. When measured on 9 May, the west side of the main crater floor was 12.5 m below the edge, which was the shallowest it had been since June 2014.
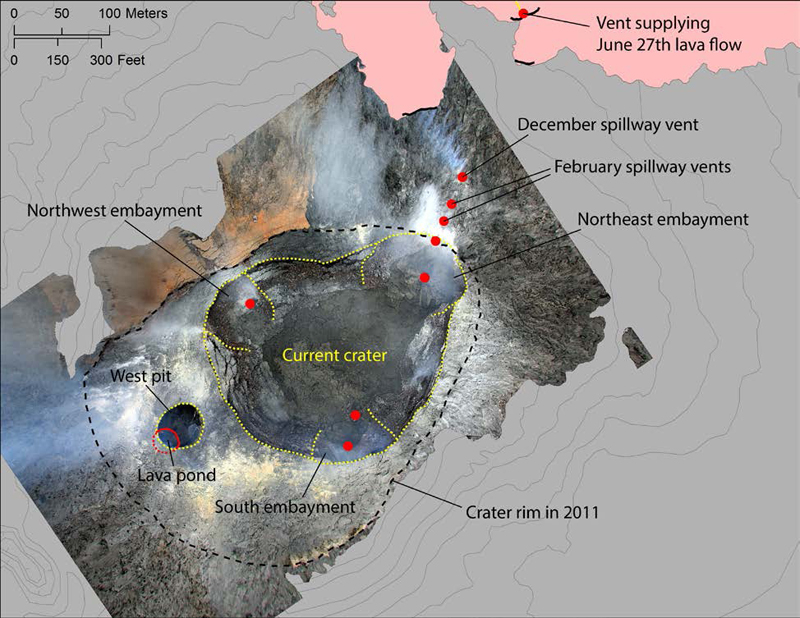 |
Figure 258. Map showing configuration of crater and vents at Kīlauea's Pu'u 'O'o crater in March 2016. See text for details. Courtesy of HVO (2016 Q1 Quarterly Report). |
In addition to filling by lava flows, the crater also shallowed through endogenous uplift. The thermal webcam recorded three instances (the first week of January, the last week of February, and late April through late May) of the crater floor gradually rising. These instances occurred during periods of relatively rapid inflation, as recorded on the nearby POC tiltmeter, which HVO interprets to be caused by pressurization of the underlying magma body.
The West Pit at Pu'u 'O'o continued to host an active lava pond ~27 m across, tucked partly back under the overhanging west edge of the pit. On 9 May the pond level was measured at ~11.5 m below the pit rim, its highest measured level to date, indicating that like the rest of the adjacent crater, it also filled during the period.
Important changes occurred on the upper flanks of Pu'u 'O'o cone during the first half of 2016. The vent that opened on the northeast spillway in early December (BGVN 41:02, figure 255) sealed shut between 19 January and 12 February. Two new flank vents opened up on the northeast spillway during the same time interval (figure 258, "February spillway vents"). These new openings were located higher on the cone, closer to the crater rim at the Northeast embayment.
The two new flank vents opened along a line extending from the outgassing source on the wall of the northeast embayment, through the December flank vent on the spillway, and to the vent for the June 27th lava flow. HVO speculated that this alignment traces the top of the dike that was the source of the June 27th lava flow.
The uppermost of the new openings ejected spatter at least twice: once between 12 February and 4 March, and again between 4 and 25 March. The second time, lapilli and oxidized lithic fragments from the vent walls were ejected to a greater distance (up to 40 m). A small lava flow also erupted from the middle of the three spillway vents between 4 and 25 March. A ~4-m-high spatter cone grew over the farthest downslope vent in mid-May, and aerial views into the upper vent in mid-June revealed that it was a window onto a 15–20 m deep cavity with two fast-moving lava streams that disappeared to the northeast (see below).
Activity along the East Rift Zone (ERZ). The June 27th lava flow (also now referred to as Episode 61e) widened into the forest towards the north of the East Rift Zone through late May 2016, although activity had slowed significantly in that area by the end of March (figure 259). Surface breakouts through late February were generally scattered across the flow field between about 1.5 and 6 km NE of the June 27th flow vent, except for a small breakout just under a kilometer from the vent in early January. In late February, a narrow lobe began to advance through forest along the north margin of the flow, eventually stalling 7.6 km from the vent at the end of March. This activity was fed by the November 25 breakout (see figure 259). Breakouts remained active along the forest boundary through late May. There was also a smaller breakout from the tube near the perched channel that sent flows to the east through the end of March, on the south side of the main Episode 61e flow field (figure 259).
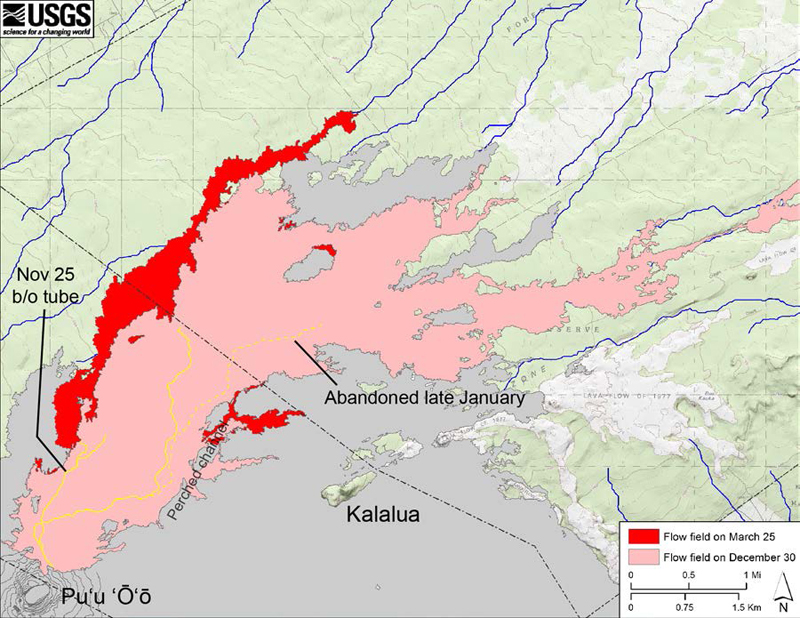 |
Figure 259. Map of the Episode 61e flow field (June 27th flow) at Kīlauea, showing changes between 30 December 2015 and 25 March 2016. Lava tubes are shown with yellow lines; dashed where abandoned during the report period. See text for the detailed description of flows. Courtesy of HVO (2016 Q1 Quarterly Report). |
The distal part of the original June 27th tube NE of the perched channel also fed some minor breakouts through late January, when that section of tube was abandoned. HVO believes that this was probably the consequence of a reduced amount of lava reaching that part of the tube, with much of the lava supply being taken by the upper tube November 25 breakout.
This configuration of active lava flows from Pu'u 'O'o changed rapidly beginning on 24 May 2016 when gradual pressurization of the magma body culminated in two new breakouts from its flanks. The northern breakout (Episode 61f; ~820 m elevation) started at about 0650 from the same vent as the Episode 61e (June 27th) flow, sending a fast-moving channelized flow to the base of Pu'u 'O'o within minutes (figure 260). A second breakout (Episode 61g; ~790 m elevation) started about 40 minutes later on the E flank of the cone, about 500 m below the crater rim (figure 261), and was preceded by a migrating bulge of the ground surface that propagated from the general direction of the Episode 61e/f vent.
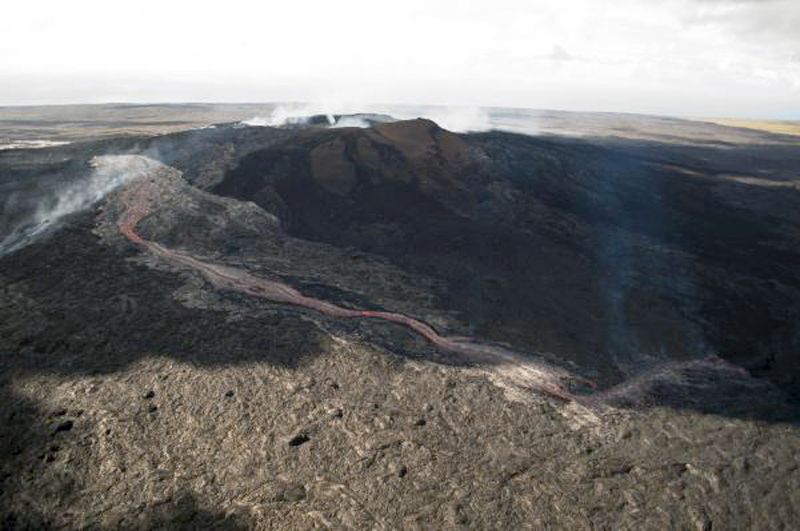 |
Figure 260. View looking south of the northern breakout point (Episode 61f) at Kīlauea's Pu'u 'O'o cone on 24 May 2016 at approximately 0830 HST. This flow only lasted into early June. Courtesy of HVO (2016 Q2 Quarterly Report). |
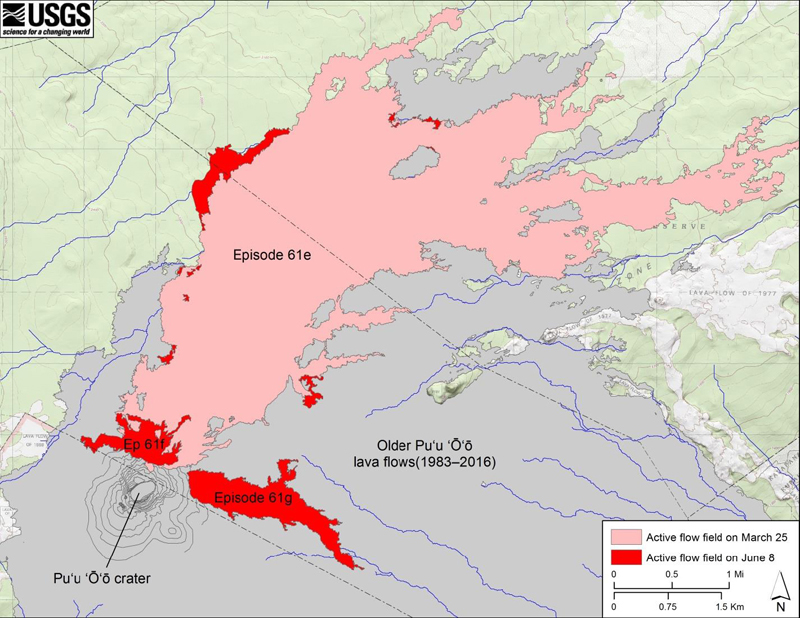 |
Figure 261. Map showing flow field change on the East Rift Zone (ERZ) at Kīlauea from 25 March to 8 June 2016. Courtesy of HVO (2016 Q2 Quarterly Report). |
The onset of episodes 61f and 61g was accompanied by a short-lived deflation at Pu'u 'O'o; the crater floor began a slow subsidence that continued into late June. When observed on 2 June, the lava pond in the West pit was ~24 m below the pit rim. The breakout at Pu'u 'O'o was followed by a slightly larger than usual DI event at Halema'uma'u crater. The summit then resumed gradual inflation overprinted by repeated DI events (figure 262).
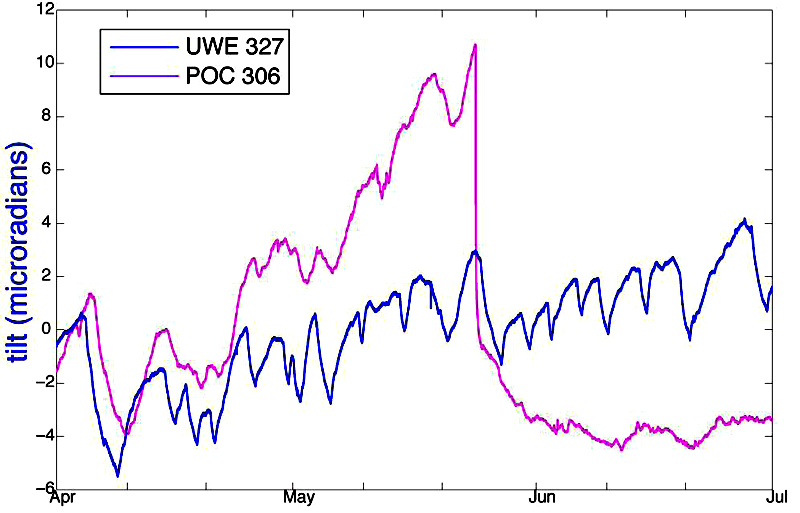 |
Figure 262. Radial tilt measured by borehole instruments at the summit of Kīlauea (UWE, in blue, on the NE rim of the caldera) and at Pu'u 'O'o (POC, in pink, on the N flank of the cone) from 1 April to 1 July 2016. "Radial" directions are chosen to maximize tilt signal during this time period, with positive change usually indicating inflation. The dramatic drop of POC corresponds to the 24 May 2016 opening of the 61f and g vents at Pu'u 'O'o. Image courtesy of HVO (2016 Q2 Quarterly Report). |
The Episode 61f flow continued to feed channelized lava for several days after 24 May, but it began to wane as June approached. The 61e (June 27th) and 61f flows were both last definitively active on 4 June, with incandescence visible at night for a few more days, and both were found to be inactive by 8 June. Inactivity was confirmed by thermal camera on 10 June.
Like the 61f flow, the Episode 61g flow started with vigorous activity and rapid advancement, reaching several hundred meters from the vent within minutes. The rate of advance dropped quickly, but the flow remained active and continued to travel relatively steadily downslope SE at a rate of a few hundred meters per day. Generally advancing along the National Park boundary, the flow reached the top of the Pulama pali (cliff) just west of the Royal Gardens subdivision on 28 June (figure 263). The flow was at the base of the pali by the end of the month, giving it a total length of 7.7 km (figure 264). Webcams recorded bright incandescence from several skylights along the upper part of the tube system supplying lava to the front part of the flow.
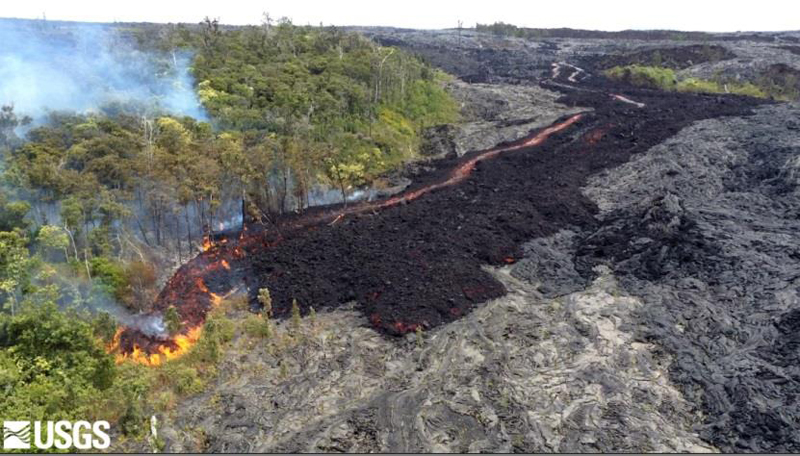 |
Figure 263. Aerial view of Episode 61g channelized ?a?a lava flow from Pu'u 'O'o crater at Kīlauea near the top of Pulama pali (cliff) on 28 June 2016. Courtesy of HVO (2016 Q2 Quarterly Report). |
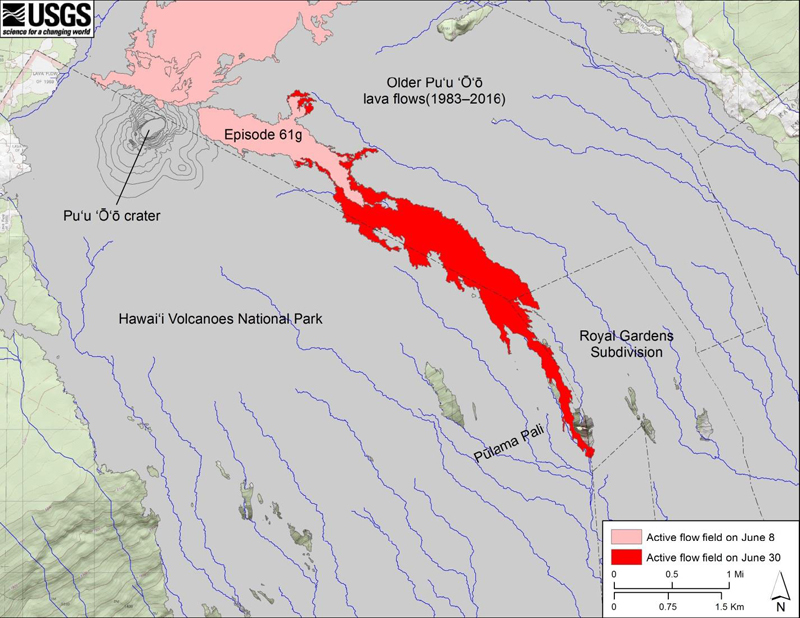 |
Figure 264. Map showing change at the Episode 61g lava flow field from Pu'u 'O'o crater at Kīlauea between 8 and 30 June 2016. The total length of the flow by 30 June was 7.7 km. Courtesy of HVO (2016 Q2 Quarterly Report). |
East Rift Zone thermal anomalies.The cessation of the Episode 61e flow field and the beginning of the 61f and 61g fields are clearly evident in the MODVOLC thermal alert pixel images from the MODIS data shown in four weekly views from late May and early June 2016 (figure 265). Prior to 24 May, the Episode 61e field showed strong thermal anomalies N and W of the ERZ. These anomalies immediately began tapering off on 24 May when the 61f and 61g fields appeared until they were no longer visible in satellite image by 8 June. The 61f and 61g fields grew stronger to the south and east after 24 May; after 61f ended in early June 61g anomalies progressed rapidly SE.
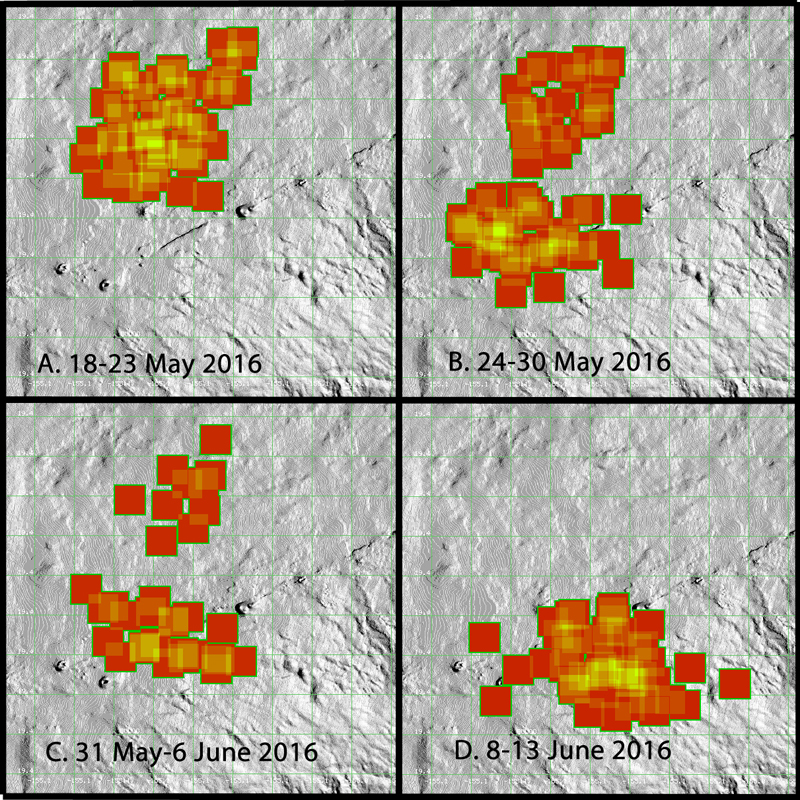 |
Figure 265. Mosaic of four MODVOLC thermal alert pixel images from consecutive weeks in late May and early June 2016, showing the shutting down of active lava flows from the 61e flow field to the erupting of the 61f and 61g flow fields in the East Rift Zone at Kīlauea. A: 18-23 May, 61e (June 27th) flow field is active north of Pu'u 'O'o cone which is visible at bottom center of thermal anomalies. B: 24-30 May, 61f and 61g flows have emerged south of Episode 61e, obscuring the Pu'u 'O'o cone, and 61e anomalies have begun to diminish. C: 31 May-6 June, Episode 61e flow field has cooled considerably and the 61f and 61g fields are both actively showing infrared anomalies. D: 8-13 June, anomalies have ceased from Episode 61e and are now concentrated SE of the ERZ in the active 61g field. Courtesy of MODVOLC. |
East Rift Zone SO2 measurements. Trends in East Rift Zone SO2 emissions can generally be correlated with notable summit and rift events. Elevated emissions were measured in 2014 when the June 27th flow began, in late April 2015 when the summit pond overflowed, as well as during the opening of the new vents on Pu'u 'O'o and start-up of the 61g flow in late May 2016 (figure 266).
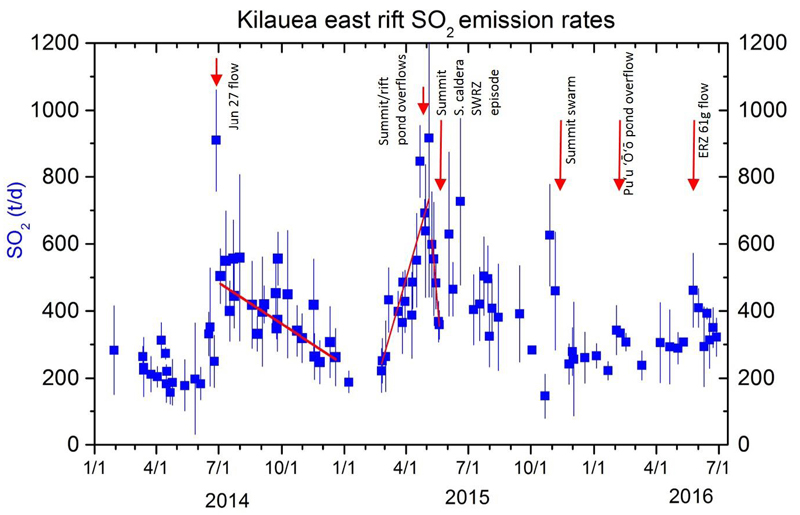 |
Figure 266. Daily average SO2 emissions, as measured along Chain of Craters Road under trade-wind conditions at Kīlauea, with standard deviations of all traverses on a single day. Significant events between 1 January 2014 and 1 July 2016 are highlighted with red arrows. Courtesy of HVO (2016 Q2 Quarterly Report). |
Geological Summary. Kilauea overlaps the E flank of the massive Mauna Loa shield volcano in the island of Hawaii. Eruptions are prominent in Polynesian legends; written documentation since 1820 records frequent summit and flank lava flow eruptions interspersed with periods of long-term lava lake activity at Halemaumau crater in the summit caldera until 1924. The 3 x 5 km caldera was formed in several stages about 1,500 years ago and during the 18th century; eruptions have also originated from the lengthy East and Southwest rift zones, which extend to the ocean in both directions. About 90% of the surface of the basaltic shield volcano is formed of lava flows less than about 1,100 years old; 70% of the surface is younger than 600 years. The long-term eruption from the East rift zone between 1983 and 2018 produced lava flows covering more than 100 km2, destroyed hundreds of houses, and added new coastline.
Information Contacts: Hawaiian Volcano Observatory (HVO), U.S. Geological Survey, PO Box 51, Hawai'i National Park, HI 96718, USA (URL: https://volcanoes.usgs.gov/observatories/hvo/); Hawai'i Institute of Geophysics and Planetology (HIGP), MODVOLC Thermal Alerts System, School of Ocean and Earth Science and Technology (SOEST), Univ. of Hawai'i, 2525 Correa Road, Honolulu, HI 96822, USA (URL: http://modis.higp.hawaii.edu/).