Report on Atmospheric Effects (1980-1989) — January 1986

Atmospheric Effects (1980-1989)
Scientific Event Alert Network Bulletin, vol. 11, no. 1 (January 1986)
Managing Editor: Lindsay McClelland.
Atmospheric Effects (1980-1989) Apparent new stratospheric aerosols at high N latitudes
Please cite this report as:
Global Volcanism Program, 1986. Report on Atmospheric Effects (1980-1989) (McClelland, L., ed.). Scientific Event Alert Network Bulletin, 11:1. Smithsonian Institution.
Atmospheric Effects (1980-1989)
All times are local (unless otherwise noted)
From Tsukuba, Japan (36.2°N, 140.1°E), Sachiko Hayashida reported that the aerosol layer detected at 18 km altitude on 11 and 12 December was probably present on 1 December, but with a scattering ratio of only about 1.3 (figure 16). On 6 January, another aerosol layer was observed at about 22 km altitude. The peak scattering ratio of this layer increased to about 2.8 on 9 and 10 January. Aerosols were concentrated in a layer about 1 km thick. The 14 January profile showed a decrease in peak scattering ratio to about 1.6. At Mauna Loa, Hawaii (19.5°N, 155.6°W), lidar profiles showed an increase in aerosol concentrations through January as the layer centered at about 20 km altitude strengthened (figures 17-19). Only remnants of El Chichón's 1982 eruption cloud were detected by lidar at Garmisch-Partenkirchen, Germany (47.5°N, 11.0°E) through 4 January. The next measurement, on 21 January, showed new layers centered at 18.6 and 21 km altitude. Data on 22 and 26 January continued to show new aerosols, centered at 18 and 17.4 km.
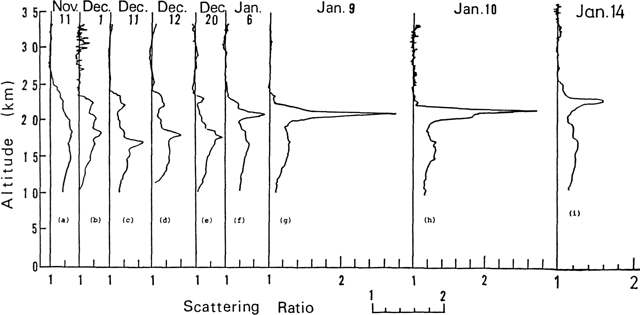 |
Figure 16. Lidar profiles from Tsukuba, Japan (36.2°N, 140.1°E), courtesy or Sachiko Hayashida. Solid vertical lines represent a scattering ratio of 1. Lidar wavelength is 0.53 µm. |
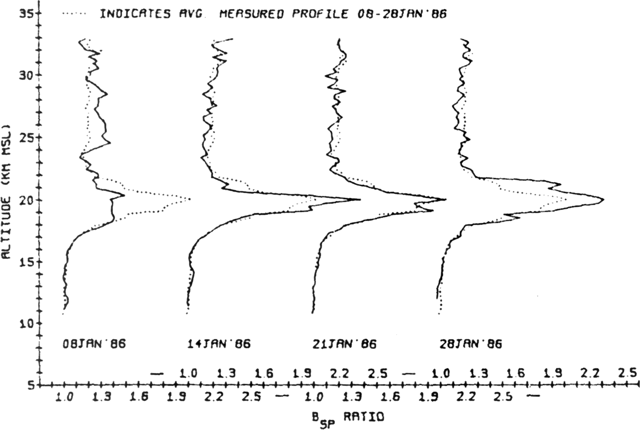 |
Figure 17. Lidar profiles from Mauna Loa, Hawaii (19.5°N, 155.6°W), 8-28 January 1986. The dotted line superimposed on each profile represents the average January data. Courtesy of Thomas DeFoor. |
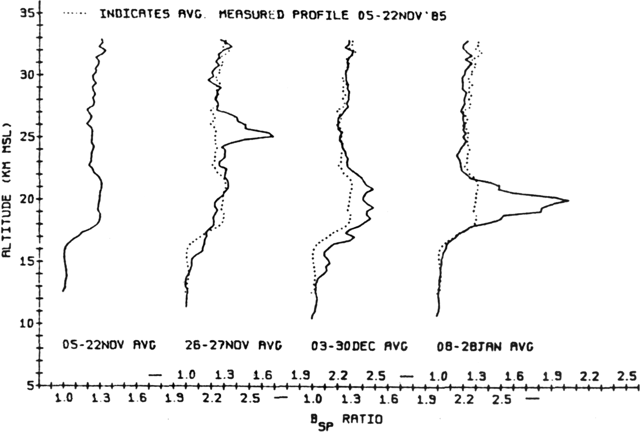 |
Figure 18. Average lidar profiles measured during four periods (5-22 November 1985, 26-27 November 1985, 3-30 December 1985, and 8-28 January 1986) at Mauna Loa, Hawaii. The dotted line superimposed on each profile represents the average 5-22 November 1985 data, just before the arrival of fresh aerosol layers. Courtesy of Thomas DeFoor. |
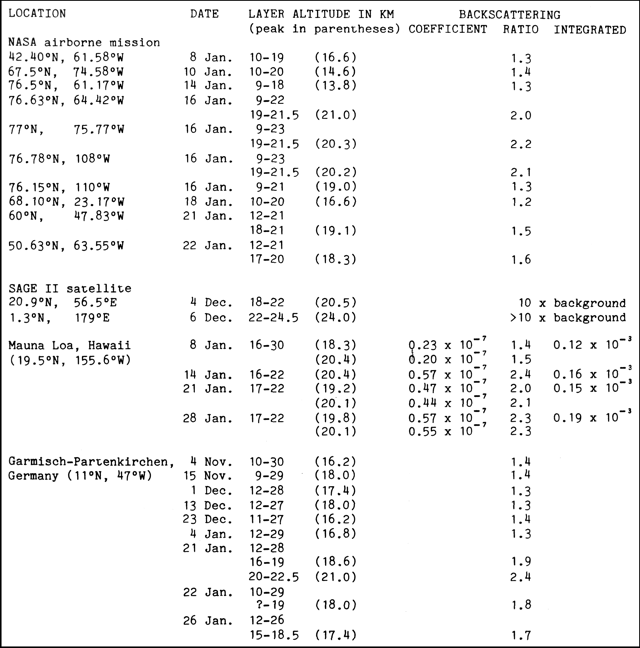 |
Figure 19. Lidar data from various locations, showing altitudes of aerosol layers. Note that some layers have multiple peaks. Backscattering ratios from Fukuoka, Japan, are for the Nd-YAG wavelength of 1.06 µm; from Tsukuba, Japan, for the Nd-YAG wavelength of 0.53 µm; all others are for the ruby wavelength of 0.69 µm. Altitudes of maximum backscattering ratios and coefficients are shown for each layer at Mauna Loa; maxima were at the same altitude on 14 January. Integrated values show total backscatter, expressed in steradians-1, integrated over 300-m intervals from 16-33 km at Mauna Loa and from the tropopause to 30 km at Hampton. |
NASA's SAGE II/SAM II/Polar Stratospheric Cloud mission 7-22 January included airborne lidar measurements from near Hampton, VA to 77°N. Initial data at 42.5°, 67.5°, and 76.5°N (between Hampton and Thule, Greenland) 8-14 January showed relatively low backscattering ratios (figure 20). However, during flights on 16, 21, and 22 January that penetrated the circumpolar vortex wind system, lidar detected strong fresh-looking aerosol layers about 2.5-3 km thick, centered at 18-20 km. Possible sources of the strong layers included the Kliuchevskoi eruption or remnants of the 1982 El Chichón cloud. After exiting the circumpolar vortex at about 76.8°N, 108°W on 16 January, backscattering ratios dropped sharply. NASA's Stratospheric Aerosol and Gas Experiment II (SAGE II) satellite detected aerosol concentrations that were enhanced 10 times or more above background on 4 and 6 December at 20.9°N and 1.3°N.
 |
Figure 20. Lidar data from a NASA airborne mission and the SAGE II satellite, showing altitudes of aerosol layers. Note that some layers have multiple peaks. Backscattering ratios are for the ruby wavelength of 0.69 µm. Integrated values show total backscatter, expressed in steradians-1, integrated over 300-m intervals from the tropopause to 30 km. |
On 18 January, balloon-borne instruments over Laramie, Wyoming (41°N, 105.5°W) detected the first enhancement of optically active aerosols (radius > 0.15 µm) thought to have been produced by the 13 November eruption of Ruiz. A concentration of about 5/cm3 above a background of 1.8/cm3 was measured at 17-19 km (figure 21). No other major stratospheric perturbations have been observed in this component at Laramie since the eruption of El Chichón in 1982. Flights on 10 January and 3 February showed smaller increases in optically active particles.
 |
Figure 21. Aerosols collected by balloons launched from Laramie, WY (41°N, 105.5°W) in late 1985 and early 1986. Left, concentration of optically active aerosols (radius > 0.15 µm); right, concentration of condensation nuclei (radius > 0.01 µm). |
Enhanced concentrations of condensation nuclei (CN, radius > 0.01 µm) were also measured on 18 January between 16 and 19 km altitude, peaking at 100/cm3 as compared to a background of 20-30/cm3. Figure 21 illustrates this increase and includes the profile for 5 December, when the first lower stratospheric CN perturbation was observed over Laramie since the eruption of El Chichón. This CN enhancement is thought to be caused by aerosols from the 13 November eruption of Ruiz, but increases observed at about 25 km altitude on 3 February are interpreted as having been produced by evaporation and recondensation of older aerosols in association with a stratospheric warming event at high northern latitudes.
The following is from Richard Keen. "Enhanced twilights continued to be observed in 1985, but in general the brightness, color intensity, and duration of the twilight phenomena were not as great as in 1984. Salmon or lavender-colored twilights, with peak color intensity at a solar depression angle (SDA) of 4°, were observed on 6 February, 5 and 24 July, 1, 2, 26, 27, & 29 October, and 13 December. The concentration of observations in October may be due to the normal absence of high cirrus clouds over the W United States during the early fall. Horizontal striations were noted in the twilights of 6 February and 13 December.
"A spectacular twilight was seen on 31 December. The bright salmon color peaked at an SDA of 5°, implying a somewhat higher aerosol layer than that responsible for the twilight phenomena earlier in the year. In addition, there were pronounced horizontal striations and banding in the twilight glow. This twilight was similar to those observed in late 1982 and 1983. Enhanced twilights in early January 1986 (on the 7th and 12th) were modest 4° SDA twilights of the type observed earlier in 1985, so the bright 31 December twilight was apparently due to a passing localized aerosol cloud.
"Hemispherically averaged volcanic aerosol optical thicknesses can be derived from observations of the brightness of the moon during total lunar eclipses (Keen, 1983). The 2 lunar eclipses of 1985 (4 May and 28 October) were observable only from the Eastern Hemisphere. Aerosol optical thicknesses have been derived using observations from England, Spain, Austria, South Africa, and Australia for the 1985 eclipses (table 3).
Table 3. Aerosol optical thicknesses derived from observations of lunar eclipses, 1982-85. Data for the 1985 eclipses are from England, Spain, Austria, South Africa, and Australia. The 25 June 1983 observations was for a partial eclipse. Courtesy of Richard Keen.
| Date | Hemisphere | Optical Depth |
| 30 Dec 1982 | N | 0.12 |
| 25 Jun 1983 | S | 0.03 |
| 05 May 1985 | N | 0.04 |
| 28 Oct 1985 | S | 0.00 |
The uncertainty of the derived optical thicknesses is ± 0.02. These observations indicate that the Northern Hemisphere volcanic aerosols from El Chichón decayed to 1/3 of their peak values between 1982 and 1985; the calculated e-folding decay time is 2.1 years. The Southern Hemisphere aerosol layer, which in 1983 was apparently only 1/4 as thick as the Northern Hemisphere layer, had decayed to undetectability by 1985."
Edward Brooks observed unusual sunrises and sunsets from Trinidad, Florida, and Massachusetts. On 31 December, the sunset was a vivid pink to dark purple at Key West, Florida (24.57°N, 81.60°W). At Port of Spain, Trinidad (10.63°N, 61.52°W), the 12 January evening sky was a brilliant orange to red with a dark blue crepuscular ray for about 30 minutes after sunset (solar depression angle about 15°). On 20 January, the sunset was brightly colored at Jacksonville, Florida (30.33°N, 81.67°W). Two days later at Boca Raton, Florida (26.37°N, 80.08°W), sunrise was strongly pink and sunset was also a brilliant pink with multiple dark and light crepuscular rays. Pink crepuscular rays were associatated with the 5 February sunset at Newton, Massachusetts (42.33°N, 71.22°W), and the sky remained bright red for about 30 minutes after sunset (solar depression angle about 10°; note differing SDA rates at low and mid-latitudes).
Reference. Keen, R.A., 1983, Volcanic Aerosols and Lunar Eclipses; Science, v. 222, p. 1011-1013.
Information Contacts: William Fuller, NASA Langley Research Center, Hampton, VA 23665 USA; Sachiko Hayashida, National Institute for Environmental Studies, Yatabe-machi, Tsukuba, Ibaraki 305, Japan; Thomas DeFoor, Mauna Loa Observatory, P.O. Box 275, Hilo, HI 96720 USA; D.J. Hofmann and J.M. Rosen, Department of Physics and Astronomy, University of Wyoming, Laramie, WY 82071 USA; H. Jäger, Fraunhofer-Institut fur Atmospharische Umweltforschung, Kreuzeckbahnstrasse 19, D-8l00 Garmisch-Partenkirchen, West Germany; Richard Keen, CIRES, Campus Box 449, University of Colorado, Boulder, CO 80309 USA; Edward M. Brooks, Department of Geology and Geophysics, Boston College, Chestnut Hill, MA 02167 USA.