Recently Published Bulletin Reports
Erebus (Antarctica) Lava lake remains active; most thermal alerts recorded since 2019
Rincon de la Vieja (Costa Rica) Frequent phreatic explosions during July-December 2023
Bezymianny (Russia) Explosion on 18 October 2023 sends ash plume 8 km high; lava flows and incandescent avalanches
Kilauea (United States) Low-level lava effusions in the lava lake at Halema’uma’u during July-December 2022
Nyamulagira (DR Congo) Lava flows and thermal activity during May-October 2023
Bagana (Papua New Guinea) Explosions, ash plumes, ashfall, and lava flows during April-September 2023
Mayon (Philippines) Lava flows, pyroclastic flows, ash emissions, and seismicity during April-September 2023
Nishinoshima (Japan) Eruption plumes and gas-and-steam plumes during May-August 2023
Krakatau (Indonesia) White gas-and-steam plumes and occasional ash plumes during May-August 2023
Villarrica (Chile) Strombolian activity, gas-and-ash emissions, and crater incandescence during April-September 2023
Merapi (Indonesia) Frequent incandescent avalanches during April-September 2023
Ebeko (Russia) Moderate explosive activity with ash plumes continued during June-November 2023
Erebus (Antarctica) — January 2024  Cite this Report
Erebus
Antarctica
77.53°S, 167.17°E; summit elev. 3794 m
All times are local (unless otherwise noted)
Lava lake remains active; most thermal alerts recorded since 2019
The lava lake in the summit crater of Erebus has been active since at least 1972. Located in Antarctica overlooking the McMurdo Station on Ross Island, it is the southernmost active volcano on the planet. Because of the remote location, activity is primarily monitored by satellites. This report covers activity during 2023.
The number of thermal alerts recorded by the Hawai'i Institute of Geophysics and Planetology’s MODVOLC Thermal Alerts System increased considerably in 2023 compared to the years 2020-2022 (table 9). In contrast to previous years, the MODIS instruments aboard the Aqua and Terra satellites captured data from Erebus every month during 2023. Consistent with previous years, the lowest number of anomalous pixels were recorded in January, November, and December.
Table 9. Number of monthly MODIS-MODVOLC thermal alert pixels recorded at Erebus during 2017-2023. See BGVN 42:06 for data from 2000 through 2016. The table was compiled using data provided by the HIGP – MODVOLC Thermal Alerts System.
| Year |
Jan |
Feb |
Mar |
Apr |
May |
Jun |
Jul |
Aug |
Sep |
Oct |
Nov |
Dec |
SUM |
| 2017 |
0 |
21 |
9 |
0 |
0 |
1 |
11 |
61 |
76 |
52 |
0 |
3 |
234 |
| 2018 |
0 |
21 |
58 |
182 |
55 |
17 |
137 |
172 |
103 |
29 |
0 |
0 |
774 |
| 2019 |
2 |
21 |
162 |
151 |
55 |
56 |
75 |
53 |
29 |
19 |
1 |
0 |
624 |
| 2020 |
0 |
2 |
16 |
18 |
4 |
4 |
1 |
3 |
18 |
3 |
1 |
6 |
76 |
| 2021 |
0 |
9 |
1 |
0 |
2 |
56 |
46 |
47 |
35 |
52 |
5 |
3 |
256 |
| 2022 |
1 |
13 |
55 |
22 |
15 |
32 |
39 |
19 |
31 |
11 |
0 |
0 |
238 |
| 2023 |
2 |
33 |
49 |
82 |
41 |
32 |
70 |
64 |
42 |
17 |
5 |
11 |
448 |
Sentinel-2 infrared images showed one or two prominent heat sources within the summit crater, accompanied by adjacent smaller sources, similar to recent years (see BGVN 46:01, 47:02, and 48:01). A unique image was obtained on 25 November 2023 by the OLI-2 (Operational Land Imager-2) on Landsat 9, showing the upper part of the volcano surrounded by clouds (figure 32).
Geologic Background. Mount Erebus, the world's southernmost historically active volcano, overlooks the McMurdo research station on Ross Island. It is the largest of three major volcanoes forming the crudely triangular Ross Island. The summit of the dominantly phonolitic volcano has been modified by one or two generations of caldera formation. A summit plateau at about 3,200 m elevation marks the rim of the youngest caldera, which formed during the late-Pleistocene and within which the modern cone was constructed. An elliptical 500 x 600 m wide, 110-m-deep crater truncates the summit and contains an active lava lake within a 250-m-wide, 100-m-deep inner crater; other lava lakes are sometimes present. The glacier-covered volcano was erupting when first sighted by Captain James Ross in 1841. Continuous lava-lake activity with minor explosions, punctuated by occasional larger Strombolian explosions that eject bombs onto the crater rim, has been documented since 1972, but has probably been occurring for much of the volcano's recent history.
Information Contacts: Hawai'i Institute of Geophysics and Planetology (HIGP) - MODVOLC Thermal Alerts System, School of Ocean and Earth Science and Technology (SOEST), Univ. of Hawai'i, 2525 Correa Road, Honolulu, HI 96822, USA (URL: http://modis.higp.hawaii.edu/); Copernicus Browser, Copernicus Data Space Ecosystem, European Space Agency (URL: https://dataspace.copernicus.eu/browser/); NASA Earth Observatory, EOS Project Science Office, NASA Goddard Space Flight Center, Goddard, Maryland, USA (URL: https://earthobservatory.nasa.gov/images/152134/erebus-breaks-through).
Rincon de la Vieja (Costa Rica) — January 2024 Cite this Report
Rincon de la Vieja
Costa Rica
10.83°N, 85.324°W; summit elev. 1916 m
All times are local (unless otherwise noted)
Frequent phreatic explosions during July-December 2023
Rincón de la Vieja is a volcanic complex in Costa Rica with a hot convecting acid lake that exhibits frequent weak phreatic explosions, gas-and-steam emissions, and occasional elevated sulfur dioxide levels (BGVN 45:10, 46:03, 46:11). The current eruption period began June 2021. This report covers activity during July-December 2023 and is based on weekly bulletins and occasional daily reports from the Observatorio Vulcanologico Sismologica de Costa Rica-Universidad Nacional (OVSICORI-UNA).
Numerous weak phreatic explosions continued during July-December 2023, along with gas-and-steam emissions and plumes that rose as high as 3 km above the crater rim. Many weekly OVSICORI-UNA bulletins included the previous week's number of explosions and emissions (table 9). For many explosions, the time of explosion was given (table 10). Frequent seismic activity (long-period earthquakes, volcano-tectonic earthquakes, and tremor) accompanied the phreatic activity.
Table 9. Number of reported weekly phreatic explosions and gas-and-steam emissions at Rincón de la Vieja, July-December 2023. Counts are reported for the week before the Weekly Bulletin date; not all reports included these data. Courtesy of OVSICORI-UNA.
| OVSICORI Weekly Bulletin |
Number of explosions |
Number of emissions |
| 28 Jul 2023 |
6 |
14 |
| 4 Aug 2023 |
10 |
12 |
| 1 Sep 2023 |
13 |
11 |
| 22 Sep 2023 |
12 |
13 |
| 29 Sep 2023 |
6 |
11 |
| 6 Oct 2023 |
12 |
5 |
| 13 Oct 2023 |
7 |
9 |
| 20 Oct 2023 |
1 |
15 |
| 27 Oct 2023 |
3 |
23 |
| 3 Nov 2023 |
3 |
10 |
| 17 Nov 2023 |
0 |
Some |
| 24 Nov 2023 |
0 |
14 |
| 8 Dec 2023 |
4 |
16 |
| 22 Dec 2023 |
8 |
18 |
Table 10. Summary of activity at Rincón de la Vieja during July-December 2023. Weak phreatic explosions and gas emissions are noted where the time of explosion was indicated in the weekly or daily bulletins. Height of plumes or emissions are distance above the crater rim. Courtesy of OVSICORI-UNA.
| Date |
Time |
Description of Activity |
| 1 Jul 2023 |
0156 |
Explosion. |
| 2 Jul 2023 |
0305 |
Explosion. |
| 4 Jul 2023 |
0229, 0635 |
Event at 0635 produced a gas-and-steam plume that rose 700 m and drifted W; seen by residents in Liberia (21 km SW). |
| 9 Jul 2023 |
1843 |
Explosion. |
| 21 Jul 2023 |
0705 |
Explosion. |
| 26 Jul 2023 |
1807 |
Explosion. |
| 28 Jul 2023 |
0802 |
Explosion generated a gas-and-steam plume that rose 500 m. |
| 30 Jul 2023 |
1250 |
Explosion. |
| 31 Jul 2023 |
2136 |
Explosion. |
| 11 Aug 2023 |
0828 |
Explosion. |
| 18 Aug 2023 |
1304 |
Explosion. |
| 21 Aug 2023 |
1224 |
Explosion generated gas-and-steam plumes rose 500-600 m. |
| 22 Aug 2023 |
0749 |
Explosion generated gas-and-steam plumes rose 500-600 m. |
| 24 Aug 2023 |
1900 |
Explosion. |
| 25 Aug 2023 |
0828 |
Event produced a steam-and-gas plume that rose 3 km and drifted NW. |
| 27-28 Aug 2023 |
0813 |
Four small events; the event at 0813 on 28 August lasted two minutes and generated a steam-and-gas plume that rose 2.5 km. |
| 1 Sep 2023 |
1526 |
Explosion generated plume that rose 2 km and ejected material onto the flanks. |
| 2-3 Sep 2023 |
- |
Small explosions detected in infrasound data. |
| 4 Sep 2023 |
1251 |
Gas-and-steam plume rose 1 km and drifted W. |
| 7 Nov 2023 |
1113 |
Explosion. |
| 8 Nov 2023 |
0722 |
Explosion. |
| 12 Nov 2023 |
0136 |
Small gas emissions. |
| 14 Nov 2023 |
0415 |
Small gas emissions. |
According to OVSICORI-UNA, during July-October the average weekly sulfur dioxide (SO2) flux ranged from 68 to 240 tonnes/day. However, in mid-November the flux increased to as high as 334 tonnes/day, the highest value measured in recent years. The high SO2 flux in mid-November was also detected by the TROPOMI instrument on the Sentinel-5P satellite (figure 43).
Geologic Background. Rincón de la Vieja, the largest volcano in NW Costa Rica, is a remote volcanic complex in the Guanacaste Range. The volcano consists of an elongated, arcuate NW-SE-trending ridge constructed within the 15-km-wide early Pleistocene Guachipelín caldera, whose rim is exposed on the south side. Sometimes known as the "Colossus of Guanacaste," it has an estimated volume of 130 km3 and contains at least nine major eruptive centers. Activity has migrated to the SE, where the youngest-looking craters are located. The twin cone of Santa María volcano, the highest peak of the complex, is located at the eastern end of a smaller, 5-km-wide caldera and has a 500-m-wide crater. A Plinian eruption producing the 0.25 km3 Río Blanca tephra about 3,500 years ago was the last major magmatic eruption. All subsequent eruptions, including numerous historical eruptions possibly dating back to the 16th century, have been from the prominent active crater containing a 500-m-wide acid lake located ENE of Von Seebach crater.
Information Contacts: Observatorio Vulcanológico Sismológica de Costa Rica-Universidad Nacional (OVSICORI-UNA), Apartado 86-3000, Heredia, Costa Rica (URL: http://www.ovsicori.una.ac.cr/); NASA Global Sulfur Dioxide Monitoring Page, Atmospheric Chemistry and Dynamics Laboratory, NASA Goddard Space Flight Center (NASA/GSFC), 8800 Greenbelt Road, Goddard MD 20771, USA (URL: https://so2.gsfc.nasa.gov/).
Bezymianny (Russia) — November 2023 Cite this Report
Bezymianny
Russia
55.972°N, 160.595°E; summit elev. 2882 m
All times are local (unless otherwise noted)
Explosion on 18 October 2023 sends ash plume 8 km high; lava flows and incandescent avalanches
Bezymianny, located on Russia’s Kamchatka Peninsula, has had eruptions since 1955 characterized by dome growth, explosions, pyroclastic flows, ash plumes, and ashfall. Activity during November 2022-April 2023 included gas-and-steam emissions, lava dome collapses generating avalanches, and persistent thermal activity. Similar eruptive activity continued from May through October 2023, described here based on information from weekly and daily reports of the Kamchatka Volcano Eruptions Response Team (KVERT), notices from Tokyo VAAC (Volcanic Ash Advisory Center), and from satellite data.
Overall activity decreased after the strong period of activity in late March through April 2023, which included ash explosions during 29 March and 7-8 April 2023 that sent plumes as high as 10-12 km altitude, along with dome growth and lava flows (BGVN 48:05). This reduced activity can be seen in the MIROVA thermal detection system graph (figure 56), which was consistent with data from the MODVOLC thermal detection system and with Sentinel-2 satellite images that showed persistent hotspots in the summit crater when conditions allowed observations. A renewed period of strong activity began in mid-October 2023.
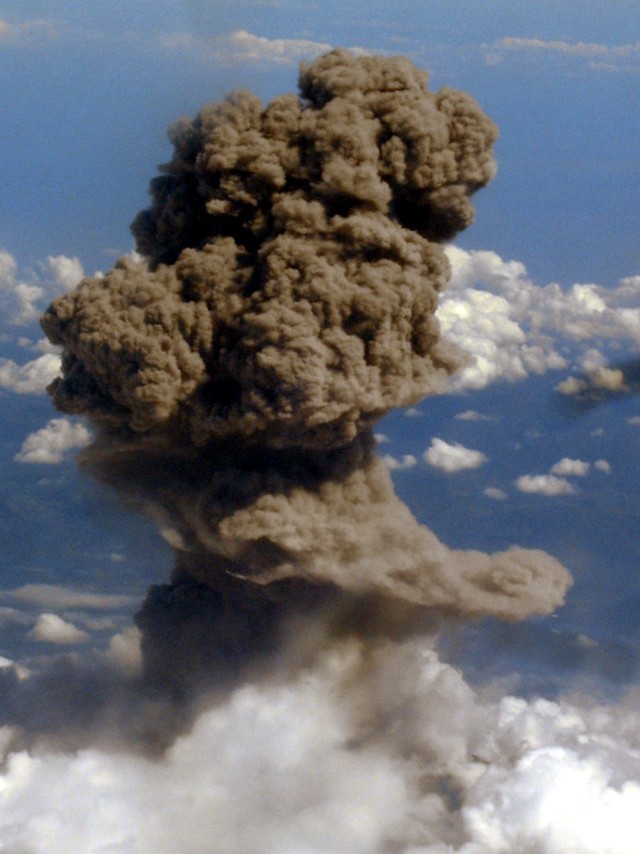
Activity increased significantly on 17 October 2023 when large collapses began during 0700-0830 on the E flanks of the lava dome and continued to after 0930 the next day (figure 57). Ash plumes rose to an altitude of 4.5-5 km, extending 220 km NNE by 18 October. A large explosion at 1630 on 18 October produced an ash plume that rose to an altitude of 11 km (8 km above the summit) and drifted NNE and then NW, extending 900 km NW within two days at an altitude of 8 km. Minor ashfall was noted in Kozyrevsk (45 km WNW). At 0820 on 20 October an ash plume was identified in satellite images drifting 100 km ENE at altitudes of 4-4.5 km.
Lava flows and hot avalanches from the dome down the SE flank continued over the next few days, including 23 October when clear conditions allowed good observations (figures 58 and 59). A large thermal anomaly was observed over the volcano through 24 October, and in the summit crater on 30 October (figure 60). Strong fumarolic activity continued, with numerous avalanches and occasional incandescence. By the last week of October, volcanic activity had decreased to a level consistent with that earlier in the reporting period.
Aviation warnings were frequently updated during 17-20 October. KVERT issued a Volcano Observatory Notice for Aviation (VONA) on 17 October at 1419 and 1727 (0219 and 0527 UTC) raising the Aviation Color Code (ACC) from Yellow to Orange (second highest level). The next day, KVERT issued a VONA at 1705 (0505 UTC) raising the ACC to Red (highest level) but lowered it back to Orange at 2117 (0917 UTC). After another decrease to Yellow and back to Orange, the ACC was reduced to Yellow on 20 October at 1204 (0004 UTC). In addition, the Tokyo VAAC issued a series of Volcanic Ash Advisories beginning on 16 October and continuing through 30 October.
Geologic Background. The modern Bezymianny, much smaller than its massive neighbors Kamen and Kliuchevskoi on the Kamchatka Peninsula, was formed about 4,700 years ago over a late-Pleistocene lava-dome complex and an edifice built about 11,000-7,000 years ago. Three periods of intensified activity have occurred during the past 3,000 years. The latest period, which was preceded by a 1,000-year quiescence, began with the dramatic 1955-56 eruption. This eruption, similar to that of St. Helens in 1980, produced a large open crater that was formed by collapse of the summit and an associated lateral blast. Subsequent episodic but ongoing lava-dome growth, accompanied by intermittent explosive activity and pyroclastic flows, has largely filled the 1956 crater.
Information Contacts: Kamchatka Volcanic Eruptions Response Team (KVERT), Far Eastern Branch, Russian Academy of Sciences, 9 Piip Blvd., Petropavlovsk-Kamchatsky, 683006, Russia (URL: http://www.kscnet.ru/ivs/kvert/); Kamchatka Volcanological Station, Kamchatka Branch of Geophysical Survey, (KB GS RAS), Klyuchi, Kamchatka Krai, Russia (URL: http://volkstat.ru/); Tokyo Volcanic Ash Advisory Center (VAAC), 1-3-4 Otemachi, Chiyoda-ku, Tokyo 100-8122, Japan (URL: http://ds.data.jma.go.jp/svd/vaac/data/); Hawai'i Institute of Geophysics and Planetology (HIGP) - MODVOLC Thermal Alerts System, School of Ocean and Earth Science and Technology (SOEST), Univ. of Hawai'i, 2525 Correa Road, Honolulu, HI 96822, USA (URL: http://modis.higp.hawaii.edu/); MIROVA (Middle InfraRed Observation of Volcanic Activity), a collaborative project between the Universities of Turin and Florence (Italy) supported by the Centre for Volcanic Risk of the Italian Civil Protection Department (URL: http://www.mirovaweb.it/); Copernicus Browser, Copernicus Data Space Ecosystem, European Space Agency (URL: https://dataspace.copernicus.eu/browser/).chr
Kilauea (United States) — January 2023 Cite this Report
Kilauea
United States
19.421°N, 155.287°W; summit elev. 1222 m
All times are local (unless otherwise noted)
Low-level lava effusions in the lava lake at Halema’uma’u during July-December 2022
Kīlauea is the southeastern-most volcano in Hawaii and overlaps the E flank of the Mauna Loa volcano. Its East Rift Zone (ERZ) has been intermittently active for at least 2,000 years. An extended eruption period began in January 1983 and was characterized by open lava lakes and lava flows from the summit caldera and the East Rift Zone. During May 2018 magma migrated into the Lower East Rift Zone (LERZ) and opened 24 fissures along a 6-km-long NE-trending fracture zone that produced lava flows traveling in multiple directions. As lava emerged from the fissures, the lava lake at Halema'uma'u drained and explosions sent ash plumes to several kilometers altitude (BGVN 43:10).
The current eruption period started during September 2021 and has recently been characterized by lava effusions, spatter, and sulfur dioxide emissions in the active Halema’uma’u lava lake (BGVN 47:08). Lava effusions, some spatter, and sulfur dioxide emissions have continued during this reporting period of July through December 2022 using daily reports, volcanic activity notices, and abundant photo, map, and video data from the US Geological Survey's (USGS) Hawaiian Volcano Observatory (HVO).
Summary of activity during July-December 2022. Low-level effusions have continued at the western vent of the Halema’uma’u crater during July through early December 2022. Occasional weak ooze-outs (also called lava break outs) would occur along the margins of the crater floor. The overall level of the active lava lake throughout the reporting period gradually increased due to infilling, however it stagnated in mid-September (table 13). During September through November, activity began to decline, though lava effusions persisted at the western vent. By 9 December, the active part of the lava lake had completely crusted over, and incandescence was no longer visible.
Table 13. Summary of measurements taken during overflights at Kīlauea that show a gradual increase in the active lava lake level and the volume of lava effused since 29 September 2021. Lower activity was reported during September-October. Data collected during July-December 2022. Courtesy of HVO.
| Date: |
Level of the active lava lake (m): |
Cumulative volume of lava effused (million cubic meters): |
| 7 Jul 2022 |
130 |
95 |
| 19 Jul 2022 |
133 |
98 |
| 4 Aug 2022 |
136 |
102 |
| 16 Aug 2022 |
137 |
104 |
| 12 Sep 2022 |
143 |
111 |
| 5 Oct 2022 |
143 |
111 |
| 28 Oct 2022 |
143 |
111 |
Activity during July 2022. Lava effusions were reported from the western vent in the Halema’uma’u crater, along with occasional weak ooze-outs along the margins of the crater floor. The height of the lava lake was variable due to deflation-inflation tilt events; for example, the lake level dropped approximately 3-4 m during a summit deflation-inflation event reported on 1 July. Webcam images taken during the night of 6-12 July showed intermittent low-level spattering at the western vent that rose less than 10 m above the vent (figure 519). Measurements made during an overflight on 7 July indicated that the crater floor was infilled about 130 m and that 95 million cubic meters of lava had been effused since 29 September 2021. A single, relatively small lava ooze-out was active to the S of the lava lake. Around midnight on 8 July there were two brief periods of lava overflow onto the lake margins. On 9 July lava ooze-outs were reported near the SE and NE edges of the crater floor and during 10-11 July they occurred near the E, NE, and NW edges. On 16 July crater incandescence was reported, though the ooze-outs and spattering were not visible. On 18 July overnight webcam images showed incandescence in the western vent complex and two ooze-outs were reported around 0000 and 0200 on 19 July. By 0900 there were active ooze-outs along the SW edge of the crater floor. Measurements made from an overflight on 19 July indicated that the crater floor was infilled about 133 m and 98 million cubic meters of lava had erupted since 29 September 2021 (figure 520). On 20 July around 1600 active ooze-outs were visible along the N edge of the crater, which continued through the next day. Extensive ooze-outs occurred along the W margin during 24 July until 1900; on 26 July minor ooze-outs were noted along the N margin. Minor spattering was visible on 29 July along the E margin of the lake. The sulfur dioxide emission rates ranged 650-2,800 tons per day (t/d), the higher of which was measured on 8 July (figure 519).
Activity during August 2022. The eruption continued in the Halema’uma’u crater at the western vent. According to HVO the lava in the active lake remained at the level of the bounding levees. Occasional minor ooze-outs were observed along the margins of the crater floor. Strong nighttime crater incandescence was visible after midnight on 6 August over the western vent cone. During 6-7 August scattered small lava lobes were active along the crater floor and incandescence persisted above the western vent through 9 August. During 7-9 August HVO reported a single lava effusion source was active along the NW margin of the crater floor. Measurements from an overflight on 4 August indicated that the crater floor was infilled about 136 m total and that 102 million cubic meters of lava had been erupted since the start of the eruption. Lava breakouts were reported along the N, NE, E, S, and W margins of the crater during 10-16 August. Another overflight survey conducted on 16 August indicated that the crater floor infilled about 137 m and 104 million cubic meters of lava had been erupted since September 2021. Measured sulfur dioxide emissions rates ranged 1,150-2,450 t/d, the higher of which occurred on 8 August.
Activity during September 2022. During September, lava effusion continued from the western vent into the active lava lake and onto the crater floor. Intermittent minor ooze-outs were reported through the month. A small ooze-out was visible on the W crater floor margin at 0220 on 2 September, which showed decreasing surface activity throughout the day, but remained active through 3 September. On 3 September around 1900 a lava outbreak occurred along the NW margin of the crater floor but had stopped by the evening of 4 September. Field crews monitoring the summit lava lake on 9 September observed spattering on the NE margin of the lake that rose no higher than 10 m, before falling back onto the lava lake crust (figure 521). Overflight measurements on 12 September indicated that the crater floor was infilled a total of 143 m and 111 million cubic meters of lava had been erupted since September 2021. Extensive breakouts in the W and N part of the crater floor were reported at 1600 on 20 September and continued into 26 September. The active part of the lava lake dropped by 10 m while other parts of the crater floor dropped by several meters. Summit tiltmeters recorded a summit seismic swarm of more than 80 earthquakes during 1500-1800 on 21 September, which occurred about 1.5 km below Halema’uma’u; a majority of these were less than Mw 2. By 22 September the active part of the lava lake was infilled about 2 m. On 23 September the western vent areas exhibited several small spatter cones with incandescent openings, along with weak, sporadic spattering (figure 522). The sulfur dioxide emission rate ranged from 930 t/d to 2,000 t/d, the higher of which was measured on 6 September.
Activity during October 2022. Activity during October declined slightly compared to previous months, though lava effusions persisted from the western vent into the active lava lake and onto the crater floor during October (figure 523). Slight variations in the lava lake were noted throughout the month. HVO reported that around 0600 on 3 October the level of the lava lake has lowered slightly. Overflight measurements taken on 5 October indicated that the crater floor was infilled a total of about 143 m and that 111 million cubic meters of lava had been effused since September 2021. During 6-7 October the lake gradually rose 0.5 m. Sulfur dioxide measurements made on 22 October had an emission rate of 700 t/d. Another overflight taken on 28 October showed that there was little to no change in the elevation of the crater floor: the crater floor was infilled a total of 143 m and 111 million cubic meters of lava had erupted since the start of the eruption.
Activity during November 2022. Activity remained low during November, though HVO reported that lava from the western vent continued to effuse into the active lava lake and onto the crater floor throughout the month. The rate of sulfur dioxide emissions during November ranged from 300-600 t/d, the higher amount of which occurred on 9 November.
Activity during December 2022. Similar low activity was reported during December, with lava effusing from the western vent into the active lava lake and onto the crater floor. During 4-5 December the active part of the lava lake was slightly variable in elevation and fluctuated within 1 m. On 9 December HVO reported that lava was no longer erupting from the western vent in the Halema’uma’u crater and that sulfur dioxide emissions had returned to near pre-eruption background levels; during 10-11 December, the lava lake had completely crusted over, and no incandescence was visible (figure 524). Time lapse camera images covering the 4-10 December showed that the crater floor showed weak deflation and no inflation. Some passive events of crustal overturning were reported during 14-15 December, which brought fresh incandescent lava to the lake surface. The sulfur dioxide emission rate was approximately 200 t/d on 14 December. A smaller overturn event on 17 December and another that occurred around 0000 and into the morning of 20 December were also detected. A small seismic swarm was later detected on 30 December.
Geologic Background. Kilauea overlaps the E flank of the massive Mauna Loa shield volcano in the island of Hawaii. Eruptions are prominent in Polynesian legends; written documentation since 1820 records frequent summit and flank lava flow eruptions interspersed with periods of long-term lava lake activity at Halemaumau crater in the summit caldera until 1924. The 3 x 5 km caldera was formed in several stages about 1,500 years ago and during the 18th century; eruptions have also originated from the lengthy East and Southwest rift zones, which extend to the ocean in both directions. About 90% of the surface of the basaltic shield volcano is formed of lava flows less than about 1,100 years old; 70% of the surface is younger than 600 years. The long-term eruption from the East rift zone between 1983 and 2018 produced lava flows covering more than 100 km2, destroyed hundreds of houses, and added new coastline.
Information Contacts: Hawaiian Volcano Observatory (HVO), U.S. Geological Survey, PO Box 51, Hawai'i National Park, HI 96718, USA (URL: http://hvo.wr.usgs.gov/).
Nyamulagira (DR Congo) — November 2023 Cite this Report
Nyamulagira
DR Congo
1.408°S, 29.2°E; summit elev. 3058 m
All times are local (unless otherwise noted)
Lava flows and thermal activity during May-October 2023
Nyamulagira (also known as Nyamuragira) is a shield volcano in the Democratic Republic of Congo with the summit truncated by a small 2 x 2.3 km caldera with walls up to about 100 m high. Documented eruptions have occurred within the summit caldera, as well as from numerous flank fissures and cinder cones. The current eruption period began in April 2018 and has more recently been characterized by summit crater lava flows and thermal activity (BGVN 48:05). This report describes lava flows and variable thermal activity during May through October 2023, based on information from the Observatoire Volcanologique de Goma (OVG) and various satellite data.
Lava lake activity continued during May. The MIROVA (Middle InfraRed Observation of Volcanic Activity) system recorded moderate-to-strong thermal activity throughout the reporting period; activity was more intense during May and October and relatively weaker from June through September (figure 95). The MODVOLC thermal algorithm, detected a total of 209 thermal alerts. There were 143 hotspots detected during May, eight during June, nine during September, and 49 during October. This activity was also reflected in infrared satellite images, where a lava flow was visible in the NW part of the crater on 7 May and strong activity was seen in the center of the crater on 4 October (figure 96). Another infrared satellite image taken on 12 May showed still active lava flows along the NW margin of the crater. According to OVG lava effusions were active during 7-29 May and moved to the N and NW parts of the crater beginning on 9 May. Strong summit crater incandescence was visible from Goma (27 km S) during the nights of 17, 19, and 20 May (figure 97). On 17 May there was an increase in eruptive activity, which peaked at 0100 on 20 May. Notable sulfur dioxide plumes drifted NW and W during 19-20 May (figure 98). Drone footage acquired in partnership with the USGS (United States Geological Survey) on 20 May captured images of narrow lava flows that traveled about 100 m down the W flank (figure 99). Data from the Rumangabo seismic station indicated a decreasing trend in activity during 17-21 May. Although weather clouds prevented clear views of the summit, a strong thermal signature on the NW flank was visible in an infrared satellite image on 22 May, based on an infrared satellite image. On 28 May the lava flows on the upper W flank began to cool and solidify. By 29 May seismicity returned to levels similar to those recorded before the 17 May increase. Lava effusion continued but was confined to the summit crater; periodic crater incandescence was observed.
Low-level activity was noted during June through October. On 1 June OVG reported that seismicity remained at lower levels and that crater incandescence had been absent for three days, though infrared satellite imagery showed continued lava effusion in the summit crater. The lava flows on the flanks covered an estimated 0.6 km2. Satellite imagery continued to show thermal activity confined to the lava lake through October (figure 96), although no lava flows or significant sulfur dioxide emissions were reported.
Geologic Background. Africa's most active volcano, Nyamulagira (also known as Nyamuragira), is a massive high-potassium basaltic shield about 25 km N of Lake Kivu and 13 km NNW of the steep-sided Nyiragongo volcano. The summit is truncated by a small 2 x 2.3 km caldera that has walls up to about 100 m high. Documented eruptions have occurred within the summit caldera, as well as from the numerous flank fissures and cinder cones. A lava lake in the summit crater, active since at least 1921, drained in 1938, at the time of a major flank eruption. Recent lava flows extend down the flanks more than 30 km from the summit as far as Lake Kivu; extensive lava flows from this volcano have covered 1,500 km2 of the western branch of the East African Rift.
Information Contacts: Observatoire Volcanologique de Goma (OVG), Departement de Geophysique, Centre de Recherche en Sciences Naturelles, Lwiro, D.S. Bukavu, DR Congo; Hawai'i Institute of Geophysics and Planetology (HIGP) - MODVOLC Thermal Alerts System, School of Ocean and Earth Science and Technology (SOEST), Univ. of Hawai'i, 2525 Correa Road, Honolulu, HI 96822, USA (URL: http://modis.higp.hawaii.edu/); MIROVA (Middle InfraRed Observation of Volcanic Activity), a collaborative project between the Universities of Turin and Florence (Italy) supported by the Centre for Volcanic Risk of the Italian Civil Protection Department (URL: http://www.mirovaweb.it/); NASA Global Sulfur Dioxide Monitoring Page, Atmospheric Chemistry and Dynamics Laboratory, NASA Goddard Space Flight Center (NASA/GSFC), 8800 Greenbelt Road, Goddard, Maryland, USA (URL: https://so2.gsfc.nasa.gov/); Copernicus Browser, Copernicus Data Space Ecosystem, European Space Agency (URL: https://dataspace.copernicus.eu/browser/); Charles Balagizi, Goma Volcano Observatory, Departement de Geophysique, Centre de Recherche en Sciences Naturelles, Lwiro, D.S. Bukavu, DR Congo.
Bagana (Papua New Guinea) — October 2023 Cite this Report
Bagana
Papua New Guinea
6.137°S, 155.196°E; summit elev. 1855 m
All times are local (unless otherwise noted)
Explosions, ash plumes, ashfall, and lava flows during April-September 2023
The remote volcano of Bagana is located in central Bougainville Island, Papua New Guinea. Recorded eruptions date back to 1842 and activity has consisted of effusive activity that has built a small lava dome in the summit crater and occasional explosions that produced pyroclastic flows. The most recent eruption has been ongoing since February 2000 and has produced occasional explosions, ash plumes, and lava flows. More recently, activity has been characterized by ongoing effusive activity and ash emissions (BGVN 48:04). This report updates activity from April through September 2023 that has consisted of explosions, ash plumes, ashfall, and lava flows, using information from the Darwin Volcanic Ash Advisory Center (VAAC) and satellite data.
An explosive eruption was reported on 7 July that generated a large gas-and-ash plume to high altitudes and caused significant ashfall in local communities; the eruption plume had reached upper tropospheric (16-18 km altitude) altitudes by 2200, according to satellite images. Sulfur dioxide plumes were detected in satellite images on 8 July and indicated that the plume was likely a mixture of gas, ice, and ash. A report issued by the Autonomous Bougainville Government (ABG) (Torokina District, Education Section) on 10 July noted that significant ash began falling during 2000-2100 on 7 July and covered most areas in the Vuakovi, Gotana (9 km SW), Koromaketo, Laruma (25 km W) and Atsilima (27 km NW) villages. Pyroclastic flows also occurred, according to ground-based reports; small deposits confined to one drainage were inspected by RVO during an overflight on 17 July and were confirmed to be from the 7 July event. Ashfall continued until 10 July and covered vegetation, which destroyed bushes and gardens and contaminated rivers and streams.
RVO reported another eruption on 14 July. The Darwin VAAC stated that an explosive event started around 0830 on 15 July and produced an ash plume that rose to 16.5 km altitude by 1000 and drifted N, according to satellite images. The plume continued to drift N and remained visible through 1900, and by 2150 it had dissipated.
Ashfall likely from both the 7 and 15 July events impacted about 8,111 people in Torokina (20 km SW), including Tsito/Vuakovi, Gotana, Koromaketo, Kenaia, Longkogari, Kenbaki, Piva (13 km SW), and Atsinima, and in the Tsitovi district, according to ABG. Significant ashfall was also reported in Ruruvu (22 km N) in the Wakunai District of Central Bougainville, though the thickness of these deposits could not be confirmed. An evacuation was called for the villages in Wakunai, where heavy ashfall had contaminated water sources; the communities of Ruruvu, Togarau, Kakarapaia, Karauturi, Atao, and Kuritaturi were asked to evacuate to a disaster center at the Wakunai District Station, and communities in Torokina were asked to evacuate to the Piva District station. According to a news article, more than 7,000 people needed temporary accommodations, with about 1,000 people in evacuation shelters. Ashfall had deposited over a broad area, contaminating water supplies, affecting crops, and collapsing some roofs and houses in rural areas. Schools were temporarily shut down. Intermittent ash emissions continued through the end of July and drifted NNW, NW, and SW. Fine ashfall was reported on the coast of Torokina, and ash plumes also drifted toward Laruma and Atsilima.
A small explosive eruption occurred at 2130 on 28 July that ejected material from the crater vents, according to reports from Torokina, in addition to a lava flow that contained two lobes. A second explosion was detected at 2157. Incandescence from the lava flow was visible from Piva as it descended the W flank around 2000 on 29 July (figure 47). The Darwin VAAC reported that a strong thermal anomaly was visible in satellite images during 30-31 July and that ash emissions rose to 2.4 km altitude and drifted WSW on 30 July. A ground report from RVO described localized emissions at 0900 on 31 July.
The Darwin VAAC reported that ash plumes were identified in satellite imagery at 0800 and 1220 on 12 August and rose to 2.1 km and 3 km altitude and drifted NW and W, respectively. A news report stated that aid was sent to more than 6,300 people that were adversely affected by the eruption. Photos taken during 17-19 August showed ash emissions rising no higher than 1 km above the summit and drifting SE. A small explosion generated an ash plume during the morning of 19 August. Deposits from small pyroclastic flows were also captured in the photos. Satellite images captured lava flows and pyroclastic flow deposits. Two temporary seismic stations were installed near Bagana on 17 August at distances of 7 km WSW (Vakovi station) and 11 km SW (Kepox station). The Kepox station immediately started to record continuous, low-frequency background seismicity.
Satellite data. Little to no thermal activity was detected during April through mid-July 2023; only one anomaly was recorded during early April and one during early June, according to MIROVA (Middle InfraRed Observation of Volcanic Activity) data (figure 48). Thermal activity increased in both power and frequency during mid-July through September, although there were still some short gaps in detected activity. MODVOLC also detected increased thermal activity during August; thermal hotspots were detected a total of five times on 19, 20, and 27 August. Weak thermal anomalies were also captured in infrared satellite images on clear weather days throughout the reporting period on 7, 12, and 17 April, 27 May, 1, 6, 16, and 31 July, and 19 September (figure 48); a strong thermal anomaly was visible on 31 July. Distinct sulfur dioxide plumes that drifted generally NW were intermittently captured by the TROPOMI instrument on the Sentinel-5P satellite and sometimes exceeded two Dobson Units (DUs) (figure 49).
Geologic Background. Bagana volcano, in a remote portion of central Bougainville Island, is frequently active. This massive symmetrical cone was largely constructed by an accumulation of viscous andesitic lava flows. The entire edifice could have been constructed in about 300 years at its present rate of lava production. Eruptive activity is characterized by non-explosive effusion of viscous lava that maintains a small lava dome in the summit crater, although occasional explosive activity produces pyroclastic flows. Lava flows with tongue-shaped lobes up to 50 m thick and prominent levees descend the flanks on all sides.
Information Contacts: Rabaul Volcano Observatory (RVO), Geohazards Management Division, Department of Mineral Policy and Geohazards Management (DMPGM), PO Box 3386, Kokopo, East New Britain Province, Papua New Guinea; Darwin Volcanic Ash Advisory Centre (VAAC), Bureau of Meteorology, Northern Territory Regional Office, PO Box 40050, Casuarina, NT 0811, Australia (URL: http://www.bom.gov.au/info/vaac/); MIROVA (Middle InfraRed Observation of Volcanic Activity), a collaborative project between the Universities of Turin and Florence (Italy) supported by the Centre for Volcanic Risk of the Italian Civil Protection Department (URL: http://www.mirovaweb.it/); Hawai'i Institute of Geophysics and Planetology (HIGP) - MODVOLC Thermal Alerts System, School of Ocean and Earth Science and Technology (SOEST), Univ. of Hawai'i, 2525 Correa Road, Honolulu, HI 96822, USA (URL: http://modis.higp.hawaii.edu/); NASA Global Sulfur Dioxide Monitoring Page, Atmospheric Chemistry and Dynamics Laboratory, NASA Goddard Space Flight Center (NASA/GSFC), 8800 Greenbelt Road, Goddard, Maryland, USA (URL: https://so2.gsfc.nasa.gov/); Copernicus Browser, Copernicus Data Space Ecosystem, European Space Agency (URL: https://dataspace.copernicus.eu/browser/); Autonomous Bougainville Government, P.O Box 322, Buka, AROB, PNG (URL: https://abg.gov.pg/); Andrew Tupper (Twitter: @andrewcraigtupp); Simon Carn, Geological and Mining Engineering and Sciences, Michigan Technological University, 1400 Townsend Drive, Houghton, MI 49931, USA (URL: http://www.volcarno.com/, Twitter: @simoncarn); Radio NZ (URL: https://www.rnz.co.nz/news/pacific/494464/more-than-7-000-people-in-bougainville-need-temporary-accommodation-after-eruption); USAID, 1300 Pennsylvania Ave, NW, Washington DC 20004, USA (URL: https://www.usaid.gov/pacific-islands/press-releases/aug-08-2023-united-states-provides-immediate-emergency-assistance-support-communities-affected-mount-bagana-volcanic-eruptions).
Mayon (Philippines) — October 2023 Cite this Report
Mayon
Philippines
13.257°N, 123.685°E; summit elev. 2462 m
All times are local (unless otherwise noted)
Lava flows, pyroclastic flows, ash emissions, and seismicity during April-September 2023
Mayon is located in the Philippines and has steep upper slopes capped by a small summit crater. Historical eruptions date back to 1616 CE that have been characterized by Strombolian eruptions, lava flows, pyroclastic flows, and mudflows. Eruptions mostly originated from a central conduit. Pyroclastic flows and mudflows have commonly descended many of the approximately 40 drainages that surround the volcano. The most recent eruption occurred during June through October 2022 and consisted of lava dome growth and gas-and-steam emissions (BGVN 47:12). A new eruption was reported during late April 2023 and has included lava flows, pyroclastic density currents, ash emissions, and seismicity. This report covers activity during April through September 2023 based on daily bulletins from the Philippine Institute of Volcanology and Seismology (PHIVOLCS).
During April through September 2023, PHIVOLCS reported near-daily rockfall events, frequent volcanic earthquakes, and sulfur dioxide measurements. Gas-and-steam emissions rose 100-900 m above the crater and drifted in different directions. Nighttime crater incandescence was often visible during clear weather and was accompanied by incandescent avalanches of material. Activity notably increased during June when lava flows were reported on the S, SE, and E flanks (figure 52). The MIROVA graph (Middle InfraRed Observation of Volcanic Activity) showed strong thermal activity coincident with these lava flows, which remained active through September (figure 53). According to the MODVOLC thermal algorithm, a total of 110 thermal alerts were detected during the reporting period: 17 during June, 40 during July, 27 during August, and 26 during September. During early June, pyroclastic density currents (PDCs) started to occur more frequently.
Low activity was reported during much of April and May; gas-and-steam emissions rose 100-900 m above the crater and generally drifted in different directions. A total of 52 rockfall events and 18 volcanic earthquakes were detected during April and 147 rockfall events and 13 volcanic events during May. Sulfur dioxide flux measurements ranged between 400-576 tons per day (t/d) during April, the latter of which was measured on 29 April and between 162-343 t/d during May, the latter of which was measured on 13 May.
Activity during June increased, characterized by lava flows, pyroclastic density currents (PDCs), crater incandescence and incandescent rockfall events, gas-and-steam emissions, and continued seismicity. Weather clouds often prevented clear views of the summit, but during clear days, moderate gas-and-steam emissions rose 100-2,500 m above the crater and drifted in multiple directions. A total of 6,237 rockfall events and 288 volcanic earthquakes were detected. The rockfall events often deposited material on the S and SE flanks within 700-1,500 m of the summit crater and ash from the events drifted SW, S, SE, NE, and E. Sulfur dioxide emissions ranged between 149-1,205 t/d, the latter of which was measured on 10 June. Short-term observations from EDM and electronic tiltmeter monitoring indicated that the upper slopes were inflating since February 2023. Longer-term ground deformation parameters based on EDM, precise leveling, continuous GPS, and electronic tilt monitoring indicated that the volcano remained inflated, especially on the NW and SE flanks. At 1000 on 5 June the Volcano Alert Level (VAL) was raised to 2 (on a 0-5 scale). PHIVOLCS noted that although low-level volcanic earthquakes, ground deformation, and volcanic gas emissions indicated unrest, the steep increase in rockfall frequency may indicate increased dome activity.
A total of 151 dome-collapse PDCs occurred during 8-9 and 11-30 June, traveled 500-2,000 m, and deposited material on the S flank within 2 km of the summit crater. During 8-9 June the VAL was raised to 3. At approximately 1947 on 11 June lava flow activity was reported; two lobes traveled within 500 m from the crater and deposited material on the S (Mi-isi), SE (Bonga), and E (Basud) flanks. Weak seismicity accompanied the lava flow and slight inflation on the upper flanks. This lava flow remained active through 30 June, moving down the S and SE flank as far as 2.5 km and 1.8 km, respectively and depositing material up to 3.3 km from the crater. During 15-16 June traces of ashfall from the PDCs were reported in Sitio Buga, Nabonton, City of Ligao and Purok, and San Francisco, Municipality of Guinobatan. During 28-29 June there were two PDCs generated by the collapse of the lava flow front, which generated a light-brown ash plume 1 km high. Satellite monitors detected significant concentrations of sulfur dioxide beginning on 29 June. On 30 June PDCs primarily affected the Basud Gully on the E flank, the largest of which occurred at 1301 and lasted eight minutes, based on the seismic record. Four PDCs generated between 1800 and 2000 that lasted approximately four minutes each traveled 3-4 km on the E flank and generated an ash plume that rose 1 km above the crater and drifted N and NW. Ashfall was recorded in Tabaco City.
Similar strong activity continued during July; slow lava effusion remained active on the S and SE flanks and traveled as far as 2.8 km and 2.8 km, respectively and material was deposited as far as 4 km from the crater. There was a total of 6,983 rockfall events and 189 PDCs that affected the S, SE, and E flanks. The volcano network detected a total of 2,124 volcanic earthquakes. Continuous gas-and-steam emissions rose 200-2,000 m above the crater and drifted in multiple directions. Sulfur dioxide emissions averaged 792-4,113 t/d, the latter of which was measured on 28 July. During 2-4 July three PDCs were generated from the collapse of the lava flow and resulting light brown plumes rose 200-300 m above the crater. Continuous tremor pulses were reported beginning at 1547 on 3 July through 7 July at 1200, at 2300 on 8 July and going through 0300 on 10 July, and at 2300 on 16 July, as recorded by the seismic network. During 6-9 July there were 10 lava flow-collapse-related PDCs that generated light brown plumes 300-500 m above the crater. During 10-11 July light ashfall was reported in some areas of Mabinit, Legazpi City, Budiao and Salvacion, Daraga, and Camalig, Albay. By 18 July the lava flow advanced 600 m on the E flank as well.
During 1733 on 18 July and 0434 on 19 July PHIVOLCS reported 30 “ashing” events, which are degassing events accompanied by audible thunder-like sounds and entrained ash at the crater, which produced short, dark plumes that drifted SW. These events each lasted 20-40 seconds, and plume heights ranged from 150-300 m above the crater, as recorded by seismic, infrasound, visual, and thermal monitors. Three more ashing events occurred during 19-20 July. Short-term observations from electronic tilt and GPS monitoring indicate deflation on the E lower flanks in early July and inflation on the NW middle flanks during the third week of July. Longer-term ground deformation parameters from EDM, precise leveling, continuous GPS, and electronic tilt monitoring indicated that the volcano was still generally inflated relative to baseline levels. A short-lived lava pulse lasted 28 seconds at 1956 on 21 July, which was accompanied by seismic and infrasound signals. By 22 July, the only lava flow that remained active was on the SE flank, and continued to extend 3.4 km, while those on the S and E flanks weakened markedly. One ashing event was detected during 30-31 July, whereas there were 57 detected during 31 July-1 August; according to PHIVOLCS beginning at approximately 1800 on 31 July eruptive activity was dominated by phases of intermittent ashing, as well as increased in the apparent rates of lava effusion from the summit crater. The ashing phases consisted of discrete events recorded as low-frequency volcanic earthquakes (LFVQ) typically 30 seconds in duration, based on seismic and infrasound signals. Gray ash plume rose 100 m above the crater and generally drifted NE. Shortly after these ashing events began, new lava began to effuse rapidly from the crater, feeding the established flowed on the SE, E, and E flanks and generating frequent rockfall events.
Intensified unrest persisted during August. There was a total of 4,141 rockfall events, 2,881 volcanic earthquakes, which included volcanic tremor events, 32 ashing events, and 101 PDCs detected throughout the month. On clear weather days, gas-and-steam emissions rose 300-1,500 m above the crater and drifted in different directions (figure 54). Sulfur dioxide emissions averaged 735-4,756 t/d, the higher value of which was measured on 16 August. During 1-2 August the rate of lava effusion decreased, but continued to feed the flows on the SE, S, and E flanks, maintaining their advances to 3.4 km, 2.8 km, and 1.1 km from the crater, respectively (figure 55). Rockfall and PDCs generated by collapses at the lava flow margins and from the summit dome deposited material within 4 km of the crater. During 3-4 August there were 10 tremor events detected that lasted 1-4 minutes. Short-lived lava pulse lasted 35 seconds and was accompanied by seismic and infrasound signals at 0442 on 6 August. Seven collapses were recorded at the front of the lava flow during 12-14 August.
During September, similar activity of slow lava effusion, PDCs, gas-and-steam emissions, and seismicity continued. There was a total of 4,452 rockfall events, 329 volcanic earthquakes, which included volcanic tremor events, two ashing events, and 85 PDCs recorded throughout the month. On clear weather days, gas-and-steam emissions rose 100-1,500 m above the crater and drifted in multiple directions. Sulfur dioxide emissions averaged 609-2,252 t/d, the higher average of which was measured on 6 September. Slow lava effusion continued advancing on the SE, S, and E flanks, maintaining lengths of 3.4 km, 2.8 km, and 1.1 km, respectively. Rockfall and PDC events generated by collapses along the lava flow margins and at the summit dome deposited material within 4 km of the crater.
Geologic Background. Symmetrical Mayon, which rises above the Albay Gulf NW of Legazpi City, is the most active volcano of the Philippines. The steep upper slopes are capped by a small summit crater. Recorded eruptions since 1616 CE range from Strombolian to basaltic Plinian, with cyclical activity beginning with basaltic eruptions, followed by longer periods of andesitic lava flows. Eruptions occur predominately from the central conduit and have also produced lava flows that travel far down the flanks. Pyroclastic density currents and mudflows have commonly swept down many of the approximately 40 ravines that radiate from the summit and have often damaged populated lowland areas. A violent eruption in 1814 killed more than 1,200 people and devastated several towns.
Information Contacts: Philippine Institute of Volcanology and Seismology (PHIVOLCS), Department of Science and Technology, University of the Philippines Campus, Diliman, Quezon City, Philippines (URL: http://www.phivolcs.dost.gov.ph/); MIROVA (Middle InfraRed Observation of Volcanic Activity), a collaborative project between the Universities of Turin and Florence (Italy) supported by the Centre for Volcanic Risk of the Italian Civil Protection Department (URL: http://www.mirovaweb.it/); Hawai'i Institute of Geophysics and Planetology (HIGP) - MODVOLC Thermal Alerts System, School of Ocean and Earth Science and Technology (SOEST), Univ. of Hawai'i, 2525 Correa Road, Honolulu, HI 96822, USA (URL: http://modis.higp.hawaii.edu/); Copernicus Browser, Copernicus Data Space Ecosystem, European Space Agency (URL: https://dataspace.copernicus.eu/browser/); William Rogers, Legazpi City, Albay Province, Philippines.
Nishinoshima (Japan) — October 2023 Cite this Report
Nishinoshima
Japan
27.247°N, 140.874°E; summit elev. 100 m
All times are local (unless otherwise noted)
Eruption plumes and gas-and-steam plumes during May-August 2023
Nishinoshima, located about 1,000 km S of Tokyo, is a small island in the Ogasawara Arc in Japan. The island is the summit of a massive submarine volcano that has prominent submarine peaks to the S, W, and NE. Eruptions date back to 1973 and the current eruption period began in October 2022. Recent activity has consisted of small ash plumes and fumarolic activity (BGVN 48:07). This report covers activity during May through August 2023, using information from monthly reports of the Japan Meteorological Agency (JMA) monthly reports and satellite data.
Activity during May through June was relatively low. The Japan Coast Guard (JCG) did overflights on 14 and 22 June and reported white gas-and-steam emissions rising 600 m and 1,200 m from the central crater of the pyroclastic cone, respectively (figure 125). In addition, multiple white gas-and-steam emissions rose from the inner rim of the W side of the crater and from the SE flank of the pyroclastic cone. Discolored brown-to-green water was observed around almost the entire perimeter of the island; on 22 June light green discolored water was observed off the S coast of the island.
Observations from the Himawari meteorological satellite confirmed an eruption on 9 and 10 July. An eruption plume rose 1.6 km above the crater and drifted N around 1300 on 9 July. Satellite images acquired at 1420 and 2020 on 9 July and at 0220 on 10 July showed continuing emissions that rose 1.3-1.6 km above the crater and drifted NE and N. The Tokyo VAAC reported that an ash plume seen by a pilot and identified in a satellite image at 0630 on 21 July rose to 3 km altitude and drifted S.
Aerial observations conducted by JCG on 8 August showed a white-and-gray plume rising from the central crater of the pyroclastic cone, and multiple white gas-and-steam emissions were rising from the inner edge of the western crater and along the NW-SE flanks of the island (figure 126). Brown-to-green discolored water was also noted around the perimeter of the island.
Intermittent low-to-moderate power thermal anomalies were recorded in the MIROVA graph (Middle InfraRed Observation of Volcanic Activity), showing an increase in both frequency and power beginning in July (figure 127). This increase in activity coincides with eruptive activity on 9 and 10 July, characterized by eruption plumes. According to the MODVOLC thermal alert algorithm, one thermal hotspot was recorded on 20 July. Weak thermal anomalies were also detected in infrared satellite imagery, accompanied by strong gas-and-steam plumes (figure 128).
Geologic Background. The small island of Nishinoshima was enlarged when several new islands coalesced during an eruption in 1973-74. Multiple eruptions that began in 2013 completely covered the previous exposed surface and continued to enlarge the island. The island is the summit of a massive submarine volcano that has prominent peaks to the S, W, and NE. The summit of the southern cone rises to within 214 m of the ocean surface 9 km SSE.
Information Contacts: Japan Meteorological Agency (JMA), 1-3-4 Otemachi, Chiyoda-ku, Tokyo 100-8122, Japan (URL: http://www.jma.go.jp/jma/indexe.html); Tokyo Volcanic Ash Advisory Center (VAAC), 1-3-4 Otemachi, Chiyoda-ku, Tokyo 100-8122, Japan (URL: http://ds.data.jma.go.jp/svd/vaac/data/); MIROVA (Middle InfraRed Observation of Volcanic Activity), a collaborative project between the Universities of Turin and Florence (Italy) supported by the Centre for Volcanic Risk of the Italian Civil Protection Department (URL: http://www.mirovaweb.it/); Copernicus Browser, Copernicus Data Space Ecosystem, European Space Agency (URL: https://dataspace.copernicus.eu/browser/).
Krakatau (Indonesia) — October 2023 Cite this Report
Krakatau
Indonesia
6.1009°S, 105.4233°E; summit elev. 285 m
All times are local (unless otherwise noted)
White gas-and-steam plumes and occasional ash plumes during May-August 2023
Krakatau is located in the Sunda Strait between Java and Sumatra, Indonesia. Caldera collapse during the catastrophic 1883 eruption destroyed Danan and Perbuwatan cones and left only a remnant of Rakata. The post-collapse cone of Anak Krakatau (Child of Krakatau) was constructed within the 1883 caldera at a point between the former Danan and Perbuwatan cones; it has been the site of frequent eruptions since 1927. The current eruption period began in May 2021 and has recently consisted of Strombolian eruptions and ash plumes (BGVN 48:07). This report describes lower levels of activity consisting of ash and white gas-and-steam plumes during May through August 2023, based on information provided by the Indonesian Center for Volcanology and Geological Hazard Mitigation, referred to as Pusat Vulkanologi dan Mitigasi Bencana Geologi (PVMBG), MAGMA Indonesia, and satellite data.
Activity was relatively low during May and June. Daily white gas-and-steam emissions rose 25-200 m above the crater and drifted in different directions. Five ash plumes were detected at 0519 on 10 May, 1241 on 11 May, 0920 on 12 May, 2320 on 12 May, and at 0710 on 13 May, and rose 1-2.5 km above the crater and drifted SW. A webcam image taken on 12 May showed ejection of incandescent material above the vent. A total of nine ash plumes were detected during 6-11 June: at 1434 and 00220 on 6 and 7 June the ash plumes rose 500 m above the crater and drifted NW, at 1537 on 8 June the ash plume rose 1 km above the crater and drifted SW, at 0746 and at 0846 on 9 June the ash plumes rose 800 m and 3 km above the crater and drifted SW, respectively, at 0423, 1431, and 1750 on 10 June the ash plumes rose 2 km, 1.5 km, and 3.5 km above the crater and drifted NW, respectively, and at 0030 on 11 June an ash plume rose 2 km above the crater and drifted NW. Webcam images taken on 10 and 11 June at 0455 and 0102, respectively, showed incandescent material ejected above the vent. On 19 June an ash plume at 0822 rose 1.5 km above the crater and drifted SE.
Similar low activity of white gas-and-steam emissions and few ash plumes were reported during July and August. Daily white gas-and-steam emissions rose 25-300 m above the crater and drifted in multiple directions. Three ash plumes were reported at 0843, 0851, and 0852 on 20 July that rose 500-2,000 m above the crater and drifted NW.
The MIROVA (Middle InfraRed Observation of Volcanic Activity) graph of MODIS thermal anomaly data showed intermittent low-to-moderate power thermal anomalies during May through August 2023 (figure 140). Although activity was often obscured by weather clouds, a thermal anomaly was visible in an infrared satellite image of the crater on 12 May, accompanied by an eruption plume that drifted SW (figure 141).
Geologic Background. The renowned Krakatau (frequently mis-named as Krakatoa) volcano lies in the Sunda Strait between Java and Sumatra. Collapse of an older edifice, perhaps in 416 or 535 CE, formed a 7-km-wide caldera. Remnants of that volcano are preserved in Verlaten and Lang Islands; subsequently the Rakata, Danan, and Perbuwatan cones were formed, coalescing to create the pre-1883 Krakatau Island. Caldera collapse during the catastrophic 1883 eruption destroyed Danan and Perbuwatan, and left only a remnant of Rakata. This eruption caused more than 36,000 fatalities, most as a result of tsunamis that swept the adjacent coastlines of Sumatra and Java. Pyroclastic surges traveled 40 km across the Sunda Strait and reached the Sumatra coast. After a quiescence of less than a half century, the post-collapse cone of Anak Krakatau (Child of Krakatau) was constructed within the 1883 caldera at a point between the former Danan and Perbuwatan cones. Anak Krakatau has been the site of frequent eruptions since 1927.
Information Contacts: Pusat Vulkanologi dan Mitigasi Bencana Geologi (PVMBG, also known as Indonesian Center for Volcanology and Geological Hazard Mitigation, CVGHM), Jalan Diponegoro 57, Bandung 40122, Indonesia (URL: http://www.vsi.esdm.go.id/); MAGMA Indonesia, Kementerian Energi dan Sumber Daya Mineral (URL: https://magma.esdm.go.id/v1); MIROVA (Middle InfraRed Observation of Volcanic Activity), a collaborative project between the Universities of Turin and Florence (Italy) supported by the Centre for Volcanic Risk of the Italian Civil Protection Department (URL: http://www.mirovaweb.it/); Copernicus Browser, Copernicus Data Space Ecosystem, European Space Agency (URL: https://dataspace.copernicus.eu/browser/).
Villarrica (Chile) — October 2023 Cite this Report
Villarrica
Chile
39.42°S, 71.93°W; summit elev. 2847 m
All times are local (unless otherwise noted)
Strombolian activity, gas-and-ash emissions, and crater incandescence during April-September 2023
Villarrica, in central Chile, consists of a 2-km-wide caldera that formed about 3,500 years ago and is located at the base of the presently active cone at the NW margin of a 6-km-wide caldera. Historical eruptions eruptions date back to 1558 and have been characterized by mild-to-moderate explosive activity with occasional lava effusions. The current eruption period began in December 2014 and has recently consisted of nighttime crater incandescence, ash emissions, and seismicity (BGVN 48:04). This report covers activity during April through September 2023 and describes occasional Strombolian activity, gas-and-ash emissions, and nighttime crater incandescence. Information for this report primarily comes from the Southern Andes Volcano Observatory (Observatorio Volcanológico de Los Andes del Sur, OVDAS), part of Chile's National Service of Geology and Mining (Servicio Nacional de Geología y Minería, SERNAGEOMIN) and satellite data.
Seismicity during April consisted of long period (LP) events and tremor (TRE); a total of 9,413 LP-type events and 759 TR-type events were detected throughout the month. Nighttime crater incandescence persisted and was visible in the degassing column. Sulfur dioxide data was obtained using Differential Absorption Optical Spectroscopy Equipment (DOAS) that showed an average value of 1,450 ± 198 tons per day (t/d) during 1-15 April and 1,129 ± 201 t/d during 16-30 April, with a maximum daily value of 2,784 t/d on 9 April. Gas-and-steam emissions of variable intensities rose above the active crater as high as 1.3 km above the crater on 13 April. Strombolian explosions were not observed and there was a slight decrease in the lava lake level.
There were 14,123 LP-type events and 727 TR-type events detected during May. According to sulfur dioxide measurements taken with DOAS equipment, the active crater emitted an average value of 1,826 ± 482 t/d during 1-15 May and 912 ± 41 t/d during 16-30 May, with a daily maximum value of 5,155 t/d on 13 May. Surveillance cameras showed continuous white gas-and-steam emissions that rose as high as 430 m above the crater on 27 May. Nighttime incandescence illuminated the gas column less than 300 m above the crater rim was and no pyroclastic emissions were reported. A landslide was identified on 13 May on the E flank of the volcano 50 m from the crater rim and extending 300 m away; SERNAGEOMIN noted that this event may have occurred on 12 May. During the morning of 27 and 28 May minor Strombolian explosions characterized by incandescent ejecta were recorded at the crater rim; the last reported Strombolian explosions had occurred at the end of March.
Seismic activity during June consisted of five volcano-tectonic (VT)-type events, 21,606 LP-type events, and 2,085 TR-type events. The average value of sulfur dioxide flux obtained by DOAS equipment was 1,420 ± 217 t/d during 1-15 June and 2,562 ± 804 t/d, with a maximum daily value of 4,810 t/d on 17 June. White gas-and-steam emissions rose less than 480 m above the crater; frequent nighttime crater incandescence was reflected in the degassing plume. On 12 June an emission rose 100 m above the crater and drifted NNW. On 15 June one or several emissions resulted in ashfall to the NE as far as 5.5 km from the crater, based on a Skysat satellite image. Several Strombolian explosions occurred within the crater; activity on 15 June was higher energy and ejected blocks 200-300 m on the NE slope. Surveillance cameras showed white gas-and-steam emissions rising 480 m above the crater on 16 June. On 19 and 24 June low-intensity Strombolian activity was observed, ejecting material as far as 200 m from the center of the crater to the E.
During July, seismicity included 29,319 LP-type events, 3,736 TR-type events, and two VT-type events. DOAS equipment recorded two days of sulfur dioxide emissions of 4,220 t/d and 1,009 t/d on 1 and 13 July, respectively. Constant nighttime incandescence was also recorded and was particularly noticeable when accompanied by eruptive columns on 12 and 16 July. Minor explosive events were detected in the crater. According to Skysat satellite images taken on 12, 13, and 16 July, ashfall deposits were identified 155 m S of the crater. According to POVI, incandescence was visible from two vents on the crater floor around 0336 on 12 July. Gas-and-ash emissions rose as high as 1.2 km above the crater on 13 July and drifted E and NW. A series of gas-and-steam pulses containing some ash deposited material on the upper E flank around 1551 on 13 July. During 16-31 July, average sulfur dioxide emissions of 1,679 ± 406 t/d were recorded, with a maximum daily value of 2,343 t/d on 28 July. Fine ash emissions were also reported on 16, 17, and 23 July.
Seismicity persisted during August, characterized by 27,011 LP-type events, 3,323 TR-type events, and three VT-type events. The average value of sulfur dioxide measurements taken during 1-15 August was 1,642 ± 270 t/d and 2,207 ± 4,549 t/d during 16-31 August, with a maximum daily value of 3,294 t/d on 27 August. Nighttime crater incandescence remained visible in degassing columns. White gas-and-steam emissions rose 480 m above the crater on 6 August. According to a Skysat satellite image from 6 August, ash accumulation was observed proximal to the crater and was mainly distributed toward the E slope. White gas-and-steam emissions rose 320 m above the crater on 26 August. Nighttime incandescence and Strombolian activity that generated ash emissions were reported on 27 August.
Seismicity during September was characterized by five VT-type events, 12,057 LP-type events, and 2,058 TR-type events. Nighttime incandescence persisted. On 2 September an ash emission rose 180 m above the crater and drifted SE at 1643 (figure 125) and a white gas-and-steam plume rose 320 m above the crater. According to the Buenos Aires VAAC, periods of continuous gas-and-ash emissions were visible in webcam images from 1830 on 2 September to 0110 on 3 September. Strombolian activity was observed on 2 September and during the early morning of 3 September, the latter event of which generated an ash emission that rose 60 m above the crater and drifted 100 m from the center of the crater to the NE and SW. Ashfall was reported to the SE and S as far as 750 m from the crater. The lava lake was active during 3-4 September and lava fountaining was visible for the first time since 26 March 2023, according to POVI. Fountains captured in webcam images at 2133 on 3 September and at 0054 on 4 September rose as high as 60 m above the crater rim and ejected material onto the upper W flank. Sulfur dioxide flux of 1,730 t/d and 1,281 t/d was measured on 3 and 4 September, respectively, according to data obtained by DOAS equipment.
Strong Strombolian activity and larger gas-and-ash plumes were reported during 18-20 September. On 18 September activity was also associated with energetic LP-type events and notable sulfur dioxide fluxes (as high as 4,277 t/d). On 19 September Strombolian activity and incandescence were observed. On 20 September at 0914 ash emissions rose 50 m above the crater and drifted SSE, accompanied by Strombolian activity that ejected material less than 100 m SSE, causing fall deposits on that respective flank. SERNAGEOMIN reported that a Planet Scope satellite image taken on 20 September showed the lava lake in the crater, measuring 32 m x 35 m and an area of 0.001 km2. Several ash emissions were recorded at 0841, 0910, 1251, 1306, 1312, 1315, and 1324 on 23 September and rose less than 150 m above the crater. The sulfur dioxide flux value was 698 t/d on 23 September and 1,097 t/d on 24 September. On 24 September the Volcanic Alert Level (VAL) was raised to Orange (the third level on a four-color scale). SENAPRED maintained the Alert Level at Yellow (the middle level on a three-color scale) for the communities of Villarrica, Pucón (16 km N), Curarrehue, and Panguipulli.
During 24-25 September there was an increase in seismic energy (observed at TR-events) and acoustic signals, characterized by 1 VT-type event, 213 LP-type events, and 124 TR-type events. Mainly white gas-and-steam emissions, in addition to occasional fine ash emissions were recorded. During the early morning of 25 September Strombolian explosions were reported and ejected material 250 m in all directions, though dominantly toward the NW. On 25 September the average value of sulfur dioxide flux was 760 t/d. Seismicity during 25-30 September consisted of five VT-type events, 1,937 LP-type events, and 456 TR-type events.
During 25-29 September moderate Strombolian activity was observed and ejected material as far as the crater rim. In addition, ash pulses lasting roughly 50 minutes were observed around 0700 and dispersed ENE. During 26-27 September a TR episode lasted 6.5 hours and was accompanied by discrete acoustic signals. Satellite images from 26 September showed a spatter cone on the crater floor with one vent that measured 10 x 14 m and a smaller vent about 35 m NE of the cone. SERNAGEOMIN reported an abundant number of bomb-sized blocks up to 150 m from the crater, as well as impact marks on the snow, which indicated explosive activity. A low-altitude ash emission was observed drifting NW around 1140 on 28 September, based on webcam images. Between 0620 and 0850 on 29 September an ash emission rose 60 m above the crater and drifted NW. During an overflight taken around 1000 on 29 September scientists observed molten material in the vent, a large accumulation of pyroclasts inside the crater, and energetic degassing, some of which contained a small amount of ash. Block-sized pyroclasts were deposited on the internal walls and near the crater, and a distal ash deposit was also visible. The average sulfur dioxide flux measured on 28 September was 344 t/d. Satellite images taken on 29 September ashfall was deposited roughly 3 km WNW from the crater and nighttime crater incandescence remained visible. The average sulfur dioxide flux value from 29 September was 199 t/d. On 30 September at 0740 a pulsating ash emission rose 1.1 km above the crater and drifted NNW (figure 126). Deposits on the S flank extended as far as 4.5 km from the crater rim, based on satellite images from 30 September.
Infrared MODIS satellite data processed by MIROVA (Middle InfraRed Observation of Volcanic Activity) showed intermittent thermal activity during April through September, with slightly stronger activity detected during late September (figure 127). Small clusters of thermal activity were detected during mid-June, early July, early August, and late September. According to the MODVOLC thermal alert system, a total of four thermal hotspots were detected on 7 July and 3 and 23 September. This activity was also intermittently captured in infrared satellite imagery on clear weather days (figure 128).
Geologic Background. The glacier-covered Villarrica stratovolcano, in the northern Lakes District of central Chile, is ~15 km south of the city of Pucon. A 2-km-wide caldera that formed about 3,500 years ago is located at the base of the presently active, dominantly basaltic to basaltic andesite cone at the NW margin of a 6-km-wide Pleistocene caldera. More than 30 scoria cones and fissure vents are present on the flanks. Plinian eruptions and pyroclastic flows that have extended up to 20 km from the volcano were produced during the Holocene. Lava flows up to 18 km long have issued from summit and flank vents. Eruptions documented since 1558 CE have consisted largely of mild-to-moderate explosive activity with occasional lava effusion. Glaciers cover 40 km2 of the volcano, and lahars have damaged towns on its flanks.
Information Contacts: Servicio Nacional de Geología y Minería (SERNAGEOMIN), Observatorio Volcanológico de Los Andes del Sur (OVDAS), Avda Sta María No. 0104, Santiago, Chile (URL: http://www.sernageomin.cl/); Proyecto Observación Villarrica Internet (POVI) (URL: http://www.povi.cl/); Sistema y Servicio Nacional de Prevención y Repuesta Ante Desastres (SENAPRED), Av. Beauchef 1671, Santiago, Chile (URL: https://web.senapred.cl/); Buenos Aires Volcanic Ash Advisory Center (VAAC), Servicio Meteorológico Nacional-Fuerza Aérea Argentina, 25 de mayo 658, Buenos Aires, Argentina (URL: http://www.smn.gov.ar/vaac/buenosaires/inicio.php); MIROVA (Middle InfraRed Observation of Volcanic Activity), a collaborative project between the Universities of Turin and Florence (Italy) supported by the Centre for Volcanic Risk of the Italian Civil Protection Department (URL: http://www.mirovaweb.it/); Hawai'i Institute of Geophysics and Planetology (HIGP) - MODVOLC Thermal Alerts System, School of Ocean and Earth Science and Technology (SOEST), Univ. of Hawai'i, 2525 Correa Road, Honolulu, HI 96822, USA (URL: http://modis.higp.hawaii.edu/); Copernicus Browser, Copernicus Data Space Ecosystem, European Space Agency (URL: https://dataspace.copernicus.eu/browser/).
Merapi (Indonesia) — October 2023 Cite this Report
Merapi
Indonesia
7.54°S, 110.446°E; summit elev. 2910 m
All times are local (unless otherwise noted)
Frequent incandescent avalanches during April-September 2023
Merapi, located just north of the major city of Yogyakarta in central Java, Indonesia, has had activity within the last 20 years characterized by pyroclastic flows and lahars accompanying growth and collapse of the steep-sided active summit lava dome. The current eruption period began in late December 2020 and has more recently consisted of ash plumes, intermittent incandescent avalanches of material, and pyroclastic flows (BGVN 48:04). This report covers activity during April through September 2023, based on information from Balai Penyelidikan dan Pengembangan Teknologi Kebencanaan Geologi (BPPTKG), the Center for Research and Development of Geological Disaster Technology, a branch of PVMBG which specifically monitors Merapi. Additional information comes from the Pusat Vulkanologi dan Mitigasi Bencana Geologi (PVMBG, also known as Indonesian Center for Volcanology and Geological Hazard Mitigation, CVGHM), MAGMA Indonesia, the Darwin Volcanic Ash Advisory Centre (VAAC), and various satellite data.
Activity during April through September 2023 primarily consisted of incandescent avalanches of material that mainly affected the SW and W flanks and traveled as far as 2.3 km from the summit (table 25) and white gas-and-steam emissions that rose 10-1,000 m above the crater.
Table 25. Monthly summary of avalanches and avalanche distances recorded at Merapi during April through September 2023. The number of reported avalanches does not include instances where possible avalanches were heard but could not be visually confirmed as a result of inclement weather. Data courtesy of BPPTKG (April-September 2023 daily reports).
| Month |
Average number of avalanches per day |
Distance avalanches traveled (m) |
| Apr 2023 |
19 |
1,200-2,000 |
| May 2023 |
22 |
500-2,000 |
| Jun 2023 |
18 |
1,200-2,000 |
| Jul 2023 |
30 |
300-2,000 |
| Aug 2023 |
25 |
400-2,300 |
| Sep 2023 |
23 |
600-2,000 |
BPPTKG reported that during April and May white gas-and-steam emissions rose 10-750 m above the crater, incandescent avalanches descended 500-2,000 m on the SW and W flanks (figure 135). Cloudy weather often prevented clear views of the summit, and sometimes avalanches could not be confirmed. According to a webcam image, a pyroclastic flow was visible on 17 April at 0531. During the week of 28 April and 4 May a pyroclastic flow was reported on the SW flank, traveling up to 2.5 km. According to a drone overflight taken on 17 May the SW lava dome volume was an estimated 2,372,800 cubic meters and the dome in the main crater was an estimated 2,337,300 cubic meters.
During June and July similar activity persisted with white gas-and-steam emissions rising 10-350 m above the crater and frequent incandescent avalanches that traveled 300-2,000 m down the SW, W, and S flanks (figure 136). Based on an analysis of aerial photos taken on 24 June the volume of the SW lava dome was approximately 2.5 million cubic meters. A pyroclastic flow was observed on 5 July that traveled 2.7 km on the SW flank. According to the Darwin VAAC multiple minor ash plumes were identified in satellite images on 19 July that rose to 3.7 km altitude and drifted S and SW. During 22, 25, and 26 July a total of 17 avalanches descended as far as 1.8 km on the S flank.
Frequent white gas-and-steam emissions continued during August and September, rising 10-450 m above the crater. Incandescent avalanches mainly affected the SW and W flanks and traveled 400-2,300 m from the vent (figure 137). An aerial survey conducted on 10 August was analyzed and reported that estimates of the SW dome volume was 2,764,300 cubic meters and the dome in the main crater was 2,369,800 cubic meters.
Frequent and moderate-power thermal activity continued throughout the reporting period, according to a MIROVA (Middle InfraRed Observation of Volcanic Activity) analysis of MODIS satellite data (figure 138). There was an increase in the number of detected anomalies during mid-May. The MODVOLC thermal algorithm recorded a total of 47 thermal hotspots: six during April, nine during May, eight during June, 15 during July, four during August, and five during September. Some of this activity was captured in infrared satellite imagery on clear weather days, sometimes accompanied by incandescent material on the SW flank (figure 139).
Geologic Background. Merapi, one of Indonesia's most active volcanoes, lies in one of the world's most densely populated areas and dominates the landscape immediately north of the major city of Yogyakarta. It is the youngest and southernmost of a volcanic chain extending NNW to Ungaran volcano. Growth of Old Merapi during the Pleistocene ended with major edifice collapse perhaps about 2,000 years ago, leaving a large arcuate scarp cutting the eroded older Batulawang volcano. Subsequent growth of the steep-sided Young Merapi edifice, its upper part unvegetated due to frequent activity, began SW of the earlier collapse scarp. Pyroclastic flows and lahars accompanying growth and collapse of the steep-sided active summit lava dome have devastated cultivated lands on the western-to-southern flanks and caused many fatalities.
Information Contacts: Balai Penyelidikan dan Pengembangan Teknologi Kebencanaan Geologi (BPPTKG), Center for Research and Development of Geological Disaster Technology (URL: http://merapi.bgl.esdm.go.id/, Twitter: @BPPTKG); MAGMA Indonesia, Kementerian Energi dan Sumber Daya Mineral (URL: https://magma.esdm.go.id/v1); Pusat Vulkanologi dan Mitigasi Bencana Geologi (PVMBG, also known as Indonesian Center for Volcanology and Geological Hazard Mitigation, CVGHM), Jalan Diponegoro 57, Bandung 40122, Indonesia (URL: http://www.vsi.esdm.go.id/); Darwin Volcanic Ash Advisory Centre (VAAC), Bureau of Meteorology, Northern Territory Regional Office, PO Box 40050, Casuarina, NT 0811, Australia (URL: http://www.bom.gov.au/info/vaac/); MIROVA (Middle InfraRed Observation of Volcanic Activity), a collaborative project between the Universities of Turin and Florence (Italy) supported by the Centre for Volcanic Risk of the Italian Civil Protection Department (URL: http://www.mirovaweb.it/); Hawai'i Institute of Geophysics and Planetology (HIGP) - MODVOLC Thermal Alerts System, School of Ocean and Earth Science and Technology (SOEST), Univ. of Hawai'i, 2525 Correa Road, Honolulu, HI 96822, USA (URL: http://modis.higp.hawaii.edu/); Copernicus Browser, Copernicus Data Space Ecosystem, European Space Agency (URL: https://dataspace.copernicus.eu/browser/); Øystein Lund Andersen (URL: https://www.oysteinlundandersen.com/, https://twitter.com/oysteinvolcano).
Ebeko
Russia
50.686°N, 156.014°E; summit elev. 1103 m
All times are local (unless otherwise noted)
Moderate explosive activity with ash plumes continued during June-November 2023
Ebeko, located on the N end of Paramushir Island in Russia’s Kuril Islands just S of the Kamchatka Peninsula, consists of three summit craters along a SSW-NNE line at the northern end of a complex of five volcanic cones. Observed eruptions date back to the late 18th century and have been characterized as small-to-moderate explosions from the summit crater, accompanied by intense fumarolic activity. The current eruptive period began in June 2022, consisting of frequent explosions, ash plumes, and thermal activity (BGVN 47:10, 48:06). This report covers similar activity during June-November 2023, based on information from the Kamchatka Volcanic Eruptions Response Team (KVERT) and satellite data.
Moderate explosive activity continued during June-November 2023 (figures 50 and 51). According to visual data from Severo-Kurilsk, explosions sent ash 2-3.5 km above the summit (3-4.5 km altitude) during most days during June through mid-September. Activity after mid-September was slightly weaker, with ash usually reaching less than 2 km above the summit. According to KVERT the volcano in October and November was, with a few exceptions, either quiet or obscured by clouds that prevented satellite observations. KVERT issued Volcano Observatory Notices for Aviation (VONA) on 8 and 12 June, 13 and 22 July, 3 and 21 August, and 31 October warning of potential aviation hazards from ash plumes drifting 3-15 km from the volcano. Based on satellite data, KVERT reported a persistent thermal anomaly whenever weather clouds permitted viewing.
Geologic Background. The flat-topped summit of the central cone of Ebeko volcano, one of the most active in the Kuril Islands, occupies the northern end of Paramushir Island. Three summit craters located along a SSW-NNE line form Ebeko volcano proper, at the northern end of a complex of five volcanic cones. Blocky lava flows extend west from Ebeko and SE from the neighboring Nezametnyi cone. The eastern part of the southern crater contains strong solfataras and a large boiling spring. The central crater is filled by a lake about 20 m deep whose shores are lined with steaming solfataras; the northern crater lies across a narrow, low barrier from the central crater and contains a small, cold crescentic lake. Historical activity, recorded since the late-18th century, has been restricted to small-to-moderate explosive eruptions from the summit craters. Intense fumarolic activity occurs in the summit craters, on the outer flanks of the cone, and in lateral explosion craters.
Information Contacts: Kamchatka Volcanic Eruptions Response Team (KVERT), Far Eastern Branch, Russian Academy of Sciences, 9 Piip Blvd., Petropavlovsk-Kamchatsky, 683006, Russia (URL: http://www.kscnet.ru/ivs/kvert/).
Search Bulletin Archive by Publication Date
Select a month and year from the drop-downs and click "Show Issue" to have that issue displayed in this tab.
The default month and year is the latest issue available.
Bulletin of the Global Volcanism Network - Volume 33, Number 06 (June 2008)
Managing Editor: Richard Wunderman
Arenal (Costa Rica)
Continuing explosive and effusive eruptions; block-and-ash flows
Barren Island (India)
Thermal anomalies and red glow indicate that a new eruption started in May 2008
Chaiten (Chile)
Events of June-July include diminished plumes, substantial seismicity, and lateral blast
Erta Ale (Ethiopia)
Active lava lake visited in February 2008
Lengai, Ol Doinyo (Tanzania)
Explosive eruptions continue into June 2008
Llaima (Chile)
Summary of January-February 2008 eruption; minor eruptions late March-early April 2008
Okmok (United States)
Large explosive eruption started on 12 July, ash plumes initially rose to 15.2 km altitude
Papandayan (Indonesia)
Minor seismic activity and fumarolic plumes through 16 April 2008
Raung (Indonesia)
New eruption during 12-17 June sends ash plumes to 4.5 km altitude
Tungurahua (Ecuador)
Explosions up to 14 km altitude during July 2007 to February 2008
Ubinas (Peru)
Frequent ash plumes pose risk to aviation and residents
Witori (Papua New Guinea)
Ejection of lava fragments in late August 2007; quiet steaming
Arenal
Costa Rica
10.463°N, 84.703°W; summit elev. 1670 m
All times are local (unless otherwise noted)
Continuing explosive and effusive eruptions; block-and-ash flows
Our last report covered generally low-level activity at Arenal through September 2007 (BGVN 32:09). Behavior then included pyroclastic flows to a runout distance of ~ 1 km and a new lava flow emerging from Crater C. This report covers the interval October 2007?June 2008 and originated from those of both the Observatorio Vulcanologico Sismologica de Costa Rica- Universidad Nacional (OVSICORI-UNA) and (ICE).
Impressive incandescent avalanches (block-and-ash flows or pyroclastic flows) traveled down several flanks during June 2008. At least portions of those avalanches broke off from a cone in Crater C and active lava flows high on the edifice.
During the reporting interval, Crater C continued to produce lava flows, gases, sporadic Strombolian eruptions, and avalanches from the lava flow fronts. Observers noticed acid rain and small amounts of ejected pyroclastic material impacting the NE, E, and SE flanks. They also cited loss of vegetation, steep slopes, poorly consolidated material, and high precipitation as factors that triggered small cold avalanches in Calle de Arenas, Manolo, Guillermina, and the river Agua Caliente. Crater D remained fumarolic. Except for the June avalanches, eruptive activity generally remained modest. Some reports noted that the eruptive vigor continued to drop both in terms of the number of eruptions and the amount of ejected pyroclastic material.
OVSICORI-UNA reported that by March 2008, the flow of lava down the S flank had stopped, but a new flow that had begun in February 2008 toward the SW flank was still active. A few eruptions produced ash columns that exceeded 500 m above the vent.
During April 2008, lava moving toward the S flank descended to about 1,400 m elevation. Some blocks had detached near the border of the crater. Sporadically small avalanches occurred and some blocks managed to reach vegetation below, igniting small fires. Some April eruptions produced dark gray ash columns.
Glowing avalanches of June. Jorge Barquero sent us a report on Arenal's behavior during June 2008. Prior to the June events a distinct cone had appeared in Crater C. Its steep sides generated small avalanches of loosened rocks. At about 1000 on 6 June, that cone collapsed, causing a pyroclastic (block-and-ash) flow that descended SE, forming a gully or channel, and laying down a deposit that fanned out at the base of Arenal. Lava also descended into or towards the gully, causing small avalanches.
Some residents heard noises and felt ashfall starting at 0600 on 10 June. At about 0800 these block-and-ash flows became larger. The wind blew ash NW to 4 km from the crater.
After 1730 on 14 June, the failure of the lava flow front sent down an avalanche more violent than those earlier. An hour later the largest block-and-ash flow of the month descended. It descended the channel and produced a large quantity of ash that blew SE and W to distances of 6 km. The area of greatest impact was in the SW portion of the Arenal National Park, where the branches of some vegetation cracked under the weight of the ash. More block-and-ash flows were also observed on 15 and 18 June.
On 11 June Eliecer Duarte and E. Fernández (OVSICORI-UNA) visited the distal parts of the new deposits, documenting the new flow field (figures 102 and 103). The distal area occurred at ~ 900 m elevation on Arenal's outer margins where the slope changes abruptly. A series of alternating lobes contained deposits that were 500°C on 11 June. The individual lobe's thickness reached up to about 3-4 m. The heterogeneous nature of the often angular blocks contrasted with a gray and quite sandy matrix, and included both pre-existing material eroded from the valley walls and more recent juvenile material from the summit. Conspicuous blocls from the block-and-ash flow (10% were 2-3 m in diameter and ~ 20% were ~ 1 m in diameter) are mostly juvenile material from the lava flow. The margins of the fan were covered by a fine dust layer several centimeters thick. On the S flanks, the block-and-ash deposit barely reached a few meters thick. On the N flanks, the deposit reached many tens of meters thick, the result of wind carrying the abundant fine materials in that direction.
Major S-flank avalanches reported on 6 and 10 June 2008 eroded a radially oriented gully (an avalanche chute). Later avalanches down this direction tended to form channelized deposits. A dark colored thick lava flow present at the summit (figure 104) provided an important source of materials in the deposits. The S-flank avalanches funneled through the gully, fracturing particles into finer grain sizes and generating columns of ash. During the visit, the team observed several avalanches containing large blocks that were similarly reduced in volume as they bounced through the gully. Some of these blocks arrived at the lower part of the fan with temperatures between 800 and 1,000°C. The large blocks seemingly cracked as the result of thermal shock, a process accelerated during a strong rainstorm.
Geologic Background. Conical Volcán Arenal is the youngest stratovolcano in Costa Rica and one of its most active. The 1670-m-high andesitic volcano towers above the eastern shores of Lake Arenal, which has been enlarged by a hydroelectric project. Arenal lies along a volcanic chain that has migrated to the NW from the late-Pleistocene Los Perdidos lava domes through the Pleistocene-to-Holocene Chato volcano, which contains a 500-m-wide, lake-filled summit crater. The earliest known eruptions of Arenal took place about 7000 years ago, and it was active concurrently with Cerro Chato until the activity of Chato ended about 3500 years ago. Growth of Arenal has been characterized by periodic major explosive eruptions at several-hundred-year intervals and periods of lava effusion that armor the cone. An eruptive period that began with a major explosive eruption in 1968 ended in December 2010; continuous explosive activity accompanied by slow lava effusion and the occasional emission of pyroclastic flows characterized the eruption from vents at the summit and on the upper western flank.
Information Contacts: E. Fernández, E. Duarte, W. Sáenz, V. Barboza, M. Martinez, E. Malavassi, and R. Sáenz, Observatorio Vulcanologico Sismologica de Costa Rica-Universidad Nacional (OVSICORI-UNA), Apartado 86-3000, Heredia, Costa Rica (URL: http://www.ovsicori.una.ac.cr/); Jorge Barquero Hernandez, Instituto Costarricense de Electricidad (ICE), Apartado 5 -2400, Desamparados, San José, Costa Rica.
Barren Island (India) — June 2008 Cite this Report
Barren Island
India
12.278°N, 93.858°E; summit elev. 354 m
All times are local (unless otherwise noted)
Thermal anomalies and red glow indicate that a new eruption started in May 2008
A scientific expedition in February 2008 observed that the morphology of the volcano had changed considerably since 2005. The eruption that began in May 2005 (BGVN 30:05) ejected lava and tephra that built a new scoria cone NE of the previous central cone. Lava flows covered all of the earlier flows, and several new spatter cones were formed. Fumarolic activity was continuing in February, with a large amount of steam from the central cone.
Activity seemingly decreased in late March 2006, as shown by a significant decline in the number and frequency of thermal anomalies (BGVN 32:07). However, intermittent anomalies continued until 5 October 2007, and ash plumes were seen in satellite imagery on 23 December 2007 (BGVN 33:02). Thermal anomalies detected by MODIS instruments began to be detected again on 12 May 2008 at 1935 (UTC), suggesting a renewal of eruptive activity. Anomalies continued to be identified on 19 days through the end of June.
During 15-30 June 2008 observers on an Indian Coast Guard patrol boat could see red glow from the central cone summit at night from a distance of about 10 km. There were also twelve earthquakes between 27 and 29 June, centered SW of Port Blair (140 km SW of Barren Island) in the Andaman Islands.
Geologic Background. Barren Island, a possession of India in the Andaman Sea about 135 km NE of Port Blair in the Andaman Islands, is the only historically active volcano along the N-S volcanic arc extending between Sumatra and Burma (Myanmar). It is the emergent summit of a volcano that rises from a depth of about 2250 m. The small, uninhabited 3-km-wide island contains a roughly 2-km-wide caldera with walls 250-350 m high. The caldera, which is open to the sea on the west, was created during a major explosive eruption in the late Pleistocene that produced pyroclastic-flow and -surge deposits. Historical eruptions have changed the morphology of the pyroclastic cone in the center of the caldera, and lava flows that fill much of the caldera floor have reached the sea along the western coast.
Information Contacts: Dornadula Chandrasekharam, Dept. Earth Sciences, Centre of Studies in Resources Engineering, Indian Institute of Technology Bombay, Mumbai 400076, India (URL: http://www.geos.iitb.ac.in/index.php/dc); Hawai'i Institute of Geophysics and Planetology (HIGP) Thermal Alerts System, School of Ocean and Earth Science and Technology (SOEST), Univ. of Hawai'i, 2525 Correa Road, Honolulu, HI 96822, USA (URL: http://modis.higp.hawaii.edu/).
Chaiten
Chile
42.8349°S, 72.6514°W; summit elev. 1122 m
All times are local (unless otherwise noted)
Events of June-July include diminished plumes, substantial seismicity, and lateral blast
Follow previous reports of May 2008 activity (BGVN 33:04, 33:05), this report summarizes Chaitén's behavior from 31 May through 25 July 2008. The bulk of this report came from SERNAGEOMIN (Servicio Nacional de Geología y Minería) and to some extent ONEMI (Oficina Nacional de Emergencia - Ministerio del Interior). A web camera located on a tower in Chaitén town and aimed upstream along the Blanco (Chaitén) river has helped authorities assess both the state of the volcano's plumes and the river (see URL in Information Contacts). In a later section are included some descriptions and photos by Richard Roscoe taken on 9 July.
On 3 June it was reported that lateral blasts or surges (or related processes) had devastated ~ 25 km2 of native forest. Other behavior during this interval included consistent ash plumes, which were generally present when the volcano was visible, and continued growth of the intracrater dome and tephra cone. Vent areas and the dome and tephra cone's morphology changed as the dome grew more elongate.
The late May to early June behavior included a short-term seismic decrease, and a weakened eruptive column. During the reporting interval, the column was often noticeably weaker than in early May, but the seismicity was still relatively high. The two main seismic instruments monitoring the volcano (figure 13) registered numerous sustained events through late July, which began to cluster NNE of Chaitén. Some of the earthquakes were up to M 2.6.
SERNAGEOMIN repeatedly interpreted the earthquakes to signify magma ascending from depth. If this magma reached the surface, they noted, vigorous eruptions might return. The high-viscosity of rhyolitic magmas seen here increases potential explosivity. This rhyolitic eruption at Chaitén is the first historically at a monitored volcano. The last significant rhyolitic eruption was at Novarupta volcano in Alaska in 1912.
Chaitén town has largely survived the lahars thus far. A deeper concern is that the growing dome and tephra cone sent bouncing rocks and smaller debris into the caldera's moat. In an early July SERNAGEOMIN report, the authors noted that the caldera's breach, located on the S, appeared blocked by recently eroded products. Small lakes were also then seen on the crater floor. Since the moat area drains to the S through this breach and feeds into the Blanco river, temporary dams in the moat area might seal the caldera's outflow, only to suddenly fail and release large volumes of debris towards the town. Despite this concern, as of 25 July such an event had been absent; however, on 12 July a sudden flood struck Chaitén town (see below).
Activity during June 2008. On 1 June, Chaitén's plume blew W, affecting Chiloé island (including the towns of Queilen, Lebjn, Chonchi, Dalcahue, and Castro, the island's capital). These conditions thwarted work on the seismic network. On 2 June dense fog affected the Gulf of Corcovado, especially adjacent Chiloé island, an atmosphere attributed to remobilization of air-fall ash by wind. That day, a helicopter managed to take off and the view enabled scientists to see an eruptive column to no higher than 3.0 km altitude dispersing SSE.
Seismicity on 2 July was higher than the previous days. Abundant were VT earthquakes, followed by long- period (LP) earthquakes. Between 1 and 2 July, seismic stations registered an average of 5 VT earthquakes per hour (below M 2). At some stations, some of the LP signals were sporadic, lasting less than a minute.
A 5 June SERNAGEOMIN report noted that explosions diminished gradually. Although ash was present, vapor dominated the emissions. A 3 June aerial inspection revealed that the dome's volume and footprint had increased, although it still had not reached the caldera's N wall.
The effects of N and NE flank blasts (or surges, pyroclastic flows, or related processes) were noted during aerial observations from the 3 June flight. The surges had scorched and burned an area of native forest. On this day observers computed an estimate of the damaged area, ~ 2,500 hectares (~ 25 km2). An undated photo looking down on part of the destruction appeared in BGVN 33:05 and more photos appear below. Several SERNAGEOMIN reports mentioned small pyroclastic flows during early and mid-May (12 May in particular, BGVN 33:05). Bulletin editors take the 3 June estimate as reflecting the sum of all devastation to that point in time.
On 3 and 4 June the plume's top stood below 3 km altitude. A 10 June SERNAGEOMIN report noted the continued lowered eruptive and seismic intensity through that time. Plumes continued to remain under 3 km altitude and they still affected air travel.
On 12 June observers at Chaitén town noticed tephra-bearing emissions. Noises had emanated from the volcano that day and the previous one. The SERNAGEOMIN report associated these emissions with two new vents seen on the S flank of the old dome, where craters had developed. Vapor-rich plumes had emerged from these areas and the observers inferred that the vents were possibly due to magma-water interactions. In addition, sudden floods swept into Chaitén town in the afternoon on 12 June, despite a lack of evidence for greater rains across the region. They were inferred as related to the emissions the same day.
Seismicity beneath the volcano on 12 June increased in the morning both in terms of the number of earthquakes and their magnitudes. Most of these events were less than M 2. Two prominent earthquakes struck ~ 5 km farther NE of the volcano, along the Liquiñe-Ofqui fault zone.
The 22 June report noted that observers looking at the contact between the old and new domes had seen two craters there that emitted ash plumes. The observers also noted near-source falls of both blocks and ash.
The same report said that a 17 June aerial inspection documented an ash plume to over 2 km over the volcano's summit that blew N and NW. Roars and associated noise from the eruption included the sound of an explosion at 1430 on 17 June. The resulting column rose to a height above the summit of over 3 km but later dropped to 2 km. Emissions continued from a crater S of the contact between the old and new domes. Immediately to the W of this crater, a new and growing crater issued increasingly large emissions of ash and gas. Numerous smaller vents were also apparent, chiefly emitting steam. Loose material covered parts of the old dome, forming a ring-shaped structure (a tephra cone). That structure's steep sides and inner and outer walls occasionally underwent mass wasting. Poor weather during 19-25 June halted aerial inspections then, but ash fell in Chaitén town and to the W and SE, as well as Queilen and other portions of E Chiloé island.
Following 20 June, seismicity remained stable with ~ 40-45 earthquakes per day. Sporadic numbers of VT earthquakes took place; there was no change in the number of LP earthquakes. Investigators inferred a lack of pressure increase in the volcanic system. During bad weather on 23-25 June some earthquakes again occurred on the Liquiñe-Ofqui fault zone, with epicenters in an area 2-3 km E of the volcano. A power outage struck midday on 25 June. A back-up power supply (UPS) worked for a while, but ultimately the outage caused several hours of lost seismic data at the Queilen processing center. Available data suggested a small increase in both the number and amplitudes of earthquakes during 24-25 June. During 0000-1200 on 25 June, instruments recorded 35 VT earthquakes, and four of those were M 2.2; LP earthquakes were absent.
Seismicity during the days leading up the SERNAGEOMIN report issued on 27 June reflected VT earthquakes generally below M 2, reaching 50 per day. An exception was on the 25th when four earthquakes exceeded M 2.0.
July 2008. On 1 July an ash column rose ~ 3 km above the top of the new dome. It blew N and NE. An aerial observation at close hand discerned two roughly vertical, sub-parallel eruption plumes issuing from vents in the crater. One plume, most active in recent weeks, came from a sector S of the new dome. The second plume came from a sector more to the W of the new dome. A photo of the scene in the 3 July SERNAGEOMIN report also depicted the area of eruption largely engulfed in white clouds from numerous fumaroles on the dome. On 3 July SERNAGEOMIN began a series of reports on unrest at Llaima stratovolcano (which went to Red alert on 10 July). Around 16 July a weather front also moved in across the Chiloé island region. Consecutive SERNAGEOMIN reports discussing Chaitén were only issued on 3 and 21 July, with a lack of much discussion on that volcano for the interval 3-15 July.
During 15-20 July seismicity stood relatively high, with an average of 350-400 VT earthquakes per day. On 20 July more than 20 earthquakes surpassed M 2.6. The next reports noted that on 21 and 22 July VT earthquakes occurred 330 times per day; 60 of those were near M 2.6, and that the number of earthquakes decreased on 24 July. Still, some of the minor earthquakes reached M 2.6 and were detected up to 300 km away. Seismic data around this time were interpreted to reflect magma at depth moving towards the surface, possibly implying a reactivation of the system, although the earthquake's depth was poorly constrained.
Chaitén's plume blew E at ~ 2 km altitude above the summit and appeared weaker than usual when seen as the weather cleared after 1500 on 23 July. During 22-24 July, earthquakes had increased both in number and magnitude, with the largest M ~ 2.6.
A new area of epicenters appeared during 22 and 23 July at a location 6 km ENE of the volcano. Seismic stations located 176 and 296 km from Chaitén, respectively monitoring the volcanoes Calbuco and Puyehue-Cordón Caulle, recorded these events, the first such occurrence since the eruption began. Previously, conspicuous epicenters had mainly occurred to the S and SE. Preliminary hypocenter calculations suggested the larger earthquakes in this NNE area were deeper, at 10-15 km depth.
Arrival times of S- and P-waves at stations Pumalín and Santa Bárbara indicated that the smaller magnitude earthquakes still occurred S and SE of Chaitén, whereas the larger magnitude earthquakes struck in the area 6 km ENE. An inspection flight carried viewers to the N and NE of the volcano on 24 July where they saw that the single active central vent sat to the S of the new dome. The emissions then were intermittent, white, and ash poor. When strongest, a thin plume rose to under 2 km altitude, with strong winds causing dispersion to the S and SE. When viewed on 24 July, the new dome also contained a significant depression in the S sector, at a point immediately N of the main active vent mentioned above. This depression emitted steam and gases. The new dome seemed to have decreased its growth rate, at least in the N sector. Strong steaming emerged from base of the dome's E sector. The observers looked around the new dome on the NW, N and NE sides, and they saw neither ponded areas nor lakes. During 24-27 July, the ash column rose to 2.5 km and occasionally 3.0 km altitude. The most active vent was the previously mentioned one located S of the new dome. The plume blew N and NW where it affected various localities along the coast.
Floating pumice. By early June, the white pumice from the eruption accumulated at river mouths to the volcano's W. Some fragments of pumice were as large as 40 cm in diameter. In addition to the Blanco river, those carrying the pumice included the Yelcho and Negro (respectively entering the sea 2 km and 5 km S of Chaitén town). Pumice rafts in the Gulf were seen in May (BGVN 33:05). During June and at least early July, along beaches of Chiloé (and particularly at Lelbjn, 12 km N of Queilen, a town almost directly W of Chaitén town) floating pumice continued to arrive. This area lies 60-100 km across Corcorvado gulf from the mouth of the Blanco river at Chaitén town. The pumice deposits, which included tree trunks and other debris, covered a thin zone along the shoreline stretching ~ 20 m from the sea's edge when photographed the afternoon of 1 July.
Roscoe's July 2008 photos. One of the subjects Roscoe presented on his PhotoVolcanica website was Chaitén's N devastated area, and some of those photos appear here (figures 14 and 15). The captions were brief and omitted the direction the camera was aimed. He visited the devastated area on 9 July 2008.
Roscoe noted that in the area he photographed, "Most trees were snapped off a couple of meters above the ground. The [pyroclastic] flow does not appear to have been hot enough to burn the leaves off the trees at the point we visited at the base of the volcano. Many branches with brown leaves were lying around. Very little pumice was found in the area although much of it may have been swept away during subsequent heavy rainfall."
In Chaitén town, Roscoe documented damage-mitigation and salvaging efforts (figure 16). Two of Roscoe's photos showed heavy equipment (a large backhoe and a bulldozer) reshaping the lahar deposits in an attempt to control encroaching lahars. Other scenes included people retrieving belongings, excavating lahar deposits covering the floor and lower shelves of a grocery store, and improving drainage from and access to their homes.
Geologic Background. Chaitén is a small caldera (~3 km in diameter) located 10 km NE of the town of Chaitén on the Gulf of Corcovado. Multiple explosive eruptions throughout the Holocene have been identified. A rhyolitic obsidian lava dome occupies much of the caldera floor. Obsidian cobbles from this dome found in the Blanco River are the source of artifacts from archaeological sites along the Pacific coast as far as 400 km from the volcano to the N and S. The caldera is breached on the SW side by a river that drains to the bay of Chaitén. The first recorded eruption, beginning in 2008, produced major rhyolitic explosive activity and building a new dome and tephra cone on the older rhyolite dome.
Information Contacts: Servicio Nacional de Geología y Minería(SERNAGEOMIN), Avda Sta María No 0104, Santiago, Chile (URL: http://www.sernageomin.cl/); Oficina Nacional de Emergencia - Ministerio del Interior (ONEMI), Beaucheff 1637 / 1671, Santiago, Chile (URL: http://www.onemi.cl/); Luis E. Lara, Departamento de Geología Aplicada, SERNAGEOMIN; Richard Roscoe, Photovolcanica.com (URL: http://www.photovolcanica.com/).
Erta Ale
Ethiopia
13.601°N, 40.666°E; summit elev. 585 m
All times are local (unless otherwise noted)
Active lava lake visited in February 2008
Around 2-3 February 2008, a Volcano Discovery tour visited Erta Ale (figures 18-21). Tom Pfeiffer reported that the northern pit crater contained a lake of molten lava ~ 75 m across. Strong spattering and bursting bubbles were seen. At times, the lava lake rose and flooded the lower terrace. During this phase the usual fountains ceased. Richard Roscoe, who also visited during February 2008, presents animations of the flooding on his Photovolcanica website. He also shows photos of strong fountaining associated with falling lava lake levels.
Occasionally, magmatic gas released in the middle of the lake created a zone a few meters in diameter where fountains typically lasted ~ 1 minute (figure 20). Thin threads of lava (Pelee's hair) are visible in some lava-fountain photographs. Richard Roscoe also features similar photos. Marco Fulle noted strong spattering when lava was drawn down (subducted) into the lake.
A Volcanologique de Genève (SVG) trip on 8-9 February 2008 noted extensions of ropy lava in the N crater. The lake was little changed from the group's last visit in 2005. The group visited the N Crater, and, given its constant degassing, was able to take gas samples. They also measured the lake's surface temperature (700°C). The descent into this crater, seemingly easy, was made difficult by a mantle of very unstable lava scoria. An elevated level of the lava lake halted a subsequent descent.
References. Rivallin, P., and Mougin, D., 2008, Trip report of Pierrette Rivallin and Dédé Mougin: LAVE Bulletin, no. 79, May 2008.
Geologic Background. The Erta Ale basaltic shield volcano in Ethiopia has a 50-km-wide edifice that rises more than 600 m from below sea level in the Danakil depression. The volcano includes a 0.7 x 1.6 km summit crater hosting steep-sided pit craters. Another larger 1.8 x 3.1 km wide depression elongated parallel to the trend of the Erta Ale range is located SE of the summit and is bounded by curvilinear fault scarps on the SE side. Basaltic lava flows from these fissures have poured into the caldera and locally overflowed its rim. The summit caldera usually also holds at least one long-term lava lake that has been active since at least 1967, and possibly since 1906. Recent fissure eruptions have occurred on the N flank.
Information Contacts: Tom Pfeiffer, Volcano Discovery (URL: http://www.VolcanoDiscovery.com/); Marco Fulle, Osservatorio Astronomico, Trieste, Italy; Richard Roscoe (URL: http://www.photovolcanica.com/).
Ol Doinyo Lengai (Tanzania) — June 2008 Cite this Report
Ol Doinyo Lengai
Tanzania
2.764°S, 35.914°E; summit elev. 2962 m
All times are local (unless otherwise noted)
Explosive eruptions continue into June 2008
According to government authorities in the Ngorongoro district of Tanzania and the 22 March 2008 edition of Arusha Times, nine months after the mountain began continuous eruptive activity (BGVN 33:02), many residents had moved to other villages at a safe distance. Ngorongoro district member of parliament Saning'o Ole Telele told reporters that up to 5,000 people may have moved out of the area. The last major eruption was in August 1966. Since then there had not been an eruption of such magnitude, although notable ones were recorded in 1983, 1993, 2002 and 2006.
Recent observations. Table 19 lists recent observations from April through early July 2008.
On 2 April 2008, Chris Daborn of Tropical Veterinary Services Ltd reported that the color of ash plumes changed from "salty" white to a more inert black, and eruptions were much smaller, barely rising above the mountain. Heavy rains made movement in the area difficult, washing away ash.
Table 19. Summary of visitors to Ol Doinyo Lengai and their brief observations (from a climb, aerial overflight, flank, or satellite) April-early July 2008 (continued from BGVN 33:02). Most of this list is courtesy of Frederick Belton.
| Date |
Observer |
Observation Location |
Brief Observations |
| 02 Apr 2008 |
Chris Daborn |
Flank? |
See text. |
| 03 Apr 2008 |
Jurgis Klaudius |
Satellite |
MODIS thermal anomaly data from N crater indicated that eruptions continued (see table 20). |
| 07-08 Apr 2008 |
Ben Wilhelmi |
Aerial |
See text. |
| early Apr 2008 |
Ben Wilhelmi, Michael Dalton-Smith |
Aerial |
See text. |
| 17 Apr 2008 |
Matthieu Kervyn |
Satellite |
MODIS/MODLEN data indicated a significant hotspot on Lengai on 17 April, showing that activity, although intermittent, continued (see text). |
| 14-16 May 2008 |
Chris Weber, Marc Szeglat |
Climb |
See text. |
| 03, 10, 12 Jun 2008 |
Ben Wilhelmi |
Aerial |
No activity observed. |
| 08 Jun 2008 |
Ben Wilhelmi |
Aerial |
Ash eruption. |
| 12 Jun 2008 |
Fred Belton |
Aerial? |
Ash-poor plume above Lengai ~1500 m. |
| 17 Jun 2008 |
Local Masaai from Engare Sero village |
Climb |
Climbed Lengai via the W route through the Pearly Gates (closed to climbers for several months due to dangerous activity). |
| 18 Jun 2008 |
Fred Belton, Paul Hloben, Paul Mongi, Mweena Hosa, Peter (Masaai guide) |
Climb |
See text. |
| 18 Jun 2008 |
Ben Wilhelmi |
Aerial |
See text. |
| 19 Jun 2008 |
Ben Wilhelmi |
Aerial |
No activity observed. |
| 30 Jun 2008 |
Ben Wilhelmi |
Aerial |
Gray plumes emerging from crater. |
| 01 Jul 2008 |
Ben Wilhelmi |
Aerial |
Small collapse of the S part of the new crater rim. |
Ben Wilhelmi flew over on 7 and 8 April 2008 just prior to an eruption on the 7th and following the start of an eruption on the 8th. The flanks showed newly formed erosion gullies in the recently deposited ash (figure 111). Pilots Wilhelmi and Michael Dalton-Smith observed little activity during early April, although visibility was hampered by atmospheric clouds on several occasions; aerial photos showed no activity on 11 April.
On 14-16 May 2008, Chris Weber and Marc Szeglat visited. Weber noted that only minor ash eruptions were reported by local Masaai after the eruptions on 8 and 17 April 2008. Some of the evacuated Masaai had returned to their settlements, but part of the livestock had not returned by the middle of May. The fall-out of pyroclastics was still visible around the volcano. Due to a heavy rain season, vegetation damage was not as severe as it could have been. Up to an altitude of ~ 1,000 m the vegetation (mostly 'Elephant grass', normal grass, and some Akazia trees) was undamaged except for the W side, where severe damage occurred as far as 10 km from the summit. Some lahars had occurred on the N and NE sides. The former trekking route was not recommended because of rockfalls and poor conditions. Weber and Szeglat used a very steep route on the SE side (named "simba route"). From ~ 1,000 m altitude ash layers were clearly visible on the ground, but new grass had grown since the eruption. Above ~ 1,500 m on the SE flank all vegetation was covered by pyroclastic material. From an altitude of ~ 2,500 m, additional impacts of volcanic bombs were visible. In the inactive S crater, at their campsite, all vegetation was destroyed, and volcanic bomb impacts from the explosive events on April 2008 were quite impressive.
The active N crater had a new morphology (figure 112). The N-S diameter of the crater was 300 m and it was 283 m E-W. The crater floor was at ~ 2,740 m elevation, ~ 130 m deep below the W crater rim. Two vents, designated as c1 and c2, were present inside the crater (figure 112). Both vents were strongly degassing. On 15 May 2008, fine powdered ash was ejected until midday. It was not possible to determine which vent was responsible for this. After descent, Weber and Szeglat visited an abandoned Masaai boma (hut) a few kilometers W of the summit where ashfall had forced a family to flee.
On 8 June Wilhelmi saw a small eruption during a flyover. Photos made by Wilhelmi during overflights on 3, 10, and 12 June showed no activity. However, an ash-poor plume was seen by Fred Belton on 12 June.
On 17 June 2008 a group of Masaai from Engare Sero climbed via the W route through the Pearly Gates, which has been closed for several months. Fred Belton and Paul Hloben climbed on 18 June with a Masaai guide, Peter, and two other Tanzanians Paul Mongi and Mweena Hosa, following the route of the group from the previous day, which was covered by thick ash deposits. The route is subject to danger should there be a significant eruption. Belton's group spent about an hour on the rim of the active cone.
The new active cone covered the former crater floor entirely except for a region just N of the summit. The W, N, and E sides of the former crater were ~ 30 m higher than before and enclosed a deep pit crater with a couple of small vents. To the S, the rim of the new cone rested on the crater floor. To the E and W the new cone merged with and covered up the old rim at the points where it intersects the arc formed by the summit ridge. Thus, there was a section of the former crater floor which was bounded to the N by the new cone's S rim and to the E, S, and W by the original curving summit ridge.
From approximately 0920-1020 the pit crater frequently emitted an ash-poor plume from the SW part of its floor, and there was light ashfall on the rim. Loud rumbling was continuous and occasional sounds of gas jetting and rockfalls were heard amid other noises. Occasionally there was a sloshing/hissing noise resembling the sound of 'lava at depth' often heard in the past, but there was no evidence of lava in the crater. The summit and S crater were not visited due to atmospheric clouds around the summit.
On 18 June, Ben Wilhelmi photographed the climbers with Belton during a flyover (figure 113). No activity was seen the next day, but on 30 June Wilhelmi saw gray plumes emerging. A small crater rim collapse was seen on the S part of the crater wall on 1 July 2008.
Satellite thermal anomalies. Table 20 lists MODIS/MODVOLC thermal anomalies measured between November 2007 through July 2008; MODVOLC is the algorithm for identifying thermal anomalies used by the HIGP Thermal Alerts System Group. On 17 April 2008, as noted in table 19, MODIS data analyzed by Matthieu Kervyn's algorithm MODLEN (sensitive to lower temperature anomalies than MODVOLC) indicated a significant hotspot, showing that activity, although intermittent, continued.
Table 20. MODVOLC thermal anomalies measured by MODIS satellite at Ol Doinyo Lengai from November 2007 through July 2008. Courtesy of the MODIS Thermal Alerts System Group at the Hawai'i Institute of Geophysics and Planetology (HIGP).
| Date |
Time (UTC) |
Number of pixels |
Satellite |
| 17 Nov 2007 |
2000 |
2 |
Terra |
| 31 Nov 2007 |
2310 |
1 |
Aqua |
| 30 Dec 2007 |
0815 |
1 |
Terra |
| 08 Jan 2008 |
2030 |
2 |
Terra |
| 17 Jan 2008 |
2025 |
2 |
Terra |
| 17 Feb 2008 |
2240 |
3 |
Aqua |
| 22 Feb 2008 |
2300 |
1 |
Aqua |
| 28 Feb 2008 |
1135 |
1 |
Aqua |
| 29 Feb 2008 |
2305 |
1 |
Aqua |
| 07 Mar 2008 |
2310 |
1 |
Aqua |
| 10 Mar 2008 |
2045 |
4 |
Terra |
| 03 Apr 2008 |
1955 |
1 |
Terra |
Geologic Background. The symmetrical Ol Doinyo Lengai is the only volcano known to have erupted carbonatite tephras and lavas in historical time. The prominent stratovolcano, known to the Maasai as "The Mountain of God," rises abruptly above the broad plain south of Lake Natron in the Gregory Rift Valley. The cone-building stage ended about 15,000 years ago and was followed by periodic ejection of natrocarbonatitic and nephelinite tephra during the Holocene. Historical eruptions have consisted of smaller tephra ejections and emission of numerous natrocarbonatitic lava flows on the floor of the summit crater and occasionally down the upper flanks. The depth and morphology of the northern crater have changed dramatically during the course of historical eruptions, ranging from steep crater walls about 200 m deep in the mid-20th century to shallow platforms mostly filling the crater. Long-term lava effusion in the summit crater beginning in 1983 had by the turn of the century mostly filled the northern crater; by late 1998 lava had begun overflowing the crater rim.
Information Contacts: Frederick Belton, Developmental Studies Department, PO Box 16, Middle Tennessee State University, Murfreesboro, TN 37132, USA (URL: http://oldoinyolengai.pbworks.com/); Christoph Weber, Volcano Expeditions International (VEI), Muehlweg 11, 74199, Entergruppenbach, Germany (URL: http://www.volcanic-hazards.de/); Hawai'i Institute of Geophysics and Planetology (HIGP) Thermal Alerts System, School of Ocean and Earth Science and Technology (SOEST), Univ. of Hawai'i, 2525 Correa Road, Honolulu, HI 96822, USA (URL: http://modis.higp.hawaii.edu/); Matthieu Kervyn De Meerendre, Dept of Geology and Soil Science, Gent University, Krijgslaan 281, S8/A.310, B-9000 Ghent, Belgium (URL: http://homepages.vub.ac.be/~makervyn/).
Llaima
Chile
38.692°S, 71.729°W; summit elev. 3125 m
All times are local (unless otherwise noted)
Summary of January-February 2008 eruption; minor eruptions late March-early April 2008
A report from OVDAS-SERNAGEOMIN (Volcanological Observatory of the Southern Andes ? National Service of Geology and Mining) by Naranjo, Peña, and Moreno (2008) summarized the eruption at Llaima of January through February 2008. This and other reports from OVDAS-SERNAGEOMIN supplements earlier reports (BGVN 33:01) and extends observations through late April 2008.
Summary of January-February 2008 eruption. Shortly after 1730 (local time) on 1 January 2008, Llaima began a new eruptive cycle that was very similar in character to a large eruption that had occurred in February 1957. The 2008 activity was centered at the principal crater, a feature 350 x 450 m in diameter with the major axis trending NW-SE. This new continuous eruptive phase began with strong Strombolian eruptions. Strong ejections of lava fragments fell on the glaciers on the high flanks NE and W of the principal cone (figure 18), generating lahars that flowed ~15 km to reach the Captrén River to the N and the Calbuco River to the W (figure 19). The eruptive plume rose to an altitude of ~ 11 km and blew ESE; ash accumulated to a depth of ~11 cm at a distance of 7 km from the crater.
The 1 January 2008 phase was preceded by a slight increase in tremor and a swarm of low frequency earthquakes, but with an absence of volcano-tectonic (VT) or hybrid (HB) events. On 2 January 2008, the activity began to decline. However, a plume of sulfur dioxide (SO2) was tracked by satellite (figure 20).
An explosion on 7 January 2008 resulted in an ash plume that rose 5 km above the crater and traveled E toward Argentina. This explosion was associated with a low frequency, large magnitude event.
On 9 January, a series of explosions occurred. The seismicity included a swarm of low frequency, high-amplitude events and an abrupt increase in microseismicity that decreased gradually until 14 January and more slowly thereafter. On 18 January, after discrete low frequency tremors, explosions from the crater resulted in a pyroclastic flow on the upper E flank (figure 21).
On 21 January seismic activity increased. This was followed on 25 January by continuous Strombolian activity in the main crater. During the night of 26 January, a significant increase in activity occured. Pyroclastic-flow deposits were noted during 28 January on the E flank.
A lava lake that had formed in the main crater began to overflow the W rim on 3 February and a lava flow descended for 2.5 km, making channels in the ice tens of meters deep. The 'a'a lava flow, which was 30-40 m wide and 10 m thick, lasted until 13 February.
Between 8-13 February, explosions in the main crater propelled incandescent material 200-500 m in the air. Explosions occasionally alternated between N and S cones in the main crater. On 9 February, the Calbuco River was about 1 m higher than the normal level, likely due to melt water from the lava and glacier interaction. Strombolian eruptions from the main crater were observed during an overflight on 10 February. A strong explosion ejected bombs onto the E and NE flanks of the volcano on 12 February. Then, on 13 February, incandescence at the summit was noted. Thereafter seismic activity decreased, with only sporadic low frequency signals. The volcano was quiet until 21 February, when a small explosion occurred. Pyroclastic flows were also observed on 21 February descending the E and possibly the W flanks.
During the January-February eruptive phase, various types of plumes were observed, including steam plumes, sulfur dioxide plumes, small ash plumes, and ash-and-gas plumes. The Alert Level remained at Yellow.
March-April 2008. Fumarolic activity from the central pyroclastic cone in Llaima's main crater reactivated on 13 March and intensified during 15-17 March. SO2 plumes rose to an altitude of 3.6 km and drifted E. During 20-21 March, incandescent material propelled from the crater was observed at night.
During 28 March-4 April, fumarolic plumes from Llaima drifted several tens of kilometers, mainly to the SE. Explosions produced ash and gas emissions, and on 4 April, incandescence was reflected in a gas-and-ash plume. An overflight of the main crater on 2 April revealed pyroclastic material and ash and gas emissions, accompanied by small explosions, that originated from three cones.
On 24 April 2008, seismicity from Llaima again increased. Bluish gas (SO2) rose from the main crater, and ash-and-gas plumes associated with explosions rose to an altitude of 4.6 km. No morphological changes to the summit were observed during an overflight on 25 April except for a small increase of the diameter of the SE crater.
Thermal anomalies. Thermal anomalies measured by MODIS in 2008 began with an eruption on 1 January 2008 (BGVN 33:01) and continued almost daily through 13 February (table 3). Following a brief period of no measured anomalies, a new group occurred 30 March through 4 April, after which none were recorded through 1 June 2008. Advanced Spaceborne Thermal Emission and Reflection Radiometer (ASTER) images and reports by ground observers from Projecto Observación Visual Volcán Llaima (POVI) indicated incandescence at the volcano during periods when no anomalies were measured by the MODIS satellites (19-21 March and 24 April 2008), perhaps due to cloud cover. All periods of reported incandescence by ground observers during January 2008 were substantiated by MODIS measured thermal anomalies.
Table 3. MODIS thermal anomalies over Llaima from February through 1 June 2008; data processed by MODVOLC analysis. Daily anomalies were measured from 1-13 February 2008, followed by no anomalies through 29 March. After a period of anomalies from 30 March through 4 April 2008, none were measured through 1 June 2008. Some absences may be due to weather. Courtesy of HIGP Thermal Alerts System.
| Date |
Time (UTC) |
Pixels |
Satellite |
| 01 Feb 2008 |
0305 |
2 |
Terra |
| 01 Feb 2008 |
0620 |
2 |
Aqua |
| 01 Feb 2008 |
1405 |
1 |
Terra |
| 01 Feb 2008 |
1820 |
1 |
Aqua |
| 02 Feb 2008 |
0345 |
2 |
Terra |
| 02 Feb 2008 |
0525 |
1 |
Aqua |
| 02 Feb 2008 |
1450 |
2 |
Terra |
| 03 Feb 2008 |
0250 |
4 |
Terra |
| 03 Feb 2008 |
0430 |
4 |
Terra |
| 03 Feb 2008 |
0605 |
2 |
Aqua |
| 03 Feb 2008 |
1355 |
1 |
Terra |
| 03 Feb 2008 |
1535 |
2 |
Terra |
| 03 Feb 2008 |
1810 |
1 |
Aqua |
| 04 Feb 2008 |
0335 |
4 |
Terra |
| 04 Feb 2008 |
0510 |
6 |
Aqua |
| 04 Feb 2008 |
1850 |
2 |
Aqua |
| 05 Feb 2008 |
0415 |
2 |
Terra |
| 05 Feb 2008 |
0555 |
4 |
Aqua |
| 05 Feb 2008 |
1520 |
2 |
Terra |
| 06 Feb 2008 |
0320 |
3 |
Terra |
| 06 Feb 2008 |
0500 |
3 |
Aqua |
| 06 Feb 2008 |
0640 |
4 |
Aqua |
| 06 Feb 2008 |
1425 |
2 |
Terra |
| 07 Feb 2008 |
0405 |
4 |
Terra |
| 07 Feb 2008 |
0545 |
2 |
Aqua |
| 07 Feb 2008 |
1510 |
2 |
Terra |
| 08 Feb 2008 |
0625 |
6 |
Aqua |
| 08 Feb 2008 |
1415 |
3 |
Terra |
| 09 Feb 2008 |
0350 |
3 |
Terra |
| 09 Feb 2008 |
0530 |
6 |
Aqua |
| 09 Feb 2008 |
1455 |
2 |
Terra |
| 09 Feb 2008 |
1910 |
2 |
Aqua |
| 10 Feb 2008 |
0255 |
4 |
Terra |
| 10 Feb 2008 |
0435 |
4 |
Aqua |
| 10 Feb 2008 |
0615 |
5 |
Aqua |
| 10 Feb 2008 |
1540 |
4 |
Terra |
| 11 Feb 2008 |
0340 |
4 |
Terra |
| 11 Feb 2008 |
0520 |
4 |
Aqua |
| 11 Feb 2008 |
1445 |
5 |
Terra |
| 11 Feb 2008 |
1855 |
1 |
Aqua |
| 12 Feb 2008 |
0425 |
4 |
Terra |
| 12 Feb 2008 |
0600 |
7 |
Aqua |
| 12 Feb 2008 |
1525 |
5 |
Terra |
| 12 Feb 2008 |
1940 |
4 |
Aqua |
| 13 Feb 2008 |
0330 |
2 |
Terra |
| 13 Feb 2008 |
0645 |
2 |
Aqua |
| 30 Mar 2008 |
0340 |
1 |
Terra |
| 01 Apr 2008 |
0505 |
1 |
Aqua |
| 02 Apr 2008 |
0550 |
1 |
Aqua |
| 04 Apr 2008 |
0400 |
1 |
Terra |
| 04 Apr 2008 |
0535 |
2 |
Aqua |
Reference. Naranjo, J.A., Peña, P., and Moreno, H., 2008, Summary of the eruption at Llaima through February 2008: National Service of Geology and Mining (Servico Nacional de Geologia y Mineria - SERNAGEOMIN).
Geologic Background. Llaima, one of Chile's largest and most active volcanoes, contains two main historically active craters, one at the summit and the other, Pichillaima, to the SE. The massive, dominantly basaltic-to-andesitic, stratovolcano has a volume of 400 km3. A Holocene edifice built primarily of accumulated lava flows was constructed over an 8-km-wide caldera that formed about 13,200 years ago, following the eruption of the 24 km3 Curacautín Ignimbrite. More than 40 scoria cones dot the volcano's flanks. Following the end of an explosive stage about 7200 years ago, construction of the present edifice began, characterized by Strombolian, Hawaiian, and infrequent subplinian eruptions. Frequent moderate explosive eruptions with occasional lava flows have been recorded since the 17th century.
Information Contacts: OVDAS-SERNAGEOMIN (Observatorio Volcanológico de los Andes del Sur-Servico Nacional de Geologia y Mineria) (Southern Andes Volcanological Observatory-National Geology and Mining Service), Avda Sta María 0104, Santiago, Chile (URL: http://www.sernageomin.cl/); NASA Earth Observatory (URL: http://earthobservatory.nasa.gov/); Hawai'i Institute of Geophysics and Planetology (HIGP) Thermal Alerts System, School of Ocean and Earth Science and Technology (SOEST), Univ. of Hawai'i, 2525 Correa Road, Honolulu, HI 96822, USA (URL: http://modis.higp.hawaii.edu/); Buenos Aires Volcanic Ash Advisory Center (VAAC), Servicio Meteorológico Nacional-Fuerza Aérea Argentina, 25 de mayo 658, Buenos Aires, Argentina (URL: http://www.smn.gov.ar/vaac/buenosaires/productos.php); POVI (Projecto Observación Visual Volcán Llaima) (Project of Visual Observation of Llaima Volcano) (URL: http://www.povi.cl/llaima/); Japan Aerospace Exploration Agency-Earth Observation Research Center (JAXA-EORC) (URL: http://www.eorc.jaxa.jp/); ONEMI (Oficina Nacional de Emergencia - Ministerio del Interior) (National Bureau of Emergency - Ministry of Interior), Chile (URL: http://www.onemi.cl/).
Okmok (United States) — June 2008 Cite this Report
Okmok
United States
53.43°N, 168.13°W; summit elev. 1073 m
All times are local (unless otherwise noted)
Large explosive eruption started on 12 July, ash plumes initially rose to 15.2 km altitude
The Alaska Volcano Observatory (AVO) reported that on 12 July 2008 at 1143 a strong explosive eruption at Okmok began abruptly after about an hour of rapidly escalating earthquake activity. The Volcano Alert Level was raised to Warning and the Aviation Color Code was raised to Red from the previous Alert Level of Normal/Green. The last explosive eruption began on 13 February, 1997 (BGVN 22:01) from a cone on the south side of the caldera floor. Lava flowed across the caldera floor until 9 May. Ash plumes generally rose to altitudes of 1.5-4.9 km from 13 February to about 23 May, when thermal anomalies and plumes were no longer seen on satellite imagery. One ash plume rose to an altitude of 10.5 km on 11 March. In May 2001 a small seismic swarm (BGVN 26:08) was detected in the vicinity of the volcano. The earthquake locations could not be pinpointed because Okmok is not monitored by a local seismic network.
The initial phase of the 2008 eruption was very explosive, with high levels of seismicity that peaked at 2200 then began to decline. A wet gas-and-ash-rich plume was estimated to have risen to altitudes of 10.7-15.2 km or greater. Wet, sand-sized ash fell within minutes of the onset of the eruption in Fort Glenn, about 10 km WSW. Heavy ashfall occurred on the eastern portion of Umnak Island; a dusting of ash that started at 0345 also occurred for several hours about 105 km NE in Unalaska/Dutch Harbor. News media reported that residents of Umnak Island heard thundering noises the morning of 12 July and quickly realized an eruption had begun. After calling the US Coast Guard for assistance, they began to evacuate to Unalaska using a small helicopter. A fishing boat evacuated the remaining residents after heavy ashfall made further flights impossible.
On 13 July, reports from Unalaska indicated no ashfall had occurred in Unalaska/Dutch Harbor since the previous night. The National Weather Service reported that the ash plume rose to an altitude of 13.7 km (figure 1). Plumes drifted SE and E. Based on observations of satellite imagery, the ash plume altitude was 9.1 km and drifted SE. However, satellite tracking of the ash cloud by traditional techniques was hampered by the high water content due to interaction of rising magma with very shallow groundwater and surficial water inside the caldera.
Ash erupted from a vent or vents near composite cinder cone called Cone D in the eastern portion of the 9.7-km wide caldera. Activity during the past three significant eruptions (1945, 1958, and 1997) occurred from Cone A, a cinder cone on the far western portion of the caldera floor. Each of the three previous eruptions was generally mildly to moderately explosive with most ash clouds produced rising to less than 9.1 km altitude. Each eruption also produced a lava flow that traveled about 5 km across the caldera floor.
AVO reported that during 15-16 July seismicity changed from nearly continuous to episodic volcanic tremor, and the overall seismic intensity declined. Little to no ash was detected by satellite, but meteorological clouds obscured views. Satellite imagery from 0533 on 16 July indicated elevated surface temperatures in the NE sector of the caldera. On 16 July, a light dusting of ash was reported in Unalaska/Dutch Harbor. A plume at an altitude of 9.1 km was visible on satellite imagery at 0800. On 17 July, a pilot reported that an ash plume rose to altitudes of 4.6-6.1 km and drifted E and NE. The sulfur dioxide plume had drifted at least as far as eastern Montana (figure 2). On 18 July, the eruption was episodic, with occasional ash-producing explosions occurring every 15 to 30 minutes. The plumes from these explosions were limited to about 6.1 km.
Geologic Background. The basaltic Okmok shield volcano forms the NE end of Umnak Island in the Aleutian Islands. The summit of the low, 35-km-wide volcano is cut by two overlapping 10-km-wide calderas formed during eruptions about 12,000 and 2,050 years ago when dacitic pyroclastic flows reached the coast. More than 60 tephra layers from Okmok have been found overlying the 12,000-year-old caldera-forming tephra layer. Numerous cones and lava domes are present on the flanks down to the coast, including the SE-flank Mount Tulik, which is almost 200 m higher than the caldera rim. Some of the post-caldera cones show evidence of wave-cut lake terraces; more recent cones were formed after the caldera lake, once 150 m deep, disappeared. Eruptions have been reported since 1805 from cinder cones within the caldera, where there are also hot springs and fumaroles.
Information Contacts: Alaska Volcano Observatory (AVO), a cooperative program of the U.S. Geological Survey, 4200 University Drive, Anchorage, AK 99508-4667, USA; Geophysical Institute, University of Alaska, PO Box 757320, Fairbanks, AK 99775-7320, USA; and Alaska Division of Geological & Geophysical Surveys, 794 University Ave., Suite 200, Fairbanks, AK 99709, USA (URL: http://www.avo.alaska.edu/); Associated Press (URL: http://www.ap.org/).
Papandayan (Indonesia) — June 2008 Cite this Report
Papandayan
Indonesia
7.32°S, 107.73°E; summit elev. 2665 m
All times are local (unless otherwise noted)
Minor seismic activity and fumarolic plumes through 16 April 2008
Our last report on Papandayan (BGVN 29:08) described a modest surge in seismicity that began in July 2004, which rose for a short time but began to subside in mid-August 2004. We received no subsequent reports until June 2005. This report discusses non-eruptive restlessness from early June 2005 through the middle of April 2008, including wide fumarolic temperature variations, seismicity, and occasional minor steam plumes.
Beginning in early June 2005, the number of volcanic earthquakes increased in comparison to the previous months, and fumarole temperatures increased 3-9°C above normal levels. People were not permitted to visit Mas and Baru craters. On 16 June 2005, the Center of Volcanology and Geological Hazard Mitigation (CVGHM) in Indonesia raised the Alert Level at Papandayan from 1 to 2 (on a scale of 1-4) due to increased activity at the volcano. The Alert Level remained at 2 at least through 13 December 2005.
No subsequent reports were received until July 2007. On 15 July there was one volcanic earthquake; the next day 2-10 volcanic earthquakes were recorded. By 31 July, fumarole temperatures had increased 10°C above normal levels in Mas crater. On 1 August up to 53 volcanic earthquakes were recorded and a diffuse white plume rose to an altitude of 2.7 km. Residents and tourists were not permitted within a 1 km radius of the active craters.
On 2 August 2007, CVGHM raised the Alert Level from 1 to 2 (on a scale of 1-4) due to increased seismic activity at the volcano. Seismic events decreased in number after 2 August; earthquake tremors were not recorded after 14 November 2007, and on 7 January 2008, CVGHM lowered the Alert Level at Papandayan from 2 to 1 due to the decrease in activity during the previous four months. Data from deformation-monitoring instruments indicated deflation. White fumarolic plumes rose to an altitude of 2.9 km.
No subsequent reports were received until April 2008. According to the CVGHM, on 15 April the seismic network recorded one tremor signal. On 16 April, measurements of summit fumaroles revealed that the temperature had increased and water chemistry had changed since 7 April. White plumes continued to rise to an altitude of 2.7 km. CVGHM again increased the Alert Level to 2 and warned people not to venture within 1 km of the active crater.
Geologic Background. Papandayan is a complex stratovolcano with four large summit craters, the youngest of which was breached to the NE by collapse during a brief eruption in 1772 and contains active fumarole fields. The broad 1.1-km-wide, flat-floored Alun-Alun crater truncates the summit of Papandayan, and Gunung Puntang to the north gives a twin-peaked appearance. Several episodes of collapse have created an irregular profile and produced debris avalanches that have impacted lowland areas. A sulfur-encrusted fumarole field occupies historically active Kawah Mas ("Golden Crater"). After its first historical eruption in 1772, in which collapse of the NE flank produced a catastrophic debris avalanche that destroyed 40 villages and killed nearly 3000 people, only small phreatic eruptions had occurred prior to an explosive eruption that began in November 2002.
Information Contacts: Center of Volcanology and Geological Hazard Mitigation (CVGHM), Jalan Diponegoro No. 57, Bandung 40122, Indonesia (URL: http://vsi.esdm.go.id/).
Raung
Indonesia
8.119°S, 114.056°E; summit elev. 3260 m
All times are local (unless otherwise noted)
New eruption during 12-17 June sends ash plumes to 4.5 km altitude
In an Antara News report, Balok Suryadi, an observer at the Center of Volcanology and Geological Hazard Mitigation (CVGHM) Raung monitoring post at Sumber Arum village, described clouds of "smoke and ash" that occurred on 12 and 13 June. He was also quoted in the 19 June article as saying that activity was "likely" continuing but that it could not be clearly monitored from the observation post.
Another ash eruption was seen rising through the clouds on 17 June 2008 around 1500. This event was photographed by Karim Kebaili while flying from Bali to Jakarta approximately 30 minutes after take-off (figure 4). The same eruption was seen at 1430 by pilot Nigel Demery, who stated that the ash cloud initially rose to about 4.5 km altitude but had dissipated on his return flight about two hours later. The Darwin VAAC was unable to identify the plume in satellite imagery due to meteorological clouds.
Thermal anomalies were detected by the MODIS instrument aboard the Terra satellite on 23 July 2005 and 15 August 2005. No additional thermal anomalies were detected through the end of June 2008. However, ash plumes were reported by pilots on 26 July 2007 and seen in satellite imagery on 26 August 2007 (BGVN 32:09).
Geologic Background. Raung, one of Java's most active volcanoes, is a massive stratovolcano in easternmost Java that was constructed SW of the rim of Ijen caldera. The unvegetated summit is truncated by a dramatic steep-walled, 2-km-wide caldera that has been the site of frequent historical eruptions. A prehistoric collapse of Gunung Gadung on the W flank produced a large debris avalanche that traveled 79 km, reaching nearly to the Indian Ocean. Raung contains several centers constructed along a NE-SW line, with Gunung Suket and Gunung Gadung stratovolcanoes being located to the NE and W, respectively.
Information Contacts: Rebecca Patrick, Darwin Volcanic Ash Advisory Centre (VAAC), Bureau of Meteorology, Northern Territory Regional Office, PO Box 40050, Casuarina, Northern Territory 0811, Australia (URL: http://www.bom.gov.au/info/vaac); Center of Volcanology and Geological Hazard Mitigation (CVGHM), Jalan Diponegoro 57, Bandung 40122, Indonesia (URL: http://www.vsi.esdm.go.id/); Nigel Demery, Indonesia; Karim Kebaili, Indonesia; Antara News (URL: http://www.antara.co.id/); Hawai'i Institute of Geophysics and Planetology (HIGP) Thermal Alerts System, School of Ocean and Earth Science and Technology (SOEST), Univ. of Hawai'i, 2525 Correa Road, Honolulu, HI 96822, USA (URL: http://modis.higp.hawaii.edu/).
Tungurahua (Ecuador) — June 2008 Cite this Report
Tungurahua
Ecuador
1.467°S, 78.442°W; summit elev. 5023 m
All times are local (unless otherwise noted)
Explosions up to 14 km altitude during July 2007 to February 2008
Our previous report on Tungurahua (BGVN 32:08) discussed the volcano's activity during March-July 2007. During that period, Ecuador's Instituto Geofisico (IG) reported significant, but variable eruptive behavior, along with many lahars, ash plumes that reached 4 km above the summit, and semi-continuous ashfall.
Table 15 presents a brief summary of the weekly activity at Tungurahua between 18 July 2007 and 19 February 2008. The plumes were described variously as ash, ash-and-gas, steam-and-gas, steam, or steam-and-ash. They rose up to 13 or 14 km altitude (25-26 October 2007 and 7 February 2008, respectively) but more typically, for many weeks, to below 8 km altitude. Around December 2007 IG stated a caution. They likened Tungurahua's behavior as similar to after its explosive phase of 14 July 2006. In that case, volcanic activity kept going, and this lead to the most explosive phase on 16 August 2006. That dramatic pattern was not repeated the next month, but the pace of volcanism kept up and led to the vigorous 7 February eruption.
Table 15. Summary of weekly activity at Tungurahua between 18 July 2007 and 19 February 2008. Courtesy of IG.
| Date |
Plume altitude |
Activity |
| 18 Jul-24 Jul 2007 |
5.2-8 km |
Roaring, noises resembling cannon shots or rolling blocks, lahars, ashfall. |
| 25 Jul-31 Jul 2007 |
up to 2-3 km above crater |
Many small ash-bearing explosions and several unusually large ones, blocks fell up to 0.5 km below crater's rim, ashfall. |
| 01 Aug-07 Aug 2007 |
up to 5.5 km |
Roaring, explosions, rolling blocks, steam emissions, ashfall. |
| 08 Aug-14 Aug 2007 |
up to 6 km |
Explosions, incandescent material fell inside the crater and on the flanks, ashfalls, lahars down NW drainage disrupted road traffic between Ambato and Banos. |
| 15 Aug-21 Aug 2007 |
5.5 km |
Cannon shot noises, explosions, ash emissions, ashfall. |
| 22 Aug-28 Aug 2007 |
6-9 km |
Explosions, incandescent blocks down flanks, lahars in the NW drainage disrupted road traffic, ashfall. |
| 29 Aug-04 Sep 2007 |
7 km |
Explosions, roaring and cannon shot noises, incandescent blocks ejected, lahars disrupted road traffic, ashfall. On 4 September incandescence and rolling blocks on the E and N flanks. |
| 05 Sep-11 Sep 2007 |
5.3-8 km |
Explosions, incandescent blocks rolled down flanks, ashfall. |
| 12 Sep-18 Sep 2007 |
5.5-8 km |
Strombolian eruption, explosions, incandescent material ejected above the summit and blocks rolled 100 m down the flanks, roaring and cannon shot noises, ashfall. |
| 19 Sep-25 Sep 2007 |
5.3-7 km |
Explosions, roaring and cannon shot noises, incandescent material ejected above the summit and blocks rolled 500 m down the flanks, ashfall. |
| 26 Sep-02 Oct 2007 |
6-7 km |
Roaring and cannon shot noises, 28 September, blocks ejected above the summit and descended 500 m down the flanks, ashfall. |
| 03 Oct-09 Oct 2007 |
6-8 km |
Ash plumes, roaring and cannon shot noises, noise of rolling blocks, ashfall. |
| 10 Oct-16 Oct 2007 |
6.2-8 km |
Ash plumes. During 11-12 October incandescent blocks ejected and descended 300 m down the W flank; roaring noises from multiple areas on 11, 13, and 14 October. Ashfall. |
| 17 Oct-23 Oct 2007 |
5.5-9 km |
Ash plumes. 17 October, roaring, incandescent material erupted from the summit fell onto the flanks. Fumarolic activity on NW flank, lahars closed road on NW drainage. Ashfall SW on 21 October. |
| 24 Oct-30 Oct 2007 |
up to 13 km |
Ash and steam plumes. 25-26 October, incandescence at summit, roaring and cannon shot noises, blocks rolling down the flanks; ashfall. |
| 31 Oct-06 Nov 2007 |
5.5-8 km |
Explosions, roaring, incandescent blocks at summit, lahars closed road, ashfall. |
| 07 Nov-13 Nov 2007 |
6-9 km |
Roaring and cannon shot noises, incandescent blocks rolled a few hundred meters (1 km on 12 Nov) down the flanks, fumarolic activity, lahar, ashfall. |
| 14 Nov-20 Nov 2007 |
up to 7.3 km |
Roaring and cannon shot noises, incandescent blocks rolled down flanks, thermal anomaly detected. |
| 21 Nov-27 Nov 2007 |
6-8 km |
Explosions, roaring, incandescent blocks 1 km down the flanks, lahars (4-5 m high in one area) closed road, ashfall. |
| 28 Nov-04 Dec 2007 |
6-8 km |
Elevated seismicity, explosions, continuous emissions of steam and ash, roaring and cannon shot noises, incandescent blocks 0.5-1 km down flanks, ashfall. |
| 05 Dec-11 Dec 2007 |
6-8 km |
Explosions, roaring and cannon shot noises, incandescent material about 1 km down flanks, ashfall. |
| 12 Dec-18 Dec 2007 |
6-7 km |
Explosions, roaring and cannon shot noises, almost constant emission of of ash plumes, incandescent blocks rolled down flanks, ashfall. |
| 19 Dec-25 Dec 2007 |
6-8.5 km |
Roaring and cannon shot noises, incandescent blocks hundreds of meters down flanks, ashfall. News reports indicated that 1,200 people from Penipe were evacuated nightly. |
| 26 Dec-01 Jan 2008 |
6-8 km |
Explosions, roaring, and cannon-shot noises, incandescent blocks 500 m down flanks, ashfall. |
| 02 Jan-08 Jan 2008 |
5.5-8 km |
Explosions, roaring and cannon shot noises, continuous ash emissions, incandescent blocks 500 m down flanks, ashfall. News reports indicated that nearly 1,000 people were evacuated for the night on 6 Jan. |
| 09 Jan-15 Jan 2008 |
6-9 km |
Strombolian eruption, roaring and cannon shot noises, incandescent blocks 0.5-1 km down flanks. News reports indicated that residents from two provinces evacuated at night and about 20,000 health masks were distributed in Banos and Quero. |
| 16 Jan-22 Jan 2008 |
5.5-9 km |
Strombolian eruption, roaring and cannon shot noises, incandescent blocks 1-2 km down flanks, small pyroclastic flow 400 m down NW side of crater, ashfall. |
| 23 Jan-29 Jan 2008 |
5.5-9 km |
Roaring and cannon shot noises, incandescent blocks 500-800 m down flanks, lahars blocked road to Banos, ashfall up to at least 40 km from summit. |
| 30 Jan-06 Feb 2008 |
6-9 km |
Explosions (65-208 per day), roaring and cannon shot noises, incandescent blocks rolled 600 m down flanks, lahar, ashfall. |
| 06 Feb 2008 |
-- |
New phase of eruptions began with a moderate explosion. |
| 07 Feb 2008 |
6-14.3 km |
Tremors of variable intensity, ash columns to heights of 3 km beginning a new phase of eruptive activity; satellite images show a hot spot in the crater. Strombolian eruptions, explosions, strong roaring and cannon shot noises, incandescent material rolled 1.2 km down the flanks, tremors followed by pyroclastic flows on the NW and W flank, tephra fall SW, ashfall. News articles stated several hundred to 2,000 people evacuated. |
| 08 Feb 2008 |
-- |
Internal volcanic activity as well as emissions of ash, incandescent material, and explosions and roaring noises slowly diminished; current eruptive episode should not be considered as finished. |
| 09 Feb-12 Feb 2008 |
-- |
Strombolian eruptions, explosions, strong roaring and cannon shot noises, incandescent material rolled 1.2 km down the flanks, pyroclastic flows, tephra fall, ashfall. News articles stated several hundred to 2,000 people evacuated. |
| 13 Feb-19 Feb 2008 |
6-9 km |
Roaring, noises resembling blocks rolling down flanks, lahar, ashfall. |
Geologic Background. Tungurahua, a steep-sided andesitic-dacitic stratovolcano that towers more than 3 km above its northern base, is one of Ecuador's most active volcanoes. Three major edifices have been sequentially constructed since the mid-Pleistocene over a basement of metamorphic rocks. Tungurahua II was built within the past 14,000 years following the collapse of the initial edifice. Tungurahua II collapsed about 3,000 years ago and produced a large debris-avalanche deposit to the west. The modern glacier-capped stratovolcano (Tungurahua III) was constructed within the landslide scarp. Historical eruptions have all originated from the summit crater, accompanied by strong explosions and sometimes by pyroclastic flows and lava flows that reached populated areas at the volcano's base. Prior to a long-term eruption beginning in 1999 that caused the temporary evacuation of the city of Baños at the foot of the volcano, the last major eruption had occurred from 1916 to 1918, although minor activity continued until 1925.
Information Contacts: Geophysical Institute (IG), Escuela Politécnica Nacional, Apartado 17-01-2759, Quito, Ecuador (URL: http://www.igepn.edu.ec/); Washington Volcanic Ash Advisory Center, Satellite Analysis Branch (SAB), NOAA/NESDIS E/SP23, NOAA Science Center Room 401, 5200 Auth Rd, Camp Springs, MD 20746, USA (URL: http://www.ospo.noaa.gov/Products/atmosphere/vaac/); Reuters (URL: http://www.reuters.com/); Associated Press (URL: http://www.ap.org/); Pan American Health Organization (PAHO), 525 23rd St. NW, Washington, DC 20037, USA (URL: http://www.paho.org/).
Ubinas
Peru
16.345°S, 70.8972°W; summit elev. 5608 m
All times are local (unless otherwise noted)
Frequent ash plumes pose risk to aviation and residents
Our most recent report on Ubinas (BGVN 33:01) discussed ongoing eruptions with continuous emissions of volcanic ash, rock, and gases during 2006-2007. During that previously discussed interval, ash plumes sometimes reached ~ 9 km altitudes at times, posing a hazard to aviation, ashfall was heavy. The current report discusses activity from the end of the previous report (17 December 2007) through 15 July 2008. During this period, ash plumes were frequent, as indicated in table 4. No thermal alerts have been detected by the University of Hawaii's Institute of Geophysics and Planetology (HIGP) MODIS satellite-based thermal alert system since 27 December 2006.
Table 4. Compilation of Volcanic Ash Advisories for aviation from Ubinas during 19 December 2007 through July 1, 2008. Courtesy of the Buenos Aires Volcanic Ash Advisory Center (VAAC) and the Instituto Geológical Minero y Metalúrgico (INGEMMET).
| Date |
Plume altitude (km) |
Plume direction |
| 19-25 Dec 2007 |
5.5-7 |
NE, SW |
| 23 Feb 2008 |
5.5-8.5 |
SE |
| 02 Mar 2008 |
5.5-6.1 |
SE |
| 09 Mar 2008 |
7 |
W, SW |
| 17 Mar 2008 |
5.5-6.1 |
N |
| 26 Mar 2008 |
3.7-6.7 |
SW |
| 01 Apr 2008 |
3.7-6.7 |
NW |
| 06 Apr 2008 |
5.5-6.7 |
E |
| 15 Apr 2008 |
5.5-7 |
ENE |
| 19-22 Apr 2008 |
5.5-7.6 |
ESE, NE |
| 23 Apr 2008 |
5.5-9.1 |
SE, S |
| 30 Apr-03 May 2008 |
5.5-9.1 |
NE, E, SE |
| 09 May 2008 |
5.5-7 |
E |
| 12 May 2008 |
5.5-7 |
SE |
| 15 May 2008 |
5.5 |
E, SW |
| 19 May 2008 |
8.5 |
E, SW |
| 22-24 May 2008 |
4.9-7.9 |
S, E, NE, SE |
| 26 May 2008 |
5.4 |
SSE |
| 28-29 May 2008 |
5.5-6.1 |
NE, SE |
| 03 Jun 2008 |
4.6 |
SSW |
| 07 Jun 2008 |
7.3 |
S |
| 13 Jun 2008 |
6.7 |
S |
| 18 Jun 2008 |
5.5-5.8 |
S, SE, and NE |
| 22 Jun 2008 |
5.5-7.6 |
S, SE, NE |
| 26 Jun 2008 |
5.5-6.1 |
NE |
| 07 Jul 2008 |
5.5-5.8 |
NE |
| 09-10 Jul 2008 |
5.5-5.8 |
E |
| 15 Jul 2008 |
5.5-5.8 |
E |
According to the ash advisories issued from the Buenos Aires VAAC, the aviation warning color code for Ubinas during the reporting period was variously orange or red. In terms of hazard status on the ground, a news article on 30 June 2008 indicated that local civil defense officials had maintained the Alert level at Yellow. They noted that small explosions and ash-and-gas emissions had continued during the previous two months. Families at immediate risk from the village of San Pedro de Querapi in the vicinity of the volcano have been relocated but have returned to their fields to pursue their agacultural activities. The population of local communities and their livestock had suffered the effects of gas and ash emissions, and local authorities had begun to discuss the possible relocation of about 650 affected families from six towns (Escacha, Tonoaya, San Migues, San Pedro de Querapi, Huataga and Ubinas). The article noted that officials recognized that the relocation process could take several years and should be the villager's decision and not one forced on them.
Geologic Background. The truncated appearance of Ubinas, Perú's most active volcano, is a result of a 1.4-km-wide crater at the summit. It is the northernmost of three young volcanoes located along a regional structural lineament about 50 km behind the main volcanic front. The growth and destruction of Ubinas I was followed by construction of Ubinas II beginning in the mid-Pleistocene. The upper slopes of the andesitic-to-rhyolitic Ubinas II stratovolcano are composed primarily of andesitic and trachyandesitic lava flows and steepen to nearly 45°. The steep-walled, 150-m-deep summit crater contains an ash cone with a 500-m-wide funnel-shaped vent that is 200 m deep. Debris-avalanche deposits from the collapse of the SE flank about 3,700 years ago extend 10 km from the volcano. Widespread Plinian pumice-fall deposits include one from about 1,000 years ago. Holocene lava flows are visible on the flanks, but activity documented since the 16th century has consisted of intermittent minor-to-moderate explosive eruptions.
Information Contacts: Instituto Geológical Minero y Metalúrgico (INGEMMET), Av. Canadá 1470, San Borja, Lima 41, Perú (URL: http://www.ingemmet.gob.pe/); Buenos Aires Volcanic Ash Advisory Center (VAAC), Argentina (URL: http://www.smn.gov.ar/vaac/buenosaires/productos.php); La República Online (URL: http://www.larepublica.com.pe).
Witori (Papua New Guinea) — June 2008 Cite this Report
Witori
Papua New Guinea
5.5745°S, 150.5161°E; summit elev. 724 m
All times are local (unless otherwise noted)
Ejection of lava fragments in late August 2007; quiet steaming
Reports about Pago early in 2006 (BGVN 31:02) noted small vapor emissions, but no noises or glow, and low levels of seismicity. Similar observations were reported by the Rabaul Volcano Observatory (RVO) for December 2006. A local security company reported that sometime during 27-31 October 2006 there was a single booming noise accompanied by a white-gray emissions above the summit. Volcanologists were sent to verify the activity, but no report about the event was received. A March 2007 report only noted diffuse white vapor emissions and low seismicity.
On 28 August 2007 lava fragments were observed being ejected during the daytime from one of the Upper vents (2nd Crater). People in a nearby village heard only a single booming noise in the early hours of 27 August. The residents also indicated increased white vapor emissions from 2nd Crater on the 27th that returned to normal levels the following day. Seismic activity had increased on 27-28 August, and the Real-Time Seismic Amplitude Measurement (RSAM) increased from background level (around 100 units) to a peak of about 400 units. RSAM levels began to decline on the 29th, returning to background levels on 30 August. An inspection on 1 October revealed that only the 2nd Crater of the Upper Vents was releasing diffuse white vapor, and that there were no noises or glow.
Pago remained quiet during September-November 2007. When observations were made, only diffuse white vapor was being released from the Upper Vents. A handful of high-frequency earthquakes and 18 low-frequency events were recorded during September. The daily number of earthquakes ranged from 1 to 4 from 1 to 24 September, with none after through the end of the month. There was a slight increase in gas emission during 9-11 November. The vapor plume was blown N, where villagers reported nose and windpipe irritation, and watery eyes. The daily number of high-frequency earthquakes ranged from 1 to 3, while low-frequency earthquakes ranged from 1 to 9. During January 2008 Pago was still quiet with diffuse white vapor from the upper vents and very occasional low-frequency seismic events.
Geologic Background. The active Pago cone has grown within the Witori caldera (5.5 x 7.5 km) on the northern coast of central New Britain contains the active Pago cone. The gently sloping outer caldera flanks consist primarily of dacitic pyroclastic-flow and airfall deposits produced during a series of five major explosive eruptions from about 5,600 to 1,200 years ago, many of which may have been associated with caldera formation. Pago cone may have formed less than 350 years ago; it has grown to a height above the caldera rim, and a series of ten dacitic lava flows from it covers much of the caldera floor. The youngest of these was erupted during 2002-2003 from vents extending from the summit nearly to the NW caldera wall. The Buru caldera cuts the SW flank.
Information Contacts: Ima Itikarai and Herman Patia, Rabaul Volcano Observatory (RVO), P.O. Box 386, Rabaul, Papua New Guinea.