Report on Cerro Hudson (Chile) — July 1991
Bulletin of the Global Volcanism Network, vol. 16, no. 7 (July 1991)
Managing Editor: Lindsay McClelland.
Cerro Hudson (Chile) SO2 circles globe; aircraft encounter ash over Australia; >1 km3 airfall on Argentina
Please cite this report as:
Global Volcanism Program, 1991. Report on Cerro Hudson (Chile) (McClelland, L., ed.). Bulletin of the Global Volcanism Network, 16:7. Smithsonian Institution. https://doi.org/10.5479/si.GVP.BGVN199107-358057
Cerro Hudson
Chile
45.9°S, 72.97°W; summit elev. 1905 m
All times are local (unless otherwise noted)
On 12 August, the volcano entered a paroxysmal phase, after four days of lesser explosive activity. Tephra was ejected to 16-18 km height, falling up to 1,000 km SE on the Falkland Islands, and with estimates of >1 km3 deposited in Argentina [but see 16:8]. Ash leacheate analyses showed unusually high levels of fluorine. The SO2-rich plume produced by the eruption was rapidly transported around the world, returning to Chile within 7 days. Airline pilots reported sighting the plume as it passed near Melbourne, Australia (roughly 15,000 km from the volcano).
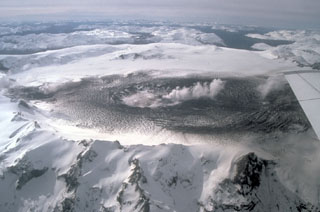
Initial strong explosive activity, 8-10 August. The following quoted material is from José A. Naranjo. "Just 20 years after the previous activity, Hudson started a new eruption on 8 August at 1820. Local inhabitants who were evacuated from the Huemules River (to the W) reported small precursory seismic activity 3-4 hours before the first explosion. The eruption started with a phreato-magmatic explosion that produced a column almost 7-10 km high. Immediately following the initial explosion, a dense, ash-laden column (light brown-greyish in color) formed, reaching ~12 km. Intense lightning discharged from the mushroom-shaped cloud. Activity steadily decreased through 11 August, when direct observation of the summit showed that the 8 August eruption vent was on the W side of the caldera (10 x 7 km; figure 1). The caldera floor was covered by glacial ice estimated to be at least 40 m thick, and having a volume of about 2.5 km3. In addition, a flank valley, extending 10 km NW from the summit to Huemules valley, is filled with a tongue of ice from the main summit glacier. This terminates at the Huemules Valley, which extends onward ~35 km W to the coast.
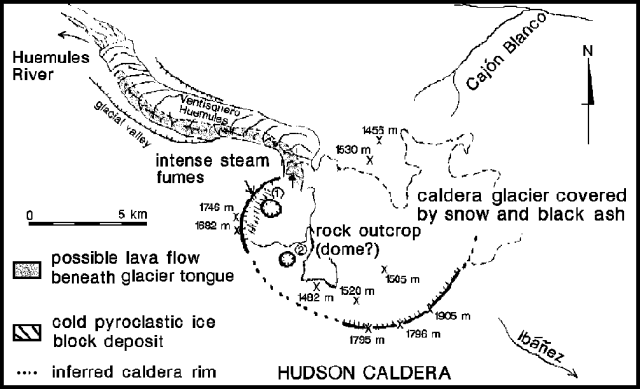 |
Figure 1. Sketch map of the summit area of Hudson, 11 August 1991. Courtesy of José Naranjo. |
"Prevailing winds during clear weather carried the column NNE (figure 2) over Puerto Chacabuco (50 km away), where 5-7 mm of ash was deposited. At Puerto Aisén (~ 65 km NNE), ash accumulations reached 5 mm in 16 hours. Lava was observed beneath glacial ice near the vent, flowing down to Ventisquero ('glacial tongue') Huemules. Between 3 and 4 hours after the main explosion, a jökullhaup flowed down the Huemules valley to the coast. A 2-m-thick deposit of ash- to lapilli-sized sand and 0.2-5-m-diameter ice blocks was randomly dispersed near the delta. These ice blocks probably floated in the mudflow." The press reported that the flow increased the river width from 80 m to 170 m.
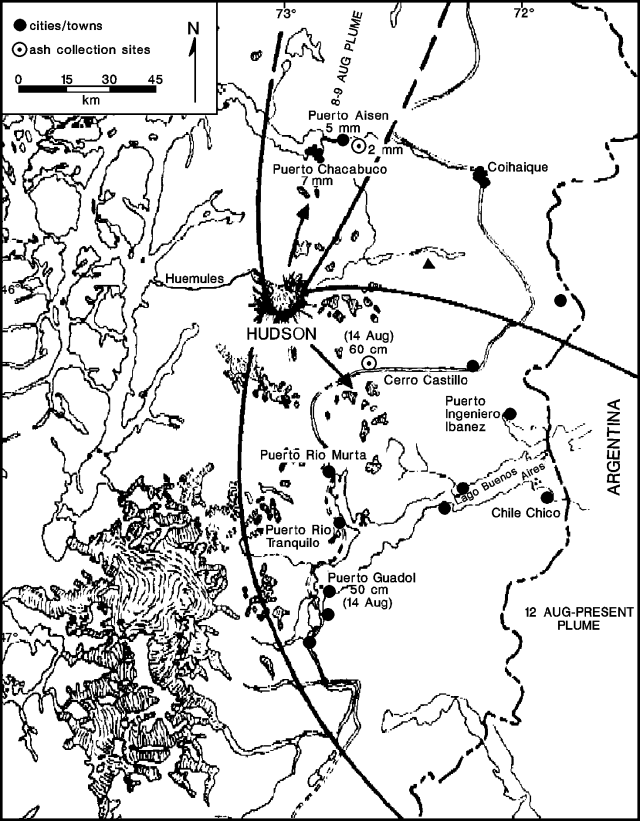 |
Figure 2. Map showing the location of Hudson and the direction of ash dispersal on 8-9 and 12-15 August 1991. Courtesy of José Naranjo. |
Late on 9 August, a NOTAM reported the plume at 11-12 km altitude. Although the eruption remained nearly continuous, intensity declined. By 10 August, Ladeco (Chilean Airlines) pilots reported the plume at ~ 6 km altitude.
"Eleven people were evacuated from along the Huemules River on 11 August. Direct observations at 1250 showed an explosion from a new vent (Crater 2), about 2.5 km SSE of the first vent (Crater 1; figure 1). The new white-and-black explosion cloud was smaller and spread laterally, developing black, cold pyroclastic-ice flows around the vent, similar to the original. White-grey columns, reaching 3 km height, were observed up to the last direct observation at 1630 on 11 August.
Paroxysmal activity, 12-15 August. "A second, larger eruption started at about 1200 on 12 August. Bad weather prevented aerial observation, but heavy ashfall was reported at Río Murta (60 km SSE) at 1245, and 7 minutes later at Río Tranquilo, 20 km farther S. The ashfall was accompanied by intense lightning, and a sulfur odor. At 1300, ashfall was reported at Puerto Guadal (105 km S). The eruption was directly observed on a commercial flight at 1430. The dense, brown-grey cauliflower-shaped cloud, carried SE, was visible from 4 km altitude, but clearly reached >10 km, with more than a 5-km thickness. One explosion was observed rising at a rate of 1.9 km/min. Observations ended at 1440.
"Since 12 August the eruption has continued without variation, and the plume has been carried SE. On 13 August at 1415, a black ash-laden column was reported from a commercial airplane at >10 km altitude. Pumice fall was since reported beginning 14 August, and coarse lapilli up to 5 cm in diameter fell 55 km SE."
Although weather clouds obscurred the eruption plume to visible and infrared satellite images on the 12th and much of the 13th, preliminary data from the Nimbus-7 satellite (TOMS) indicated 250,000 metric tons of SO2, within a disconnected section of the eruption cloud near the Falkland Islands at about 1100 on the 13th. Beginning at about 2000, a continuous, narrow, eruption plume was visible on AVHRR (NOAA 9 and 11) and GOES satellite images, gradually extending 1200 km SE, beyond the Falkland Islands, at ~12 km altitude. The plume became disconnected from the volcano at about 1200 on 14 August, by which time, Naranjo reported, the eruptive column reached a stable altitude of 16 km. TOMS data from 1100 on the 14th revealed a segment of SO2-rich plume (probably the same as on the 13th) near South Georgia Island (2,600 km ESE of the volcano), and a second, smaller segment over the Falkland Islands. No other SO2-rich plume was visible.
Intense seismic activity was felt on 14 August at 1630, 60 km SSE, where 3-cm-diameter pumice was falling. A continuous eruption began again at about 2000, when satellite images (GOES and NOAA 9 and 11) showed that the plume was carried SE at 185 km/hr (100 knots) at stratospheric altitudes of 17-18 km (figure 3). Seismicity increased, with felt earthquakes at Coyhaique (80 km NE) beginning at 2200, and a series of five large earthquakes (M>5) detected near Hudson by the WWSSN beginning at 2238 (table 1). Early on the 15th, the plume extended 1,500 km SE, past the Falkland Islands, where it divided into two components, one travelling E, the other S, both quickly becoming diffuse. At its widest point (the Falkland Islands), the plume was 370 km wide. Infrared satellite imagery showed the plume before it disconnected from the volcano at 1130. TOMS data from 1100 on the 15th (figure 4) showed the plume already disconnected from the volcano, and containing roughly twice as much SO2 as on the 13th (missing data prevented more accurate determinations). No additional emissions have been reported as of 23 August.
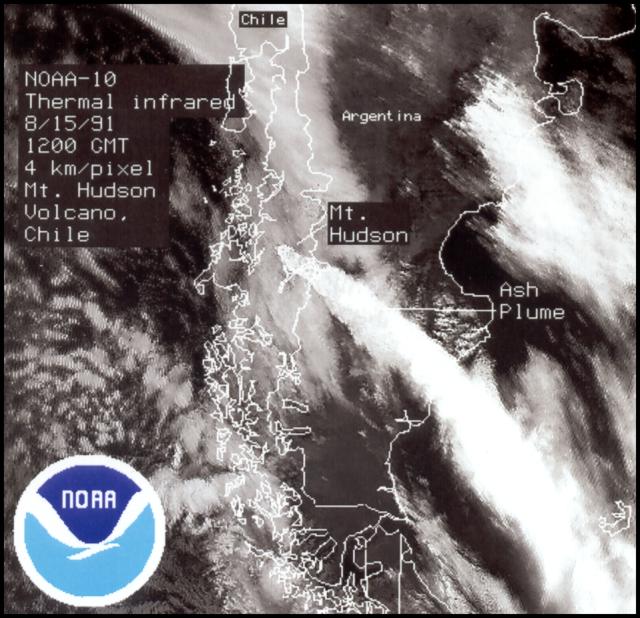 |
Figure 3. Infrared image from the NOAA 10 polar orbiting weather satellite on 15 August 1991 at about 0800, showing the ash plume extending SE from Hudson. Temperature estimates suggest that the plume is at aboout 17-18 km altitude. Courtesy of G. Stephens. |
Table 1. Earthquakes near Hudson recorded by the Worldwide Standardized Seismic Net on 14-15 August 1991. Original, very preliminary data are replaced by information from the National Earthquake Information Center's Preliminary Determination of Epicenters.
| Date | Time | Latitude | Longitude | Magnitude | Depth |
| 14 Aug 1991 | 2238:15 | 45.6°S | 72.6°W | 5.2 mb | -- |
| 15 Aug 1991 | 0039:08.5 | 45.7°S | 72.6°W | 5.3 mb | -- |
| 15 Aug 1991 | 0250:37.9 | 45.8°S | 72.5°W | 5.3 mb | -- |
| 15 Aug 1991 | 0546:15.7 | 45.7°S | 73.2°W | 5.7 Ms | 13 km |
| 15 Aug 1991 | 0816:19.3 | 45.6°S | 71.9°W | 5.3 mb | -- |
Eruption plume migration. The eruption plume of 14-15 August was rapidly carried E by the "Roaring Forties" winds as shown by TOMS data (figure 4), reaching Australia (15,000 km E) on 20 August. There the following report was compiled from airline information by Alfred Prata:
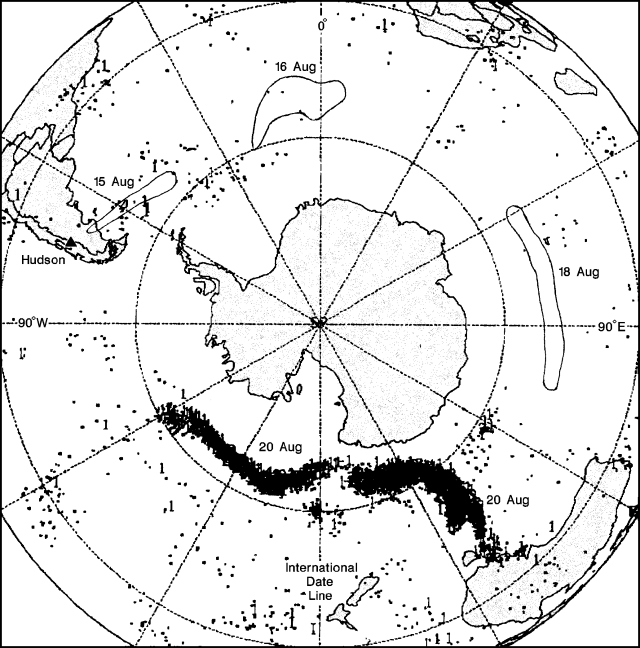 |
Figure 4. Preliminary data from the TOMS on the Nimbus-7 satellite showing a polar view of an eruption cloud from Hudson on 20 August 1991 at about 1100 (local time). Each dot represents SO2 values above 10 milliatmosphere-cm (100 ppm-m), within an area 50 km across. The prominent concentration of SO2 to the left represents the cloud's position 24 hours after that to the right, but both are 20 August because they straddle the International Date Line. Envelopes surrounding the cloud's position at approximately 1100 (local time) on 15, 16, and 18 August have been added to illustrate its passage around the globe. Courtesy of Scott Doiron. |
"On 20 August, Australian Airlines flight FL418 (Airbus) from Melbourne to Sydney reported an encounter with a strange hazy cloud 260 km NE of Melbourne at about 0230. The haze was faint grey, much like the material often trapped under a temperature inversion, and had a brownish-orange tinge. The haze appeared uniform (not wispy) and there was no evidence of any trace of debris. Associated with this was a strong smell of sulfurous gas which entered the aircraft and was noticed by the crew and passengers. The return flight departed Sydney at about 0400 and encountered the same haze in roughly the same place at 0445. The aircraft was in the haze for 5-10 minutes (75-150 km) and did not change their flight level (FL330, ~10 km altitude). A NOTAM was issued for the period of the evening of the 20th through the morning of the 22nd." The cloud was also reported by pilots from Qantas and Ansett, as late as 2000 on the 20th.
The Atmospheric Research Division of CSIRO were able to discriminate the plume, ~ 500 km long and 100 km wide, on an AVHRR image by ratioing bands 4 and 5. TOMS data showed the plume continuing its eastward path, reaching Chile on 21 August.
Deposits and post-eruptive activity. Intense fumarolic activity continued from a 2-km fissure (oriented N20°E) on the WNW caldera margin during a 23 August overflight. Weaker fumarolic activity was observed on the interior slopes of the 500-m-diameter Crater 1, located 400 m E of the fissure (figure 1). The fissure and Crater 1 were the site of activity 8-10 August.
A black flow (probably lava), with shades of reddish-brown, extended about 3.5 km from the extreme N end of the fissure, onto Ventisquero Huemules. The flow was 50-300 m wide, with several broader sections, and covered recent scoria (8-10 August) in places. Several weak vapor/gas emissions were visible. Scoriaceous pyroclastic flow deposits containing large quantities of ice and snow extended from the fissure toward the interior of the caldera, and in part, over Ventisquero Huemules toward the NW, and Huemules Valley.
Products of the 8-10 August activity were basaltic in composition. Ash samples (ranging to 0.1 mm in size) from Puerto Aisén contained abundant magnetite, pyroxene, plagioclase, and black glass shards. Silica contents of the ash were determined to be 50.98% (at Sernageomin Laboratory).
At Crater 2, believed to be the site of activity on 12-15 August, intense degassing occurred at 3 fumaroles along the S margin. Concentric cracks were visible in the thick ice surrounding the 800-m-wide Crater 2. Pumice from 12-15 August activity differed in composition from the earlier erupted material. Whole rock analyses (from Peter Bitschene) indicated a trachyandesitic composition, with ~ 60% SiO2 and 8-9% alkalies. The distal fallout ash was >98% vitric with predominant pumice and platy shards, and some entrained blocky basaltic shards.
Bitschene estimated that more than 1 km3 of tephra was deposited in Argentina's Santa Cruz province [but see 16:8]. Lakes near the volcano were highly turbid and had layers of floating pumice along their E shores. Increased sediment load resulted in the acceleration of delta growth in Lago Buenos Aires (SE; also called Lago General Carrera), and silting up of the mouth of Río Ibáñez near Puerto Ingeniero Ibáñez (75 km SE) creating a flood risk.
Roughly 50-60,000 sheep and cattle are located within the airfall zone. Extremely high values of fluorine (225 ppm water extractable) were obtained from the ash analyzed 4 days after the eruption. Alberto Villa (INTA, Univ de Chile) reported that grass samples collected at the same site had 280 ppm fluorine (on a dry basis). [but see 16:9-10]
Reference. Stern, C.R., 1991, Mid-Holocene Tephra on Tierro del Fuego (54°S) Derived from the Hudson Volcano (46°S): Evidence for a Large Explosive Eruption; Revista Geológica de Chile, v. 18, no. 2, in press.
Geological Summary. The ice-filled, 10-km-wide caldera of Cerro Hudson volcano was not recognized until its first 20th-century eruption in 1971. It is the southernmost volcano in the Chilean Andes, related to subduction of the Nazca plate beneath the South American plate. The massive volcano covers an area of 300 km2. The compound caldera is drained through a breach on its NW rim, which has been the source of mudflows down the Río de Los Huemeles. Two cinder cones occur N of the volcano and others occupy the SW and SE flanks. This volcano has been the source of several major Holocene explosive eruptions. An eruption about 6,700 years ago was one of the largest known in the southern Andes during the Holocene; another eruption about 3,600 years ago also produced more than 10 km3 of tephra. An eruption in 1991 formed a new 800-m-wide crater in the SW portion of the caldera.
Information Contacts: J. Naranjo, SERNAGEOMIN; H. Moreno, Univ de Chile; G. Fuentealba and P. Riffo, Univ de La Frontera; P. Bitschene, Patagonia Volcanism Project, Argentina; N. Banks, USGS; SAB, NOAA; G. Stephens, NOAA/NESDIS; S. Doiron, GSFC; B. Presgrave, NEIC; C. Stern, Univ of Colorado, Boulder; A.J. Prata, CSIRO, Australia; ICAO; Radio Nacional de Chile; AP.