Report on Rinjani (Indonesia) — June 1994
Bulletin of the Global Volcanism Network, vol. 19, no. 6 (June 1994)
Managing Editor: Richard Wunderman.
Rinjani (Indonesia) Continued plumes; "VAFTAD" transport-dispersion modeling
Please cite this report as:
Global Volcanism Program, 1994. Report on Rinjani (Indonesia) (Wunderman, R., ed.). Bulletin of the Global Volcanism Network, 19:6. Smithsonian Institution. https://doi.org/10.5479/si.GVP.BGVN199406-264030
Rinjani
Indonesia
8.42°S, 116.47°E; summit elev. 3726 m
All times are local (unless otherwise noted)
The eruptions continued at least into early July. Observations of early June plumes indicated that they drifted in several different directions; a computer simulation confirmed several directions of drift but failed to confirm an ~800-km-long, N-trending plume suggested by satellite data.
Near-source ash deposited on Lombok Island indicated a plume trajectory toward the SE (figure 3). As yet, there are no reports of ash deposited at substantial distances from the Island, suggesting that the broad-scale plume trajectory has to be studied by other means. Also, at present there appears to be little information on plume height or eruption chronology and duration.
Reports from aviators and meteorologists described the plume on 9-11 June as drifting in a range of directions, mostly toward the S and E (figure 5). There were two drift direction observations that differed. An apparently minor deviation took place on 10 June, when the plume drifted NW and N of the volcano (arrow and parts of shaded areas, 10-11 June, figure 5). A report of a substantially different plume trajectory (19:05) came from an interpretation of a GOES satellite image taken at 1831 on 9 June, which suggested a comparatively straight, N-directed plume extending ~800 km over SE Borneo (figure 5).
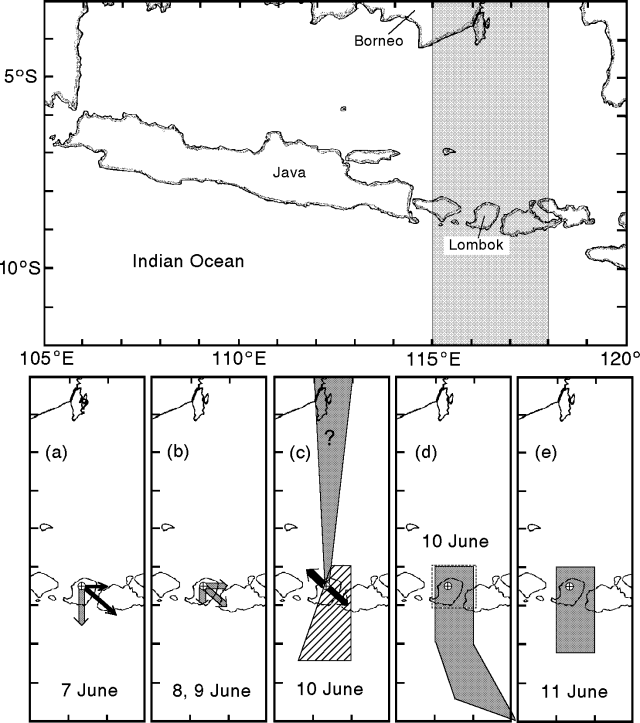 |
Figure 5. Composite of reported plume locations for 9-11 June 1994 (various shading and arrow patterns reflect different reports). The figure includes meteorological reports as well as data from 19:5 compiled by Nick Heffter. |
For comparison to other available observations Nick Heffter modelled the transport and dispersion of Rinjani's June ash plumes. He used software titled "Volcanic Ash Forecast, Transport, and Dispersion (VAFTAD)" to simulate plume trajectories (Heffter and Stunder, 1993; 1994).
VAFTAD was developed at the Air Resources Laboratory of NOAA for rapid response to an eruption even when some of the details such as the total mass injected into the atmosphere or the distribution of mass with respect to height in the eruption column are unknown. The cited paper gives references for several other different modeling schemes, some of which emphasize ash transport, ash concentrations and mass, and fallout along the centerline of the eruption. The VAFTAD model focuses on hazards to aircraft by forecasting the visual ash cloud location in time and space. Since VAFTAD is tailored towards the aviation community, one role of the output is to aid the forecaster in issuing significant meteorological (SIGMET) advisories. A second role . . . is the depiction of volcanic ash hazard to aircraft for several days after the eruption.
Although access is currently limited to qualifying agencies and universities, VAFTAD is user run, at any time, via dial-up modem to a workstation at the Air Resources Laboratory. On-screen prompts request the volcano's coordinates, eruption date and time, and the initial eruption cloud height. The computer automatically faxes output charts of the forecast visual cloud to pre-designated recipients via dial-up fax, and makes charts available for dissemination over various fax circuits (eg. DIFAX).
VAFTAD uses wind and pressure data updated two or more times a day and incorporates grid points with spacings of 91 km in the USA and 1 degree over the rest of the globe. The model assumes a mass load to the atmosphere of 1 gram composed of spherical particles with a specific gravity of 2.5 in a size range of 0.3-30 µm in diameter. VAFTAD computes transport and dispersion assuming particles are carried by advection both horizontally and vertically, and a slip correction allows particles to fall in a lateral direction.
Figure 6 shows a sample of some of the results of trials for the early June Rinjani eruption. Here the VAFTAD modeling software was applied in analysis mode (in other words, after the eruption, rather than in the forecast mode, before the eruption). The charts shown are enlarged and cropped from output similar to those automatically faxed from user-run forecasts. Figure 6 (top) presents some of the results for a modeled eruption starting at 0700 on 7 June (defined as t = 0 hours). Plume location estimates (solid boxes) are given for 6 and 12 hours after the eruption started.
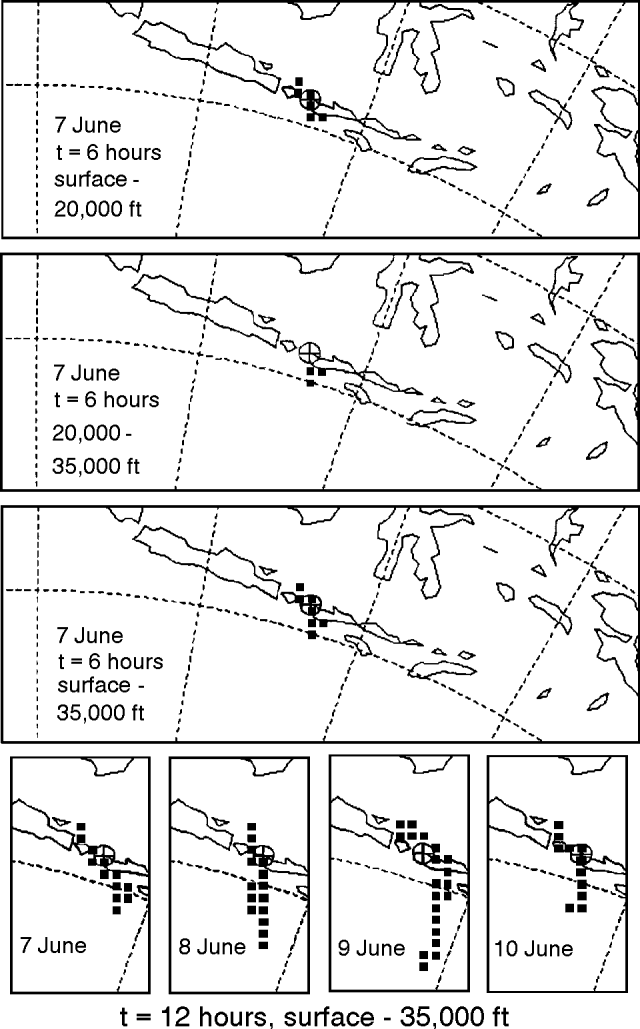 |
Figure 6. VAFTAD generated charts showing the simulated Rinjani eruption plume (dark squares). (top three boxes) Charts for a model eruption beginning at 0700 on 7 June (t = 0 hours) simulating the plume position six hours after the eruption started (t = 6 hours). Altitudes shown are from the Earth's surface to 20,000 feet (0-6,000 m), 20,000-35,000 feet (6,000-10,500 m), and a composite from the surface to 35,000 feet (0-10,500 m). (bottom four boxes) Four composite charts (0-6,000 m) for 12 hours after model eruptions, each beginning at 0700 on the days 7-10 June. Actual data on the eruption were limited but these simulations were made assuming eruptions of less than 3 hours duration rising to 35,000 feet (10,500 m). Courtesy of Nick Heffter. |
In harmony with the bulk of the observations summarized on figure 5, the simulations on 7-10 June (figure 6, bottom) show the majority of the plume traveling towards the S and E, with some significant dispersal towards the NW as well. In contrast, VAFTAD simulations for this time period failed to substantiate the extensive N-drifting plume. Perhaps the apparent northward plume trajectory on the GOES image was caused by similar-looking weather clouds.
Almost a month after the initiation of the eruption observers continued to see plumes extending from the volcano (table 1).
Table 1. Comments and coordinates describing the Rinjani ash plume taken from volcanic advice to aviators issued from Darwin, Australia, 4-8 July 1994. Note that in addition to the coordinates given, one end of the plume also remained attached to Rinjani.
| Date | Time | Comment or shape and coordinates of plume boundaries |
| 04 Jul 1994 | 1847 | Polygonal area: (a) 8.9°S, 115.5°E; (b) 8.5°S,113.0°E; and (c) 7.98°S, 113.0°E. |
| 05 Jul 1994 | 0600 | Triangular area: (a) 8.0°S, 115.0°E; and (b)7.5°S, 115.5°E. |
| 05 Jul 1994 | 1630 | Streaming toward the NW (reaching as far as6.5°S, 113.3°E). |
| 05 Jul 1994 | 1825 | Polygonal area : (a) 8.0°S, 115.4°E; (b) 7.7°S,115.1°E; and (c) 6.9°S, 115.4°E. |
| 07 Jul 1994 | 2200 | "No significant plume or evidence of ash cloud[located] directly overhead [at] Rinjani volcano. No ground-based reports or recent AIREPS [spoken weather reports by airborne weather crew] available." |
| 08 Jul 1994 | 0625 | Enhanced imagery showed: "no significant plume or evidence of ash other than directly overhead. No ground-based reports or recent AIREPS available. In light of the above no further advices will be issued until further activity is observed or new information suggests that Rinjani has again become active." |
| 08 Jul 1994 | 1517 | Meteorologists at Darwin received an AIREP indicating "smoke near the volcano." |
| 08 Jul 1994 | 1900 | Enhanced imagery showed no significant plume or ash cloud. |
References: Heffter, J.L., and Stunder, B.J.B., 1993, Volcanic Ash Forecast Transport and Dispersion (VAFTAD) model: Weather and Forecasting, v. 8, no. 4, p. 533-541.
Heffter, J.L., and Stunder, B.J.B., 1994, Brief description of the Volcanic Ash Forecast Transport and Dispersion (VAFTAD) model: unpublished manuscript (updated version, July 1994).
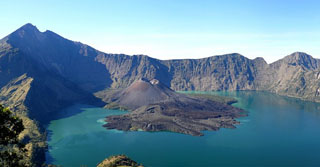
Geological Summary. Rinjani volcano on the island of Lombok rises to 3726 m, second in height among Indonesian volcanoes only to Sumatra's Kerinci volcano. Rinjani has a steep-sided conical profile when viewed from the east, but the west side of the compound volcano is truncated by the 6 x 8.5 km, oval-shaped Segara Anak (Samalas) caldera. The caldera formed during one of the largest Holocene eruptions globally in 1257 CE, which truncated Samalas stratovolcano. The western half of the caldera contains a 230-m-deep lake whose crescentic form results from growth of the post-caldera cone Barujari at the east end of the caldera. Historical eruptions dating back to 1847 have been restricted to Barujari cone and consist of moderate explosive activity and occasional lava flows that have entered Segara Anak lake.
Information Contacts: J. Heffter, NOAA Air Resources Laboratory; BOM Darwin, Australia.