Report on North Gorda Ridge Segment (United States) — June 1996
Bulletin of the Global Volcanism Network, vol. 21, no. 6 (June 1996)
Managing Editor: Richard Wunderman.
North Gorda Ridge Segment (United States) Submarine plumes and a brief fissure eruption
Please cite this report as:
Global Volcanism Program, 1996. Report on North Gorda Ridge Segment (United States) (Wunderman, R., ed.). Bulletin of the Global Volcanism Network, 21:6. Smithsonian Institution. https://doi.org/10.5479/si.GVP.BGVN199606-331031
North Gorda Ridge Segment
United States
42.67°N, 126.78°W; summit elev. -3000 m
All times are local (unless otherwise noted)
The following report describes preliminary results of investigations on the eruptive activity that began on 28 February along the Gorda Ridge (BGVN 21:02). On 10-11 March 1996 NOAA's RV MacArthur carried out a series of conductivity-temperature-depth (CTD) casts to study the plume(s) activity.
Figure 2 shows a N-S cross section of the temperature anomaly through the event plume(s) discovered above the ridge. The temperature anomaly was defined as the increase of the water temperature above that expected for a given density horizon. The contours are based on five vertical casts evenly spaced between 42°36' and 42°43'N. A similar pattern was observed on an E-W transect. Since previous event plumes were characterized by symmetry about a central core, the structure in this anomaly suggested an agglomeration of two or more separate plumes. The events that caused the plumes could have been separated in space and time or both.
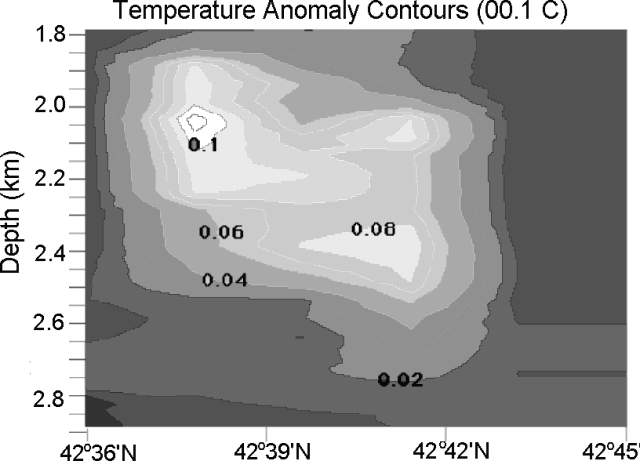 |
Figure 2. N-S cross section of the temperature anomaly through the Gorda Ridge event plume(s), 18 March 1996. Courtesy of E. Baker, NOAA/PMEL. |
Water samples taken from station 7 (42°37.9'N, 126°47.8'W) in mid-March showed a very high enrichment in Helium-3 (figure 3). The presence of this isotope, enriched in fresh oceanic volcanic rocks and in submarine hydrothermal fluids, suggested a hydrothermal input into the ocean. Station 7 was also characterized by an increase in temperature and in suspended particles (nephels).
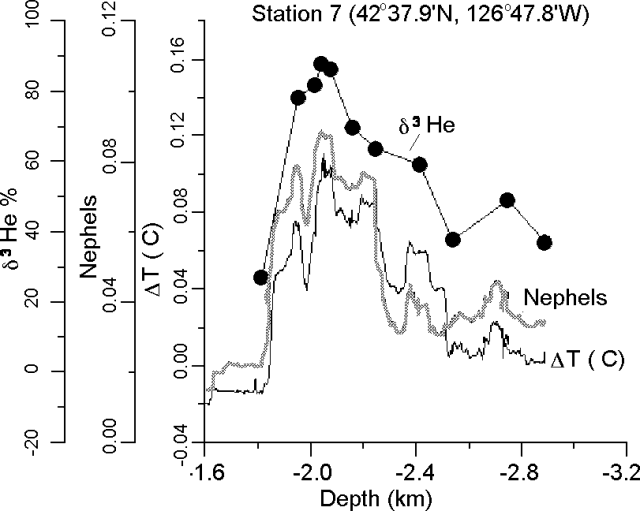 |
Figure 3. Concentration of Helium-3 for station 7 along the Gorda Ridge. Courtesy of J. Lupton, R. Greene, L. Evans, and R. Kovar NOAA/PMEL. |
The plot of Helium-3 concentration versus temperature anomaly at stations 7 and 13 (42°45.7'N, 126°44.8'W) suggested that each had sampled water columns with different plume characteristics (figure 4). The Helium-3/heat trend for station 7 (the event plume) had a flat slope of 0.34 x 10⁻¹² cm3/cal, similar to other event plumes detected in 1986 and 1993 over the Juan de Fuca Ridge. In contrast, the plume detected at station 13 had a much higher helium-3/heat trend of 2.27 x 10⁻¹² cm3/cal.
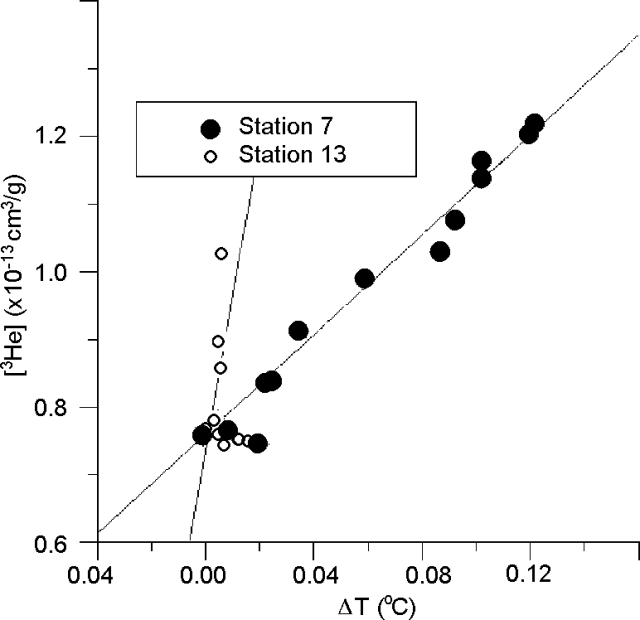 |
Figure 4. Plot of Helium-3 concentration vs. temperature difference for stations 5 and 7 along the Gorda Ridge. The y-axis shows 3He concentrations in units of cubic centimeters of gas at standard temperature and pressure per gram of seawater. Courtesy of J. Lupton, R. Greene, L. Evans, and R. Kovar NOAA/PMEL. |
SEM analysis of the first sample from the megaplume site at GR-14 revealed the presence of Fe-oxides, Zn-sulfides, and bacterial aggregates. The Fe-oxides were found with and without phosphorus. It was suggested that Fe-oxides formed beneath the seafloor lacked phosphorus, whereas Fe-oxides formed within the megaplume were enriched in phosphorus. The Zn-sulfides were very pure (i.e., no Fe). This sample appeared similar to the plume samples collected over the flow site in 1993. Preliminary results from the dissolved concentrations of Mn and Fe suggested that the event plume had formed recently.
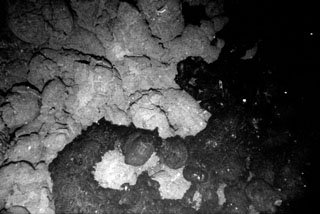
In April the RV Wecoma surveyed a new lava flow with five camera tows. Figure 5 is a digital camera image that shows the contact between the new lava flow at the ridge and the surrounding older lava. The eruption site was at least 3.5 km long and only ~100-200 m wide, based mainly on the distribution of near-bottom temperature anomalies above the cooling flow. With this shape, the flow was clearly the product of a brief fissure eruption, where a dike reached the surface. The lava flow was located directly under the event plume mapped by CTD casts during the RV MacArthur cruise. Figure 6 shows the new lava flow, the camera tows, the CTD casts, the event plume(s), and the epicenters detected in the area since 28 February (BGVN 21:02).
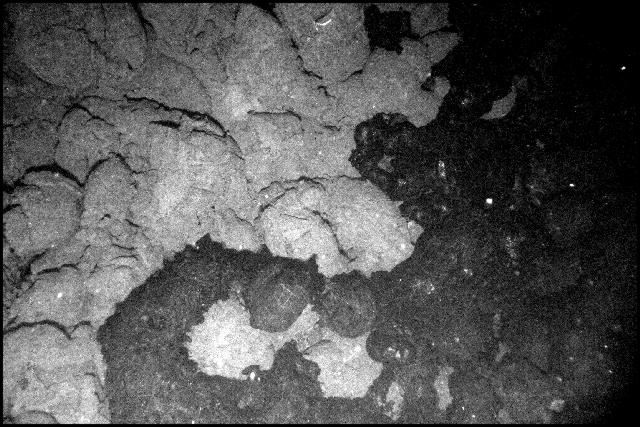 |
Figure 5. Contact between the new lava flow and the surrounding older lava. The image was taken by a Benthos digital camera developed for Woods Hole Oceanographic Institution (Dan Fornari, P.I.) (scale of image was undisclosed). |
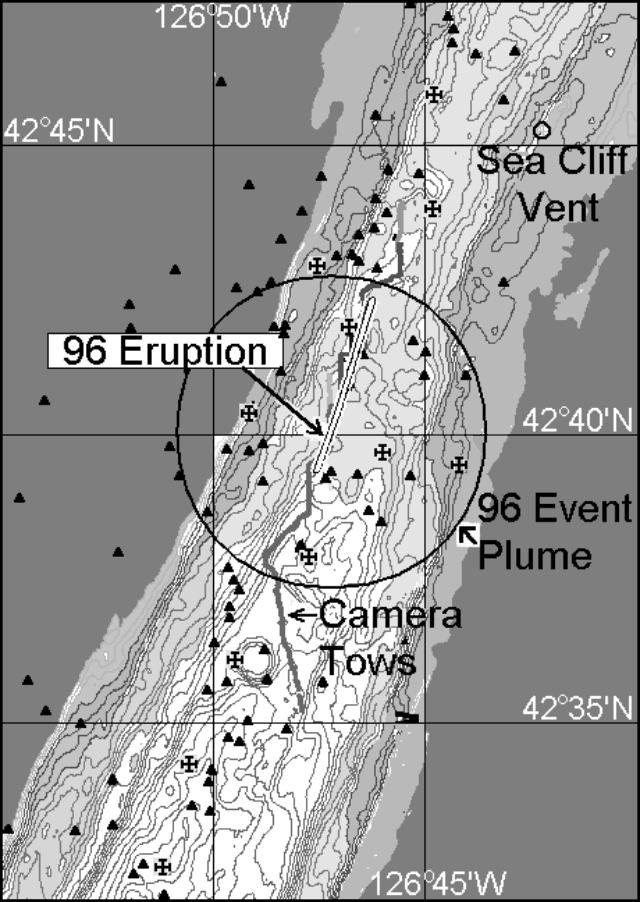 |
Figure 6. Map showing an overview of the investigated area with the general location of the event plume. Courtesy of B. Embley and B. Chadwick. The T-wave epicenters appear as triangles; the RV McArthur CTD casts are shown as crosses. |
Geological Summary. The northernmost of five segments of the Gorda Ridge lies immediately south of the Blanco Transform Fault that offsets the Gorda and Juan de Fuca oceanic spreading ridges. The 65-km-long segment is located about 200 km W of the southern Oregon coast and has deep 5- 10-km-wide valleys at either ends with a shallower narrow axial valley at the center. This morphology, which in plan view resembles an hourglass, is typical of magmatically active spreading segments. A submarine lava flow was erupted in late February and early March 1996, near the center of the segment. The eruption was initially detected through acoustic T-waves from a seismic swarm and the emission of large thermal plumes. In April submarine cameras revealed new lava flows about 100-200 m wide along a fissure that was at least 3.5 km long. A seismic swarm of uncertain origin also occurred at this location in January 1998.
Information Contacts: Chris Fox, Bob Dziak, Bob Embley, Bill Chadwick, Ed Baker, John Lupton, Dick Feely, and Gary Massoth, NOAA Pacific Marine Environmental Laboratory, 2115 SE Osu Drive, Newport, OR 97365 USA (URL: https://www.pmel.noaa.gov/eoi/).