Report on Soufriere Hills (United Kingdom) — January 1997
Bulletin of the Global Volcanism Network, vol. 22, no. 1 (January 1997)
Managing Editor: Richard Wunderman.
Soufriere Hills (United Kingdom) Ongoing dome growth, pyroclastic flows, and crack dilation
Please cite this report as:
Global Volcanism Program, 1997. Report on Soufriere Hills (United Kingdom) (Wunderman, R., ed.). Bulletin of the Global Volcanism Network, 22:1. Smithsonian Institution. https://doi.org/10.5479/si.GVP.BGVN199701-360050
Soufriere Hills
United Kingdom
16.72°N, 62.18°W; summit elev. 915 m
All times are local (unless otherwise noted)
The following condenses the daily Scientific Reports of the Montserrat Volcano Observatory (MVO) for the period 12 January-8 February 1997. This interval was marked by noteworthy pyroclastic flows and visible dome destruction and growth. Galway's Wall, on the volcano SW side, underwent sufficient erosion to allow escape of some dome talus. A photo (figure 16) taken on 28 January, and associated sketch (figure 17), shows the dome within the breached English's Crater.
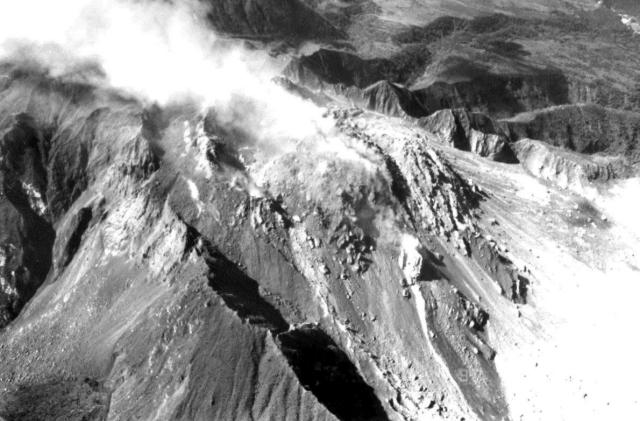 |
Figure 16. View of the Soufriere Hills crater taken from the SE on 28 January. The steaming area coincides with the new dome growth in the scar left by the 20 January collapse and pyroclastic flows. The new extrusion was first seen on 22 January, and by the 28th had almost filled the scar. Pyroclastic flows went down to the E (right). To the left of the new extrusion, the light-colored rock is the outside of Galway's Wall, the S part of the crater rim. Courtesy of MVO. |
 |
Figure 17. Sketch map of the Soufriere Hills crater based on a photograph taken from the SE on 28 January. Courtesy of MVO. |
Visual observations. On 13 January (between 1130-1300 and 2215-2305) two very large pyroclastic flows originated from the SE part of the 1 October dome at a spot close to the 11 December dome. The pyroclastic flows traveled down the S side of the Tar River valley to the sea. These flows eroded a chute to the S of Castle Peak, and created a scar in the 1 October dome. This scar became the site of rapid dome growth from the next day (14 January), when incandescence, small rockfalls and steaming and ash venting from the dome were reported. A helicopter flight on 14 January disclosed new talus deposits along the E and W margins of Galway's Wall.
On the morning of 16 January (between 0530 and 0630) the largest single pyroclastic flow in this eruption occurred. Reports from the airport described a rumbling of rocks and ash accompanying a glowing cloud down to the sea. The entire fan was covered by new material that included blocks 1-2 m in diameter (up to 5 m diameter at the head of the fan). The deposit was quite narrow in the upper reaches of the Tar River valley. The S chute cut back deeply into the dome to the S of Castle Peak, creating a large amphitheater into the mass of the 1 October dome ("Santa lobe") and the 11 December dome. Smaller pyroclastic flows occurred later that day; finally a prominent scar estimated to be ~8 m deep and running NE-SW was noted across the dome. The ash cloud from this activity rose to 6.1 km. The low-level ash was carried SW, causing heavy ashfall in Plymouth. At higher levels, the winds blew the ash S and E, and light ashfall was reported from Guadeloupe, 120 km SE.
On 19 and 20 January observers at Whites saw new extrusions growing rapidly within the scars formed by collapses of the SE flank of the composite October-December dome.
Pyroclastic flows began at 1830 on 20 January and lasted for about one hour. They originated from the SE part of the October-December composite dome, traveled down the S Tar River, and ignited some trees on the lower slopes of Perches Mountain before reaching the sea. A scoop-shaped excavation was carved into the SE flank of the composite dome, in the same place as the 16 January excavation, but larger in size.
The ash cloud from the 20 January pyroclastic flow rose to ~10 km. Low-altitude winds blew ash SW. Higher altitude winds blew ash NE, where it mixed with rain and fell as wet ash over most of N Montserrat. It was suggested that the higher amount of ash production on 20 January, compared with 16 January, was due to the higher lava temperature.
On 22 January, about 40 hours after the activity began, observers noted new growth and a large flower-shaped extrusion within the scar. During the first week of growth, this extrusion was contained within the scar, and only a few rockfalls entered the Tar River valley.
The largest rockfall on 26 January reached only to the foot of the dome. On 28 and 29 January, rockfalls were more common to both the N and S of Castle Peak, and occasional small pyroclastic flows were observed. The dome's vertical growth slowed, as it expanded laterally to the E and NW.
Evidence of further landslides from the Galway's Wall, on the S part of the crater rim, was seen on 26, 27, and 28 January. By 29 January, the central part of the wall's top was flush with the talus of the pre-September dome, and a small amount of dome material had fallen over the wall, leaving a minor scoop in the dome.
From late January through 8 February frequent small pyroclastic flows occurred, often during episodes of tremor. On 1 February a pyroclastic flow caused an ash cloud that drifted NW, depositing ash in Corkhill, Salem, and Old Towne. On 2 February, small pyroclastic flows accompanied by fountains of ash were reported from the area above Castle Peak. On 1 and 2 February heavy rain caused destructive flash flooding in Fort Ghaut. Much of the vegetation on the W slopes of the volcano was destroyed by months of heavy ashfall and acidic rain.
By 3 February, the remains of Castle Peak had either been completely buried or removed by pyroclastic flow activity. On 6 February a pyroclastic flow reached the sea; two flows on 7 February reached about half-way across the delta. The second flow was observed from the air and from Whites. During that event a collapse at the dome's SE face caused four pulses of small-scale decompression, resulting in ash jetting and release of small projectiles.
The most significant development at Galway's Wall during this period occurred sometime around 1-2 February, perhaps associated with heavy rains. A notch was cut through the upper wall at the western end, along one of the near-vertical zones of weakness in the wall. Dome material funneled through the wall, and fell on top of the landslide deposits in the upper Galway's area. The notch was first seen on 4 February, and the volume of material involved did not seem to increase significantly during the rest of the week.
Dome volume measurements. Volume measurements were made of the 20 January dome on 26 and 28 January, giving volumes of 1.46 and 1.52 x 10⁶ m3, respectively. It was also estimated that an accumulation of 150,000 m3 of talus blocks developed at the base of the new extrusion. A survey on 6 February indicated that around 2.3 x 10⁶ m3 of material were produced in nine days, giving an extrusion rate between the 28 January and 6 February of 2.9 m3/s. The average extrusion rate for the 20 January dome up to 6 February was 2.7 m3/s.
Helicopter surveys of the Tar River delta on 5 and 7 February showed that the total volume of the deposits was 14.9 x 10⁶ m3, of which 7.4 x 10⁶ m3 lay above sea level. The previous measurement on 27 September 1996 gave a volume of 11.6 x 10⁶ m3 with a sub-aerial volume of 4.9 x 10⁶ m3. The delta was also measured 600 m offshore, where it was 1.3 km across at its widest point. Even though the delta had not extended significantly since late September, it widened by 150 m and gained 10 m in height at the central point.
Seismicity. Rockfalls, pyroclastic flow signals, and volcano-tectonic events dominated the seismicity during this observation period. Swarms of volcano-tectonic earthquakes were as usual located at shallow depths beneath the crater. All of the major pyroclastic flows were preceded by earthquake swarms, suggesting that the earthquakes may be caused by pulses of magma moving to the surface, with these pulses then causing dome collapses a short time later. Out of nine earthquake swarms, three were followed by pyroclastic flows in the subsequent 27 to 66 minutes. Low-amplitude banded tremor was also observed during this reporting period. The typical tremor duration was about two hours, and the tremor episodes were ~8 hours apart. The amplitude of the tremor increased slightly during 15 January, prior to the collapse early on 16 January. Another tremor episode started before midnight on 16 January, and continued at regular intervals until the end of the period.
In general, after 21 January, volcano-tectonic swarms became fairly regular, occurring twice per day at ~12-hour intervals. This pattern was similar to that observed in the two weeks prior to the explosion of 17 September 1996, when the time interval between the swarms gradually decreased to 4 hours immediately prior to the explosion. At the end, almost all the swarms were accompanied by 2-5 long-period earthquakes (dominant frequencies, ~1 Hz or lower). Again, during 26 January-1 February the volcano-tectonic swarms were regularly spaced, with ~12 hours between each swarm, apart from a gap on 28 January. The duration of the swarms was variable, but generally 1-2 hours. The swarms started at or just after the peak in the theoretical solid-earth tide.
From 2 February, there was an increase in amplitude and duration of tremor episodes that lasted for 40-140 minutes; a gradual increase in amplitude was followed by an abrupt decay. At first the tremor built up gradually from background noise levels, but in the latter part of the observation period the tremor started as individual hybrid earthquakes that grew in number until they formed a continuous signal. During about half of these episodes, pyroclastic flows occurred at or shortly after the peak in tremor.
The time between the earthquake swarms gradually increased between 2 and 7 February. Maximum tremor amplitude also increased, with the highest amplitude recorded on 6 February. Thereafter the maximum tremor amplitude decayed, and no tremor was detected following a swarm on 8 February. Tremor was generally non-harmonic, with frequency in the 1-2.5 Hz range. However, harmonic tremor was recorded during a short interval close to the peak intensity of a tremor episode on 6 February, and may have been present for short periods during other episodes. The dominant frequency of this tremor was 1.25 Hz.
COSPEC and other measurements. On 16 January correlation spectrometer measurements from a boat along lines off the SW coast yielded average SO2 values of 344 metric tons/day (t/d) at 5.5 km from the dome and 233 t/d at 8.5 km. Measurements were made on the same day along the SW road within a few hours of dome collapse, but due to the wind direction, it was only possible to measure for half of the plume, which yielded a value of 1,017 t/d. On 21 January, 1,260 t/d were measured, a value typical of recent measurements immediately after dome collapses. Daily averages on 24, 29, and 31 January, and 4, 6, and 7 February were 590, 796, 495, 323, 446, and 652 t/d, respectively. During the 7 February traverse, the SO2 flux maxima (up to 871 t/d) was coincident with tremor and pyroclastic flow activity.
Scientists measured net movement along two prominent cracks on Chances Peak, located at the N intersection of Galway's Wall and Chances Peak. From 12 to 22 January, Crack 1, the most southerly of the two cracks, was oriented NE-SW and showed an extension of 0.69 cm/day and shear of 0.31 cm/day . From 22 to 26 January extension increased to 1.6 cm/day and shear to 0.7 cm/day. From 26 to 28 January extension increased to 1.75 cm/day and shear remained at 0.7 cm/day. Measurements at Crack 2 (22-26 January) showed a steady movement of 0.7 cm/day. Between 26 and 28 January shear increased slightly from 0.06 cm/day to 0.25 cm/day.
SO2 diffusion tubes downwind of the volcano showed a gradual decrease in this gas species throughout the period 1 October to 30 December, a drop similar to the one prior to the September 1996 explosion event. Dust samples collected in Plymouth in early October had high numbers of particles <0.7 µm in size.
Water samples showed high acidity levels (pH 2-3) in the Amersham area, as a result of acid rain forming in the plume; this effect decayed with distance. Rain water samples collected from various locations around the volcano showed that the rainwater directly W of the volcano continues to be highly acidic and has revealed concentrations of sulfites, chloride, and fluorides.
On 1 February, a Nettlton gravity profile across Whites Ghaut yielded a density of 2.1 g/cm3. On 30 January and 4 February, GPS networks showed that all slope lengths were within two standard deviations of the long-term means since June 1996.
Geological Summary. The complex, dominantly andesitic Soufrière Hills volcano occupies the southern half of the island of Montserrat. The summit area consists primarily of a series of lava domes emplaced along an ESE-trending zone. The volcano is flanked by Pleistocene complexes to the north and south. English's Crater, a 1-km-wide crater breached widely to the east by edifice collapse, was formed about 2000 years ago as a result of the youngest of several collapse events producing submarine debris-avalanche deposits. Block-and-ash flow and surge deposits associated with dome growth predominate in flank deposits, including those from an eruption that likely preceded the 1632 CE settlement of the island, allowing cultivation on recently devegetated land to near the summit. Non-eruptive seismic swarms occurred at 30-year intervals in the 20th century, but no historical eruptions were recorded until 1995. Long-term small-to-moderate ash eruptions beginning in that year were later accompanied by lava-dome growth and pyroclastic flows that forced evacuation of the southern half of the island and ultimately destroyed the capital city of Plymouth, causing major social and economic disruption.
Information Contacts: Montserrat Volcano Observatory (MVO), c/o Chief Minister's Office, PO Box 292, Plymouth, Montserrat (URL: http://www.mvo.ms/).