Report on Soufriere Hills (United Kingdom) — May 1997
Bulletin of the Global Volcanism Network, vol. 22, no. 5 (May 1997)
Managing Editor: Richard Wunderman.
Soufriere Hills (United Kingdom) Pyroclastic flows no longer confined by the crater's N wall
Please cite this report as:
Global Volcanism Program, 1997. Report on Soufriere Hills (United Kingdom) (Wunderman, R., ed.). Bulletin of the Global Volcanism Network, 22:5. Smithsonian Institution. https://doi.org/10.5479/si.GVP.BGVN199705-360050
Soufriere Hills
United Kingdom
16.72°N, 62.18°W; summit elev. 915 m
All times are local (unless otherwise noted)
On 25 June, unusually large pyroclastic flows swept down drainages on the volcano's NNE side reaching almost as far as the airport. Settlements along their path sustained serious damage. Amid rescue efforts on 27 June, MVO reported at least nine people dead, six injured, and 14 missing. Additional information will be provided in next month's Bulletin.
The following summarizes weekly Scientific Reports of the Montserrat Volcano Observatory for the period 11 May-7 June 1997 and NOAA/NESDIS satellite observations during 12 May-6 June. Many of the places mentioned in this report appear on available maps (e.g. BGVN 22:02; Williams, 1997).
A new risk map was released on 6 June (figure 22). Zone A was expanded from the crater to the N as far as Harris, Bramble, and Bethel villages. Areas designated as Zone B included Tuitt's and Spanish Point on the E and Streatham and Farrell's on the W. Bramble Airport, ~5 km NE of the volcano, was moved into zone C.
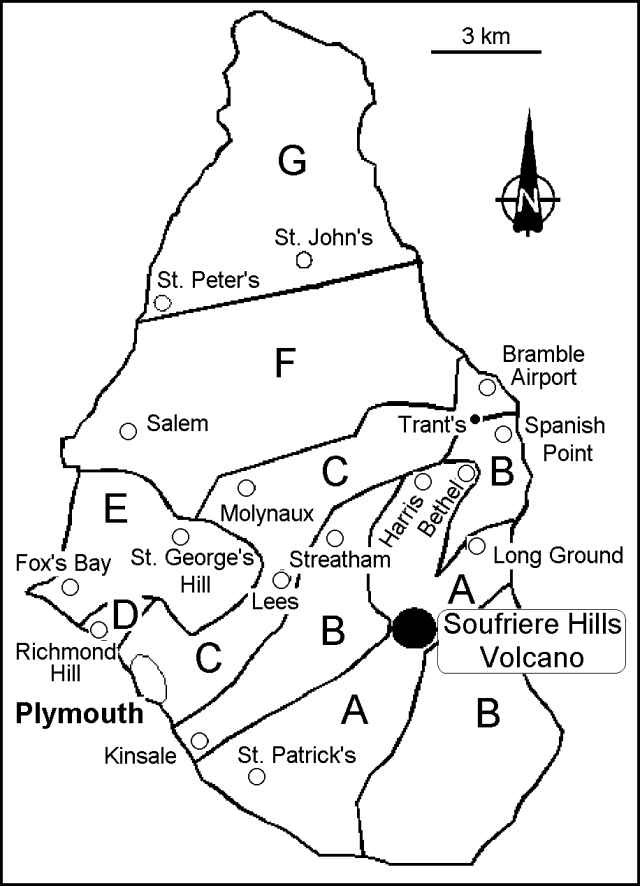 |
Figure 22. Map showing the volcanic risk zones for Soufriere Hills Volcano, updated on 6 June 1997. |
At the beginning of this reporting period, dome growth (estimated at 2 m3/s) was concentrated on the crater's S side, above the Galway's area. Rockfalls and a few small pyroclastic flows were shed into both the White River and down the S side of the Tar River valley. After 12 May loud roaring sounds caused by vigorous venting of ash and gas from the dome were heard at Whites, Harris, and Farrell's. These were taken to indicate increased gas pressures within the dome. Furthermore, on 12 May an airplane pilot reported ash between 1,830 and 2,440 m altitude.
On 13 May at 0755 a moderate-size pyroclastic flow from the summit region eroded a narrow channel on the E flank of the dome, a spot underlain by the ancestral Castle Peak. The flow went down the Tar River valley, splitting into two branches that traveled down either side of the upper break in slope, and eventually reached the delta at the coast. The ash cloud from this flow reached 3.3 km altitude and later formed a plume conspicuous in visible satellite imagery for 220 km WNW of the summit.
On 14 and 15 May, small, nearly continuous rockfalls and some small pyroclastic flows occurred on the NE and SE flanks of the dome; these traveled either towards the E (Tar River valley) or S (down Galway's side). Beginning at about 2040 on 15 May a 70-minute-long outburst generated moderate-size pyroclastic flows down the E side, creating a small scar ~40 m N of the one formed on 13 May.
Events on 16 May included small-to-moderate pyroclastic flows from the dome's summit. These traveled down the dome's N and NW sides, towards Farrell's wall, which deflected them E toward the Tar River valley. In addition erosion occurred on the dome's N face: talus continued piling up against the N and NNE crater rim.
During the following days activity was concentrated on the N and E flanks of the dome, with three major rockfall chutes developed on the dome's E, NE, and N sides. At the base of one of these chutes rockfall material piled up against the crater's N wall (Farrell's). Several small rockfalls were also heard on the crater's S side (Galway's wall), where new, relatively fine-grained rockfall deposits had blanketed the entire talus slopes.
On 18 May at 0820 the largest pyroclastic flow of this reporting period occurred. First, a large long-period earthquake took place; observers at Whites reported that the entire dome was being shaken just before the flow started. This pyroclastic flow traveled from the summit down both the 15 May chute and the NE chute. Then it passed down the N side of the Tar River valley to stop a few hundred meters from the delta. During that night intense glows were observed over the dome's entire NW face. There were also some incandescent rockfalls and small pyroclastic flows.
Clear visibility on 19 May revealed a new dark extrusion at the top of the NW dome. This area discharged ash and steam and ejected 5- to 20-cm diameter fragments up to ~60 m above the dome. The source of continuous rockfalls with small pyroclastic flows extended from the 15 May chute on the E to the margin of the September 1996 scar on the NW. The remnant wall of the scar prevented material from reaching the rim of Gages wall. The N side of the crater had filled up, with small amounts of dome material falling into the top of Tuitt's Ghaut, the N- flank drainage.
On 21 and 22 May a few small spines toppled, sending rockfalls down the E, NE, and NW flanks. On 22 May at 1300, after a rockfall on the N flank, some blocks reached ~100 m down the N flank (Tuitt's Ghaut). At 1430 a pyroclastic flow on the same flank produced an almost continuous ash plume; lapilli up to 4 mm in diameter were collected at Dyers and ash fragments ~1 mm in size were reported at Farrell's and from Salem up to St. John's.
Observations on 23 May from Chances Peak revealed several small spines and large blocks in the summit area with vigorous venting and gas emissions in the growth area; there was also a cleft in the middle separating the S lobe from the new extrusion in the N.
On 27 May, a large pyroclastic flow generated high on the E side of the dome traveled down the Tar River valley at a speed of 230 km/h , the fastest flow yet documented during the eruption. In the lower part of the valley the flow slowed considerably, and it stopped ~150 m from the sea. That same day, for the first time, moderate-size pyroclastic flows reached Tuitt's Ghaut; later on 29 May discernible material was deposited 400 m down this drainage.
By 31 May, talus slopes over the dome's E and NE flanks had covered the chutes formed by mid-May pyroclastic flows. The upper part of the dome's E face looked more blocky and relatively inactive. When visibility was good, the presence of ash below ~1,600 m was reported almost daily in satellite imagery.
Small pyroclastic flows down Tuitt's Ghaut on 2 June left fresh deposits ~1 km from the crater rim. By 3 June they reached 1.4 km, and by 4 June, 1.8 km. At 1207 on 5 June a pyroclastic flow extended ~2.9 km from the crater rim; a shorter flow followed to ~2 km. All of these pyroclastic flows were confined to the narrow valley and comparatively slow moving, taking about three minutes to descend it. In the first 500 m of the upland portion of the valley all vegetation was stripped from the valley walls. Farther down, some trees were left standing within the deposits. In the upper 1 km of the deposits there was evidence of several small, lobate flows. In general the thermal effects remained confined to 10 m from the deposit's edge, but on bends it rode up the banks of the ghaut (the so- called "bobsled" effect). The front of the flow was marked by a pile of burned logs and coarse debris, and a finer-grained surge had traveled ~100-200 m farther down the ghaut. A pyroclastic flow at 1845 on 6 June traveled ~2 km down from the crater rim; its front carried particularly large boulders. The flow significantly widened the notch in the crater wall through which it traveled; by this time the domes talus created a smooth slope down the ghaut.
NOAA reported ash clouds on 3, 4, and 5 June in visible satellite imagery up to 2,150 m altitude and crossing over the Virgin Islands, 400 km NW.
Seismicity. The shifting focus of dome growth and rising vigor of emission were reflected in a general decline in the number of long-period earthquakes and an increase in the number of hybrid earthquake swarms. Each swarm lasted for a few hours; some intense swarms during 19-21 May reached up to 35 events/hour. Rockfalls remained common and were concentrated during periods of minor dome collapse. The ratio of maximum rockfall amplitudes measured at Galway's Estate Station and Long Ground station served to differentiate between Tar River and White River pyroclastic flows.
Toward the end of May there was a significant reduction in the number of hybrid and long-period earthquakes, and rockfalls. The hybrid earthquake swarms continued until 27 May; although less frequent, they lasted longer.
The number of long-period earthquakes dropped to the normal background (0-4 events/day), the lowest levels since mid-March. The number of rockfalls increased from 1 June, and for the rest of the period were concentrated on the N and E sides of the dome. Periods of enhanced rockfall and pyroclastic-flow activity occurred every 16-20 hours and lasted ~4 hours. In the lulls, rockfalls continued at greatly reduced levels.
After 4 June the number of both long-period and hybrid earthquakes increased again. Over 50% of these shocks triggered rockfalls.
Ground deformation. GPS measurements at station FT3 (Farrell's wall) on 12 May showed continued movement to the NW, consistent with the total 20 cm of displacement noted since January 1997. Data were somewhat equivocal on 17 and 21 May. A GPS occupation at Chances Peak on 23 May suggested that it had moved 3.5 cm WNW since 28 April. Prior to that date, the movement was toward the NW. The change in direction was thought to reflect the dome's northward shift in activity.
Telemetered electronic tiltmeters installed at Chances Peak on 18 and 21 May (stations CP2 and CP3, W and E of the summit, respectively) registered cycles of inflation and deflation, each lasting ~12-18 hours. Progressive intervals and magnitudes of inflation were greater than those of deflation. Inflation occurred with hybrid earthquake swarms, and deflation correlated with peak rockfall/pyroclastic-flow events. RSAM patterns showed a strong correlation with tilt, with the higher spikes reflecting rockfalls, and the lower intensity patterns reflecting the sum of hybrid events and lesser rockfall activity. Thus tilt and RSAM combined provided a predictive capability. Accordingly, when it was possible, missions to close-in areas were scheduled during early inflation, when the likelihood of pyroclastic flows was considered minimal.
Crack 2, which developed into a zone of broad fracture on Chances Peak, was measured on 23 May, and on 4 and 8 June. The shear along the crack was dextral (E block moving S relative to W block) and reached 6 cm. The shear during 23 May-4 June was 2.5 cm. On 23 May a telemetered extensometer installed across part of Crack 2 that day showed almost 5 mm of diurnal change.
Dome volume, COSPEC, and other measurements. Using a combination of theodolite, GPS, and ranging binoculars, scientists on 19 May estimated the summit at 991 m elevation. One major change since the previous survey (15 April) was the inflation of the highest part of the dome above Galway's wall. Another change was the growth of the new extrusion in the N summit area and the talus accumulation in a 300-m-wide zone against the back of Farrell's wall, due to the activity on the N and NE faces. The volume of the dome from this survey was estimated at 60.1 x 10⁶ m3; this established an average extrusion rate during 15 April-19 May of 2.7 x 10⁵ m3/day (3.1 m3/s).
Later dome-volume surveys were severely hampered by poor visibility; however, brief clear windows allowed photos to be taken for both 31 May and 1 June, documenting continued growth of the dome's N side and summit. On the basis of these photos, the dome's volume was 64.6 x 10⁶ m3, a mean growth rate of 3.5 m3/s during 19 May-1 June. As with the last survey this represented a rate considerably above the mean extrusion rate of 2.1 m3/s.
Mini-COSPEC runs that were completed daily, often both in the morning and afternoon, gave results substantially higher than the usual background flux of 200-300 t/d. May and June SO2 fluxes were as follows: 24 May, 950 metric tons per day (t/d); 26 May, 940 t/d; 27 May, 971 t/d; 28 May, 616 t/d; 29 May, 770 t/d; 30 May, 510 t/d; 2 and 3 June, 475 t/d; 4 June, 2,129 t/d; 5 June, 2,242 t/d; 6 June, 642 t/d; and 7 June, 505 t/d. The high values on 4-5 June correlated with increased pyroclastic flow activity during 4-6 June. Sulfur diffusion tubes collected on 20 April and 4 May mainly showed values similar to those of previous weeks (table 19). The results from Upper Amersham on 17 May presumably increased because of the increase in the level of eruptive activity.
Table 19. SO2 concentrations in part per billion (ppb) from diffusion tubes at sites around the volcano. Recommended action level is 100 ppb. Courtesy of MVO.
| Location | 20 Apr 1997 | 04 May 1997 | 17 May 1997 |
| Plymouth Police HQ | 7.3 | 7.8 | 17.1 |
| Upper Amersham | 45.0 | 53.2 | 81.1 |
| Lower Amersham | 12.1 | 16.9 | 32.0 |
| Weekes | 0.0 | 0.0 | 4.3 |
| Whites landfill | 0.8 | 1.2 | 1.2 |
Rainwater collected W and NW of the volcano on 17 May was more acidic than samples from the previous week and chlorides and sulfates were present at substantially higher levels (table 20). After heavy rainfall and continued winds from the S and SE, a rainwater sample collected on 28 May from Lawyers, 2 km north of Salem, had a pH of 3.3. On those same days, new sites to the N of the volcano were also monitored and showed very low pH values. During this period the fluoride content of the rainwater was also elevated. The pH and fluoride returned to normal values when the wind direction changed to WNW at the end of May. Piped ground water had remained unaffected by the low pH of the rainwater.
Table 20. Rainwater geochemistry from 17 May to 1 June. For comparison, WHO guideline values are as follows: pH, 6.5- 8.5; TDS, 1.0 g/l; fluorides, 1.5 mg/l; chlorides, 250 mg/l; sulfates, 250 mg/l. Courtesy of MVO.
| Date | Location | pH | Conductivity (mS/cm) | Total Dissolved Solids (g/l) | Sulfates (mg/l) | Chlorides (mg/l) | Fluorides (mg/l) |
| 17 May 1997 | Weekes | 3.8 | 0.272 | 0.136 | 37 | 50 | 0.65 |
| 17 May 1997 | Plymouth Police HQ | 2.7 | 3.51 | 1.75 | 560 | 710 | -- |
| 17 May 1997 | Upper Amersham | 2.4 | 2.45 | 1.22 | 107 | 315 | -- |
| 17 May 1997 | Lower Amersham | 2.8 | 4.26 | 2.13 | 97 | 760 | -- |
| 25 May 1997 | Weekes | 2.6 | 1.286 | 0.644 | 5 | 133 | 1.50 |
| 25 May 1997 | Upper Amersham | 2.0 | 7.24 | 3.62 | 93 | 1000 | 0.20 |
| 25 May 1997 | Am. cattle trough | 7.72 | 0.335 | 0.168 | -- | 56 | 0.55 |
| 25 May 1997 | Trial's reservoir | 7.9 | 0.827 | 0.414 | 42 | 112 | 0.35 |
| 27 May 1997 | Hope | 2.8 | 0.789 | 0.37 | -- | 70 | 1.50 |
| 28 May 1997 | Weekes | 2.5 | 1.557 | 0.778 | -- | 126 | 1.50 |
| 28 May 1997 | Molyneux | 2.6 | 1.312 | 0.657 | 7 | 94 | 1.50 |
| 28 May 1997 | Dyer's | 2.8 | 0.702 | 0.351 | 3 | 80 | 1.40 |
| 28 May 1997 | Lawyer's | 3.0 | 0.46 | 0.23 | -- | 52 | 1.25 |
| 28 May 1997 | M.V.O. | 2.8 | 0.863 | 0.432 | -- | 80 | 1.50 |
| 31 Jun 1997 | Weekes | 3.4 | 0.257 | 0.128 | 3 | -- | 1.20 |
| 31 Jun 1997 | M.V.O. | 5.3 | 0.066 | 0.033 | -- | -- | 0.35 |
| 31 Jun 1997 | Dyer's | 6.7 | 0.092 | 0.046 | 3 | -- | 0.20 |
| 31 Jun 1997 | Upper Amersham | 2.8 | 0.914 | 0.458 | 12 | -- | 1.50 |
| 31 Jun 1997 | Lower Amersham | 3.1 | 0.533 | 0.267 | 18 | -- | 1.15 |
| 31 Jun 1997 | Am. cattle trough | 8.89 | 0.32 | 0.16 | -- | -- | 0.35 |
| 31 Jun 1997 | Trial's res. Overflow(from the tap) | 7.8 | 0.845 | 0.423 | 38 | -- | 0.30 |
Ash was collected on 17 May following several days of increased volcanic activity. The ash was at least 6 mm thick at Upper Amersham, and 4 mm at Lower Amersham, the Plymouth Police Headquarters, and Dagenham. Ash collected on 1 June was noticeably fine and widely distributed from Brodericks to Dyers with the thickest ash fall (2 mm) at Upper Amersham, Dagenham, and Plymouth Police HQ.
Reference. Williams, A.R., 1997, Montserrat, under the Volcano: National Geographic, v. 192, no. 1 (July 1997), p. 58-77.
Geological Summary. The complex, dominantly andesitic Soufrière Hills volcano occupies the southern half of the island of Montserrat. The summit area consists primarily of a series of lava domes emplaced along an ESE-trending zone. The volcano is flanked by Pleistocene complexes to the north and south. English's Crater, a 1-km-wide crater breached widely to the east by edifice collapse, was formed about 2000 years ago as a result of the youngest of several collapse events producing submarine debris-avalanche deposits. Block-and-ash flow and surge deposits associated with dome growth predominate in flank deposits, including those from an eruption that likely preceded the 1632 CE settlement of the island, allowing cultivation on recently devegetated land to near the summit. Non-eruptive seismic swarms occurred at 30-year intervals in the 20th century, but no historical eruptions were recorded until 1995. Long-term small-to-moderate ash eruptions beginning in that year were later accompanied by lava-dome growth and pyroclastic flows that forced evacuation of the southern half of the island and ultimately destroyed the capital city of Plymouth, causing major social and economic disruption.
Information Contacts: Montserrat Volcano Observatory (MVO), c/o Chief Minister's Office, PO Box 292, Plymouth, Montserrat (URL: http://www.mvo.ms/); NOAA/NESDIS Satellite Analysis Branch (SAB), Room 401, 5200 Auth Road, Camp Spring, MD 20746, USA.