Report on Long Valley (United States) — June 1999
Bulletin of the Global Volcanism Network, vol. 24, no. 6 (June 1999)
Managing Editor: Richard Wunderman.
Long Valley (United States) Continued dome inflation and persistent earthquake swarms through 1998
Please cite this report as:
Global Volcanism Program, 1999. Report on Long Valley (United States) (Wunderman, R., ed.). Bulletin of the Global Volcanism Network, 24:6. Smithsonian Institution. https://doi.org/10.5479/si.GVP.BGVN199906-323822
Long Valley
United States
37.7°N, 118.87°W; summit elev. 3390 m
All times are local (unless otherwise noted)
The following summarizes activity at Long Valley during the second half of 1997 and all of 1998 (Hill, 1998). A summary of activity during 1996 and the first half of 1997 can be found in BGVN 22:11 and 22:12.
Summary of activity during July-December, 1997.After nearly a year of relative seismic quiescence within the caldera, earthquake swarm activity returned in early July. The deeper focus (>10 km) , long-period (LP) earthquakes centered beneath the SW flank of Mammoth Mountain and the Devil's Postpile area, which had increased in early 1997, continued at an elevated rate through the end of the year. Altogether over 200 of these events were detected during 1997, all M <2.0 (figure 21). This exceeded the total number of deep LP events detected from their onset in 1989 through 1996. Earthquake activity in the shallow crust beneath Mammoth Mountain (depths <10 km) at the SW margin of the caldera remained low throughout 1997.
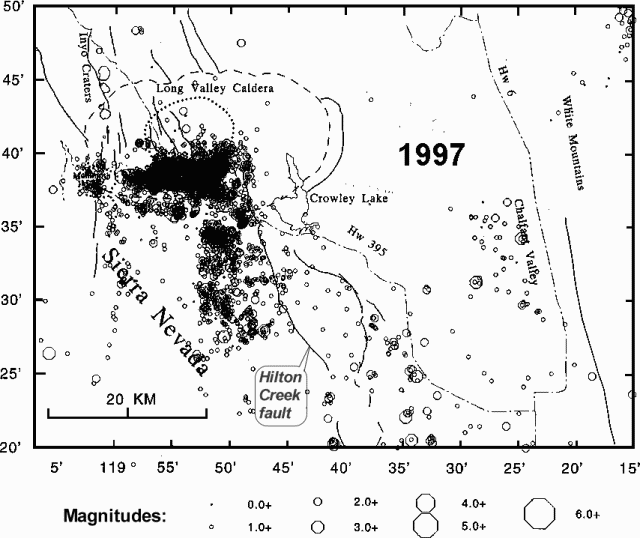 |
Figure 21. Earthquake epicenters in the Long Valley region during 1997. Courtesy of USGS. |
The gradual increase in the inflation rate of the resurgent dome begun in late May 1997 marked the onset of an episode of unrest in the caldera that intensified at an accelerating rate through the summer and fall, culminating in a series of strong earthquake swarms from mid-November through early January 1998. The extension rate of an 8-km baseline spanning the resurgent dome peaked at over 20 cm/year during the second week of November. Following a strong earthquake swarm on 22 November that included three M >4.5 earthquakes, the deformation pattern briefly changed to one dominated by right-oblique slip along the WNW-striking "S-moat fault zone." In early December and through the rest of 1997, the deformation resumed the earlier pattern of dome inflation with a relatively steady 12-15 cm/year extension rate. By the end of 1997, the 8-km baseline was 7 cm longer than in late May.
The earthquake activity associated with the swarms begun in early July developed over a broad 15-km zone spanning the S-moat and southern margin of the resurgent dome. Typically, several areas within this zone were active simultaneously. This swarm activity, which included more than 12,000 M >1.2 and 120 M >3.0 earthquakes over a 7-month period through mid-January 1998, had a cumulative seismic moment of 3.3 x 1024 dyne-cm, equivalent to a single earthquake of M 5.4. The peak in seismicity from mid-November through early January included eight M >4.0 earthquakes. Focal mechanism data for the larger earthquakes indicated a dominantly right-lateral slip along a WNW-trending fault zone within the S-moat, although broadband seismograms admit the possibility of a dilatational component (volume increase) in the source mechanism for some of the M >4 earthquakes. The great majority of earthquakes had the broadband character of brittle, double-couple events (tectonic or volcano-tectonic earthquakes). A few shallow (<3 km) events beneath the southern half of the resurgent dome had energy concentrated in the 1-3 Hz band typical of shallow LP earthquakes. Whether the unusual appearance of the seismograms can be attributed to the earthquake source or wave propagation effects remains to be determined.
Monitoring of the gases around Mammoth Mountain showed two noteworthy changes in 1997, both more likely related to the increased deep LP earthquake activity beneath the SW flank of the mountain than to the much stronger activity within the caldera. The helium isotope ratio, 3He/4He, in samples collected in May and October from the MMF fumarole on the NE flank of Mammoth Mountain showed an increase with respect to the gradually declining values measured in late 1995 through early 1997. Continuous CO2 monitors in tree-kill areas on opposite sides of Mammoth Mountain detected an abrupt increase in CO2 soil-gas concentrations beginning in late September and ending in early December before significant snow accumulations.
The episode of persistent unrest during the second half of 1997 is the third most energetic activity in the caldera since the intense earthquake swarms of May 1980 (which included four M 6 earthquakes) and January 1983 (which included two M 5.3 earthquakes). The strongest seismic activity in the 1980 and 1983 episodes occurred within the first few days of the swarm sequences. The 1997 activity level accelerated gradually over a 4-month period prior to the strongest seismicity, which then spread out over nearly an additional 3 months. This activity provided the first test of the color-code notification system for ranking activity levels within the caldera. "Condition Green" (no immediate risk) remained throughout the year but the activity peaks on 22 and 30 November came close to meeting the guidelines for "Condition Yellow" (watch).
Summary of activity during 1998. Three events dominated activity during 1998. First, a decline in the acceleration of the resurgent dome uplift and the persistent earthquake swarm activity in the S-moat, which began in June-July 1997 and peaked in November-December 1998. Second and third, M 5.1 earthquakes on 8 June and 14 July 1998, centered W of the Hilton Creek fault and 2-4 km S of the caldera, together with their aftershock sequences.
In the S-moat of the caldera, the final phase of the strong earthquake swarms that dominated activity through the second half of 1997 extended into January 1998. An earthquake (M 4.8) on 31 December marked a shift in the center of the most intense activity from beneath the western part to the eastern-central section. A strong swarm burst occurred during 1-5 January in which >2,000 earthquakes were detected and located, including more than a dozen with M >3. On 6 January, a M 4.1 earthquake was the last of nine earthquakes with magnitudes of 4.0-4.9 in the S-moat since 13 November 1997.
Activity in the S-moat area declined to background levels by midsummer, interrupted by occasional M >3 earthquakes and brief swarms, particularly in February and March. The latter period included several days with 80-180 small swarm events. A M 3.2 earthquake occurred on 13 February, and swarm events on 2, 6-7, and 15-16 March included earthquakes of M >2.5. The last six months of 1998 included five M >3.0 caldera earthquakes. The two largest, on 14 July and 7 December, had magnitudes of 3.7 (the 14 July event occurred 2 hours after the M 5.1 earthquake).
Geodimeter measurements confirmed that the inflation rate of the resurgent dome gradually slowed from a peak of 30 cm/year in November 1997 to ~15 cm/year in early 1998 and by mid-May had dropped to 1-2 cm/year, a rate that persisted through the end of 1998.
Long-period earthquake activity 10-25 km beneath Devil's Postpile and the SW flank of Mammoth Mountain continued through 1998 (figure 22). Some 140 of the LP events were detected in 1998, just over half the 1997 number (250 events). That rate is still higher than any time since the mid-1989 onset of LP activity; during 1989-96 a total of only 165 LP events were detected. In 1998, many of the LP earthquakes were preceded by several tens of seconds of a tremor-like signal with a dominant frequency around 1 Hz. This was a change from the character of the LP activity in earlier years, when the tremor-like signals were generally of shorter duration and the dominant frequency was 2-3 Hz.
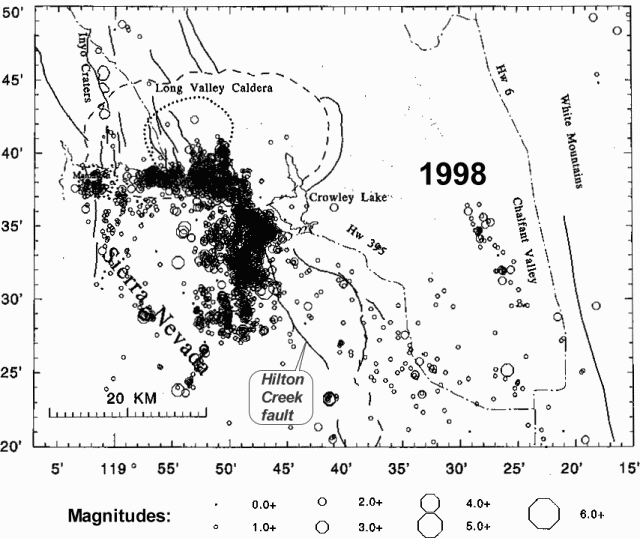 |
Figure 22. Earthquake epicenters in the Long Valley region during 1998. Courtesy of USGS. |
An event of M 1.8 at a depth of 12 km on 11 November was the largest LP event recorded since the initial activity in 1989; it was followed by a week of ~25 smaller events. Occasional LP earthquakes continued to occur through 1998 at depths between 15 and 30 km centered beneath an area roughly 7 km W of Mono Craters. One of the largest in this area, M ~2.4, occurred at a depth of 24 km on 26 September.
Over the summer months, field studies around the flanks of Mammoth Mountain suggested that the CO2 flux rate had been slowly decreasing over the past 3 years. Airborne measurements in September and November detected a CO2 plume downwind, consistent with the multiple sources around the flanks of the mountain.
The first of the two M 5.1 earthquakes occurred on 8 June just 1.5 km S of the caldera at a depth of 6.7 km. The second occurred on 14 July and was centered 3 km to the SSE at 6.2 km depth. Both earthquakes were located within the footwall of the E-dipping Hilton Creek fault; neither appeared to have involved slip on the fault itself. Both earthquakes were followed by rich aftershock sequences that tailed off though the end of the year and, together, included nine earthquakes with magnitudes between 4.0 and 4.5. The aftershock epicenters defined a nearly orthogonal pattern in map view. Those of the 8 June event were confined to a WNW lineation through the mainshock epicenter, whereas those of the 14 July event were confined to a more diffuse SSW lineation through the mainshock epicenter. Both lineations cut across the Hilton Creek fault and intersect just E of the 8 June epicenter.
Earthquake activity elsewhere in the region showed no significant variation from background activity over the past several years.
References. Hill, David P., 1997, Long Valley Caldera monitoring report (July-December 1997): U.S. Geological Survey, Volcano Hazards Program.
Hill, David P., 1998, Long Valley Caldera monitoring report (October- December 1998): U.S. Geological Survey, Volcano Hazards Program.
Geological Summary. The large 17 x 32 km Long Valley caldera east of the central Sierra Nevada Range formed as a result of the voluminous Bishop Tuff eruption about 760,000 years ago. Resurgent doming in the central part of the caldera occurred shortly afterwards, followed by rhyolitic eruptions from the caldera moat and the eruption of rhyodacite from outer ring fracture vents, ending about 50,000 years ago. During early resurgent doming the caldera was filled with a large lake that left strandlines on the caldera walls and the resurgent dome island; the lake eventually drained through the Owens River Gorge. The caldera remains thermally active, with many hot springs and fumaroles, and has had significant deformation, seismicity, and other unrest in recent years. The late-Pleistocene to Holocene Inyo Craters cut the NW topographic rim of the caldera, and along with Mammoth Mountain on the SW topographic rim, are west of the structural caldera and are chemically and tectonically distinct from the Long Valley magmatic system.
Information Contacts: David Hill, U.S. Geological Survey, MS 977, 345 Middlefield Rd., Menlo Park, CA 94025 USA (URL: https://volcanoes.usgs.gov/observatories/calvo/).