Report on Miyakejima (Japan) — September 2000
Bulletin of the Global Volcanism Network, vol. 25, no. 9 (September 2000)
Managing Editor: Richard Wunderman.
Miyakejima (Japan) Gravity and synthetic-aperature radar data; volcanism through October 2000
Please cite this report as:
Global Volcanism Program, 2000. Report on Miyakejima (Japan) (Wunderman, R., ed.). Bulletin of the Global Volcanism Network, 25:9. Smithsonian Institution. https://doi.org/10.5479/si.GVP.BGVN200009-284040
Miyakejima
Japan
34.094°N, 139.526°E; summit elev. 775 m
All times are local (unless otherwise noted)
Volcanism at Miyake-jima began on 27 June 2000 with a series of underwater eruptions (BGVN 25:05-25:07). The continuing activity since then has given scientists the opportunity to conduct multi-faceted visual, geochemical, geodetic, and geophysical observations. This report covers June-October, and within this interval several stages of activity occurred including intrusive events, collapse of the summit crater, explosive phreatic events, and degassing (figure 10). During September to mid-October, SO2 emissions were high and low levels of ash were intermittently emitted.
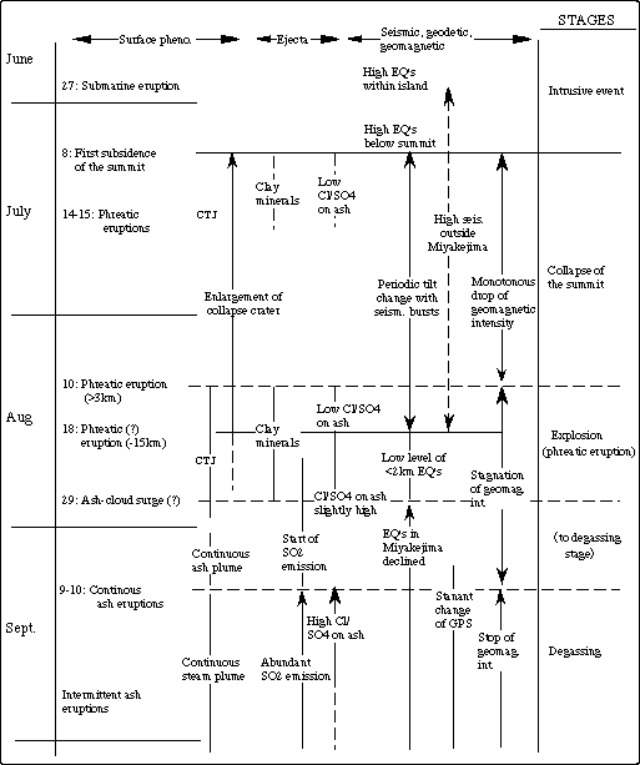 |
Figure 10. Time table summarizing the eruption at Miyake-jima during June-September 2000. Under the Phenomena column the abbreviation CTJ refers to an eruption with cock's tail jet. Under the Ejecta column the expression Cl/SO4 refers to the ratio of water soluble chloride to sulfur-dioxide ions attached on the surface of ash, a parameter whose increase is considered a good indicator of the hydrothermal water contribution. Courtesy of ERI, University of Tokyo. |
Gravity variation during June-August 2000. The ERI Gravity Group conducted a study on the spatio-temporal gravity variation during June-September 2000. They used a microgal gravimeter, which senses mass anomalies and movements beneath the Earth's surface. A change of 1.1 microgals ( µgal) is equal to about one part per billion of the gravitational acceleration at the Earth's surface. This is approximately the change in gravitational acceleration that would be expected from a 3 mm change in vertical position.
The group observed gravity changes among the five surveys around the volcano during June 1998 to August 2000 (figure 11). The geophysicists found that from the beginning of the activity to just before the crater collapse on 8 June 2000 gravity decreased ~140 microgals at the summit (figure 11a). This decrease could be explained by the creation of a cavity that was ~1.5 km deep and had a volume of 6 x 10⁸ m3. Gravity increased by 111 microgals in the SW part of the island due to the intrusion of a dyke that had a tensile opening of 1.7 m. The approximately 60 microgal increase along the coast resulted from subsidence of the entire island caused by deflation of the deep magma chamber.
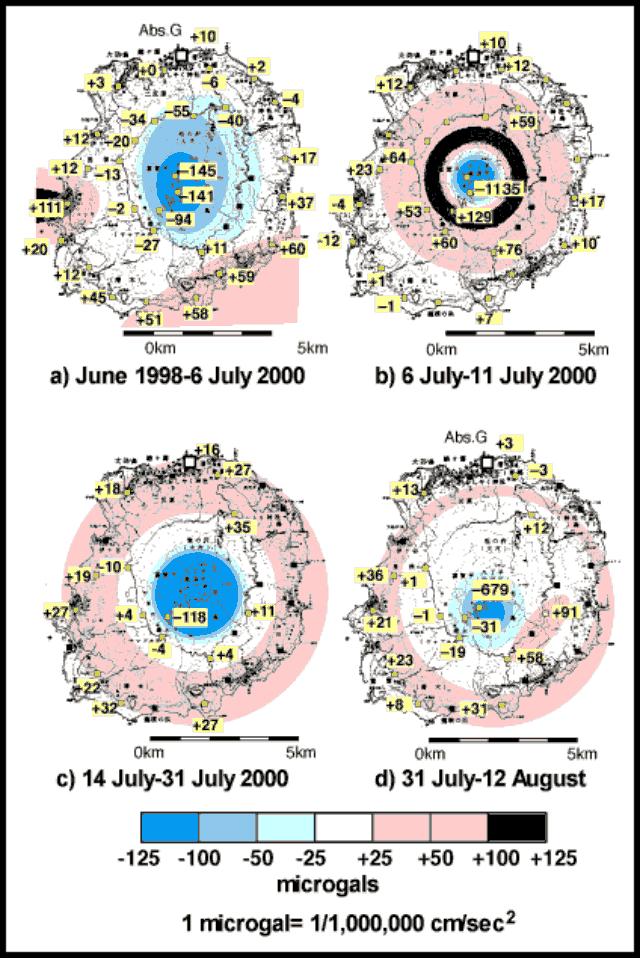 |
Figure 11. Differentials in gravity (µgal) shown for designated stations and shaded over larger areas resulting from five sequential surveys at Miyake-jima. The figures show differentials between: a) June 1998 to 6 July 2000 (dyke intrusion occurred on the W coast), b) 6 July-11 July 2000 (crater collapse began on 8 July), c) 14 July-31 July 2000 (crater collapse continued and summit explosions occurred on 14 and 15 July), and d) 31 July-12 August 2000 (crater collapse continued and a summit explosion occurred on 10 August). Courtesy of the ERI Gravity Group. |
From just before the 6 July crater collapse to just after the 11-14 July collapse the crater's cavity had a volume of 1.5 x 10⁸ m3 (figure 11b). During this time the gravity dramatically decreased by 1,135 microgals at the summit due to the mass deficiency associated with the crater collapse (dark band just outside the new crater). Gravity increased from ~50-130 microgals along the inner circular path. This increase was due to the loss of the upward-directed attraction associated with the pre-collapse summit morphology. The concentric gravity change suggested cylindrical conduits beneath the summit. If the collapse and drain-back/flow out of magma were to continue, the gravity at the center of the island (high elevations) would decrease and it would increase around the coast (low elevations).
Several events occurred during 11-31 July. The summit crater became deeper, reaching 450 m depth and larger with a crater cavity volume of 3 x 10⁸ m3. Steam explosions occurred on 14 and 15 July. The station SW of the summit (figure 11b) showed a gravity change of +129 microgals; by 31 July this station's differential decreased to -118 microgals. This decrease occurred because the center of gravity of the summit crater descended below the height of the seismic station due to the progressive collapse of the summit crater. Figure 11c portrays the gravity change spread in the form of concentric circles.
During 28 July to 12 August, the crater became even deeper reaching 500 m and larger with a crater cavity volume that was over 3.5 x 10⁸ m3 (figure 11d). Steam explosions occurred on 10, 14, and 15 August. Gravity decreased as much as 680 microgals around the summit because the expanding crater rim was approaching the stations. Gravity increased from 58 to 91 microgals in the E portion of the edifice, which indicated that the crater was extending to the E. As the center of collapse descended, the area of neutral change (white in figure 11d) also descended and approached the coastal area. Despite ongoing crater collapse, the center of mass of the crater remained above the height of the stations along the coast, so an increase in gravity was detected there.
Overall, during the course of the five gravity surveys, gravity steadily increased in the western section of the island. This increase suggested that magma was traveling through a channel from the volcano to the seismic swarm off the W coast of the island. There was also an unexplained gravity increase in the SSE part of the island. The gravity decrease in the island's center was mostly due to the collapse of the summit caldera. The gravity decrease appeared to be less dramatic after late-July because some observation points were destroyed. Gravity variation data for the period after the large phreatic eruption on 18 August were not available.
Measurement of the size of the summit crater using PI-SAR. The Environment Information Technology Section used an airborne high-resolution multiparameter synthetic aperture radar (PI-SAR) to capture images of the volcano and determine the change in the size of the summit crater during 6 July-30 August. The Pi-SAR was developed by the Communications Research Laboratory (CRL) of the Ministry of Posts and Telecommunications of Japan and the National Space Development Agency of Japan (NASDA). It is a dual-frequency radar operating at L-band and X-band frequencies with polarimetric functions. Although not discussed here, the X-band system also has an interferometric function by which topographic mapping of the ground surface is achieved.
The increase in size of the summit crater is evident by comparing three PI-SAR images of Miyake-jima (figure 12). Figure 12a was taken two days before the crater collapse on 8 July and the effects of the latter event appear on figure 12b. Figure 12c shows the effect on the size of the crater after a relatively small phreatic eruption on 10 August sent an ash cloud to an altitude of ~3 km and after a larger phreatic eruption occurred on 18 August sending an ash cloud to an altitude of ~15 km. Analysis of close-up views of the summit crater revealed that the eruptions caused the crater to grow from 1,380 x 1,370 m on 2 August, to 1,550 x 1,620 m on 30 August (figure 13).
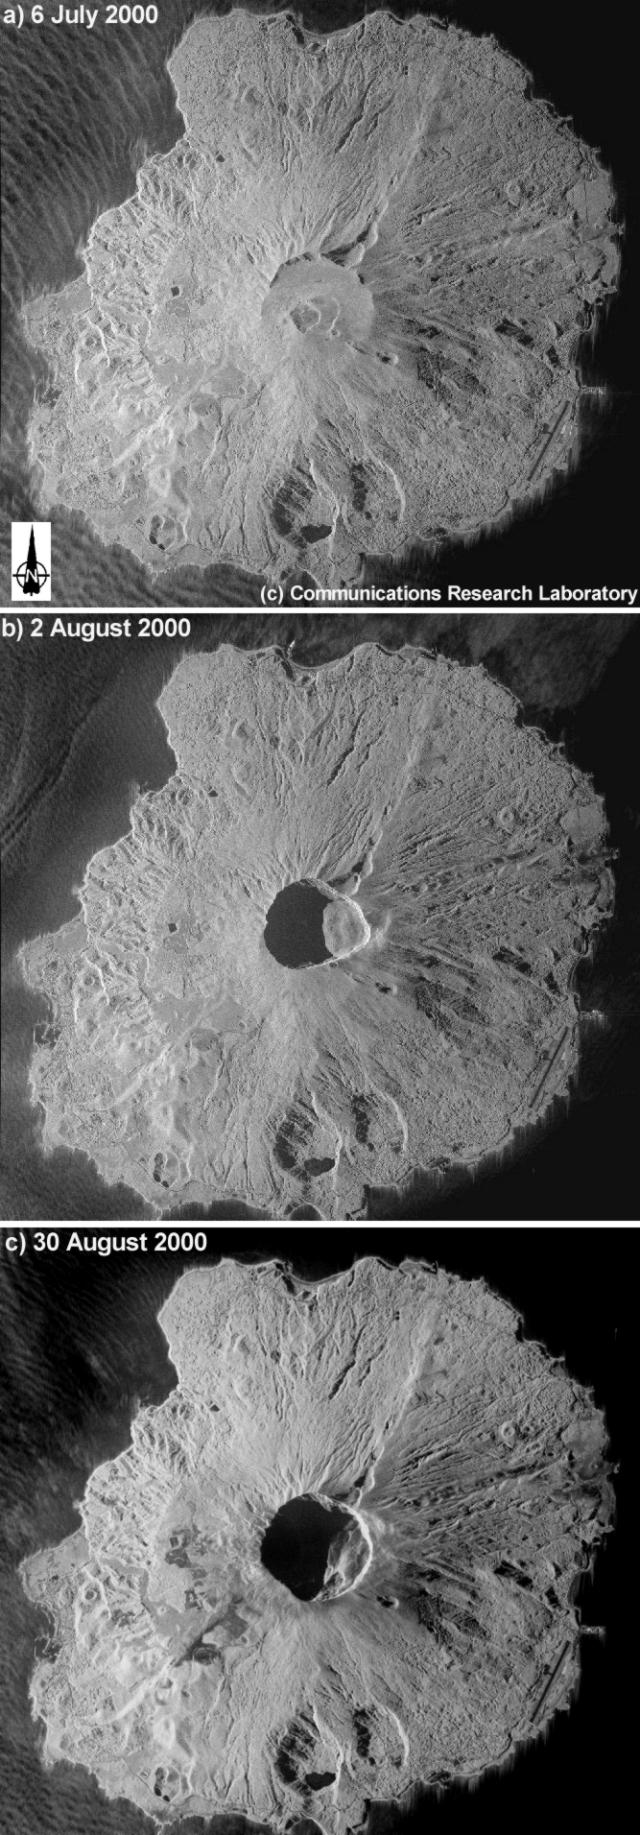 |
Figure 12. Images of Miyake-jima from the airborne high-resolution multiparameter synthetic aperture radar (PI-SAR) taken on (a) 6 July 2000, (b) 2 August 2000, and (c) 30 August 2000. The X band used: VV=Red, HV=Green, HH=Blue. The flight direction was from S to N, and illumination was from W to E. The images represent a 9 x 9.5 km area. Courtesy of the Environment Information Technology Section of CRL. |
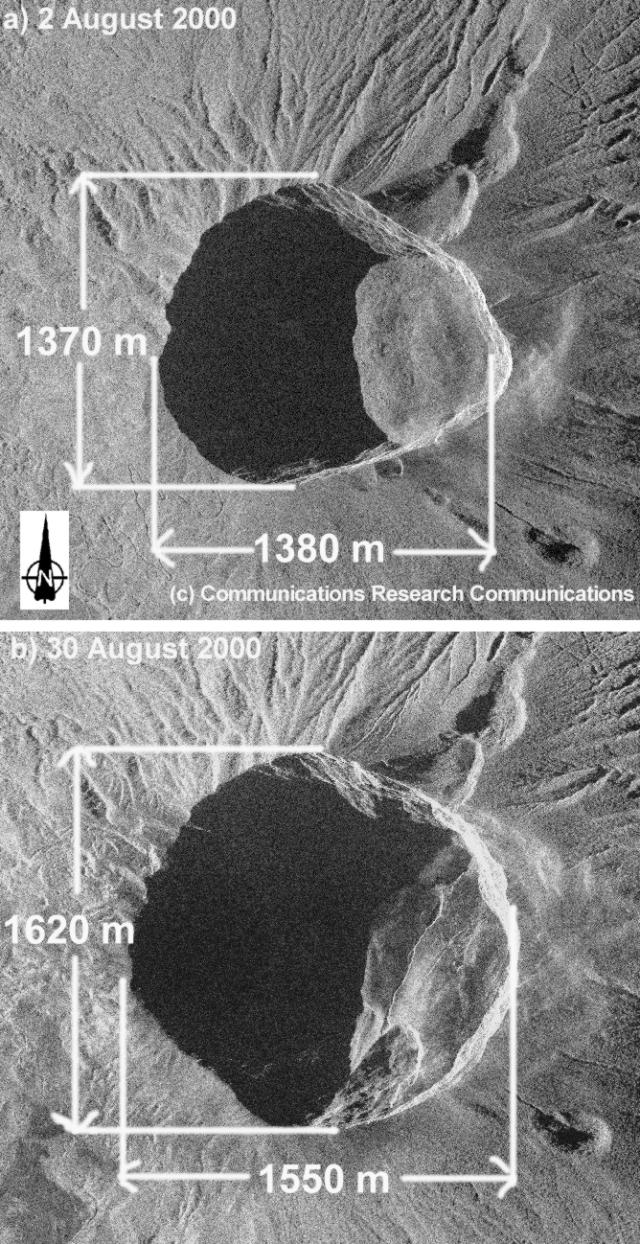 |
Figure 13. Enlarged images of Miyake-jima's summit crater made from airborne high-resolution multiparameter synthetic aperture radar (PI-SAR) taken on a) 2 August, and b) 30 August 2000 (close-up views of figure 12b and c). Courtesy of the Environment Information Technology Section of CRL. |
Activity during mid-August through mid-October 2000. According to the Volcano Research Center (VRC), subsidence of Miyake-jima's summit crater was not clearly observed after mid-August. Partial collapse of the northern cliff of the caldera was seen in late-September. Ash was emitted continuously in early September and intermittently in late September. A large pyroclastic cone with steaming craters was present on the southern cliff of the crater. On 16 October the crater floor was at an elevation of 230 m according to a laser distance-meter survey performed from a helicopter by Earthquake Research Institute (ERI).
The Japan Meteorological Agency, the Geological Survey of Japan, and the Tokyo Institute of Technology reported that in mid-October the SO2 flux from Miyake-jima's summit caldera was at a high level with 30,000-50,000 metric tons/day emitted. Since the SO2 flux was so high, officials decided that no one could stay on the island during the night. In early October public workers and researchers stayed on a ship near the harbor and landed on the island in the daytime. After a short period of time officials decided that it was too dangerous for people to live on the ship so they began to commute by small boats between Miyake-jima and the nearest island, Kozu-shima. Since power company workers were not on the island, electricity was cut, halting volcano data collection from electrically powered instruments on the transmission grid.
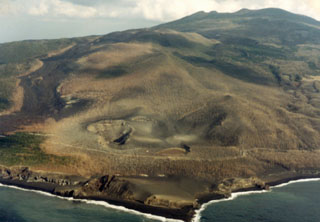
Geological Summary. The circular, 8-km-wide island of Miyakejima forms a low-angle stratovolcano that rises about 1,100 m from the sea floor in the northern Izu Islands about 200 km SSW of Tokyo. The basaltic volcano is truncated by small summit calderas, one of which, 3.5 km wide, was formed during a major eruption about 2,500 years ago. Numerous craters and vents, including maars near the coast and radially oriented fissure vents, are present on the flanks. Frequent eruptions have been recorded since 1085 CE at vents ranging from the summit to below sea level, causing much damage on this small populated island. After a three-century-long hiatus ending in 1469 CE, activity has been dominated by flank fissure eruptions sometimes accompanied by minor summit eruptions. A 1.6-km-wide summit crater was slowly formed by subsidence during an eruption in 2000.
Information Contacts: ERI Gravity Group, Shuhei Okubo; Masato Furuya, Sun Wenke, Yoshiyuki Tanaka, Hidefumi Watanabe, Jun Oikawa, and Tokumitsu Maekawa (URL: http://www.eri.u-tokyo.ac.jp/); Environment Information Technology Section, Global Environment Division, Communications Research Laboratory (CRL), Japan (URL: https://www.nict.go.jp/en/); S. Nakada and Hedifumi Watanabe, Volcano Research Center, Earthquake Research Institute, University of Tokyo, Yayoi 1-1-1, Bunkyo-ku, Tokyo 113-0032, Japan (URL: http://www.eri.u-tokyo.ac.jp/VRC/index_E.html); Geological Survey of Japan, 1-1-3 Higashi, Ibaraki, Tsukuba 305, Japan (URL: https://www.gsj.jp/); Japan Meteorological Agency, Volcanological Division, 1-3-4 Ote-machi, Chiyoda-ku, Tokyo 100, Japan (URL: http://www.jma.go.jp/); Tokyo Institute of Technology, 2-12-1 Okayama, Meguro-ku, Tokyo, Japan (URL: http://www.titech.ac.jp/).