Report on Rabaul (Papua New Guinea) — November 2000
Bulletin of the Global Volcanism Network, vol. 25, no. 11 (November 2000)
Managing Editor: Richard Wunderman.
Rabaul (Papua New Guinea) Ashfall during August-October most abundant since 1995
Please cite this report as:
Global Volcanism Program, 2000. Report on Rabaul (Papua New Guinea) (Wunderman, R., ed.). Bulletin of the Global Volcanism Network, 25:11. Smithsonian Institution. https://doi.org/10.5479/si.GVP.BGVN200011-252140
Rabaul
Papua New Guinea
4.2459°S, 152.1937°E; summit elev. 688 m
All times are local (unless otherwise noted)
This report, which covers the period from August through October 2000, notes that Vulcanian eruptions prevailed at Tavurvur during 29 August through October 2000. These eruptions bore far more ash than typical. Substantial amounts of ash blew towards the city of Rabaul and other inhabited areas. During the second and third weeks of September the amount of ash falling reached a maximum since the current eruption began on 28 November 1995.
On 2 and 9 August eruptive plumes contained ash. At other times during August vent activity was relatively low, consisting only of small volumes of thin white vapor. The 29 August eruption changed this pattern.
Although the main phase of the 29 August eruption began at 1158, it was preceded by a series of weak explosions yielding dark gray ash plumes. After these less-forceful explosive events ended, moderate volumes of dark gray ash clouds erupted. Subsequently, and through 8 September, the eruption pattern was comprised of interchanging periods of either continuous, moderate-volume ash emissions or relatively subdued ash-cloud emissions typically white to pale gray in color.
At about 2200 on 8 September, the eruption became more intense, frequent, and discrete explosions producing thick billowing dark ash clouds. Throughout the rest of September, periods of sub-continuous ash emissions occurred. After 21 September, however, discrete explosions and sub-continuous ash emissions declined and continued at a subdued level. Throughout September, observers saw incandescent lava fragments occasionally ejected. Residents saw these ejected fragments more frequently after the onset of explosive activity on 8 September, and around this time the residents regularly noted audible noises associated with venting.
Explosions every few minutes produced sub-continuous moderate to heavy ash emissions that continued in October. Some of the larger explosions showered the N and NE flanks of the volcano with bombs. At night these were seen to be incandescent (red to dull orange). On inspection most projectiles were lithic blocks, but a minority were in a plastic state with some bread-crust surfaces. Jet-aircraft-like roaring from the vent was common and some of the larger explosions could be heard at distances of over 15 km. Toward the end of October, the explosions were less forceful, but contained increased volumes of solid fragments.
All activity during the reporting period appears to have been confined to the 1941 vent; the 1995 crater issued only white vapor. The current phase enlarged the vent as a result of explosive activity. The N crater was breached, forming a saddle-like depression in the rim reaching about 15-20 m lower than the originally symmetrical and level line comprising the ridge.
During the first 2-3 weeks of September ash clouds rose as high as 2 km above the summit. As previously noted, many plumes blew N and NW to drop ash on inhabited areas. As a result, many Rabaul businesses were adversely affected and, by the end of the September, some had moved ~40 km SE of Rabaul to the settlement of Kokopo. The major health center in Rabaul town was also affected and patients with respiratory problems were moved to another health center near Kokopo. During early October the ashfalls caused patients to undergo evacuation from Nonga Hospital (5 km NNW of Rabaul). Toward the end of October the annual change in the trade winds caused less ashfall in Rabaul town; frequent heavy rains around this time also provided relief from suspended dust.
Seismicity correlated fairly directly with behavior observed at the summit, and accordingly, seismic activity remained relatively low until the onset of the eruption. The total number of low-frequency earthquakes recorded during August was 208, with the largest daily number of 35 on 30 August. This monthly total was slightly higher than that in July. During the main episodes of ash eruption between 29 August and 8 September, seismicity was characterized by bands of non-harmonic volcanic tremor. Bands of volcanic tremor with reduced amplitude were recorded again during 17-19 September and, until the end of the month, seismicity included sporadic short-duration tremor associated with sub-continuous ash ejections.
For August and September, respective high-frequency earthquakes totaled 17 and 8; all occurred NE of Rabaul caldera. The time difference between S- and P-wave arrivals for these events (S minus P) was 3-6 seconds. Since 28 November 1995, strings or significant numbers of high-frequency NE earthquakes have correlated with greater summit activity at Tavurvur. The time interval from the onset of the high-frequency earthquakes to greater summit activity ranged between one week to a few months. Rabaul's last major NE earthquake sequence occurred during May-June 2000 (see BGVN 25:07).
During September a total of 3,661 low-frequency earthquakes were recorded. This total includes explosion earthquakes (with air phases). When like earthquake records were compared, the September record attained the highest total since May 1996 (when 3,993 such earthquakes were recorded). September's highest daily total, 228, was recorded on 11 September; the lowest total, 3, was recorded on 4 and 7 September, occurring on days when tremor dominated the seismicity. October seismicity included 2,544 low-frequency earthquakes.
Ground deformation measurements from electronic and wet tiltmeters showed some caldera inflation from July 1999 to April 2000. After April, the trend changed to show deflation until about August 2000. Tiltmeters registered slow inflation during the first few days of September, followed by subsidence, and then stable conditions on 8 September. Some deformation-monitoring sites in the area of Tavurvur seemed to indicate a deflationary trend starting in late September and continuing through October.
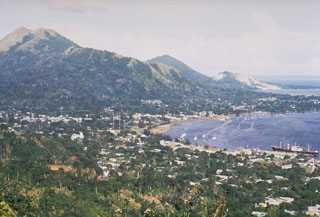
Geological Summary. The low-lying Rabaul caldera on the tip of the Gazelle Peninsula at the NE end of New Britain forms a broad sheltered harbor utilized by what was the island's largest city prior to a major eruption in 1994. The outer flanks of the asymmetrical shield volcano are formed by thick pyroclastic-flow deposits. The 8 x 14 km caldera is widely breached on the east, where its floor is flooded by Blanche Bay and was formed about 1,400 years ago. An earlier caldera-forming eruption about 7,100 years ago is thought to have originated from Tavui caldera, offshore to the north. Three small stratovolcanoes lie outside the N and NE caldera rims. Post-caldera eruptions built basaltic-to-dacitic pyroclastic cones on the caldera floor near the NE and W caldera walls. Several of these, including Vulcan cone, which was formed during a large eruption in 1878, have produced major explosive activity during historical time. A powerful explosive eruption in 1994 occurred simultaneously from Vulcan and Tavurvur volcanoes and forced the temporary abandonment of Rabaul city.
Information Contacts: Ima Itikarai, David Lolok, Herman Patia, and Steve Saunders, Rabaul Volcano Observatory (RVO), P.O. Box 386, Rabaul, Papua New Guinea.