Report on Atmospheric Effects (1995-2001) — December 2001

Atmospheric Effects (1995-2001)
Bulletin of the Global Volcanism Network, vol. 26, no. 12 (December 2001)
Managing Editor: Richard Wunderman.
Atmospheric Effects (1995-2001) Multi-year lidar from Hampton, VA, USA shows peaks and current low
Please cite this report as:
Global Volcanism Program, 2001. Report on Atmospheric Effects (1995-2001) (Wunderman, R., ed.). Bulletin of the Global Volcanism Network, 26:12. Smithsonian Institution.
Atmospheric Effects (1995-2001)
All times are local (unless otherwise noted)
Despite their infrequent recent reporting in the Bulletin, lidar measurements remain relevant when discussing the atmospheric impact of volcanic eruptions. As discussed below, following the large-scale atmospheric perturbation caused by Pinatubo, smaller atmospheric perturbations have been infrequent, but the eruption of Shishaldin in April 1999 produced aerosol layers that were detected in North America and Europe (Bulletin v. 24, no. 4).
Reports about atmospheric effects of volcanic activity were last provided as follows: Bulletin v. 26, no. 5, "Volcanic aerosol optical thicknesses derived from lunar eclipse observations;" Bulletin v. 24, no. 4, "Tracing recent ash by satellite-borne sensors and ground-based lidar;" Bulletin v. 23, no. 12, "Lidar data from Garmisch-Partenkirchen, Germany;" and Bulletin v. 23, no. 11, "Lidar data from Hampton, Virginia, USA."
NASA lidar measurements at Virginia, USA. Mary Osborn provided measurements from the 48-inch ground-based lidar system at NASA Langley Research Center (table 18) since May 1999. All measurements were taken at a wavelength of 694 nm. Their 48-inch lidar system was out of commission for ~8 months in late 1999 and early 2000, as they used some of its components to conduct the SAGE III Ozone Loss Validation Experiment (SOLVE). That campaign took place during November 1999-March 2000 based out of Kiruna, Sweden.
Table 18. Lidar data from Virginia, USA, for May 1999-December 2001 showing altitudes of aerosol layers. Backscattering ratios are for the ruby wavelength of 0.69 µm. The integrated values show total backscatter, expressed in steradians-1, integrated over 300-m intervals from the tropopause to 30 km. Courtesy of Mary Osborn.
| DATE | LAYER ALTITUDE (km) (peak) | BACKSCATTERING RATIO | BACKSCATTERING INTEGRATED |
| Hampton, Virginia (37.1°N, 76.3°W) | |||
| 28 May 1999 | 15-26 (11.0) | 1.14 | 5.28 x 10⁻⁵ |
| 24 Sep 1999 | 12-28 (20.3) | 1.09 | 2.93 x 10⁻⁵ |
| 09 May 2000 | 16-27 (20.5) | 1.08 | 2.65 x 10⁻⁵ |
| 08 Sep 2000 | 14-30 (20.5) | 1.08 | 2.06 x 10⁻⁵ |
| 12 Oct 2000 | 15-28 (17.5) | 1.08 | 2.72 x 10⁻⁵ |
| 20 Oct 2000 | 14-30 (17.5) | 1.12 | 5.65 x 10⁻⁵ |
| 30 Oct 2000 | 12-30 (28.6) | 1.12 | 6.31 x 10⁻⁵ |
| 27 Feb 2001 | 12-28 (22.1) | 1.12 | 4.97 x 10⁻⁵ |
| 01 May 2001 | 15-27 (19.4) | 1.09 | 2.26 x 10⁻⁵ |
| 24 May 2001 | 17-28 (21.8) | 1.09 | 3.28 x 10⁻⁵ |
| 07 Sep 2001 | 15-28 (17.0) | 1.11 | 2.88 x 10⁻⁵ |
| 04 Oct 2001 | 15-30 (16.9) | 1.08 | 2.38 x 10⁻⁵ |
| 16 Oct 2001 | 15-30 (17.5) | 1.08 | 2.36 x 10⁻⁵ |
| 07 Nov 2001 | 12-29 (18.5) | 1.08 | 3.56 x 10⁻⁵ |
| 22 Nov 2001 | 13-30 (18.8) | 1.10 | 5.01 x 10⁻⁵ |
| 04 Dec 2001 | 12-28 (24.8) | 1.12 | 4.85 x 10⁻⁵ |
Figure 13 presents an overview of stratospheric integrated aerosol backscatter since 1974. A slight increase in stratospheric integrated backscatter occurred during late 1998-99, at least partly attributed to the Shishaldin event and several smaller eruptions. After that, the stratospheric integrated backscatter returned to the "background" aerosol loading measured in 1978-1979. Although the current level of stratospheric aerosol loading remains low, another major volcanic eruption could change the situation quite suddenly.
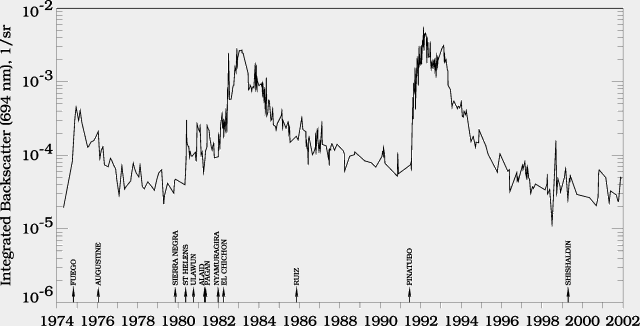 |
Figure 13. A plot of the 48-inch lidar data versus time showing the stratospheric integrated aerosol backscatter measured since 1974. Important volcanic eruptions that may have led to increased northern mid-latitude aerosol loading are noted on the time axis. Courtesy of Mary Osborn. |
Information Contacts: Mary Osborn, NASA Langley Research Center (LaRC), MS 475, Hampton, VA 23681, USA.