Report on Tungurahua (Ecuador) — January 2002
Bulletin of the Global Volcanism Network, vol. 27, no. 1 (January 2002)
Managing Editor: Richard Wunderman.
Tungurahua (Ecuador) Powerful tremor, plumes, 600-m-high lava fountains, and lahars during 2001
Please cite this report as:
Global Volcanism Program, 2002. Report on Tungurahua (Ecuador) (Wunderman, R., ed.). Bulletin of the Global Volcanism Network, 27:1. Smithsonian Institution. https://doi.org/10.5479/si.GVP.BGVN200201-352080
Tungurahua
Ecuador
1.467°S, 78.442°W; summit elev. 5023 m
All times are local (unless otherwise noted)
The first portion of this report discusses some geophysical and geochemical aspects of Tungurahua's behavior during 2001, including further descriptions through August 2001 (BGVN 26:07). The latter portion of this report contains a log of behavioral data for 24 August-30 December 2001 in tabular form, and finally includes field notes from a visitor who watched the summit crater for several weeks in the later months of the year.
Instituto Geofísico (IG) scientists estimated that 10-15 million metric tons of ash were deposited during the 4-26 August 2001 eruption. By the end of 2001 the current eruptive crisis had included 8 inferred intrusive episodes. Some eruptions, including those during 2001, displayed fountaining with jets of lava rising over 500 m. Since 5 September 2000 through at least January 2002, Alert Levels have been set at Yellow for the town of Baños and at Orange for the rest of the high-risk zone.
Seismicity and SO2 flux. Long-period (LP) earthquakes dominated the seismic record since December 1999 (figure 12). Except for the anomalous month of February 2001, this trend continued in 2001, with the number of LP earthquakes largely swamping other kinds. Specifically, at the scale of the histogram hybrid (H) earthquakes are only visible during February and August; volcano-tectonic (VT) earthquakes, only during January, August, September, and December; explosion (EXP) earthquakes, only during June, July, August, and September.
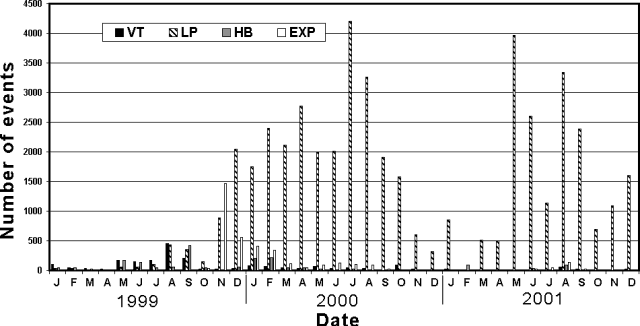 |
Figure 12. Number of Tungurahua earthquakes recorded monthly during 1999-2001. LP earthquakes clearly dominated since December 1999, except for the anomalous month of February 2001. During the year 2001, the peaks seen around May, August, and December may have corresponded to magmatic intrusions. Courtesy of IG. |
During 2001 both the seismicity and SO2 flux underwent intervals of relative quiet and intervals with elevated signals. The most dramatic quiet interval, from late 2000 into May 2001, appears on a plot of reduced displacements (RDs) from explosive events (figure 13). A comparative lull also appeared in overall seismicity (figure 12), provisionally in SO2 flux (figure 15), and to a lesser extent, in tremor energy (figure 14). Although the lull appears more equivocal on figure 14, the peaks in tremor energy during July and August, following the lull, were the largest recorded since the spike seen in January 2000. Elevated SO2 flux values appeared around about the same times as the peaks in tremor energy (figure 15).
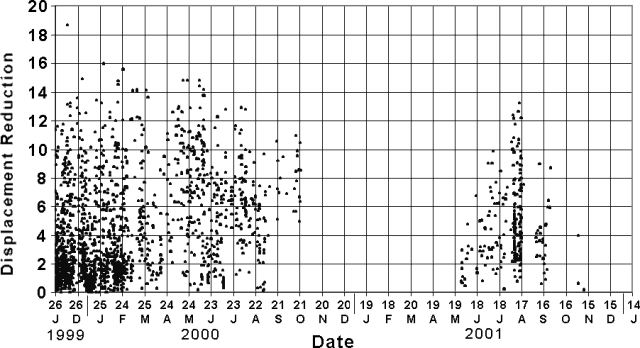 |
Figure 13. Explosion earthquakes at Tungurahua during 26 November 1999-14 January 2002 were quantified as reduced displacements (RDs, unit, cm2) and plotted at roughly 2-day intervals. RDs can be computed from seismic records; larger values indicate larger events. The record used came from station Patacocha. The largest RD shown, ~19 cm2, corresponds to an explosion that took place in December 1999 (upper left-hand corner). Courtesy of IG. |
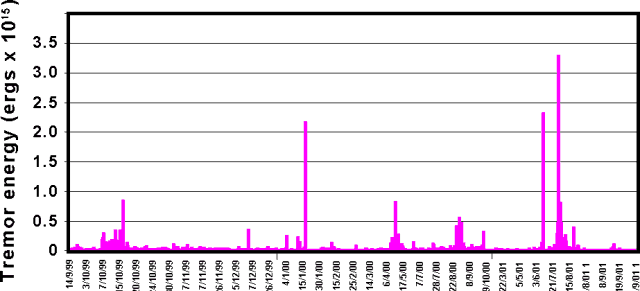 |
Figure 14. At Tungurahua, the energy contained in tremor (including both harmonic and hydrothermal types) during 14 September 1999-30 September 2001. The two largest peaks in tremor energy yet recorded occurred in mid-2001 (July and August). Horizontal axis is labeled as day/month/year. Courtesy of IG. |
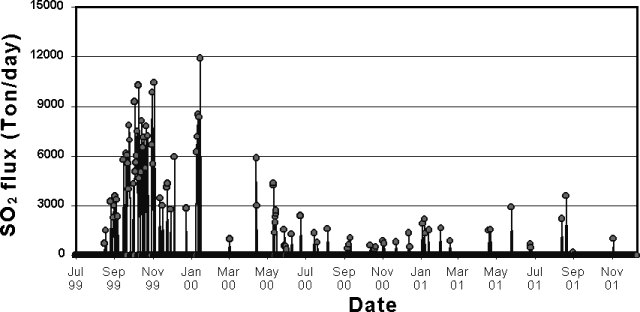 |
Figure 15. SO2 flux measured by COSPEC at Tungurahua during July 1999-November 2001. During 2001, flux highs were measured during May and August. Courtesy of IG. |
During 2001, instruments recorded two pronounced seismic peaks (figures 6 and 7). These swarms of LP events had focal depths of 5-7 km and a wide range of dominant frequencies, 308-1066 Hz. The first peak in LP events took place during May-June and was accompanied by emissions at the summit.
The second peak in LP events took place during August-September and also corresponded to increases in the number of hybrid (HB) and volcano-tectonic (VT) earthquakes, and to summit explosions. This second peak differed from seismicity during September 1998 and October 1999 (see plot, BGVN 26:07). During those earlier times, instruments recorded higher numbers of HB and VT events. More recently, both HB and VT events had been decreasing: the former since July 2000, and the latter since October 2000.
Although during early December comparatively few earthquakes occurred, the type of events recorded, tornillos, merit special discussion (see below). Beginning on 20 December the number of LP events increased from an average of 20 events per day in the first days of the month, to an average of 200 events per day. The LPs maintained that level until 26 December.
The two prominent seismic peaks of 2001 were considered as related to intruding magma. Thus, the intrusion associated with the first peak can be divided into three pulses, the first occurring during 19-20 March, the second, 17-18 May, and the third, 6-7 June (and perhaps into July).
The second intrusion occurred in two pulses, the first during 4-20 August, and the second during 4-25 September. The events related to the second intrusion produced the largest RDs (figure 13). For comparison, in 1999-2000 LP events had larger RDs, 12-19 cm2 (figure 13).
In the first inferred intrusion, the discharge of SO2 amounted to 2,900-3,600 metric tons/day (t/d), decreasing to 677 t/d by the end of June. SO2 fluxes associated with the second inferred intrusion reached 3,585 t/d by mid-August, decreasing to 175 t/d by the end of August (figure 15). The peaks in SO2 flux closely corresponded to the increases in tremor energy (figure 14). Incandescence visible during the end of March and July, during early and mid-August, and during early September confirmed that magma then lay at or near the surface.
The pulses of activity of each intrusion preceded, and in some cases accompanied, the emission of vapor and ash during explosive Strombolian activity. For example, for the first intrusion, the second pulse of seismic activity preceded the explosion of 28 May. In that pulse there was ~1 explosion per day with RDs of 1-3 cm2. During the third pulse, aboutone explosion per day had RDs of 1-7 cm2.
For the second, more energetic intrusion, the first pulse of activity had 7 explosions per day with RDs of 1-13 cm2. The next (second) pulse had ~1 explosion per day with RDs of 1-9 cm2 (figure 13). The last intrusion, during mid-June through July, was preceded by "LP de Juive", events so-named because residents in Juive felt them. These signals could have been caused by clearing of nearby subsurface passages that transport magma.
At the beginning of December the previously mentioned tornillos appeared. Tornillos ("Screw-type" events) are monochromatic LP events characterized by a long, slowly decaying coda. On a seismogram they appear similar to a screw. They may arise from fluid resonance in a cavity. It is noteworthy that they showed up for the first time in December 2001, and arrived with considerable intensity. Where defined farther N in the Andes at Galeras, have been recognized as eruptive precursors.
Although relatively small in number, the tornillo events were considered important. During 3-9 December, 43 occurred, the largest number recognized in the history of monitoring at Tungurahua. During 4-12 December the duration of these event's increased. During 4-10 December they underwent a decrease in their dominant frequency. The latter could stem from increased gas in the fluid. The tornillo signals may thus disclose physical changes in the volcano during early December. For example, the tornillos could be related to shifts in internal pressure.
The LP events began to register on 20 December, suggesting magma ascent. A lack of significant ash emissions or SO2 flux suggested that the conduit was sealed. This could allow internal pressure to rise, resulting in a series of explosions.
Deformation. During 2001, inclinometer data from station RETU, located above the Refuge, showed a drift in the positive direction of 10-15 µrad. These values are not highly anomalous considering the large diurnal variations stemming from effects such as temperature and humidity changes in the air and ground surface. On the other hand, measurements of points on the W flank lacked significant distance changes.
EDM measurements from a fixed base (the El Salado base station) were conducted periodically. They aim at two distinct points on the NE flank (in a region above the Refuge). A gradual decrease in the distance between the base and the two points began during July 2000 and implies a slight inflation of the NE flank of the volcano.
During the course of field studies, new NE-flank fumaroles were sighted at ~4,400 m elevation along fractures. Topographic movements were suspected in this sector.
Chronological observations, August-December 2001. Table 5 summarizes seismicity, and visual and satellite observations of eruptions and explosions and their ash clouds.
Table 5. Summary of activity at Tungurahua during August through December 2001. These data mainly came from IG reports. Some of the higher plume heights came from the Washington VAAC and were based on satellite imagery and local aviation reports. Courtesy of IG.
| Date | Long-period earthquakes | Tremor signals | Observations |
| 24 Aug 2001 | -- | -- | An eruption at 1755 produced an ash cloud that rose ~6-8 km and drifted E to SE. |
| 29 Aug 2001 | 20 | several | A gas-and-ash eruption at 1530. |
| 03 Sep 2001 | 44 | 36 | Ash cloud rose to ~ 5.8 km and drifted W. |
| 05 Sep 2001 | 77 | 46 | Weak emissions with low ash content. |
| 08 Sep 2001 | -- | -- | Ash cloud at 0828 rose ~10.5 km altitude and drifted SW. |
| 11 Sep 2001 | -- | -- | Ashfall to N in Pondoa, Runtun, Banos; ashfall to S in Quero and Penipe; mudflows between Puela and Bilbao. |
| 12 Sep 2001 | 19 | 5 | An explosion at 1632 produced an ash-bearing emission that reached 2 km above the summit and drifted W; an explosion at 1830 produced an emission that reached 0.5 km above the summit and drifted W. |
| 13 Sep 2001 | 63 | 11 | A small explosion at 1106; continuous steam emission with ash reached 0.8-1 km above the summit and drifted W; ashfall to the W in Juive, Cotalo, and Bilbao. |
| 15 Sep 2001 | -- | -- | Incandescent material observed along with ash emissions; ashfall to the SW in Riobamba and Penipe. |
| 16 Sep 2001 | 123 | 37 | Small explosion at 1631; moderate explosion at 1750 (3-km-high column that drifted NW); 2 VT earthquakes. |
| 17 Sep 2001 | 56 | 12 | -- |
| 20 Sep 2001 | 62 | 49 | Moderate explosion at 1044 generated an ash column 2 km high that drifted W-SW; the explosion was preceded by three hours of tremor; ashfall in Pillate, Juive, and Runtun; columns of gas and ash drifted W. |
| 21 Sep 2001 | -- | -- | Moderate explosion at 1625 (3-km-high ash column drifted NW); incandescence observed in the crater. |
| 22 Sep 2001 | 212 | 139 | -- |
| 24 Sep 2001 | 104 | 159 | Moderate explosion at 1500 (ash column drifted WSW); flank rockfalls heard in Juive, Runtun, Pillate, Pondoa. |
| 25 Sep 2001 | 108 | 41 | An explosion at 1230 produced an ash column 5 km high that drifted NW; Strombolian activity, incandescence, and rockfalls observed on the W and NW flanks; ashfall in Cotalo; 2 VT earthquakes registered. |
| 26 Sep 2001 | 36 | 37 | Some ashfall to the S in Quero. |
| 11 Oct 2001 | 30 | -- | -- |
| 14 Oct 2001 | -- | -- | Ash visible ~1 km above the summit at 1736. |
| 20 Oct 2001 | 108 | 6 | Fumarolic activity on the NE side of the crater with intermittent emissions of white clouds that reached 20-500 m. |
| 22 Oct 2001 | 7 | 7 | Fumarolic activity produced clouds with low ash content that reached 0.5 km; at 1758 a gas-and-ash emission reached 0.7 km and drifted W. |
| 23 Oct 2001 | 7 | 1 | Fumarolic activity on the N flank (near Vazcun); ash emissions reached 1 km above the summit. |
| 24 Oct 2001 | 42 | 13 | -- |
| 26 Oct 2001 | -- | -- | Hot spot visible at summit on thermal satellite imagery. |
| 29 Oct 2001 | 24 | 3 | -- |
| 01 Nov 2001 | 42 | 3 | Gas-and-ash emissions reached 1-2 km above the summit and drifted ENE. |
| 03 Nov 2001 | 38 | 1 | -- |
| 06 Nov 2001 | 12 | 1 | -- |
| 11 Nov 2001 | 34 | 22 | Gas-and-ash emissions at 1050 and 1352 reached 1 and 3 km, respectively, both drifted W. |
| 14 Nov 2001 | 10 | 3 | Incandescence and sporadic gas columns observed. |
| 15 Nov 2001 | 38 | 11 | At 1420 a gas-and-ash emission reached 1 km high and drifted W. |
| 19 Nov 2001 | 73 | 15 | Emissions followed by 10-30 minutes of tremor; ash columns rose to 2 km and drifted WNW. |
| 22 Nov 2001 | 30 | -- | New fumarole observed on the W flank; EDM measurements showed swelling of the N flank. |
| 24 Nov 2001 | 21 | 4 | Gas-and-ash column rose to 100 m. |
| 26 Nov 2001 | 28 | 1 | -- |
| 27 Nov 2001 | 18 | -- | -- |
| 01 Dec 2001 | 21 | 1 | Constant gas-and-ash emission reached a few hundred meter's above the summit. |
| 02 Dec 2001 | -- | -- | A small ash emission at 1140 remained near the summit level. |
| 03 Dec 2001 | 23 | 2 | -- |
| 08 Dec 2001 | 42 | -- | -- |
| 10 Dec 2001 | 33 | 2 | -- |
| 12 Dec 2001 | 4 | -- | -- |
| 14 Dec 2001 | 12 | -- | Lahars traveled down the flanks of the volcano. |
| 16 Dec 2001 | 17 | -- | Lahars traveled down the flanks of the volcano; 1 VT earthquake registered. |
| 18 Dec 2001 | -- | -- | A gas-and-ash column reached 1 km above the summit. |
| 19 Dec 2001 | 16 | -- | -- |
| 20 Dec 2001 | 62 | -- | Gas-and-ash columns reached 100-200 m above the summit. |
| 26 Dec 2001 | 82 | 11 | At 1500 a gas-and-ash column reached ~0.3 km above the summit; the continuous gas transmission was accompanied by sporadic pulses of gas and ash. |
| 27 Dec 2001 | 186 | 12 | At 0900 and 1500 white gas-and-ash columns reached ~0.2 km above the summit. At 1006 and 1427 gray gas-and-ash columns reached 2 and 1 km, respectively; 1 VT earthquake registered. |
| 29 Dec 2001 | -- | -- | A mudflow at 2342 in the Juive Grande gorge affected La Pampa and Los Pajaros. |
| 30 Dec 2001 | 202 | -- | An explosion at 0023; at 0027 ash from the explosion rose to ~15 km; until 1500 ashfall was reported in Guadalupe and Patate and other areas W of the volcano. |
IG scientists estimated that 10-15 million tons of ash fell during 4-26 August eruptions. During 6-14 August ash clouds reached the Pacific Ocean, and on 9 August falling ash affected towns 100 km W of the volcano. The Washington Volcanic Ash Advisory Center (VAAC) reported that nearly continuous ash emissions had occurred at Tungurahua beginning on 6 August, but extensive cloudiness prohibited ash-cloud detection in satellite imagery. Officials reported that over 23,000 people were affected by ashfall. The Civil Defense of Ecuador reported that the ashfall reached ~5 cm deep in places. Volcanism also increased during mid-September. Ashfall was reported in adjacent communities during 11-13 September.
The IG reported that on 14 December heavy rain on the upper flanks of Tungurahua resulted in dangerous lahars (table 7). The rain lasted for ~3 hours and the road into Baños was blocked for more than 12 hours in the zone of La Pampa (NW lowermost flank), where the lahars are usually deposited. An emergency bridge was necessary so that traffic could continue to pass. A few cars were almost buried under the flows. Local authorities were alerted within several minutes prior to the event because of an acoustic flow-monitor instrument in the zone.
The minimum total volume of the lahar was ~55,000 m3, making it the seventh-largest recorded by the acoustic flow-monitor since April 2000. The deposit was mainly composed of coarse ash and small pebbles, but it removed blocks up to 2 m in diameter. Similar lahars were reported elsewhere, mostly on the western flank. On 16 December another short rain on the lower flanks removed part of the previous day's lahar in La Pampa, and formed another small flow that again blocked the road for awhile.
Watching the crater during parts of September-December. Jean-Luc Le Pennec of the Institut de Recherche pour le Développement and a collaborator at the IG visited Tungurahua during 10-18 September, 15-22 October, and 26 November-3 December. He made the following observations.
The volcano remained extremely quite, without visible gas escaping the crater, during the day on 10 September. Without clear premonitory signal, at 1915 a powerful lava fountain began. The first pulses of the fountain reached 700 m and progressively declined to 300 m above the crater, before stopping abruptly about 6 minutes after starting. The summit crater then resumed complete quiescence.
In a second episode at 2147, fountaining reached ~600 m above crater and decreased rapidly to ~300 m during the next 5-6 minutes. The crater returned to quiescence and was later obscured by clouds. A seismic swarm of LP events took place during the following hours. During 11-16 September activity was characterized by fluctuating but almost continuous gas-and-ash emissions. Plume height varied between 0.6 to 2 km, depending on gas pressure and wind speed above the crater. The plume usually drifted W (SW to NW). Ashfalls were reported in Guaranda (morning of 11 September), Riobamba (16 September), Pelileo (12 September), and in other localities closer to the volcano. In addition, short-lived explosions occurred at a rate of 0-2 per day, producing ballistic fallouts on the terminal cone, and ash columns reaching ~2-4 km above the crater. They were sometimes accompanied with cannon-like sounds heard 15 km away.
The ejected lava's brightness was particularly intense during the night of 16 September, and a few glowing blocks fell outside of the crater. Periods of rumbling noises were frequently heard all week long, but their intensity increased on 16-17 September. During the night of 17 September lava projections reached 100-300 m above the crater rim. This activity took place around 0300 and started declining very slowly 90 minutes later. The activity continued to decline during the day on 18 September, ending at about 1400 when no sounds were audible as close as 2.5 km from the crater. On 25 September, the volcano produced 1 explosion and Strombolian activity.
During 15-22 October, good weather conditions allowed for frequent observations of the crater. Extremely low activity prevailed, with almost no degassing from the summit crater (except for the permanently active fumaroles of the N crater rim and of the N flank at 4,400 m elevation). Light degassing was observed during the morning of 19 October, after 2 days of increased seismic activity (from ~10 to ~100 events/day). The same day, at 1327, a short-lived outburst sent an ash cloud to ~1 km above the crater. The cloud drifted rapidly to the NNE. Interestingly, the outburst occurred when seismic waves from a regional earthquake arrived at the volcano. Two small ash emissions also occurred, reaching 500-600 m above the crater. In the latter case, a lapse time of 42 seconds was measured between the onset of the seismic signal and the appearance of the ash cloud at the crater level. Light vapor venting was occasionally seen on 20 October. Four ash emissions were witnessed during 2000-2200, with ash columns reaching 0.5-1.0 km above the crater. Few other emissions occurred during the night of 21 October.
During 26 November-3 December activity was low. A fairly continuous pulsating gas plume was emitted from the summit crater. During a 70-minute period on 2 December, five small ash emissions occurred. They rose 0.5-1 km and drifted N. For the third emission, the delay between the onset of the seismic agitation and the appearance of the ash cloud at the crater was 25 seconds, perhaps indicating the release of magma relatively deep in the system.
Geological Summary. Tungurahua, a steep-sided andesitic-dacitic stratovolcano that towers more than 3 km above its northern base, is one of Ecuador's most active volcanoes. Three major edifices have been sequentially constructed since the mid-Pleistocene over a basement of metamorphic rocks. Tungurahua II was built within the past 14,000 years following the collapse of the initial edifice. Tungurahua II collapsed about 3,000 years ago and produced a large debris-avalanche deposit to the west. The modern glacier-capped stratovolcano (Tungurahua III) was constructed within the landslide scarp. Historical eruptions have all originated from the summit crater, accompanied by strong explosions and sometimes by pyroclastic flows and lava flows that reached populated areas at the volcano's base. Prior to a long-term eruption beginning in 1999 that caused the temporary evacuation of the city of Baños at the foot of the volcano, the last major eruption had occurred from 1916 to 1918, although minor activity continued until 1925.
Information Contacts: Patty Mothes and Daniel Andrade, Geophysical Institute (Instituto Geofísico, IG), Escuela Politécnica Nacional, Apartado 17-01-2759, Quito, Ecuador; Jean-Luc Le Pennec, "Volcanic processes and hazards" research unit, Institut de Recherche pour le Développement (IRD), Whymper 442 y Coruña, A.P. 17-12-857 Quito, Ecuador (URL: http:/www.ird.fr); Washington VAAC, Satellite Analysis Branch (SAB), NOAA/NESDIS E/SP23, NOAA Science Center Room 401, 5200 Auth Road, Camp Springs, MD 20746, USA (URL: http://www.ssd.noaa.gov/); United Nations Office for the Coordination of Humanitarian Affairs (OCHA), United Nations, New York, NY 10017 (URL: https://reliefweb.int/); Associated Press.