Report on Tungurahua (Ecuador) — December 2002
Bulletin of the Global Volcanism Network, vol. 27, no. 12 (December 2002)
Managing Editor: Richard Wunderman.
Tungurahua (Ecuador) Summary of 2002 activity includes several episodes of intense seismicity
Please cite this report as:
Global Volcanism Program, 2002. Report on Tungurahua (Ecuador) (Wunderman, R., ed.). Bulletin of the Global Volcanism Network, 27:12. Smithsonian Institution. https://doi.org/10.5479/si.GVP.BGVN200212-352080
Tungurahua
Ecuador
1.467°S, 78.442°W; summit elev. 5023 m
All times are local (unless otherwise noted)
This report presents a summary of activity throughout 2002. During 2002 several episodes of intense seismic activity occurred that shared certain characteristics: clusters of long-period (LP) earthquakes, tremor related to ash emissions, and an increase in VT events on some occasions. Magmatic intrusions during January-March 2002, were generally preceded by LP clusters with dominate frequencies of 3.8 Hz with some oscillating around 1.5-1.6 Hz. Following these clusters, increased tremor occurred, some related to the emission of gas and ash. Eruptive activity included explosions and Strombolian blasts.
In April, activity changed, LP clusters ceased including events with a dominant frequency of 3.8 Hz and began to contain frequencies of ~6 Hz. Since June, VT events seemed to precede LP events or tremor episodes. Precursors of magmatic activity changed slightly. In almost every case, fewer precursory events were registered. Instituto Geofisica (IG) stated that the present eruptive process could be more uncertain than before. In September, the acceleration of processes seemed to indicate variations in internal conditions, such as changes in magma within the conduit, increased temperatures, diminishing percentages of crystals, lower SiO2, and addition of new gases.
During October-November there was none of the intense tremor activity that usually accompanies new magma injections. Energy remained at very low levels. IG stated that a large number of VT events and their decreased influence on volcanic activity could indicate a low contribution of magmatic gases that could be mobilized and released outside the volcano by means of explosions, continuous ash emissions, or Strombolian activity as previously observed. Further details of 2002 activity follow.
Detailed activity. During the first 2 weeks of January 2002 a high number of low-energy LP earthquakes took place. Some of the LP's were associated with emissions of mainly steam with a moderate magmatic gas concentration. During the last 2 weeks of the month the number of LP's increased remarkably. The LP's occurred in clusters, most of which were preceded by VT events at depths of 4-11 km beneath the summit. Beginning on 15 January it was possible to see a glow coming from the crater, accompanied by the emission of gases. While the emissions diminished during the last week of January, explosions increased in number and magnitude. By the end of January sporadic episodes of tremor and light ashfall occurred in Ambato and Baños. These seismic characteristics, along with frequent roaring noises that occurred with the explosions, indicated possible degassing of a small volume of magma that entered the conduit beginning on 15 January.
During February magma injection apparently disturbed the system, and new gases ascended. Steam and ash emissions occurred, as well as the possible formation of a lava lake. Strombolian activity during 4-18 February was so strong that pyroclastic flows (PF's) descended the WNW flank along the Juive and Cusua valleys. Seismicity was characterized by LP's, tremor related to emissions, a few volcano-tectonic events (VT's), and small explosions.
During the first 3 weeks of March there was Strombolian activity with emissions of lava, gas, and ash, and almost-continuous roaring noises. During the third week of March, activity diminished in intensity until it disappeared almost completely by the last week of the month. Although incandescence was observed at night, it was not as intense as that observed in previous months. Ashfall occurred in Ambato, Quero, Latacunga, Cusua, Chacauco, Penipe, Peula, Patate, Pelileo, Cotaló, and Pillate.
Most of the LP's registered during April were small and rather sporadic, but frequency content changed on 17 April from 4-4.8 Hz to 6-8 Hz. On 22 and 23 April, VT events at 6-8 km depths were followed by strong gas-and-ash emissions. These became quite intense during 24-30 April.
Activity was quite intense during 12-13 and 28-30 May. On 13 May a total of 8 explosions took place, preceded by an increase in the number of LP events. The same day ashfall occurred in Ambato and Baños. On 24 May VT activity took place just before an increase in explosive activity. During 17-26 May explosions were preceded by VT events, and by 30 and 31 May were preceded by LP events. As of the second week of May Strombolian activity, roaring noises, and incandescence in the crater was intense and almost constant. Lava was present in the crater, accompanied by tremor and ongoing emissions. During the last week of the month a continuous gas-ash column drifted mainly W.
During the last week of June intense tremor registered. The tremor occurred for 3 days and contained dominant frequencies of 2.2-2.7 and 1.5 Hz. Tremor lasted up to an hour with an amplitude that saturated seismographs. Many LP's and explosions accompanied the tremor. During June VT events (4-7 km deep) occurred just before tremor and LP events. Several LP's and tremor episodes preceded explosive events. On average the LP's and tremor occurred 2-4 hours before an explosion.
Explosions occurred during the first week of July. During the first 2 weeks, deep VT earthquakes (5-10 km deep) occurred at a rate of ~1 per day and there was an increase in the number of LP's and hybrid earthquakes. VT and LP events preceded new cycles of explosions, not immediately as had previously been noticed, but in this case by about 15 days. After the new cycle of explosive activity began, most of the LP events had frequencies of 1.5-2.5 Hz. Some VT's preceded the LP's and had frequencies of 3.8 and 1.5 Hz. During the second week intense roars were heard, and increasing ash emissions mainly drifted W. There was strong persistent incandescence, and frequent explosions produced loud noises and ash columns 2-4 km above the crater.
During the first 2 weeks of July, several episodes of Strombolian activity were observed, along with continuous but light ash emissions that were accompanied by roaring noises. Ash was deposited in a thin N-S strip between Hualcango and San Pedro de Sabañag (S of Quero), extending toward the W and Igualata. Ash accumulated up to 2.5 mm thick in "El Mirador" at Cerro Arrayán. Activity decreased toward the end of the month, when small plumes were emitted.
During 5-13 September, 8-10 VT earthquakes registered. These preceded the harmonic tremor seen during 13-21 September. Strong explosions and ash emissions also occurred. Ashfalls were noted in distant cities such as Píllaro and Riobamba, located ~30 km NW and SW, respectively.
During the first week of October explosions with reduced displacements greater than 10 cm2 took place and ashfall occurred in Pillate, Ambato, Cusua, Penipe, Altar, Bayusig, Matus Alto, and Matus Bajo. During the second and last week of the month VT events preceded explosions. During the last week of the month incandescence and roaring noises were heard. Three ashfalls were noted, two in Guadalupe and one (on 29 October) in Baños (up to 1 mm), Runtún, Pondoa, and Pintitin.
On 10 and 26 November, two peaks of LP activity occurred that were very close to the peaks of VT activity. The first LP peak preceded the first VT peak by two days. This was unusual because the VT peak normally preceded the LP peak. The second LP peak took place around the same time as the VT peak, indicating that the circulation of fluids was almost simultaneous. Incandescence was observed before the VT activity on 26 November. An increase of LP activity seemed to be correlated with the increase of sounds emitted by the volcano. Frequent incandescence in the crater preceded a VT peak.
Magmatic intrusions during 2002. Five magmatic intrusions (figure 18) apparently occurred during (1) 15-29 January, (2) 15-30 April, 12-13, 24-30 May, (3) 28-30 June, (4) 3-13 July, and (5) 5-13 September. Two periods of intense activity also occurred during 8-13 and 21-27 October, and on 10 and 26 November. During April-June magmatic intrusions did not occur along with a peak of seismic activity, but VT's, hybrids, and emissions all occurred, though in smaller numbers than registered in previous years.
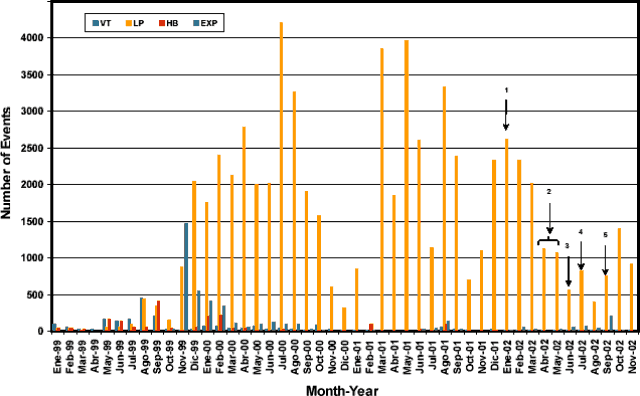 |
Figure 18. Monthly earthquakes at Tungurahua during January 1999-November 2002. Peaks indicated with arrows correspond to periods of inferred magmatic intrusion. Courtesy IG. |
Tremor activity was an essential indicator of these magmatic intrusions (figure 19). Later peaks of tremor activity were always during periods of seismicity related to magmatic intrusions, although it was not clear whether the June peak was related to a possible intrusion. Tremor energy was quite variable.
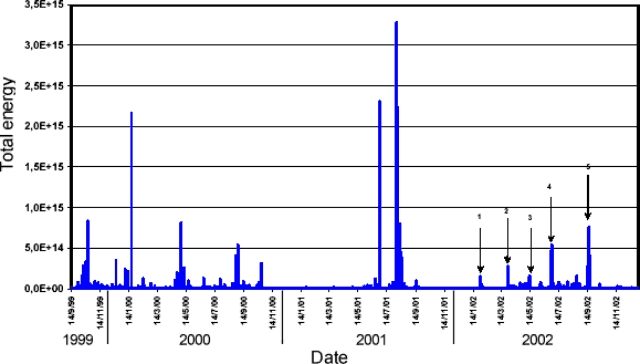 |
Figure 19. Tremor energy at Tungurahua, 14 September 1999 through 14 November 2002. Many of these tremor episodes were related to small emissions of gas or ash. Arrows indicate 2002 peaks. Courtesy IG. |
Deformation measurements. During 2002 EDM measurements on the N flank showed a slight tendency of inflation. This inflation was first noticed during the first half of 2000. During 2002 a shortening of the distance occurred between prisms and reference bases, between -2 and -6 cm with respect to values observed before the reactivation of the volcano. Although there were variations in measurements taken during the year, the overall tendency has been inflation of 4 to 6 cm with respect to that during 1998-2000.
Data from inclinometers RETU and JUIV show a positive drift of the radial axis of station RETU (elevation 4,000 m). The drift would mean a deflation in the NW sector. During September 2002, when numerous explosions occurred, inclinometer movements changed.
During 2002 measurements of the inclinometer at station JUIV5 were stable until October 2002, when there were disturbances in the radial axis and to a greater degree in the tangential axis. Since 10 November both axes showed significant changes of up to 200 µrad. The negative tendency indicated a progressive inflation. This change agreed exactly with the first LP peak on 10 November. The change lasted until 20 November and included the greater peak of VT activity during 2002. After 20 November, both axes became stabilized. The oscillations seen in this slope between September and October occurred simultaneously with other activity, possibly representing slow but continuous magma movement in the lower parts of the volcano.
Geochemistry. SO2 flux measurements determined by COSPEC during 1999-2002 were generally less than 2,000 tons/day (figure 20). The peaks took place during March and October, with values reaching 3,000-5,000 tons/day. These high values seemed to correspond with the magma injections of December 2001and January and September 2002. Other episodes of seismic activity related to magmatic injection seemed to precede the peaks in SO2 emission. The high point in August ("3 y 4" on figure 14), followed increased seismicity during June and July.
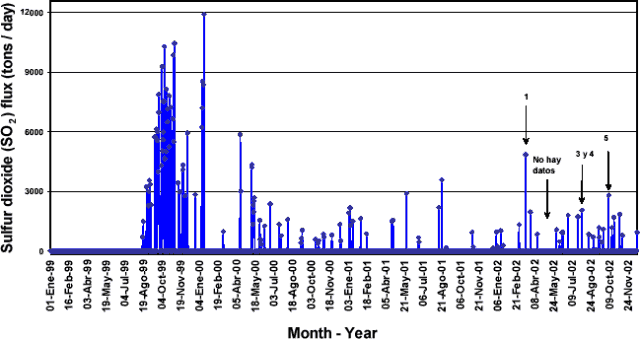 |
Figure 20. COSPEC-measured SO2 emissions at Tungurahua during 1999-2002. The arrows indicate the peaks of SO2 that occurred during May and August 2002. |
Thermal waters generally increased in temperature ~0.5°C. A small reduction in pH occurred, with a tendency toward alkaline values. During 1998-99, when the seismicity increased, pH also increased, probably because of the magmatic unrest at the time. Conductivity did not change, and neither did geochemical characteristics such as abundances of sulfates, chlorides, and bicarbonates. IG stated that it could not yet be explained how an increase in seismicity seemed to shift the pH of thermal waters (figure 21).
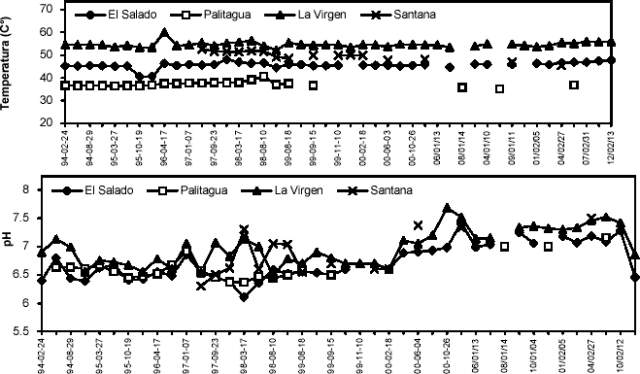 |
Figure 21. Temperature and pH of thermal waters at Tungurahua during 1994-2002. Courtesy IG. |
Future scenarios. Since 1999 Tungurahua has shown frequent, moderate volcanism with occasional lava emissions. This period can be divided into 13 magmatic intrusions of similar characteristics, although the last three injections displayed slight differences. Starting in 1916 Tungurahua displayed intermittent activity until 1918, with periods of tranquility and greater activity than at present.
The present process has been characterized by LP clusters just before and during eruptions. During October and November 2002, VT events usually preceded cycles of increased activity. Strong incandescence on 2 December was not accompanied by strong explosions, Strombolian activity, or lava emissions.
Geological Summary. Tungurahua, a steep-sided andesitic-dacitic stratovolcano that towers more than 3 km above its northern base, is one of Ecuador's most active volcanoes. Three major edifices have been sequentially constructed since the mid-Pleistocene over a basement of metamorphic rocks. Tungurahua II was built within the past 14,000 years following the collapse of the initial edifice. Tungurahua II collapsed about 3,000 years ago and produced a large debris-avalanche deposit to the west. The modern glacier-capped stratovolcano (Tungurahua III) was constructed within the landslide scarp. Historical eruptions have all originated from the summit crater, accompanied by strong explosions and sometimes by pyroclastic flows and lava flows that reached populated areas at the volcano's base. Prior to a long-term eruption beginning in 1999 that caused the temporary evacuation of the city of Baños at the foot of the volcano, the last major eruption had occurred from 1916 to 1918, although minor activity continued until 1925.
Information Contacts: Patty Mothes and Indira Molina, Geophysical Institute (Instituto Geofísico, IG), Escuela Politécnica Nacional, Apartado 17-01-2759, Quito, Ecuador.