Report on Nyiragongo (DR Congo) — February 2003
Bulletin of the Global Volcanism Network, vol. 28, no. 2 (February 2003)
Managing Editor: Edward Venzke.
Nyiragongo (DR Congo) Aftershocks, lava lake, SO2 fumes, acidic rains, and highly fluorinated water
Please cite this report as:
Global Volcanism Program, 2003. Report on Nyiragongo (DR Congo) (Venzke, E., ed.). Bulletin of the Global Volcanism Network, 28:2. Smithsonian Institution. https://doi.org/10.5479/si.GVP.BGVN200302-223030
Nyiragongo
DR Congo
1.52°S, 29.25°E; summit elev. 3470 m
All times are local (unless otherwise noted)
Nyiragongo was last reported on through late October 2002 (BGVN 27:10). This report covers through 21 December, an interval in which the hazard status remained high, with the population asked to exercise vigilance (code Yellow). Included here are reports from the Goma Volcano Observatory (GVO), and from Dario Tedesco and Simon Carn on geochemistry and atmospheric SO2. Several episodes of strong SO2 outgassing and unfavorable wind directions caused elevated concentrations of the gas to enter cities and acid rain to damage vegetation and water supplies. High fluorine was found in some rainwater samples. The 24 October 2002 earthquake's aftershocks and the state of the volcano led to significant stress on the regional inhabitants, including those in Goma.
During the October-December reporting interval, the GVO reports noted that their roughly weekly Nyiragongo observational climbs disclosed considerable changes on the crater's floor, a spot ~700 m down inside the summit crater. Comparisons between photos taken on 24 November and 9 December 2002 revealed the merging of two adjacent molten-surfaced lakes and the birth of another similar, though smaller, lava lake at a point well over 100 m away from the merged ones. The deep crater is often filled with fumes too dense to clearly see the crater floor, and in the above-mentioned cases photographers had just 5 to 10 seconds of moderate visibility to capture their photos. This helps explain why the status and behavior of the lava lakes is often ambiguous (see BGVN 26:03). Adequate visibility during a climb on 18 December revealed that the sole lava lake seen then stood ~45 m in diameter, its surface restless and agitated.
In accord with one or more dynamic and molten-surfaced lava lakes on 20 December, SO2 gas blew into Goma, causing residents to panic. Scoria falls were noted in late October, and in one particular case by residents of the SW-flank settlement of Rusayo at around 1100 on 15 November. It was noted in October that vegetation surrounding the crater's perimeter, particularly on the W flank, had sustained acid burns from abundant degassing. During October-21 December vapors over the crater frequently glimmered red at night. The 15 November visit disclosed the escape of high-temperature gases and the existence of fissures cutting across the residual platform of 17 January 2002 deposits. Fumaroles along fissures discharged gases. SW-flank fissures were also seen.
GVO summarized the volcano observations for the interval 15-28 December 2002, noting a permanent strong gas plume at 4,200-6,000 m altitudes. They again confirmed a permanent small lava lake, about 50 m in diameter with a central active lava fountain sending molten material to ~40 m heights. Minor amounts of Pelé's-hair ash fell in both Rusayo and Kibati villages. Residents of those villages and Kibumba reported seeing incandescence in the crater.
Residents of Kibati and Kibumba were greatly concerned the night of 27-28 November due to visible glimmer that appeared be coming toward them from Nyiragongo. The glimmer was benign activity in the crater rather than lava flows descending the flanks. This behavior was associated with lava-lake degassing.
Other observatory projects in late October to late December included the installation and maintenance of lake-level sensors on Lake Kivu, installation of thermal sensors at selected spots, and improved seismic telemetry.
Deformation surveys on 31 October, 2 November, and 13 November 2002 measured the distance between cross-fracture survey points (nails) along the scarps of Monigi, Lemera, and Shaheru. The results indicated that offsets remained comparatively stable, with little change compared to previous measurements (table 6). New cross-fracture measurements were also initiated at the Mapendo station. Data collected in late December continued to lack evidence of new deformation.
Table 6. Nyiragongo deformation measured along scarps on 2 and 13 November. These reportedly showed strong consistency with preceding measurements. New measurements were initiated at newly established survey points on 13 November. These were in the Mapendo neighborhood (a site towards Gift Bosco) on a revived fracture there. Courtesy of OVG.
| Date | Monigi | Lemera | Virunga | Shaheru | Mapendo |
| 02 Nov 2002 | 8.31 m | 7.55 m | 93.4 cm | 14.72 m | -- |
| 13 Nov 2002 | 8.31 m | 7.55 m | 93.4 cm | -- | 15.4 cm |
Geochemistry. SO2 fluxes increased during October and November 2002, rising from below detection limits to a few thousands metric tons per day (t/d), then to up to ~20,000 t/d. Dario Tedesco suggested that the increase might be due to a more efficient conduit geometry allowing gases access to the surface. The process may have accompanied upward movement of magma or its arrival at the surface.
During the last half of November through 2 December the TOMS SO2 estimates were under reliable detection limits due low concentrations. After that, on 7 and 11 December, respectively, TOMS data measured considerable SO2, ~12,000 and ~11,000 metric tons per day (t/d) (table 7).
Table 7. SO2 fluxes at Nyiragongo based on the TOMS instrument. Courtesy of Simon Carn.
| Date | Daily SO2 flux (t/d) |
| 16 Nov-02 Dec 2002 | Not significant |
| 03 Dec 2002 | Less than 5,000 (weak signal) |
| 04 Dec 2002 | Data gap - no data over Nyiragongo |
| 05 Dec 2002 | ~6,000 |
| 06 Dec 2002 | Data gap - no data over Nyiragongo |
| 07 Dec 2002 | ~12,000 |
| 08 Dec 2002 | Data gap - no data over Nyiragongo |
| 09 Dec 2002 | Less than 5,000 (weak signal) |
| 10 Dec 2002 | Data gap - no data over Nyiragongo |
| 11 Dec 2002 | Less than 5,000 (very weak signal) |
| 12 Dec 2002 | Data gap - no data over Nyiragongo |
| 13 Dec 2002 | ~11,000 |
Thus the degassing had not risen to peak October-November levels, but increased since early December, either in terms of plume altitude, SO2 concentration, or both. Simon Carn noted that "We are also sometimes seeing discrete SO2 clouds to the W of the volcano, rather than SO2 plumes emerging from the volcano, perhaps suggesting discontinuous degassing."
Tedesco also pointed out that the higher SO2 fluxes accompanied acid rain falling on Goma and surroundings, with some rain samples also containing up to 15 parts per million (ppm) fluorine ion. (For comparison, the U.S. Centers for Disease Control and Prevention recommended a standard in drinking water at 0.7-1.2 ppm, a level that provides a means of preventing tooth decay without compromising public safety.) In December 2002, Goma residents complained about the acid rain, which besides affecting drinking water, put area crops in danger. Accordingly, scientists began collecting rainwater samples with the intent of carrying out regular analyses.
SO2 blew towards the S on 4 and 5 November exposing people on the upper S flanks. Researchers measured gas concentrations in Goma on 20 November at 20 selected points. They found CO2 concentrations of 0-4%, and much lower concentrations of CH4, H2S, and CO. On 4-5 December the wind carried SO2 gas into S-flank settlements. During the December, analysis of fumaroles at Sake, Mupambiro, Bulengo, and Himbi revealed similar concentrations to those seen in earlier visits (including the elevated values at Sake/Birere, which in October 2002 measured 35.1% CO2, and Mupambiro, which on 7 December measured 63.1% CO2). It was expected that the current rainy season favored enhanced CO2 flow from the ground.
Nyiragongo summit geochemical surveys in mid-November found temperature elevations of 1°C (except one summit site with a 5.7°C rise). CO2 concentrations had then risen to 3%. In a fissure called Shaheru, CO2 concentrations stood at 53%. Methane was found at all sites in dilute concentrations, ~0.1 %. H2S was below the limit of detection at all the visited sites.
The human side of January 2002 volcanism and the 24 October earthquake. Aftershocks to the unusually large earthquake of 24 October 2002 continued to be felt in the epicentral area through December. For example, Goma residents felt an M 4 tectonic earthquake with a 13 km focal depth on 13 December.
Field excursions in the reporting period revealed that the 24 October 2002 earthquake and aftershocks damaged towns in the Kitembo and Minova areas (including the towns Lwiro and Nyabibwe). The visits suggested that no lives were lost but about ten houses sustained cracks. Residents there still remained in need of humanitarian assistance, including safe housing, food, and medicine.
The December aftershocks were not reported to have caused significant damage; however, an earlier Reuters news article, published on 24 January 2002, described how about six days after the volcanism ceased in Goma, residents there had "flocked to receive aid" at distribution points, many having then gone about a week without food supplies. The news article went on to say, "the UN aims to distribute about 260 tonnes of food, which it says is enough to feed 70,000 people for a week. Each family-of an assumed seven people on average-will receive 26 kg of highly nutritious supplies including maize meal, beans, vegetable oil, and corn soya blend." The aid groups also distributed clean drinking water. The intensity of the volcanic and earthquake disasters had clearly left residents weakened and with reduced food security.
Previous Bulletin reports have included relatively few photographs of the scene in Goma due to the January 2002 eruption when lava flows overran the city. Figures 23-26, all sent to us by Wafula Mifundi, are intended to help make up for this deficiency. In many cases within Goma intense fires accompanied the lava flows. Several of the photos provided by Wafula captured these fires, including a devastating fire at a fuel depot, which accompanied an explosion that was widely discussed in the news. The photos presented here omit those of the larger fires and instead illustrate other important aspects of the crisis and its aftermath.
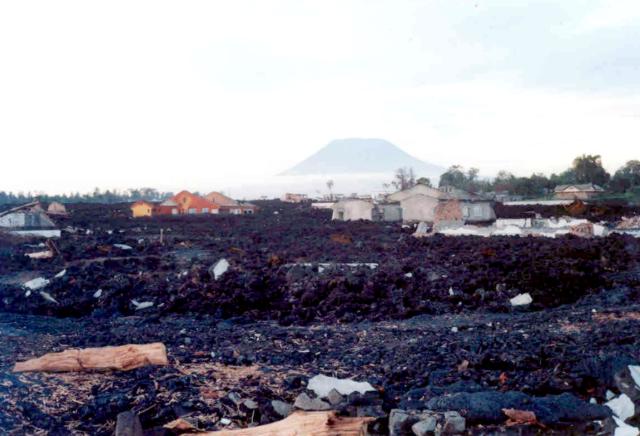 |
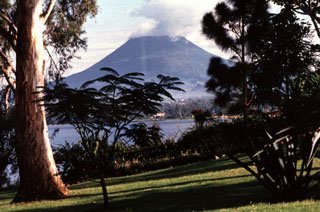
Figure 23. During Nyiragongo's January 2002 eruption lavas transected Goma, a city of about a half-million people. The summit of Nyiragongo lies ~ 20 km to the N. In the foreground, middle-ground, and central background lie destroyed buildings and gardens, and what has now become a field of rubble atop the rapidly cooled, thin lava flows of the January eruption. Note that the rubble contains abundant light-colored building material, such as concrete chunks dispersed from downed buildings. Unburned wood and some leaves may represent unburned portions of trees that came into contact with cooler lava surfaces at temperatures below their kindling point. Leaves and other fallen and wind-blown plant debris may have accumulated later. Date of photo is undisclosed. Courtesy of Wafula. |
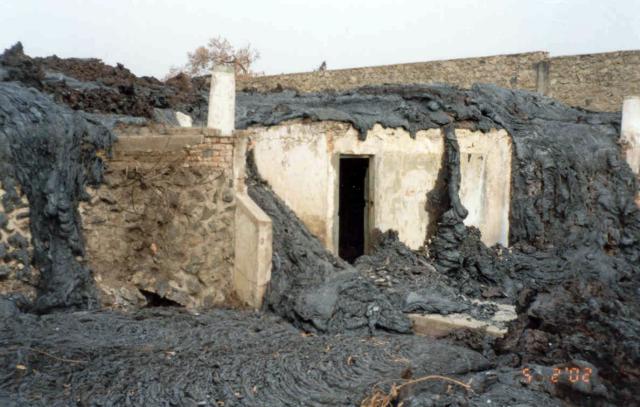 |
Figure 24. Nyiragongo lavas inundated these structures on 17 January 2002. A family took refuge in the lower portion of the building in the center. Trapped there by lava flows, one or more people died, including an infant. Provided courtesy of Wafula. |
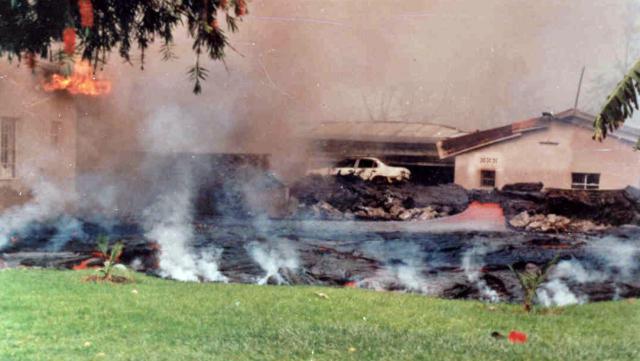 |
Figure 25. This photo shows some of the remarkably thin and mobile lava flows pouring through a narrow chute (behind the car and in line with the left-most opening in the low structure's wall). Below that, the lava spreads and descends across a lawn. Provided courtesy of Wafula. |
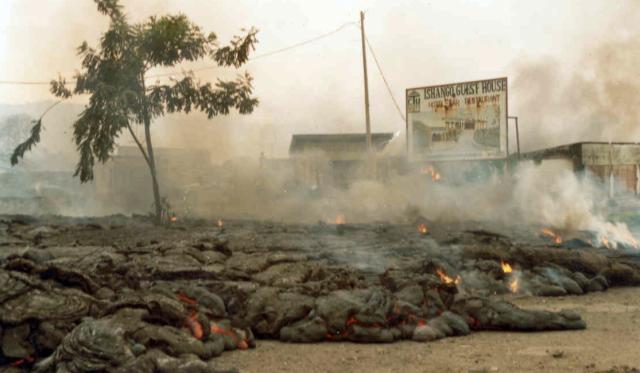 |
Figure 26. Nyiragongo's January 2002 lavas slowly advancing across a road at an intersection. This area of Goma is called Signers rotary point. The sign advertises the Ishango Guest House. Note the lava-immersed but still-standing tree, which at this stage, may have only had substantial burns near the base of its trunk. Provided courtesy of Wafula. |
Seismicity. The late October-early November 2002 earthquakes that were interpreted as magmatic, were relatively deep, at 10-25 km. Most of these earthquakes occurred in an elliptical area, although some struck ten's of kilometers W of Goma beneath the Bay of Sake in Lake Kivu, an area where previous earthquakes have sometimes occurred.
During the first half of November seismicity dropped significantly. It was noted that the operational seismic network then consisted of seven stations (table 8); an eighth station was not functioning. During November tectonic seismicity returned to normal; however, magmatic seismicity continued. In the week ending on the 9th, magmatic seismicity centered on the N side of Nyamuragira, a zone adjacent its recent eruption. In contrast, during this same interval earthquakes were rare at Nyiragongo, although gas escaping the crater remained visible from Goma, certifying ongoing intra-crater activity. During the week ending on the 16th, some earthquakes were centered about Nyiragongo. During the latter half of December most of the region's high-frequency and volcano- tectonic earthquakes were associated with an epicentral zone stretching from the 24 October major earthquake near Kalehe to W of Nyamuragira. Some HF events also occurred in the Nyiragongo vicinity too.
Table 8. Nyiragongo and Nyamuragira earthquakes and tremor recorded at Katale and Rusayo stations during November-December 2002. The Katale station sits on the E flank of Nyamuragira; the Rusayo station, on the SW flank of Nyiragongo. The dates on the left are for weekly intervals, except the last entry, which is for a 2-week interval (a fortnight). In the last entry, the elevated high-frequency earthquake count at Katale station was due to a swarm to N of Nyamuragira on 27-28 December. Courtesy of GVO.
| End of week (or fortnight) | Type A High-Freq | Type C Low-Freq | Total | Tremor - described or minutes with amplitude >= 1 mm |
| Rusayo seismic station | ||||
| 09 Nov 2002 | 86 | 178 | 264 | 5838 |
| 16 Nov 2002 | 78 | 185 | 263 | 3956 |
| 23 Nov 2002 | 79 | 207 | 286 | 1435 |
| 30 Nov 2002 | 33 | 160 | 193 | 2508 |
| 07 Dec 2002 | 42 | 137 | 179 | -- |
| 14 Dec 2002 | 57 | 124 | 181 | -- |
| (28 Dec 2002) | (88) | (270) | (358) | ("Several hours per day") |
| Katale seismic station | ||||
| 09 Nov 2002 | 137 | 231 | 368 | 3998 |
| 16 Nov 2002 | 114 | 328 | 442 | 7713 |
| 23 Nov 2002 | 118 | 356 | 474 | Feeble (1 mm) |
| 30 Nov 2002 | 92 | 239 | 331 | 2248 |
| 07 Dec 2002 | 107 | 348 | 455 | -- |
| 14 Dec 2002 | 120 | 169 | 289 | -- |
| (28 Dec 2002) | (253) | (513) | (766) | ("Several hours per day") Type A swarm to N of Nyamuragira |
The seismic reference stations Katale and Rusayo both registered sub-continuous volcanic tremor during much of the reporting interval (table 8). Rusayo station's tremor was attributed primarily to Nyiragongo, and except for one week in November, it registered the larger share of tremor.
During the week ending 23 November seismicity stayed about the same and tremor dropped considerably, particularly at neighboring volcano Nyamuragira where it was described as feeble (table 8). Banded tremor registered 29 November at the stations of Kunene, Rusayo, Bulengo, Kibumba, and Katale (during 0630-0745 UTC), with the highest amplitude at Katale station, implying Nyamuragira as their source, plausibly a reactivation associated with the 24 October earthquake. Many epicenters also concentrated in the vicinity of that neighboring volcano. On the other hand, epicenters for long-period earthquakes appeared to come from Nyiragongo. The epicenters were determined to a margin of error of ± 2 km.
Geological Summary. The Nyiragongo stratovolcano contained a lava lake in its deep summit crater that was active for half a century before draining catastrophically through its outer flanks in 1977. The steep slopes contrast to the low profile of its neighboring shield volcano, Nyamuragira. Benches in the steep-walled, 1.2-km-wide summit crater mark levels of former lava lakes, which have been observed since the late-19th century. Two older stratovolcanoes, Baruta and Shaheru, are partially overlapped by Nyiragongo on the north and south. About 100 cones are located primarily along radial fissures south of Shaheru, east of the summit, and along a NE-SW zone extending as far as Lake Kivu. Many cones are buried by voluminous lava flows that extend long distances down the flanks, which is characterized by the eruption of foiditic rocks. The extremely fluid 1977 lava flows caused many fatalities, as did lava flows that inundated portions of the major city of Goma in January 2002.
Information Contacts: Kasereka Mahinda, Kavotha Kalendi Sadaka, Celestin Kasereka, Jean-Pierre Bajope, Mathieu Yalire, Arnaud Lemarchand, Jean-Christophe Komorowski, and Paolo Papale, Goma Volcano Observatory (GVO), Departement de Geophysique, Centre de Recherche en Sciences Naturelles, Lwiro, D.S. Bukavu, DR Congo; Dario Tedesco, Environmental Sciences Department, Via Vivaldi 43, 81100 Caserta, Italy; Jacques Durieux, Groupe d'Etude des Volcans Actifs (GEVA), 6, Rue des Razes 69320 Feyzin, France; Simon Carn, TOMS Volcanic Emissions Group, Joint Center for Earth Systems Technology (NASA/UMBC), University of Maryland Baltimore County, 1000 Hilltop Circle, Baltimore, MD 21250 USA (URL: https://so2.gsfc.nasa.gov/); Reuters News Service; BBC News (URL: http://news.bbc.co.uk/).