Report on Long Valley (United States) — May 2004
Bulletin of the Global Volcanism Network, vol. 29, no. 5 (May 2004)
Managing Editor: Richard Wunderman.
Long Valley (United States) Summary of report noting nearly 5 years of relative quiescence
Please cite this report as:
Global Volcanism Program, 2004. Report on Long Valley (United States) (Wunderman, R., ed.). Bulletin of the Global Volcanism Network, 29:5. Smithsonian Institution. https://doi.org/10.5479/si.GVP.BGVN200405-323822
Long Valley
United States
37.7°N, 118.87°W; summit elev. 3390 m
All times are local (unless otherwise noted)
The following is a summary of Hill (2004) and Sorey, Hill, and McConnell (2000), reports that collectively concluded that with the close of 2003, Long Valley Caldera had sustained nearly five years of relative quiescence. This marked the longest such interval since the onset of unrest in 1978. A summary of 2001-2002 activity was published in March 2003 (BGVN 28:03).
The slow inflation of the resurgent dome at a rate of ~ 1 cm/year that persisted through most of 2002 leveled off in early 2003 with essentially no change through the end of the year. At the end of 2003, the center of the resurgent dome stood only about 0.5 cm higher than in early 1999. It remained roughly 80 cm higher than in the late 1970s.
Seismic activity within the caldera remained low through 2003 as it has for the previous four years, averaging fewer than five earthquakes per day large enough to be located by the realtime computer system (M 0.5 and above). As in the past, most of these earthquakes were confined to the S moat and the S margin of the resurgent dome. The largest intra-caldera earthquake during the year was a M 2.4 event on 19 September 2003 at 0751, associated with a cluster of smaller events in the S moat beneath the E margin of Mammoth Lakes. An earthquake sequence of comparable intensity was centered beneath the SE margin of the resurgent dome on 8 November. This sequence included three M > 2 earthquakes, the largest of which was a M 2.2 earthquake at 2102.
Most of the earthquake activity in the Sierra Nevada block S of the caldera continued to be concentrated in the N-NE lineation of epicenters that represents the aftershock zone of the three M > 5 earthquakes of June and July 1998 and May 1999 (figure 29). A notable exception was the M 4.0 earthquake of 8 March (0735) that was located 1 km S of Laurel Mountain (~5 km S of the caldera boundary and 11 km ESE of Mammoth Lakes). This earthquake was felt in the Mammoth Lakes area and was accompanied by over 50 smaller earthquakes, the largest of which was a M 3.2 event. The Grinnell Lake area near the S end of the seismicity lineation in the Sierra Nevada was one of the more persistently active areas through the year. It produced M 3.2 earthquakes on 15 June and 18 August as well as a host of smaller earthquakes.
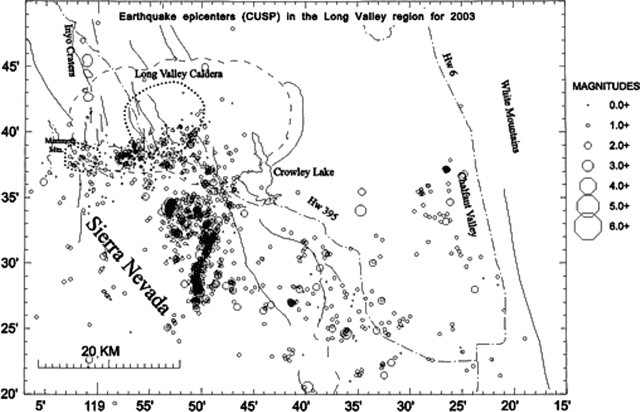 |
Figure 29. Earthquake epicenters in the Long Valley region for 2003 (from Hill, 2003). |
Occasional M 3 earthquakes elsewhere in the region included: a M 3.2 earthquake on 23 January 3 km E of Red Slate Mountain (midway along the seismicity lineation in figure 29), a M 3.0 earthquake on 18 March located beneath the Volcanic Tableland 10 km E of Crowley Lake, a M 3.1 earthquake on 31 August located 2 km E of Lake Dorothy in the Sierra Nevada, a M 3.0 earthquake on 26 October located 20 km W of Bishop, and a M 3.5 earthquake on November 10 in Round Valley. Altogether, ten earthquakes of M 3 or greater occurred in the area during 2003, the largest being the M 4.0 event on 8 March near Laurel Mountain. The mid-crustal (10- to 25-km-deep) long period (LP) volcanic earthquakes, which began during the 1989 Mammoth Mountain earthquake swarm, continued beneath the SW margin of Mammoth Mountain but at a much-reduced rate with respect to the activity levels during the first half of 1997. LP activity for 2003 was limited to the first and last quarters of the year with no LP earthquakes detected from April through September.
The carbon dioxide (CO2) emissions from the tree-kill areas around the flanks of Mammoth Mountain remained similar over the last several years. In particular, data from the CO2 sensors at Horseshoe Lake were relatively flat and uneventful for 2003 except for the normal winter excursions due to snow accumulation. A soil CO2 efflux survey of Horseshoe Lake in August gave an emission rate of 135 tons/day, which is slightly higher than the rate for 2002. However, the emission rate trend from 1995 through 2003 based on linear regression was relatively flat at ~100 tons/day, suggesting continued CO2 emissions. The Horseshoe Lake tree-kill area produces roughly one third of the total CO2 flux from the flanks of Mammoth Mountain.
Intra-caldera sites contained dead vegetation, elevated soil temperatures, and CO2 concentrations consistent with ongoing geothermal activity. The areas that produced the greatest CO2 emissions were in the vicinity of the geothermal plant and have been known for some time. Initially the formation of these areas likely occurred as a result of superficial changes linked to increases in geothermal fluid production in the late 1980s and early 1990s. Some recently identified sites displayed elevated soil temperatures on the resurgent dome above Fumarole Canyon; these may reflect a delayed response to the 1997 earthquake swarm activity in the area. Total CO2 emissions at these sites are marginally above background levels.
Hydrologic monitoring data show that declining fluid pressures in key monitoring wells over the past several years continued through 2003. Fluid pressures in four of five key monitoring wells during 2003 were at the lowest values since 1995 and for three of these wells the pressures were the lowest since the late 1980s. The data also show a sharp decline in thermal-water discharge from springs in Hot Creek Gorge, an event that began in August 2003 and persisted to the end of 2003. The decline in discharge was ~18% of the long-term mean discharge.
The decline in thermal-water discharge from Hot Creek Gorge springs was consistent with the low fluid pressures recorded in wells CW3 and CH10B, both of which tapped the S-moat hydrothermal system. The reason for this decline was unclear. Geothermal production from the Casa Diablo power plant has not changed significantly over the past year and the caldera has shown no significant unrest.
New instrumentation and an interdisciplinary workshop. During the week of 2 August 2003, a team of scientists and drilling experts from the oil industry successfully installed a 30-m-long geophysical instrument string at a depth ~2.4 km in the Long Valley Exploratory Well (LVEW). The instrument string includes two three-component seismometers (4 Hz natural frequency, one at 2592 m and the other at 2264 m depths), a dilatometer (at 2254 m depth), a 48-m-long vertical-axis optical-fiber strainmeter (centered at 2150 m depth), and pass-through tubes designed to track pore pressure in the open hole beneath the instrument package. As signals from the remaining components of the LVEW deep borehole observatory come on line over the next few months, they will greatly enhance the power of the LVO network as both a monitoring and research tool.
Instrumentation of LVEW as a deep-borehole observatory represents the final stage of a major drilling project that began in the mid-1980s with multi-agency support (Sorey and others, 2000).
A four-day workshop was held 8-12 October 2003. The title was "Understanding a Large Silicic Volcanic System: An Interdisciplinary Workshop on Volcanic Process in Long Valley Caldera-Mono Craters."
References.Hill, D.P., 2003, Long Valley Observatory quarterly report October-December 2003 and annual summary for 2003: Long Valley Observatory, U.S. Geological Survey, Menlo Park, CA (URL: http://lvo.wr.usgs.gov/Quarterly/qrt_rpt_4-03.htm).
Sorey, M.L., Hill, D.P., and McConnell, V.S., 2000, Scientific drilling in Long Valley Caldera, California—an update, in California Geology, California Geological Survey, v. 53, pp. 4-11, URL: http://www.consrv.ca.gov/cgs/information/publications/california_geology_magazine.htm.
Geological Summary. The large 17 x 32 km Long Valley caldera east of the central Sierra Nevada Range formed as a result of the voluminous Bishop Tuff eruption about 760,000 years ago. Resurgent doming in the central part of the caldera occurred shortly afterwards, followed by rhyolitic eruptions from the caldera moat and the eruption of rhyodacite from outer ring fracture vents, ending about 50,000 years ago. During early resurgent doming the caldera was filled with a large lake that left strandlines on the caldera walls and the resurgent dome island; the lake eventually drained through the Owens River Gorge. The caldera remains thermally active, with many hot springs and fumaroles, and has had significant deformation, seismicity, and other unrest in recent years. The late-Pleistocene to Holocene Inyo Craters cut the NW topographic rim of the caldera, and along with Mammoth Mountain on the SW topographic rim, are west of the structural caldera and are chemically and tectonically distinct from the Long Valley magmatic system.
Information Contacts: David Hill, Long Valley Observatory, Volcano Hazards Program, U.S. Geological Survey, 345 Middlefield Rd., MS 977, Menlo Park, CA 94025, USA (URL: https://volcanoes.usgs.gov/observatories/calvo/); Deborah Bergfeld, Jim Howle, Chris Farrar, and William Evans, U. S. Geological Survey, Menlo Park, and Carnelian Bay, CA.