Report on Asamayama (Japan) — August 2004
Bulletin of the Global Volcanism Network, vol. 29, no. 8 (August 2004)
Managing Editor: Richard Wunderman.
Asamayama (Japan) Eruption on 1 September causes an elongate ashfall deposit
Please cite this report as:
Global Volcanism Program, 2004. Report on Asamayama (Japan) (Wunderman, R., ed.). Bulletin of the Global Volcanism Network, 29:8. Smithsonian Institution. https://doi.org/10.5479/si.GVP.BGVN200408-283110
Asamayama
Japan
36.406°N, 138.523°E; summit elev. 2568 m
All times are local (unless otherwise noted)
An explosive eruption occurred from the summit crater of Asama at 2002 on 1 September 2004. Most of the initial reporting was in Japanese, although many of those reports had segments in English. Setsuya Nakada and Yukio Hayakawa provided links to initially available reports. According to the Geological Survey of Japan's website (managed by N. Geshi) and an article there summarizing contributions from many organizations and authors, the 1 September eruption was a single Vulcanian explosion.
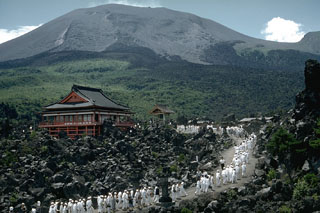
According to the preliminary report of JMA, red-hot blocks spread several kilometers from the summit and caused many wildfires. Video images showed an extraordinary amount of incandescence at height, as well as bright zones on the ground surface. Some of the burns remained limited to the area of contact between the hot bombs and alpine vegetation.
On 3 September Yukio Hayakawa (Gunma University) visited parts of Asama's upland areas where wildfires had occurred (figure 16). There he found bombs up to a meter in diameter. Because of their greater size, the larger bombs cooled more slowly and had the greatest thermal impact. At least one large bomb had cracked and fragmented on impact, delivering relatively hot material over a wide area. This process accounted for the largest burned area he inspected. Hayakawa photographed an impressive impact crater associated with a large volcanic bomb from the 1 September eruption (figure 17). Along the impact crater's rim, the network of low-lying alpine vegetation was torn loose and lay folded back and upside-down.
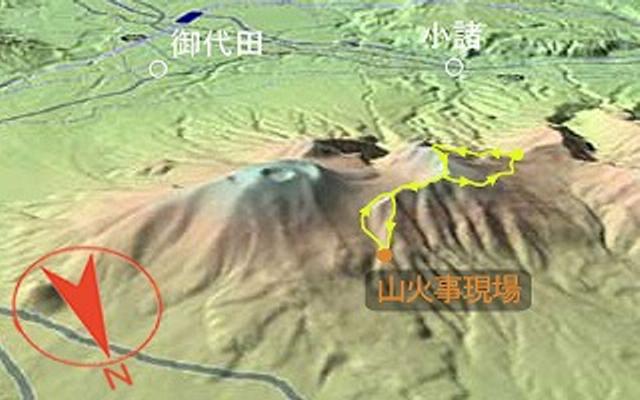 |
Figure 16. An image depicting Asama's topography with the route hiked (yellow) to investigate the eruption-induced wildfires (orange dot is the fire site investigated, at ~2,000 m elevation). Two urban areas indicated in Japanese on the map are Miyota town and Komoro city (white circles on left and right, respectively); the two sit ~7 km apart. Courtesy of Yukio Hayakawa, Gunma University. |
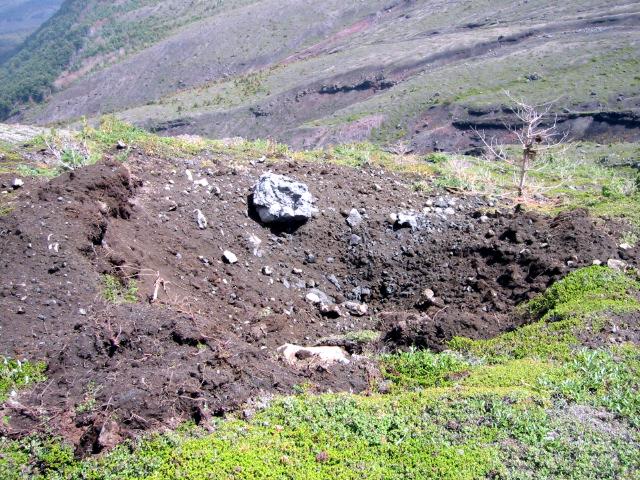 |
Figure 17. A fresh impact crater formed by a large bomb from the 1 September 2004 Asama eruption. Crater diameter at the plane of the undisturbed land surface was ~6 m, crater depth was ~1 m, and the rim of disturbed material stood up to ~0.5 m high. The impactor is visible at the NW wall of the crater (~0.8 m). Courtesy of Yukio Hayakawa, Gunma University. |
After the eruption, a helicopter flight around the volcano also confirmed that many ballistic blocks had landed on the volcano's upper flanks (figure 18). Asia Air Survey (Ltd.) also compiled a comprehensive set of post-eruption aerial stereophotos of Asama and surroundings. Ones taken of the crater on 3 September showed the principal crater immersed in a circular bank of dense white volcanic gases. A thin white plume blew NE. Impact scars were also visible on these photos, scattered over the upper flanks.
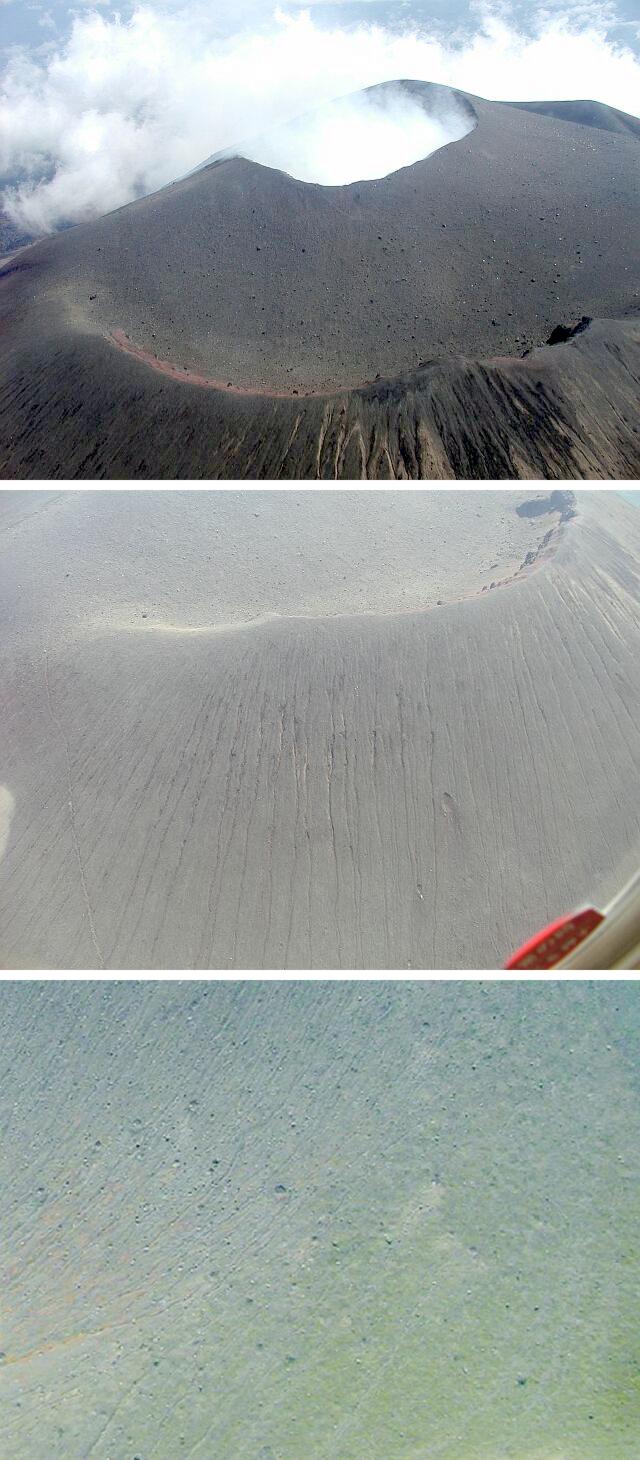 |
Figure 18. The Asama summit crater as seen in a series of shots taken from a helicopter two days after the 1 September 2004 eruption: (top) The main crater engulfed in white fumes with a thin plume blowing NE; (center) a closer view of the outer W flank and adjacent moat area, ~1 km from the crater; (bottom) a still closer view depicting a conspicuously cratered surface on the summit's NW flank. The center photo also shows two big craters in the center right; a trail following the outer crater rim is largely tephra covered but segments remain recognizable. Courtesy of the Geological Survey of Japan (captions and photos by H. Hoshizumi, GSJ). |
Tephra sampling and distribution. Strong winds blew the eruption cloud NE. Ashfall occurred ~250 km from the volcano and reached to the Pacific Ocean (with ash reported at the coastal locations of Soma and Haranomachi cities in Fukushima Prefecture). The ash-fall deposit covered a narrow and elongated area, forming a classic cigar-shaped pattern. Field work was begun to establish the mass and distribution of the tephra blanket (figure 19). The Earthquake Research Institute (ERI) noted that 5-cm-diameter cinders appeared up to ~5 km from the crater. In some cases rainfall occurred during or after the ashfall; in some cases it washed away fine-grained portions of the ash-fall deposit. In preliminary ERI and Geological Survey of Japan (GSJ) reports and personal communication, workers calculated tentative estimates of eruptive products on the order of 40,000-230,000 metric tons. The initial estimate by Hayakawa was 200,000 metric tons.
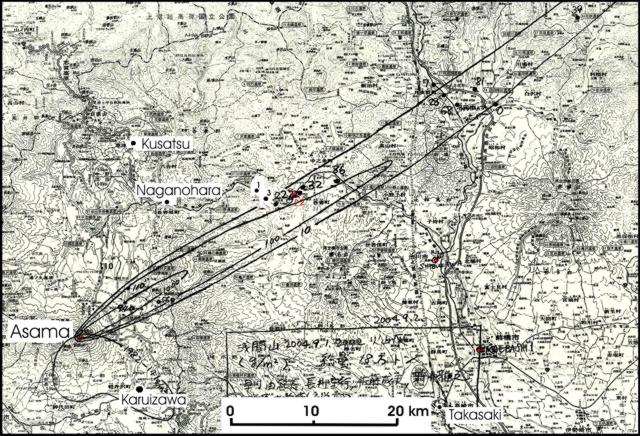 |
Figure 19. One preliminary (working) map of Asama's 1 September 2004 tephra mass (out to ~70 km from the source) showing data points used to constrain the isomass contours (in units of grams per meter squared). For comparison, one S- to SE-directed isomass contour (141 g/m2) was also included from a 1982 eruption. The base map is in Japanese but English names have been added to selected urban areas. Courtesy of Yukio Hayakawa, Gunma University. |
Geophysical and geochemical observations. Investigators at ERI Tokyo plotted the time-series of deformation recorded by four 3-component GPS stations within a few kilometers of the summit over January to early September 2004. Of these, only one station, ASM4, ~4 km S of the summit, showed any clear and consistent variation. Its changes were only clear in one component: it moved to the S on the order of 5-10 mm, motion that became most apparent after June 2004 (figure 20). Other groups also maintained GPS (and tilt?) stations on Asama and may have seen more diagnostic ground displacement associated with the eruption.
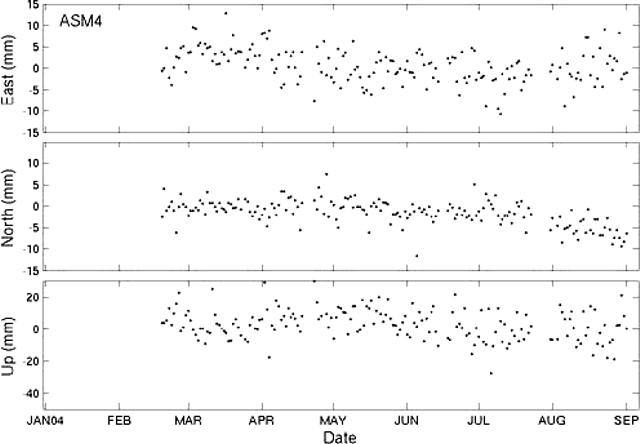 |
Figure 20. Time-series deformation of Asama recorded at GPS station ASM4, January-September 2004. The three orthogonal components are shown as follows: Upper row is in the E-W direction, middle row is in the N-S direction, and bottom row is in the up-down direction. The GPS reference frame was ITRF2000. These data were posted on the web on 6 September 2004 by the Volcano Research Center, University of Tokyo. |
ERI briefly discussed seismic signals received at the station for Asama, which arrived at about 2002 on 1 September 2004. The first extensive seismic signal was of elevated amplitude and persisted for about a minute. Another plot suggested that the entire set of 1 September eruptive signals spanned about 30 minutes. SO2 measurements used the differential optical absorption spectrometer (DOAS) technique. Ground-based traverses on 3 September measured an average of 1,475 metric tons/day, with respective measured lows and highs of 1,168 and 1,738 tons/day.
Satellite data. The TOMS Volcanic Emissions Group used the Atmospheric Infrared Sounder (AIRS) to detect emissions from Asama's 1 September eruption. AIRS is a hyperspectral imager on the EOS/Aqua satellite. It provides higher spatial resolution than TOMS, and as an infrared sensor it produces nighttime images of volcanic clouds. AIRS volcanic cloud studies are a collaborative effort between the TOMS group and the Atmospheric Spectroscopy Laboratory in the Department of Physics at UMBC.
A sub-circular cloud was associated with the eruption on 1 September (figure 21). When detected at 1554 UTC the cloud was well out over the Pacific Ocean, ~640 km from Asama. Travel time for the cloud was 4 hours and 52 minutes, which implies a (straight line) mean velocity for the cloud's center of ~130 km/hour. Even though there was no quantitative estimate of aerosol and gas, there was a strong volcanic signal. The AIRS image is presented as a bias difference (in Kelvin, K; the scale at the right). The larger the bias difference, the stronger the volcanic signal. In this case, a significant area reached a difference of over 10 K.
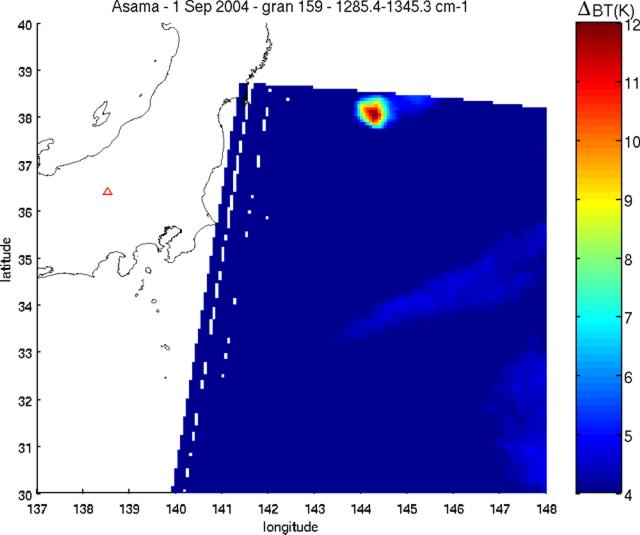 |
Figure 21. Asama's 1 September 2004 eruption generated a cloud that persisted and was imaged ~640 km ENE. The local time of this image was 0054 on 2 September (1554 UTC 1 September). Courtesy of Simon Carn and L. Larrabee Strow, UMBC. |
Geological Summary. Asamayama, Honshu's most active volcano, overlooks the resort town of Karuizawa, 140 km NW of Tokyo. The volcano is located at the junction of the Izu-Marianas and NE Japan volcanic arcs. The modern Maekake cone forms the summit and is situated east of the remnant of an older andesitic volcano, Kurofuyama, which was destroyed by a late-Pleistocene landslide about 20,000 years before present (BP). Growth of a dacitic shield volcano was accompanied by pumiceous pyroclastic flows, the largest of which occurred about 14,000-11,000 BP, and by growth of the Ko-Asamayama lava dome on the east flank. Maekake, capped by the Kamayama pyroclastic cone that forms the present summit, is probably only a few thousand years old and has observed activity dating back at least to the 11th century CE. Maekake has had several major Plinian eruptions, the last two of which occurred in 1108 (Asamayama's largest Holocene eruption) and 1783 CE.
Information Contacts: Geological Survey of Japan, National Institute of Advanced Industrial Science and Technology (GSJ AIST) (URL: http://www.aist.go.jp/); Yukio Hayakawa, Faculty of Education, Gunma University, Aramaki 4-2, Maebashi Gunma 371-8510, Japan (URL: http://www.hayakawayukio.jp/English.html); Setsuya Nakada, Volcano Research Center, Earthquake Research Institute (ERI), University of Tokyo, Yayoi 1-1-1, Bunkyo-ku, Tokyo 113, Japan (URL: http://www.eri.u-tokyo.ac.jp/VRC/index_E.html); Simon Carn, TOMS Volcanic Emissions Group, University of Maryland, 1000 Hilltop Circle, Baltimore, MD 21250, USA (URL: https://so2.gsfc.nasa.gov/); L. Larrabee Strow, Atmospheric Spectroscopy Laboratory, Physics Department, 1000 Hilltop Circle, Baltimore, MD 21250, USA (URL: http://asl.umbc.edu/).