Report on Long Valley (United States) — June 2006
Bulletin of the Global Volcanism Network, vol. 31, no. 6 (June 2006)
Managing Editor: Richard Wunderman.
Long Valley (United States) Three ski patrol members die in April 2006 at fumarole-derived snow cave
Please cite this report as:
Global Volcanism Program, 2006. Report on Long Valley (United States) (Wunderman, R., ed.). Bulletin of the Global Volcanism Network, 31:6. Smithsonian Institution. https://doi.org/10.5479/si.GVP.BGVN200606-323822
Long Valley
United States
37.7°N, 118.87°W; summit elev. 3390 m
All times are local (unless otherwise noted)
During May 2005 to June 2006, Long Valley caldera was relatively quiet with hazard status remaining at green, the lowest level. During this time, there were two to three small, shallow earthquakes daily; these rarely reached a maximum of M 3 (figure 31). The earthquakes primarily occurred in the Sierra Nevada, an area S of the caldera, S of Mammoth lakes, and W of Tom's Place. The earthquakes were shallow, with focal depths less than 4 km. Deformation was slight. According to geodetic data from June 2006, the largest range of variability was ~ 13 mm, at Hot Creek.
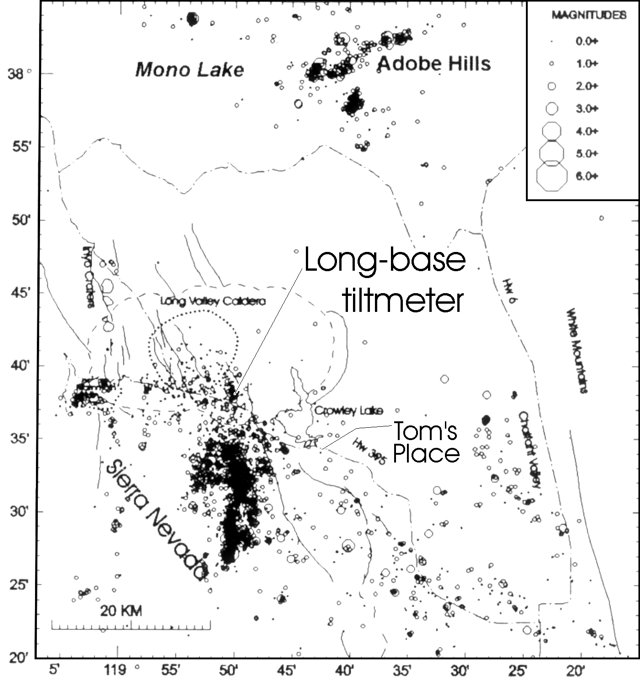 |
Figure 31. A map of epicenters during 2005 in the area of Long Valley caldera. Courtesy of the Long Valley Observatory (LVO) (combined July-December 2005 and annual summary for 2005 report). |
During the second half of 2005, long-baseline tilt measurements revealed little N-S shift. In contrast, there was considerable E-W shift, with a fluctuation from -1.5 µrad around July up to 1.5 µrad in December (figures 32 and 33). The instrument responsible for these measurements, the long-baseline tiltmeter, measures levels in fluid reservoirs separated by ~ 500 m and connected by buried pipes. It records tidal tilts and shows minimal response to diurnal temperature changes along with little secular drift.
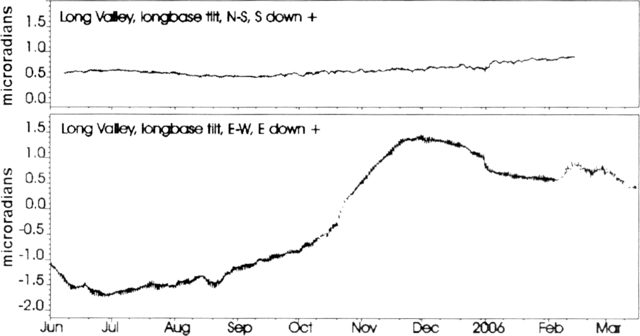 |
Figure 32. A plot showing the E-W and N-S components of float data from the long-base tiltmeter for 1 June 2005-12 March 2006. Courtesy of LVO. |
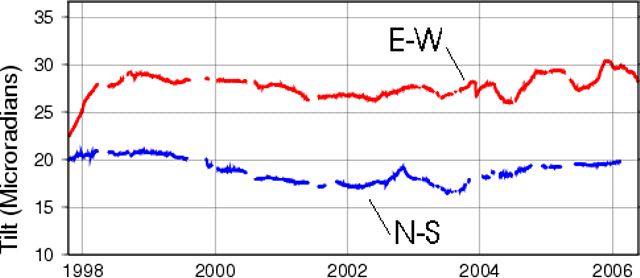 |
Figure 33. A plot of long-base E-W tilt and N-S tilt versus time from 16 October 1997 to 25 May 2006. Courtesy of LVO. |
The caldera's CO2 flux rate was closely monitored, in some cases hourly. CO2 levels have been high since 1996, and the effects have included the killing of thousands of trees (figures 34 and 35). At Horseshoe Lake the tree-kill area underwent CO2 discharge rate of 50-150 tons per day.
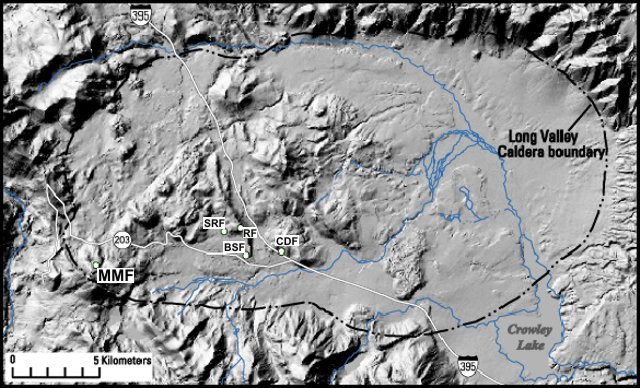 |
Figure 34. Map of the Long Valley Caldera with fumaroles indicated. The fumarole involved in the ski patrol tragedy, discussed below, is identified as MMF (for Mammoth Mountain fumarole). Courtesy of LVO. |
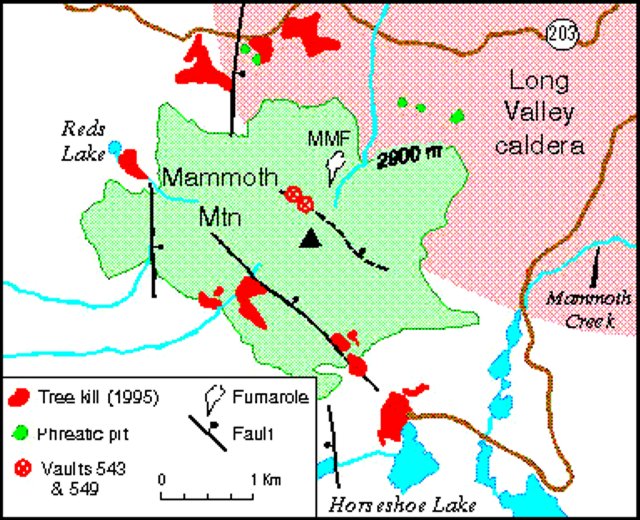 |
Figure 35. Map of the Mammoth Mountain complex showing both fumaroles and tree-kill areas. Courtesy of LVO. |
Ski-area accident. On 6 April 2006, three ski-patrol officers died when they fell into a 6.4-m-deep hollow, a snow cave, at the Mammoth Mountain ski resort (figure 36). The accident occurred "on Christmas Bowl run, E of Chair 3" explained Mammoth Mountain chief executive officer Rusty Gregory. Geophysicist Dave Hill, from Long Valley Observatory, noted that "the fumarole is roughly 200 m left (looking uphill) of the midpoint along the Chair 3 lift," and "one gets a whiff of H2S when riding on the chair lift if the wind is right" (figure 36).
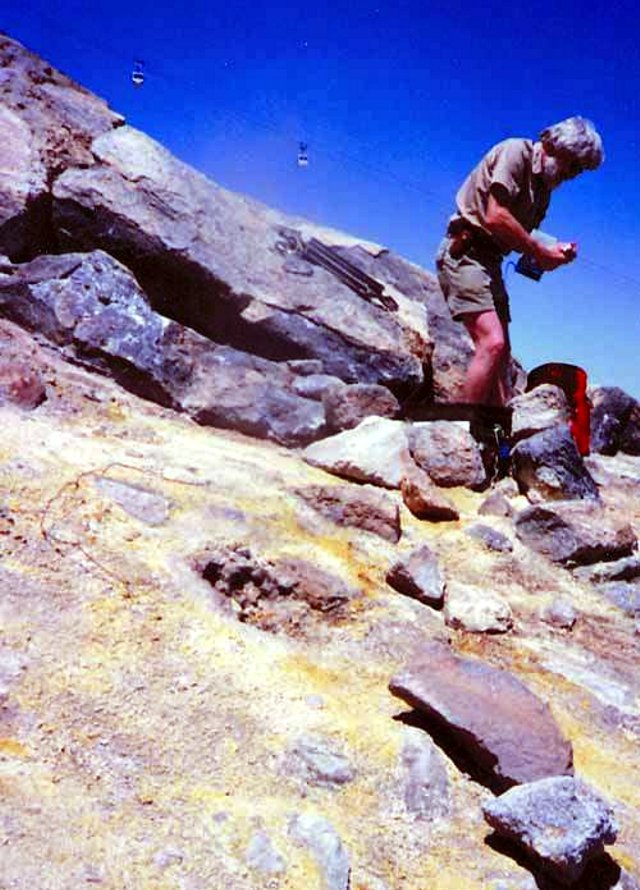 |
Figure 36. Mammoth Mountain fumarole (MMF) as seen during the summer with Chair lift 3 in the background. Vent temperature is measured each hour and recorded on an electronic data logger. Gas chemistry and the isotopic composition of the water have been determined on several occasions. The rationale behind monitoring vent-gas temperatures at MMF is that they may reflect changes in the volcanic system. (MMF is located at 36.38°N, 119.01°W, 3,000 m elevation). Courtesy of LVO. |
Hill further said, "the accident was more weather related than due to any changes in the fumarole. The exceptionally heavy spring snow fall completely covered over the vent, so that the ~ 85°C gases melted a snow cave above the vent (normally the heat from the vent keeps pace with the snow-fall so that the vent is marked by an open hole in the snow several meters in diameter). With no clear sign of the vent at surface, the ski patrol guys evidently didn't realize that, as they were attempting to re-set the fencing around the vent, they were standing directly over the cavity melted by the hot gas. When the roof gave way . . . [they fell] into an atmosphere that was very likely over 90% CO2. " A third ski-patroller died trying to rescue them.
It was reported by Brendon Riley of the Tahoe Daily Tribune that seven other ski patrollers in a rescue party were injured due to the inhalation of dangerous gases from the fumarole. All were recovering.
At an undisclosed date after the accident, Mitch Weber, took pictures of the fenced-off hollow (figure 37). Weber posted these and a narrative regarding the incident in the online magazine he produces, Telemarktips.com, as part of a memorial to the victims.
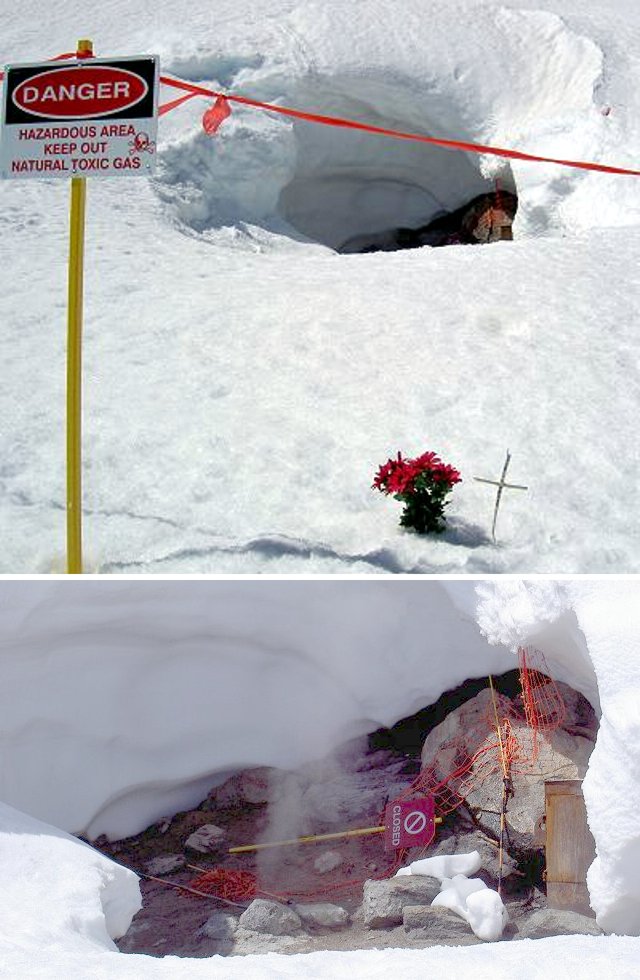 |
Figure 37. Photos of the fenced off accident site at Mammoth Mountain ski area adjacent to Long Valley caldera (date unknown). A photo of the lower portion of the hollow (bottom) indicates that at that time the lower walls were steep and the floor was rock. Courtesy of Mitch Weber. |
Hill explained that the LVO's follow-up action, "has been to collect another series of gas samples from the fumarole, which show no change from earlier measurements." Hill also noted that "the ski area has taken steps to fence off a much wider area around the fumarole than before the accident."
The temperatures of all the fumaroles in Long Valley caldera are monitored (figure 38). Although this plot ends in 2005, Hill indicated that the data suggested normal conditions at the fumarole (MMF) at the time of the accident.
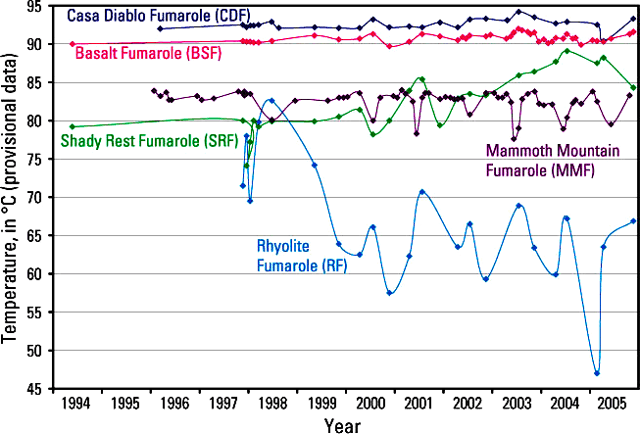 |
Figure 38. Long Valley fumarole temperatures shown from 1994 to 2005. Courtesy of LVO. |
Long Valley Observatory posts hazard status as a color code in one of four categories: green, yellow, orange, and red (the most serious response). Details of their response plan appear on the USGS-Long Valley website and in a 2002 publication (USGS, 2002).
Reference. U.S. Geological Survey, 2002, USGS Response Plan for Volcanic Hazards in the Long Valley Caldera and Mono Craters Region, California: U.S. Geological Survey.
Geological Summary. The large 17 x 32 km Long Valley caldera east of the central Sierra Nevada Range formed as a result of the voluminous Bishop Tuff eruption about 760,000 years ago. Resurgent doming in the central part of the caldera occurred shortly afterwards, followed by rhyolitic eruptions from the caldera moat and the eruption of rhyodacite from outer ring fracture vents, ending about 50,000 years ago. During early resurgent doming the caldera was filled with a large lake that left strandlines on the caldera walls and the resurgent dome island; the lake eventually drained through the Owens River Gorge. The caldera remains thermally active, with many hot springs and fumaroles, and has had significant deformation, seismicity, and other unrest in recent years. The late-Pleistocene to Holocene Inyo Craters cut the NW topographic rim of the caldera, and along with Mammoth Mountain on the SW topographic rim, are west of the structural caldera and are chemically and tectonically distinct from the Long Valley magmatic system.
Information Contacts: David Hill, Long Valley Observatory, U.S. Geological Survey, 345 Middlefield Rd., MS 977, Menlo Park, CA 94025, USA (URL: https://volcanoes.usgs.gov/observatories/calvo/); Mammoth Local (URL: http://www.mammothlocal.com/); Tahoe Daily Tribune (URL: http://www.tahoedailytribune.com); Mitch Weber, c/o Telemarktips.com, 3 San Bittern Lane, Aliso Viejo, CA 92656, USA.