Report on Tungurahua (Ecuador) — July 2006
Bulletin of the Global Volcanism Network, vol. 31, no. 7 (July 2006)
Managing Editor: Richard Wunderman.
Tungurahua (Ecuador) 14-15 July 2006 eruption, the strongest since onset of eruption in 1999
Please cite this report as:
Global Volcanism Program, 2006. Report on Tungurahua (Ecuador) (Wunderman, R., ed.). Bulletin of the Global Volcanism Network, 31:7. Smithsonian Institution. https://doi.org/10.5479/si.GVP.BGVN200607-352080
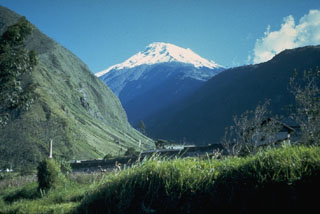
Tungurahua
Ecuador
1.467°S, 78.442°W; summit elev. 5023 m
All times are local (unless otherwise noted)
This report discusses Tungurahua's behavior during August 2005 through the end of July 2006. Material presented here was chiefly gleaned from a series of special reports issued in Spanish by the Instituto Geofísico of the Escuela Politécnica Nacional (IGEPN, hereafter IG). Daily reports for mid-2005 through early 2006 were dominated by descriptions of small plumes and minor ashfall; the reports also noted occasional small rain-generated lahars. For the most part 2005 was the quietest year since eruptions began in 1999, leading residents and volcanologists to ponder if emissions were terminating. This report omits much discussion of evacuations and hazard-status postings. Large eruptions with a Volcanic Explosivity Index (VEI) of 3 that continued into at least late August 2006 will be the subject of the next Bulletin report.
During late December 2005 seismometers detected sudden clusters of tremor and earthquakes. Intervals of quiet were broken by the arrival of signals with energy over a broad frequency range (figures 26 and 27). These signals and later manifestations at the surface in late March-early April were thought to be related to a new injection of magma. As a consequence, IG began to produce a series of special reports (table 10). Beginning in February 2006 and particularly during May-June 2006, the volcano was the scene of particularly significant events, including the largest detonations heard and seen since eruptions renewed in 1999. Other observations included a shift in eruptive style, and generation of some pyroclastic flows during the 14 July (VEI 2) eruption. Notable also were constant "roars" and vibrations of such strength and duration that they keep residents awake at night and caused some to voluntarily evacuate.
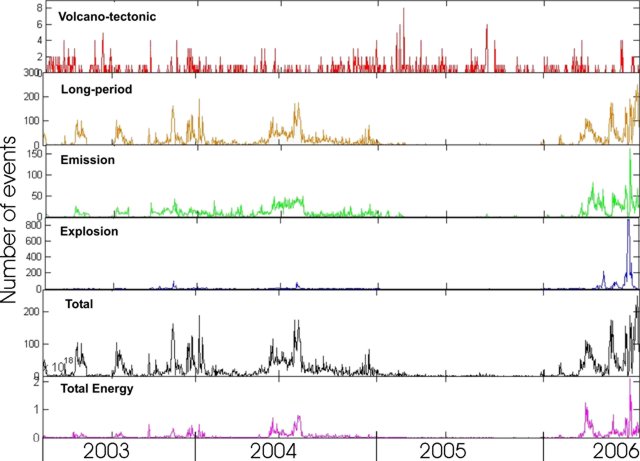 |
Figure 26. Plots showing daily tallies of Tungurahua's seismicity-volcano-tectonic, long-period, emission, explosion, total number of earthquakes, and total energy release-from 1 January 2003 to end of July 2006. Courtesy of IG. |
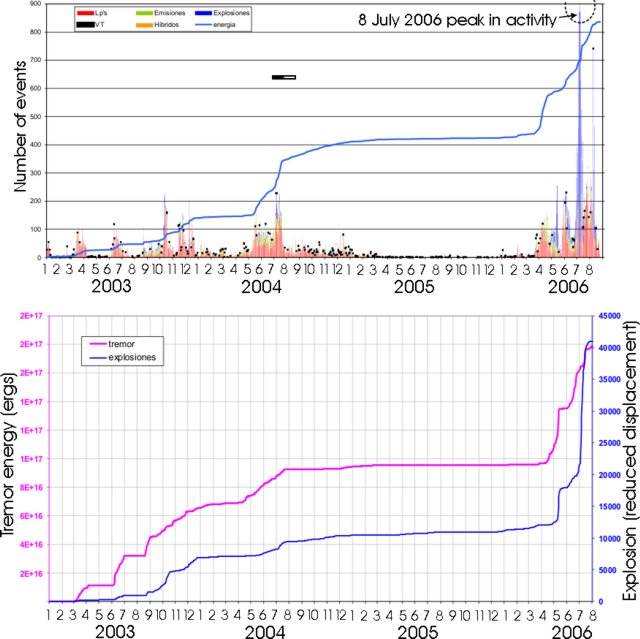 |
Figure 27. (Top) Summary of seismicity recorded at Tungurahua's station RETU during 1 January and into August 2006 (slightly different end points for two plots). Numbers of events appears on left-hand scale; RSAM (line), in appropriate units, on right-hand scale (peak value is ~ 9 x 10¹⁹). (Bottom) Total energy liberated from volcanic tremor and explosions during January 2003 to 1 August 2006. The left-hand scale applies to tremor; the right-hand scale, explosions (reduced displacement). The sharp ascents formed by the "failed eruption" in mid May and the 14 July event are the largest increases since the activity's onset in 1999. Note the pronounced rise in reduced displacement from explosions in months 5-8 (May to August) 2006. Courtesy of IG. |
Table 10. A summary of special reports on Tungurahua issued by the IG during 2006 (reports numbered 1-8; See IG web page-Informes Especiales-Volcanicos).
| Date | Special Report | Key observation(s) |
| 18 Feb 2006 | 1 | Moderate explosions and tephra falls in Puela (SW), Paillate (W), Ambato (NW) and Banos (N). |
| 07 Apr 2006 | 2 | Episodes of strong volcanic tremor and increase in number of long-period seismic events, indicating new magma injection. |
| 25 Apr 2006 | 3 | Notable banded tremor, the inferred product of new injected magma interacting with the hydrothermal system. |
| 12 May 2006 | 4 | 10 May-start of major increase in number of explosions, long-period seismic events and tremor episodes. Very strong detonations (12 per hour). Peak of energy release on 14 May, then decline. Aborted eruption. |
| 30 May 2006 | 5 | Starting 16 May, significant decrease in activity and superficial manifestations. Explosions occur 2-3 times per day; columns of gases (water vapor mainly) with light ash content predominate. |
| 14 Jul 2006 | 6 | Advisory of intensified eruptive activity; notable increase in emissions and strong detonations (at 2210 & 2250 UTC). Incandescent lava flung from crater. Strong ground movements reported on W flank. |
| 14 Jul 2006 | 8 | Very strong detonations, period of calm, then ascent of 15-km-high, dark, ash-laden column. First pyroclastic flow (at 2250 UTC) and others to descend six valleys (quebradas) on the W-NW-N flanks. Intense lava fountaining; moderate ash and scoria fall to the W. |
| 15 Jul 2006 | 8 | Unusually large discharges with a detonation (at 0559 UTC), leading to the largest registered since 1999. Plume rose to ~15 km altitude. The eruptive style later shifted to periodic detonations with intervals of calm. |
A map and table of commonly referred-to locations appeared in a previous issue (BGVN 29:01). Our last report on Tungurahua covered February 2004 to July 2005 (BGVN 30:06), during which time volcanic and seismic activity varied, but included some intervals with comparatively low activity and seismicity such as February to mid-July 2005.
Activity during June to mid-December 2005. From June 2005 through mid-December 2005, volcanic and seismic activity at Tungurahua was at relatively low levels. Low-energy plumes composed of gas, steam, and occasionally small amounts of ash were emitted frequently. Some noteworthy events during this interval follow.
On 7 June 2005, fine ash fell in the Puela sector, ~ 8 km SW. On 24 June, about an hour after an ash eruption, a narrow plume was identified in multispectral satellite imagery. The ash plume was at an altitude of ~ 5.5 km and extended 35-45 km W from the summit.
Ash plumes rose to an altitude of 5.8 km on 4 July. On 21 and 22 August, ash fell in the town of Bilbao, 8 km W of the volcano. On 25 August, ash fell NW of the volcano in the towns of Bilbao and Cusúa. On 1 September, ash fell ~ 8 km SW of the summit in the Puela sector.
On 10 September, a lahar affected an area near the new Baños-Penipe highway. On 14 September, a steam column with little ash reached ~ 300 m above the crater and drifted W; small amounts of ash fell in Puela. A small amount of ash fell in the towns of Cusúa and Bilbao during the morning of 21 September. Fumaroles on the outer edge of the crater were visible from Runtún (6 km NNE of the summit) after not being seen for 6 months. Steam-and-gas plumes rose ~ 1 km and drifted W. A pilot reported an ash plume on 29 September at an altitude of ~ 6.1 km.
During October, and November heavy rain caused lahars to travel down some of the gorges on the volcano's flanks. On 3 and 13 November lahars caused the temporary closure of the Baños-Riobamba highway, and a highway in Pampas. On 15 November ash plumes rose to ~ 9.1 km; on 23 November plumes rose to ~6.7 km.
On 13 December, lahars were generated at Tungurahua that traveled down the Juive (NNW) and Achupashal (W) gorges. On 14 December a steam-and-ash cloud rose ~ 1 km above the volcano. On 17 December, lahars were generated in the NW and W zone of the volcano. There were reports of lahars to the W in the Chontapamba sector that blocked the Baños-Penipe highway, in the Salado sector where the volume of water in the Vazcún increased by 70 percent, and in the NW (La Pampa) sector.
Return, incidence, and significance of broadband seismicity. An important variation in behavior was noted during late December 2005, with the appearance of long-period-earthquake swarms. The swarms preceded emissions and explosions. Such swarms were associated with mid-February 2006 ash-bearing explosions discussed below. After 21 March 2006, the swarms became yet more common and stronger. They were joined by low-frequency harmonic tremor.
Interpreted as related to the motion of magma, the tremor and swarms also seemed closely associated with lava fountains seen in the crater on 25 March 2006. Along with long-period earthquakes there were two episodes of high-amplitude tremor during 4-5 April 2006. Such seismicity had been absent for about a year. Small lava fountains witnessed on the night of 17 April 2006 were again preceded by long-period earthquakes and banded tremor.
As a result, IG distributed two special reports (##2 & 3). The latter contained a spectrogram for late April 2006, illustrating intervals of relative quiet (up to ~ 5 hours long) punctuated by broad-band signals (i.e. coincident earthquakes and tremor) sometimes in tight clusters lasting ~ 90 minutes.
January-May 2006. At the beginning of January 2006, explosions generated moderate amounts of ash, but seismicity remained low. Though clouds obscured the volcano during much of 18-24 January 2006, steam clouds with minor ash content were seen on 20 and 22 January. A discharge of muddy, sediment-laden water along W-flank valleys on 23-24 January blocked the highway. On 25 January light rain caused lahars to flow in the NW sector. The lahars descended a NNW-flank gorge from the village of Juive, causing the closure of the Baños-Penipe highway. Around 28 January, ash fell in the village of Puela. On 31 January, a steam-and-ash plume rose ~1 km above the volcano and drifted W. A small lahar closed a road in Pampas for 2 hours.
On 5 February at 0600, a moderate explosion sent a steam plume, with a small amount of ash, to ~ 1 km above the volcano; the plume drifted SW. Light rainfall on 7 February generated a lahar in the La Pampa area NW of the volcano.
During 6-14 February, several moderate-sized emissions of gas and ash occurred at Tungurahua, with plumes rising to ~ 500 m above the volcano. Long-period earthquakes increased in number on the 6th. An explosion around midnight on 12 February expelled incandescent volcanic material that traveled down the N flank of the volcano. A small amount of ash fell in the town of Puela, SW of the volcano.
IG issued a report (##1; Boletín Especial Volcán Tungurahua) on 18 February 2006 noting slight increases in activity that week. Explosions were moderate; however, ashfall occurred in some settlements bordering the volcano. IG summarized the week with a table similar to one below, with multiple cases of ash fall on local towns (table 11).
Table 11. A summary of Tungurahua's ash falls during an active interval, 13-18 February 2006, and the settlements affected. OVT stands for the Observatorio Volcán Tungurahua, a facility 13 km NW of the summit, down valley from the town of Patate. The report was issued at 1330 on the 18th, explaining why the entries only applied to the first half of that day. Courtesy of IG (special report ##1).
| Date | Number of explosions | Location and comment |
| 13 Feb 2006 | 1 | Puela (~8 km SW of the summit), ashfall during the day. |
| 14 Feb 2006 | 4 | Puela, ashfall during the afternoon. |
| 15 Feb 2006 | 4 | No ashfall reported. |
| 16 Feb 2006 | 9 | Runtun, ashfall at dawn; Observatory (OVT), Pelileo, Banos, and Garcia Moreno subjected to light ashfall in the morning; Bilbao, Cusua, Puela, Humbalo, Bolivar, and Pillate subjected to strong ashfall in the morning. |
| 17 Feb 2006 | 3 | In Chacauco, Cusua, and Juive ash fell at dawn and part of the morning. In Pillate, Cotalo, Cusua, and Huambalo, ash in the morning. In Bilbao, ashfall all day; and Chogluntus, small ashfall during the afternoon. |
| 18 Feb 2006 | 1 | Observations until about 1200. In Banos, OVT, Salasaca, Pondoa, Bilbao, San Juan, and Pelileo, ashfall at dawn. In Banos and Ambato, ashfall in both the morning and afternoon. |
Activity at Tungurahua during 28 February to 6 March consisted of low-level seismicity and emissions of steam and gas, with low ash content. An explosion on the 28th produced a plume composed of steam, gas, and some ash that reached ~ 3 km high.
In addition to the moderate explosions during 8-10 March, light drizzle produced muddy water in the gorges on the volcano's W flank. As a result the Baños-Penipe highway was closed for several hours. On 9 March, ash fell in the zone of Juive on the volcano's NW flank. On 10 March, ash fell in the towns of Pillate, Pondoa, Runtún, and Cusúa (on the W to NW to NNE flanks).
During 16-20 March, small-to-moderate explosions occurred at Tungurahua that consisted of gas, steam, and small amounts of ash. Plumes rose to ~ 3 km above the volcano. During 22-27 March, similar explosions consisted of gas, steam, and small amounts of ash. Plumes rose as high as ~ 1 km above the volcano on several days. An explosion on 26 March was accompanied by incandescent blocks that rolled down the volcano's NW flank.
On 18 February, small amounts of ashfall were reported at the observatory, Cotaló, Cusúa, and other settlements (table 11). On 19 February, rainfall generated a small mudflow SW of the volcano in the Quebrada Rea sector of Puela.
Table 12 summarizes observations associated with plumes and seismicity during 15 February to 8 May 2006. Many observations in that interval noted small-to-moderate explosions or other emissions. Ash plumes to 1-3 km above the volcano (6-8 km altitude) were typical.
Table 12. A compilation of some daily and weekly observations from Tungurahua during 15 February to 8 May 2006. Courtesy of IG.
| Date range | Description of activity (plume heights in kilometers above the summit) |
| 15 Feb-19 Feb 2006 | Ash plume as high as 3 km. |
| 26 Feb-27 Feb 2006 | Steam and gas with low ash content; on the 26th, 1 plume to ~3 km; on the 27th, to 1 km. Both plumes drifted NW. |
| 28 Feb-06 Mar 2006 | Steam and gas with low ash content; on the 28th, 1 plume to ~3 km. Low seismicity. |
| 08 Mar-10 Mar 2006 | Several explosions with low ash content resulting in plumes under 2 km. |
| 16 Mar-20 Mar 2006 | Small-to-moderate explosions consisting of gas, steam, and small amounts of ash. Plumes rose to ~3 km. |
| 22 Mar-27 Mar 2006 | Small-to-moderate explosions consisting of gas, steam, and small amounts of ash. Plumes rose as high as ~1 km above the volcano on several days. |
| 29 Mar-02 Apr 2006 | Small-to-moderate explosions consisting of gas, steam, and small amounts of ash. |
| 04 Apr-10 Apr 2006 | Small-to-moderate explosions at Tungurahua consisting of gas, steam, and small amounts of ash. On the 9th, plumes rose to ~3 km. |
| 11 Apr-17 Apr 2006 | Small-to-moderate explosions produced gas, steam, and small amounts of ash. On the 13th, plumes rose to ~2 km. High seismicity. |
| 19 Apr-23 Apr 2006 | Small-to-moderate explosions produced gas, steam, and small amounts of ash. On the 19th, plumes rose to ~3 km. High seismicity. |
| 28 Apr-01 May 2006 | Small-to-moderate explosions; gas, steam, and small amounts of ash. On the 28th, a plume rose to a maximum height of ~2 km. High seismicity. |
| 04 May-08 May 2006 | Small-to-moderate explosions; gas, steam, and small amounts of ash. High seismicity, dominated by explosions and long-period earthquakes. |
During this 15 February to 8 May time interval ash affected localities as follows. During 29 March to 2 April, ash fell in the Bilbao, Choglontus, Puela, and Manzano sectors, and incandescent blocks rolled down the volcano's NW flank. Around 9 March, ash fell in the Baños, Guadalupe, Chogluntus, Bilbao, and Manzano sectors. Around 1500 on 9 March, several lahars traveled down W-flank gorges, disrupting traffic along the Baños-Penipe highway. An explosion on 26 March was accompanied by incandescent blocks that rolled down the NW flank. During 11-17 April, a small amount of ash fell in the Pondoa sector N of the volcano.
Increased activity starting 10 May 2006. Seismicity for mid-April 2006 to mid-August 2006 appears in figure 28. The figure shows the time sequence of hypocenters with various signal types given separate symbols. Between April and May there was a shallowing of event locations (indicated by the arrow on the left) from -4 km to +2 km. At that point, explosion signals suddenly began to dominate. Those explosion signals came from depths in the range from 0 to over +4 km depth. The 14 May seismic crisis seemingly ended without a large eruption. Explosion signals continued; however, they ceased dominating until around the time of the 14 July eruption when they again became the chief signal (circled area) just prior to the eruption breaking out at the surface.
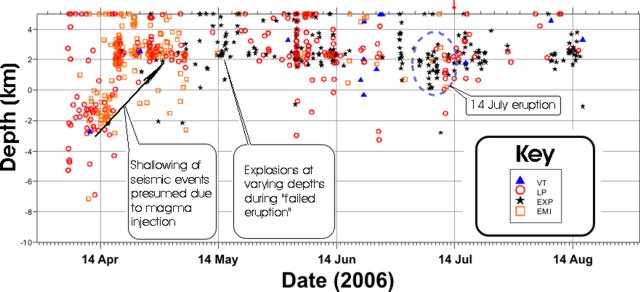 |
Figure 28. Temporal evolution of depth for various kinds of hypocenters recorded at Tungurahua between April and August 2006. Left-hand scale, depth, is fixed to sea level (i.e. 0 is at mean sea level.). The legend shows the symbols for the various signal types shown: VT (volcano-tectonic earthquakes), LP (long-period earthquakes), EXP (explosion signals), and EMI (emission signals). Courtesy of IG. |
IG put out special report ##4 with a cautionary tone. In the 48 hours starting around 10 May, there was a very important increase in activity. IG judged the anomalous, high-activity conditions as severe as previous ones during this crisis (specifically, equivalent to those of October-December 1999, August 2001, September 2002, and October 2003). The summary that follows largely omits the discussion of plausible scenarios aimed at public safety; however, the IG noted that if rapid escalation were to occur during the current unstable situation, they might not have time to issue alerts. They also noted that the eruption might calm.
During the roughly two-day interval, seismometers registered over 130 explosion signals, averaging about three explosions per hour, but with a maximum of 12 per hour. The general tendency was towards yet more increases in the number of explosion signals. The activity was accompanied by continuous signals described as harmonic tremor and emission-related tremor, and after 10 May these tremor signals were also more intense and frequent. In spite of the increase in explosion and tremor signals, emissions of magmatic gases (SO2) and ash stayed at relatively low levels.
First-hand observations during 10-12 May described extraordinarily loud explosions heard from 30-40 km away in Pillaro and from~ 31 km NW in Ambato, but absent 30 km SW in Riobamba. In settlements near the volcano, including Cusúa on the volcano's W foot, glass windows shattered. In some areas, roars were sufficiently intense that vibrations in windows and houses kept inhabitants awake at night. The intensities of eruptions from 10 May were reminiscent of the eruption's onset in 1999.
From the observatory in the Guadelupe sector (13 km NW of the cone) night observers saw the ejection and rolling descent of large glowing blocks of lava, and the crater gave off a permanent glow. However, ash emissions were considerably reduced; the chief component venting was steam with few other gases. The resulting outbursts were not continuous and they were too weak to form mushroom clouds. This was in contrast to other periods of high activity (e.g. August 2001, September 2002, and October 2003), when sustained ash-bearing eruption columns and ash falls were common.
IG special report ##4 noted that the tremor signals during a 48-hour interval after 10 May were the strongest recorded since the eruptions renewed in 1999. The number of explosions and their seismic energy were the highest recorded since the end of 2003, but was less than registered during November 1999 and mid-2000.
On 30 May IG issued its next special report (##5), which noted elevated eruptive activity during 8-14 May, but a clear decrease thereafter. During 10-21 May, the following instruments detected the stated numbers of explosions: seismometers, 801; and infrasonic recorders, 682. The peak in these explosions occurred on 14 May, a day when the instrument counts were as follows: seismometers, 221; infrasonic, 204. As in the previous report, inhabitants close to the volcano heard loud roars, and in some cases were sleepless due to vibrations heard or felt in their homes at night. These conditions convinced residents in Cusúa to move during the night. But starting the 16th, the number and intensity of explosions per day decreased drastically, with only 17 explosions recorded on the 16th, dropping in later days to 2 or 3 daily explosions. According to a local mayor, given the lack of noises and relative calm, evacuees from Cusúa returned home.
The lull in explosions coincided with ongoing fluctuations in seismicity. The IG interpreted this as a sign of continued instability linked to the motion of fluids at depth. The lull in explosion signals accompanied increased gas emissions, which gradually came to contain more and more ash. Small, local ash fall again began to occur. Starting 17 May it became common to see ash columns extending to 4 km above the summit, frequently blown NW.
Reports for the week following 17 May by the Washington VAAC also discussed the increasing ash plumes. On 18 May, an ash plume reached an altitude of 5.2 km above the crater and extended NW. The Washington VAAC also noted that on 19 May, the Instituto Geofísico observed an ash plume that reached an altitude of 12 km. On satellite imagery, ash plumes were visible on 20 and 23 May and extended SW. Hotspots were visible on satellite imagery 19, 20 and 23 May. The ash plume and incandescence on 23 May were also observed on the scene by Instituto Geofísico staff. On 25 May a significant meteorological advisory (SIGMET) indicated an ash plume to an altitude of 5 km. On 27 and 30 May, the VAAC reported that the Instituto Geofísico observed ash plumes at altitudes of 7.9 km and 5 km respectively. IG noted that behavior during the last few weeks of May seemed consistent with a gradual decrease from the state of elevated activity seen in mid-May.
Although satellite thermal data produced alerts during 8-14 May, these ceased later in the month. The reduced thermal flux was taken to suggest reduced manifestations in the crater during mid to late May. Coincident with that, deformation data suggested relative stability, particularly compared to the significant variations seen earlier in May.
During 28 June-4 July, small-to-moderate explosions at Tungurahua produced plumes composed of gas, steam, and small amounts of ash that reached 1.5 km above the summit. Light ashfall was reported in nearby localities during 29 June-2 July. On 29 June, reports of ground movement coincided with an explosive eruption that sent blocks of incandescent material as far as 1 km down the W flank.
During 5-11 July, seismic activity indicating explosions increased at Tungurahua. Incandescent blocks were ejected from the crater during 5 to 8 July, when blocks rolled approximately 1 km down the NW flank. Ash-and-steam plumes with moderate to no ash content were observed to reach maximum heights of 2.5 km above the summit and drifted to the W and NW.
Eruptive style changes after powerful discharges of mid-July 2006. On 14 and 15 July, IG issued its next special reports (##6, 7, and 8) documenting events surrounding the strongest eruption yet seen during the entire 1999-2006 eruptive process. The basis for the size assesment was made from the seismic record based on reduced displacement, sometimes called normalized or root-mean-square amplitude (a means to correct seismic data to a common reference point; McNutt, 2000) The largest discharge occurred at 0559 on 15 July.
On 14 July, seismicity was elevated above that seen in the previous several days. IG noted that at 1710 several large explosions were recorded on instruments, as well as heard by people. An eruption column formed, bearing moderate ash. It initially rose several kilometers but later was estimated to have attained ~ 15 km altitude. This was followed by 20 minutes of quiet. At 1733 a huge explosion presumably opened the conduit. Immediately local authorities were contacted and they evacuated people living on the lower NW-W flanks of the cone. Pyroclastic flows and explosion signals are notable in the seismic record (figure 29).
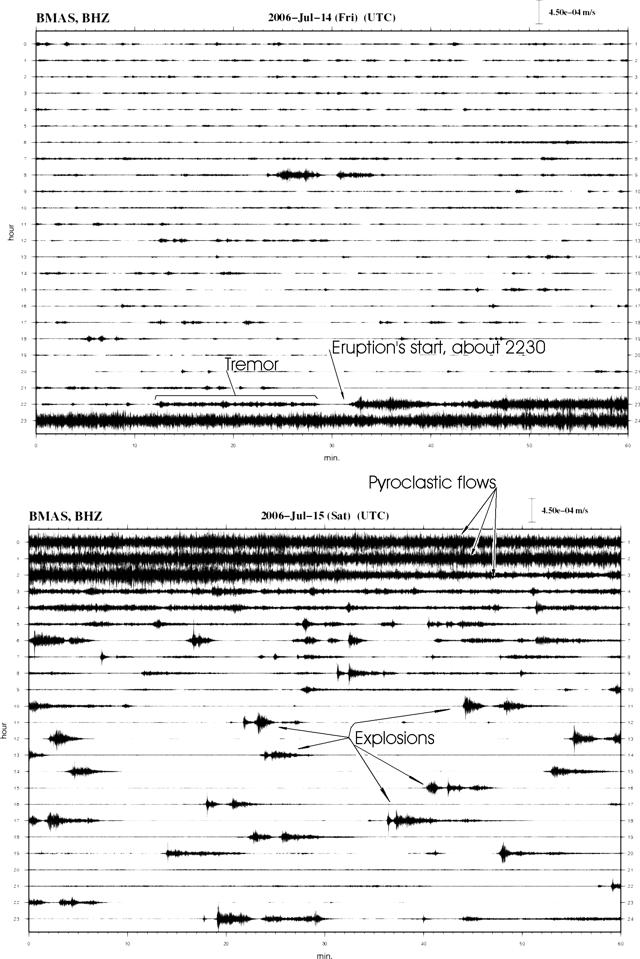 |
Figure 29. Consecutive records for 14-15 July 2006 (upper and lower panels, respectively) observed from the broadband seismic station Mson located on Tungurahua's SW flank at 3.2 km elevation. Time marks on the y-axis show hours (0 to 24) of the day, x-axis marks show minutes (0 to 60). Note the relative quiet on 14 July prior to eruption's onset at 1733. The latter was preceded by ~ 20 minutes of tremor. Courtesy of IG. |
At 0050 on 14 July a pyroclastic flow poured down the NW flank (the Juive Grande drainage). An associated fine ashfall was noted 8 km SW in the town of Puela. Intense Strombolian activity ensued, including glowing blocks tossed 500 m above the crater that bounced downslope for considerable distances. Associated noises were particularly loud and heard widely, including in Ambato (30 km NW). Lookouts described these sounds as distinctive ("bramidos doble golpe;" roughly translated as 'double roars'), a new sound in the suite of those heard since 1999. In the Cusúa area, and up to 13 km NW in the sector of the Observatory of Guadelupe, residents felt intense ground movements.
At 1930 that day pumice fell on the W flank (the sector of Pillate) reaching a thickness of ~ 1 cm. About 10 minutes after the pumice fall, the IG issued the second special report (##7) on the 14 July events. It cautioned residents to remain away from the volcano's W side. The next special report (##8) noted that variations in activity prevailed through the end of 14 July, and that much of the first hour of 15 July brought decreased activity. Tremor continued on 15 July, often in episodes with durations of 4 to 5 minutes, separated by intervening calm intervals of similar duration.
After 0500 on 15 July the eruptive process changed, with the new regime characterized by sequences of abundant large explosions followed by intervals of calm lasting 30-40 minutes. A critical detonation occurred at 0559 on 15 July. On the basis of reduced displacement, it ranked as the largest since the eruption began in 1999. Other detonations with similar character followed the initial one. During 0500-0555 there were 20 large detonations. In assessing the 14-15 July eruptions, satellite analysis by both the Washington Volcanic Ash Advisory Center and the U.S. Air Force Weather Agency confirmed the highest ash-plume tops to altitudes of 15-16 km.
At sunup on 15 July observers found signs that a pyroclastic flow had descended a W-flank drainage (Achupashal valley, between Cusúa and Bilbao). The deposits filled the valley (to 5- to 10-m thickness). Small fires had ignited in the vegetation. A rockfall was also seen in the Bilbao area. Ash falls were reported, containing both ash and scoria fragments, affecting the cities of Penipe, Quero, Cevallo, Mocha, Riobamba, and Guaranda.
Additional fieldwork revealed that pyroclastic flows had traveled down at least six quebradas around the volcano, including Achupasal, Cusúa, Mandur, Hacienda, Juive Grande, and Vascún valleys (the latter, upslope from the western part of the touristic city of Baños).
Figures 30-33 depict the distribution of fresh deposits as well as some photos taken during the 14-15 July eruptions. Tilt and SO2 monitored at Tungurahua appear on figures 34 and 35. Satellite photos from 25 June and 18 July appeared on the NASA Earth Observatory website.
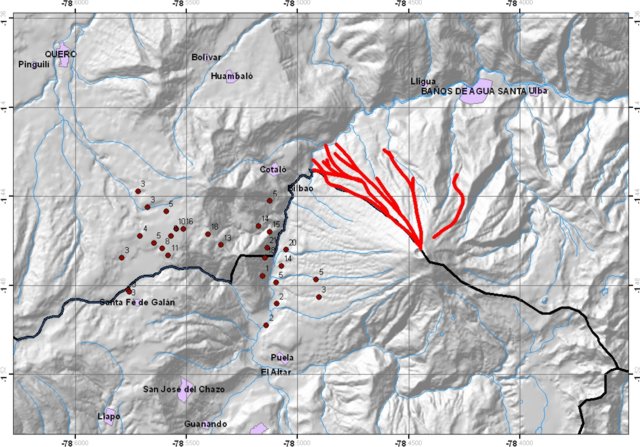 |
Figure 30. Paths where pyroclastic flows descended during Tungurahua's eruption of 14-15 July 2006. The associated ashfall deposits are identified at points W of the volcano's summit (thicknesses in mm). For scale, adjacent E-W grid lines are 4.44 km apart (and Cotalo, on the NW flank is ~8.5 km from the summit). Grid lines are latitude and longitude in degrees (heavy type) and decimal degrees (light type); lines are separated by 0.04 degrees N-S, and 0.05 degrees E-W. Courtesy of IG. |
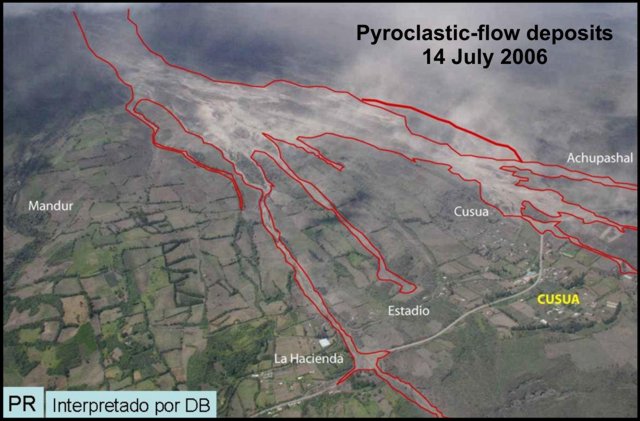 |
Figure 31. Pyroclastic flow routes and deposits on Tungurahua's lower W flank (near Cusúa). Photographed 14 July 2006 Courtesy of IG. |
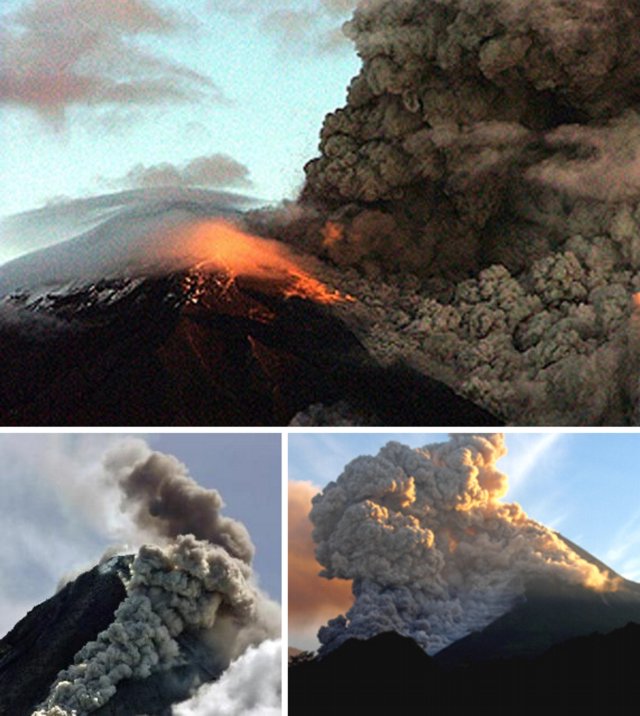 |
Figure 32. Three photos depicting the onset of strong pyroclastic flows on Tungurahua at about 1814 on 14 July 2006. This particular pyroclastic flow descended the Juive Grande river valley. Photo taken from Loma Grande, located about 9 km NNW of the crater. Photographed by L. Gomezjurado; courtesy of IG. |
 |
Figure 33. At Tungurahua, a pyroclastic flow descending the NW-trending Mandur valley at 0653 on 16 July 2006. Photo by P. Mothes, IG. |
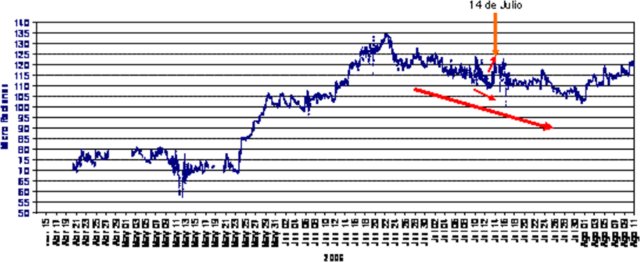 |
Figure 34. Plot showing radial tilt (at station RETU located at 4 km elevation on the N flank), 13 April-11 August 2006. During mid-May to mid-June 2006, tilt at the instrument had been in an inflationary trend. Around 22 June the tilt shifted to deflation, which became strong for a few day just prior to the eruption. The eruption occurred after several hours of sudden inflation. After the eruption, the broad deflationary trend continued until around the beginning of August.Courtesy of IG. |
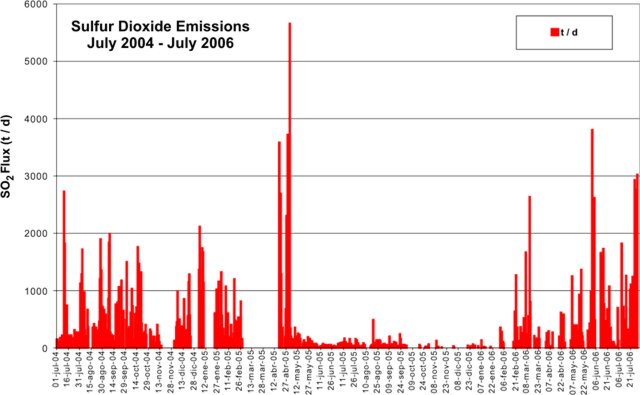 |
Figure 35. SO2 flux at Tungurahua as measured by DOAS, July 2004-July 2006. Courtesy of IG. |
Reference. McNutt, S., 2000, Seismic monitoring, in Encyclopedia of Volcanoes: Academic Press (editor-in-chief, Haraldur Sigurdsson), p. 1095-1119, ISBN 0-12-643140-X.
Geological Summary. Tungurahua, a steep-sided andesitic-dacitic stratovolcano that towers more than 3 km above its northern base, is one of Ecuador's most active volcanoes. Three major edifices have been sequentially constructed since the mid-Pleistocene over a basement of metamorphic rocks. Tungurahua II was built within the past 14,000 years following the collapse of the initial edifice. Tungurahua II collapsed about 3,000 years ago and produced a large debris-avalanche deposit to the west. The modern glacier-capped stratovolcano (Tungurahua III) was constructed within the landslide scarp. Historical eruptions have all originated from the summit crater, accompanied by strong explosions and sometimes by pyroclastic flows and lava flows that reached populated areas at the volcano's base. Prior to a long-term eruption beginning in 1999 that caused the temporary evacuation of the city of Baños at the foot of the volcano, the last major eruption had occurred from 1916 to 1918, although minor activity continued until 1925.
Information Contacts: Geophysical Institute (IG), Escuela Politécnica Nacional, Apartado 17-01-2759, Quito, Ecuador (URL: http://www.igepn.edu.ec/).