Report on Pavlof (United States) — August 2007
Bulletin of the Global Volcanism Network, vol. 32, no. 8 (August 2007)
Managing Editor: Richard Wunderman.
Pavlof (United States) Thermal and seismic data presage August 2007 eruption
Please cite this report as:
Global Volcanism Program, 2007. Report on Pavlof (United States) (Wunderman, R., ed.). Bulletin of the Global Volcanism Network, 32:8. Smithsonian Institution. https://doi.org/10.5479/si.GVP.BGVN200708-312030
Pavlof
United States
55.417°N, 161.894°W; summit elev. 2493 m
All times are local (unless otherwise noted)
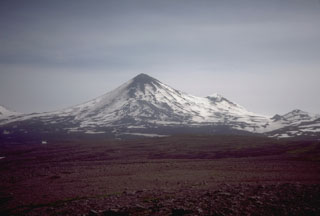
The Alaska Volcano Observatory (AVO) reported that Pavlof (figure 1) erupted on 15 August 2007 for the first time since 15 September 1996 (BGVN 22:09 and Waythomas, Miller, and Mangan, 2006) . Thermal anomalies and seismic activity just prior to the eruption prompted scientists at AVO to issue a warning. This report covers events reported through 3 October 2007.
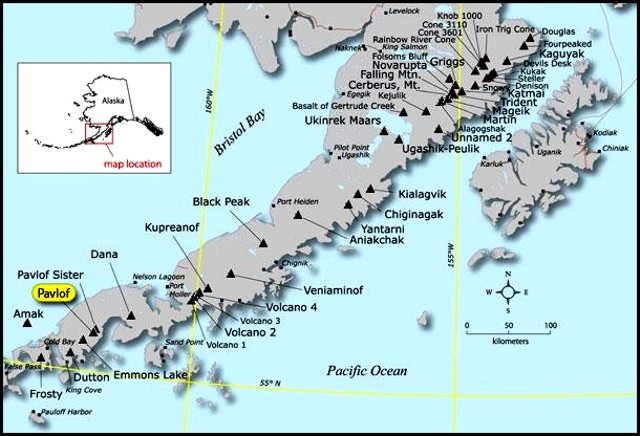 |
Figure 1. Index map showing the location of Pavlof and other Alaska Peninsula volcanoes. Courtesy of AVO and Alaska Division of Geological & Geophysical Surveys. |
According to AVO, an abrupt increase in earthquake activity began at Pavlof early on the morning of 14 August 2007. Based on patterns of unrest leading to past eruptions at Pavlof, AVO elevated the alert level and color code to 'Advisory/Yellow.' Observers from the National Oceanic and Atmospheric Administration's (NOAA) National Weather Service (NWS) in Cold Bay, Alaska, were able to see the volcano on the morning of 14 August and reported no anomalous steaming or other activity; satellite imagery from this morning also showed no obvious signs of surface activity or ash emission.
[AVO detected a strong thermal anomaly at the volcano overnight 14-15 September, and seismic activity continued to increase in both the number of events per hour and duration of individual events. Eyewitnesses aboard a ship reported incandescent blocks tumbling down the ESE flank of the volcano beginning at midnight 14 September (the night of 14-15 September). Satellite data confirmed the presence of lava. Pilot reports indicated that a weak ash plume extended 8 km SW of the summit at a height of ~ 2.6 km. Seismic activity continued at a high level. On 15 August AVO raised the aviation color code from Yellow to Orange and the Alert Level from Advisory to Watch.]
Earthquake intensity continued to increase slowly from 15 to 16 August. Strong signals at a single station SE of the summit suggested local flow activity, probably lahars (or mudflows) on that flank. Satellite images of the volcano overnight and during the morning of 16 August continued to show a strong thermal feature (figure 2). Residents of both Cold Bay and Sand Point, Alaska (105 km and 70 km, respectively, from Pavlof), observed incandescence at the summit during the night.
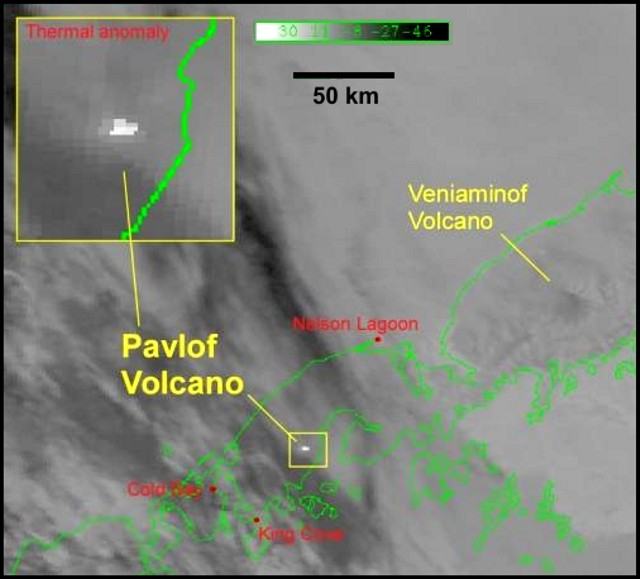 |
Figure 2. NOAA Advanced Very High Resolution Radiometer (AVHRR) satellite image showing a strong thermal anomaly at the summit of Pavlof on 16 August 2007 at 0750 local time (1550 UTC). In this image, white represents hot temperatures. Courtesy of the AVO/U.S. Geological Survey (USGS). |
Persistent earthquake activity and flow events, probably lahars (mudflows), continued on 17 August 2007. Several discrete explosion earthquakes were also recorded. Though clouds obscured the volcano in most satellite images, one GOES (Geostationary Observational Environmental Satellite) image documented a large thermal feature at the summit, interpreted to be lava at the surface.
Activity at Pavlof continued to increase during 17-24 August 2007, with reports that the steam-and-ash plume sometimes exceeded 3 km altitude. For example, a pilot reported the top of the plume to be 5.5 km in the late afternoon of 23 August, and a plume height of 4 km was estimated using satellite data from 1410 that day. Seismic activity remained elevated, with moderate levels of tremor occurring almost continuously and with occasional bursts of higher amplitude. The average seismic amplitude increased slowly throughout the week of 17-24 August. Many small-to-moderate explosions were recorded in the seismic record, as were events from lahars flowing down the SE flank. [Note: Pilot Jeff Linscott of JL Aviation filmed a lahar front on Pavlof's lower flanks before it hit the ocean on 18 August 2007; the film is available on the AVO website, which is listed in under Information Contacts below.] Satellite data showed strong thermal anomalies at the summit, as well as occasional ash clouds, throughout this week.
An AVO field crew visited Pavlof on 18-19 August to make FLIR (forward looking infrared) thermal observations of the ongoing eruption. These observations confirmed the existence of a new vent ~ 200 m below the summit on the SE flank. The vent, ~ 50 m across, fed a lava flow that, on 18 August, was more than 0.5 km long and ~ 25 m across. The crew also observed a lahar reaching the Pacific coast, incandescent lava, and explosions at the vent that sent 5-m-long blocks flying 50 m through the air. Figure 3 shows the plume from Pavlof on 23 August, and figure 4 shows the plume on 30 August 2007.
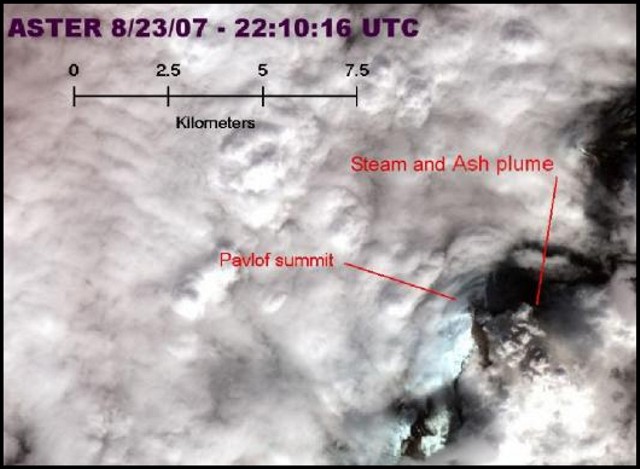 |
Figure 3. An Advanced Spaceborne Thermal Emission and Reflection Radiometer (ASTER) satellite image on 23 August 2007 at 2210 UTC showing Pavlof with a small steam-and-ash plume emitting from the crater on the SE side of the summit. The plume in this image (having a resolution of 15 m/pixel) reached an altitude of ~ 4.0 km based on the plume's temperature. Courtesy of the AVO/USGS. |
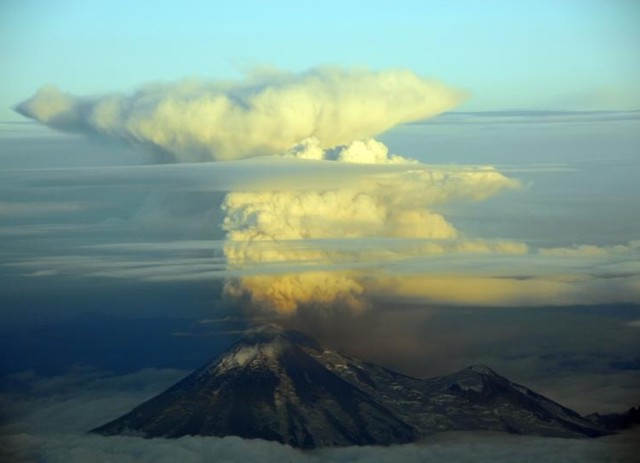 |
Figure 4. Pavlof volcano and eruption plume on evening of 30 August at 2120 local time. View is to the S, out of the right side of a PenAir Metro Airline plane en route to Anchorage from Cold Bay; plume height was approximately 5.2-5.5 km. Courtesy of Chris Waythomas and AVO/USGS. |
At about 2130 local time on 31 August, NOAA/NWS observers in Cold Bay reported a substantial plume emanating from Pavlof, along with associated lightning. The plume, which rose to an altitude of ~ 6 km, was also visible in images from the Pavlof web camera located in Cold Bay. However, there were no indications in satellite data or ground reports of an ash plume. Seismic activity remained elevated through 31 August.
During 1-19 September 2007 the eruption continued; however, seismicity after 10 September declined markedly from levels recorded earlier. AVO pointed out that typical eruptions at Pavlof were characterized by periods of diminished activity interspersed with periods of renewed eruptive activity. Satellite observations continued to show thermal anomalies even through the clouds, as well as steam plumes up to as high as 6.1 km altitude. Table 6 shows thermal anomalies from the beginning of 2007 through 3 October measured by MODIS satellite infrared detectors and processed by the Hawai'i Institute of Geophysics and Planetology (HIGP) Thermal Alerts System called MODVOLC. Anomalies measured during 2007 began on 15 August and continued through 11 September, after which none have been reported to present (3 October). Satellite thermal anomalies are frequently masked by cloud cover.
Table 6. MODIS/MODVOLC thermal anomalies measured at Pavlof for 15 August-11 September 2007; no anomalies were during 1 January-14 August or 12 September through 3 October. Courtesy of the HIGP Thermal Alerts System.
| Date | Time (UTC) | Number of Pixels | Satellite |
| 15 Aug 2007 | 0750 | 2 | Terra |
| 15 Aug 2007 | 1330 | 2 | Aqua |
| 16 Aug 2007 | 0839 | 3 | Terra |
| 16 Aug 2007 | 1235 | 1 | Aqua |
| 18 Aug 2007 | 2150 | 1 | Terra |
| 19 Aug 2007 | 0725 | 1 | Terra |
| 19 Aug 2007 | 1350 | 2 | Aqua |
| 20 Aug 2007 | 0810 | 2 | Terra |
| 20 Aug 2007 | 1210 | 3 | Aqua |
| 20 Aug 2007 | 1350 | 1 | Aqua |
| 23 Aug 2007 | 2210 | 1 | Terra |
| 23 Aug 2007 | 2220 | 1 | Aqua |
| 24 Aug 2007 | 0745 | 7 | Terra |
| 24 Aug 2007 | 1325 | 5 | Aqua |
| 25 Aug 2007 | 1230 | 7 | Aqua |
| 28 Aug 2007 | 1300 | 4 | Aqua |
| 29 Aug 2007 | 0800 | 4 | Terra |
| 30 Aug 2007 | 0705 | 2 | Terra |
| 30 Aug 2007 | 0845 | 4 | Terra |
| 30 Aug 2007 | 1250 | 3 | Aqua |
| 31 Aug 2007 | 0750 | 3 | Terra |
| 31 Aug 2007 | 1155 | 2 | Aqua |
| 31 Aug 2007 | 1330 | 3 | Aqua |
| 01 Sep 2007 | 0830 | 3 | Terra |
| 01 Sep 2007 | 1235 | 1 | Aqua |
| 02 Sep 2007 | 0735 | 1 | Terra |
| 02 Sep 2007 | 0915 | 4 | Terra |
| 02 Sep 2007 | 1320 | 4 | Aqua |
| 04 Sep 2007 | 2230 | 2 | Terra |
| 05 Sep 2007 | 1210 | 4 | Aqua |
| 05 Sep 2007 | 2135 | 2 | Terra |
| 06 Sep 2007 | 0715 | 1 or 2 | Terra |
| 06 Sep 2007 | 0850 | 8 | Terra |
| 06 Sep 2007 | 1255 | 5 | Aqua |
| 07 Sep 2007 | 0755 | 4 | Terra |
| 07 Sep 2007 | 1200 | 6 | Aqua |
| 07 Sep 2007 | 1335 | 4 | Aqua |
| 08 Sep 2007 | 0840 | 1 | Terra |
| 09 Sep 2007 | 0745 | 2 | Terra |
| 09 Sep 2007 | 2115 | 1 | Terra |
| 09 Sep 2007 | 2250 | 1 | Terra |
| 09 Sep 2007 | 2300 | 2 | Aqua |
| 10 Sep 2007 | 0825 | 8 | Terra |
| 10 Sep 2007 | 1230 | 2 | Aqua |
| 11 Sep 2007 | 0910 | 2 | Terra |
| 11 Sep 2007 | 1315 | 2 | Aqua |
| 11 Sep 2007 | 2100 | 2 | Terra |
A status report on 3 October 2007 stated that "A pause in eruptive activity at Pavlof continues. Seismicity remains at low levels and has been relatively unchanged since about September 13. No sign of renewed volcanic activity was noted in clear satellite and web camera views today." [By 5 October the alert levels were returned to Green and Normal for aviation after more than three weeks without eruptive activity; the eruption was determined to have ended on 13 September 2007.]
References. Waythomas, C.F., Miller, T.P., and Mangan, M.T., 2006, Preliminary Volcano Hazard Assessment for the Emmons Lake Volcanic Center, Alaska: Anchorage, Alaska, U.S. Geological Survey, Scientific Investigations Report 2006-5248, 33 p., 1 sheet (available online at http://www.avo.alaska.edu/pdfs/SIR2006-5248.pdf ).
Linscott, J., 2007, Film of Pavlof lahar front, 18 August 2007 [on AVO website, URL: http://www.avo.alaska.edu/volcanoes/volcimage.php?volcname=Pavlof ).
Geological Summary. The most active volcano of the Aleutian arc, Pavlof is a Holocene stratovolcano that was constructed along a line of vents extending NE from the Emmons Lake caldera. Pavlof and Pavlof Sister to the NE form a dramatic pair of symmetrical, glacier-covered stratovolcanoes that overlook Pavlof and Volcano bays. Little Pavlof is a smaller cone on the SW flank of Pavlof volcano, near the rim of Emmons Lake caldera. Unlike Pavlof Sister, eruptions have frequently been reported from Pavlof, typically Strombolian to Vulcanian explosive eruptions from the summit vents and occasional lava flows. The active vents lie near the summit on the north and east sides. The largest recorded eruption took place in 1911, at the end of a 5-year-long eruptive episode, when a fissure opened on the N flank, ejecting large blocks and issuing lava flows.
Information Contacts: Alaska Volcano Observatory (AVO), a cooperative program of the U.S. Geological Survey, 4200 University Drive, Anchorage, AK 99508-4667, USA; Geophysical Institute, University of Alaska, PO Box 757320, Fairbanks, AK 99775-7320, USA; and Alaska Division of Geological & Geophysical Surveys, 794 University Ave., Suite 200, Fairbanks, AK 99709, USA (URL: http://www.avo.alaska.edu/); Hawai'i Institute of Geophysics and Planetology (HIGP) Thermal Alerts System, School of Ocean and Earth Science and Technology (SOEST), Univ. of Hawai'i, 2525 Correa Road, Honolulu, HI 96822, USA (URL: http://modis.higp.hawaii.edu/); Jeff Linscott, JL Aviation Helicopter Service, 8015 NE Airport Way, Portland, OR 97218 USA.