Report on Fernandina (Ecuador) — October 2009
Bulletin of the Global Volcanism Network, vol. 34, no. 10 (October 2009)
Managing Editor: Richard Wunderman.
Fernandina (Ecuador) Thermal and gas analyses of April 2009 eruption
Please cite this report as:
Global Volcanism Program, 2009. Report on Fernandina (Ecuador) (Wunderman, R., ed.). Bulletin of the Global Volcanism Network, 34:10. Smithsonian Institution. https://doi.org/10.5479/si.GVP.BGVN200910-353010
Fernandina
Ecuador
0.37°S, 91.55°W; summit elev. 1476 m
All times are local (unless otherwise noted)
Silvana Hidalgo and Patricia Mothes of the Ecuador Instituto Geofisco, Escuela Politécnica Nacional (IG-EPN) (Geophysical Institute, National Polytechnic School) sent an informal report on gas and temperature measurements during the final stage of the April 2009 eruption of Fernandina (Bourquin and others, 2009). Our last report on Fernandina in April 2009 (BGVN 34:04) discussed this eruption. The following information came from that document.
The 2009 Fernandina volcano eruption, beginning 11 April 2009, was characterized by an extensive lava outpouring on the SW flank and sulfur dioxide (SO2) gas emission. First eyewitnesses reported an eruptive column on the morning of 11 April. Thermal and SO2 anomalies were shown by MODIS and AURA satellites, respectively. Rangers from the Galápagos National Park Service (GPNS) found the active eruptive fissure during a flight on 13 April 2009 (figure 12) . That fissure was near the 2005 eruptive fissure (BGVN 30:04). The 2009 fissure was ~ 200 m long and 10 m wide, and ejected lava fountains 15 m high. A gas and ash plume drifted SW, and a steam plume rose where the lava flow poured into the ocean (figure 13).
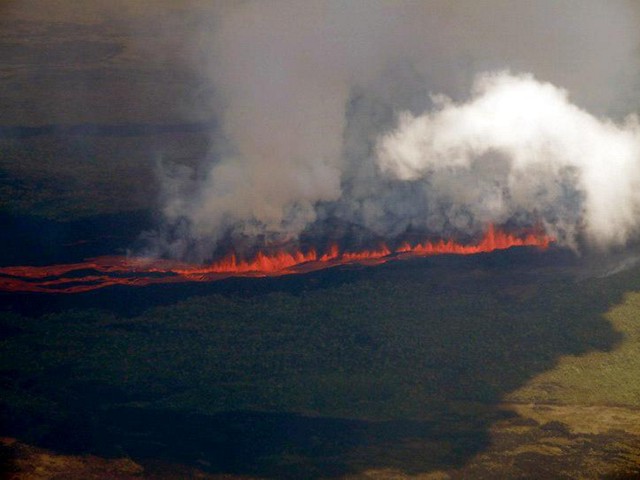 |
Figure 12. Aerial photograph taken 13 April 2009 of the eruptive fissure seen as a horizontal band with a curtain of lava fountains during the Fernandina eruption. Courtesy of Oscar Carvajal, GNPS ranger; from (Bourquin and others, 2009). |
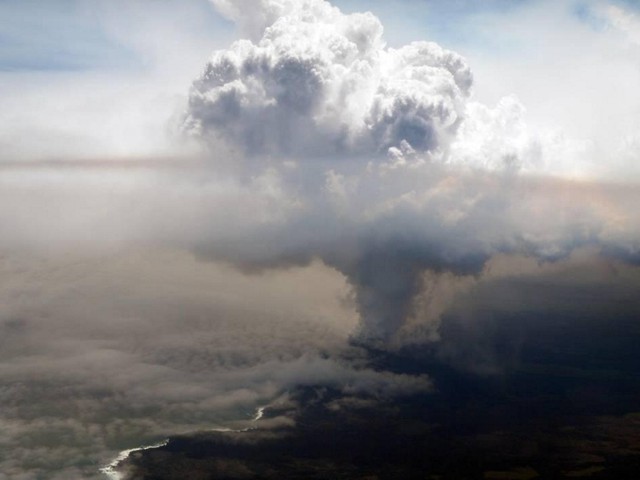 |
Figure 13. Aerial photograph taken 13 April 2009 of the steam plume caused by lava flowing into the ocean during the Fernandina eruption. Courtesy of Oscar Carvajal, GNPS ranger; from (Bourquin and others, 2009). |
During a flight on the morning of 15 April, personnel from the GNPS verified that the eruption continued, but with lower intensity than in the days before. Three vents discharging lava at ~ 400 m elevation on the SW flank along a radial fissure were active, feeding a lava flow up to 10 m wide. During 15-16 April, gas-and-steam plumes from Fernandina drifted up to 555 km W.
The images recorded by the OMI (ozone monitoring instrument) satellite-borne platform showed a drastic decrease of activity after 16 April and a new increase on the 23 April (there was no data between 19 and 23 April due to a satellite update). This decrease in the eruption intensity correlated with a drop in the number of thermal alerts detected by MODIS satellite. The eruption ended on 28 April 2009.
A field campaign was conducted by IGEPN from 27 April to 5 May 2009 to compare ground results with satellite data. Measurements of the SO2 associated with the eruption were conducted 29-30 April. At this time the eruption was nearing completion; the scientists were unable to make field measurements of the high SO2 fluxes during the earlier, more vigorous eruption phase.
SO2 measurements. The SO2 measurements were carried on using a mobile-DOAS (differential optical absorption spectroscopy) instrument composed of a small, upward-looking telescope, connected by optical fiber to a spectrometer and a GPS (global positioning system) receiver (figure 14). The measurements were performed during several traverses around the eruption vent using a small boat supplied by the Galápagos National Park. One traverse along the W side (downwind side) of the island, conducted on 29 April 2009, found a SO2 flux maximum measurement of 2,997 tons/day. On 30 April, a traverse along the S and SW side of the island measured 527 tons/day. The IG-EPN report gave more detailed data on all measurements in support of the SO2 program made during the 2-day survey.
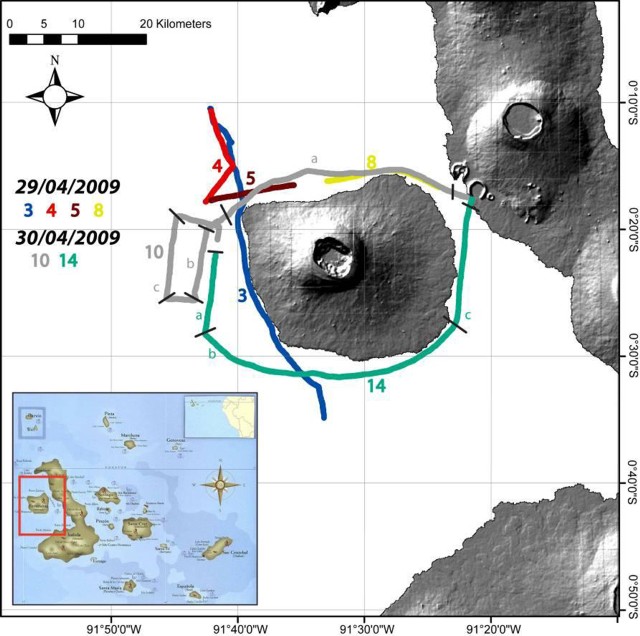 |
Figure 14. Shaded relief map [digital elevation model (DEM)] of Fernandina Island including the NW part of Isabela to the E. The labeled lines correspond to the small boat traverses done on 29-30 April 2009 to measure environmental properties for SO2 flux analyses. Courtesy of Bourquin and others, 2009. |
Ozone monitoring instrument (OMI) satellite images showed degassing from 11-16 April 2009, with the higher SO2 values on 12 and 14 April. This degassing was associated with ash emission observed with MODIS satellite (shown in BGVN 34:04). From 17-19 April almost no SO2 was visible in the satellite images. After 4 days without data, satellite images showed a high SO2 emission on 23 April, increasing until 25 April when the eruption began its decline. After this date, and for the days when the field measurements were conducted, little SO2 was present in the atmosphere.
Thermal measurements. The team made measurements using a forward looking infrared (FLIR) thermal camera during a flight over the zone covered by the fresh lava flows (figure 15, table 2). These measurements, associated with post eruption satellite images, allowed an estimation of the area covered by the eruption products.
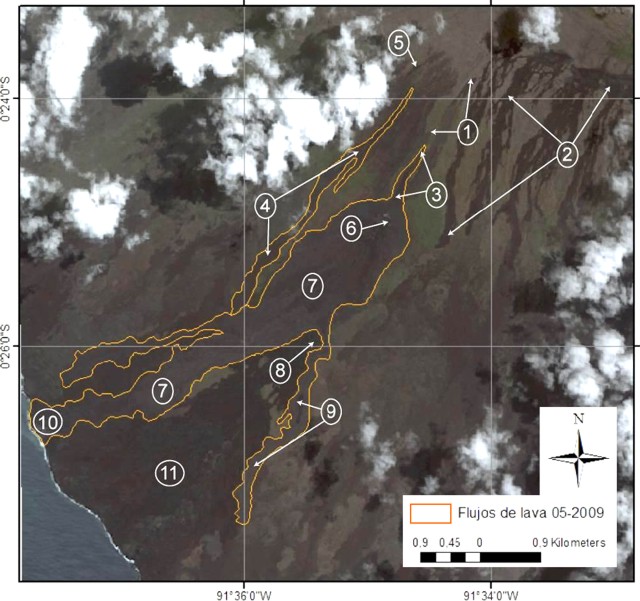 |
Figure 15. High-resolution satellite image after the April 2009 Fernandina eruption identifying individual lava flows and other points of interest. Courtesy of Bourquin and others (2009). |
Table 2. Description of points of interest at Fernandina from comparison of satellite thermal images and lava flow photographs. Location numbers correspond to the numbered points in figure 15. Courtesy of Bourquin and others (2009).
| Event | Location Number | Comments |
| 1995 eruption (radial fissure) | 1 | Upper vents at elevation of ~1,000 and ~750 m with the associated lava flows. |
| 2005 eruption (circumferential fissure) | 2 | Upper vents with the associated lava flows. |
| 2009 eruption (radial fissure) | 3 | Upper vents at elevation of ~550 m covering part of the 1995 eruptive fissure and lava flows; vents displayed activity during the first overflight (13 April 2009) (figure 16); maximum apparent temperature measured with the thermal camera was 179.3°C. |
| 2009 eruption (radial fissure) | 4 | Upper vents at elevation of ~700 m located to W of 1995 eruptive fissure; vents active during the first flight (13 April 2009); maximum apparent temperature measured with the thermal camera was 67°C. |
| 2009 eruption | 5 | Dark grey patch not observed on images previous to April 2009 eruption; might correspond to a short-life vent with small lavas. |
| 2009 eruption (radial fissure) | 6 | Principal vents at elevation of ~500 m; last visual observation of incandescence was on 29 April 2009 during; measurements with the thermocouple in a 50 cm crack and greater-than-30-m-long crack gave maximum temperature of 970°C. |
| 2009 eruption | 7 | Area covered by principal April 2009 lava flows that reached the sea; maximum apparent temperature measured with the thermal camera was 131.9°C. |
| 1995 eruption (radial fissure) influence 2009 lava flow | 8 | Principal 1995 vent; during the first part of 2009 eruption, lava flowed W to this vent and reached the ocean; after a while, it changed its course and flowed E to the vent but never reached the ocean. |
| 1995 lava field and 2009 lava flow | 9 | SE lobe of the 2009 lava flow borders 1995 lava field and ends 1,800 m before entering into the ocean; maximum apparent temperature measured with the thermal camera was 70.9°C (figure 17). |
| 2009 eruption | 10 | April 2009 lava flows entered into the ocean the first days of the eruption; this region of the lava flows is 800 m-wide (figure 18); maximum apparent temperature measured with the thermal camera was 132°C. |
| 1995 eruption | 11 | 1995 eruption lava field. |
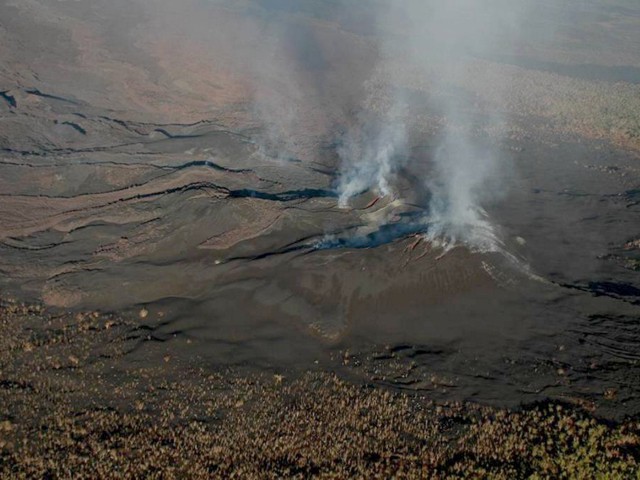 |
Figure 16. Aerial photo showing the upper fissure and the principal vents of the April 2009 Fernandina eruption. Courtesy of Bourquin and others (2009). |
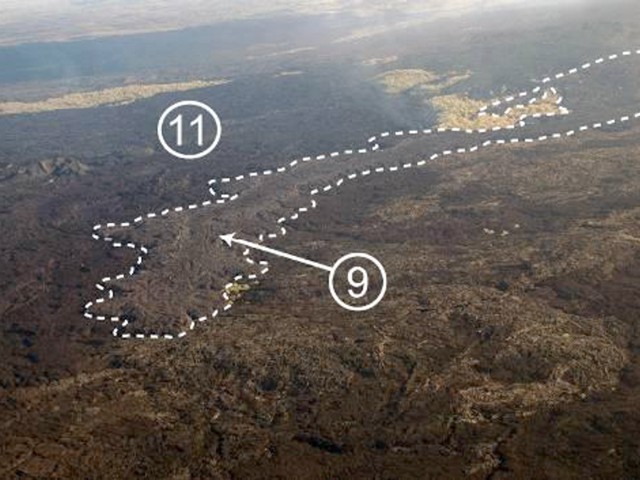 |
Figure 17. Photograph of SE lava flow (area 9) from the April 2009 Fernandina eruption. Area number 11 corresponds to the 1995 eruption lava field. Courtesy of Bourquin and others (2009). |
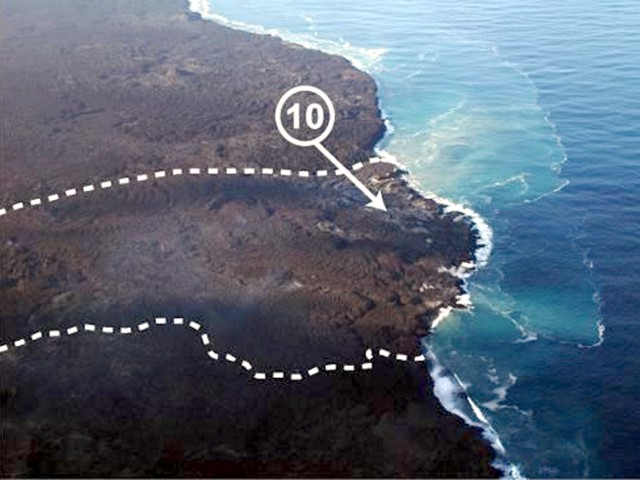 |
Figure 18. Photograph of lava flow entering the ocean on the SW coast (area 10) from the April 2009 Fernandina eruption. Courtesy of Bourquin and others (2009). |
Estimation of the area covered. The area covered by the April 2009 Fernandina volcano eruption was estimated using (1) thermal images taken with the infrared camera FLIR during the overflight of 1 May 2009, (2) QUICKBIRD satellite image (browse image visible; 11 May 2009), (3) ASTER satellite image (16 May 2009), (4) photographs taken by the personal of IGEPN and GNPS during the overflight of 1 May 2009, and (5) a Digital Elevation Model (DEM) provided by the IGEPN. Thanks to the strong thermal contrast between the new products and the older lava flows, it was possible to map precisely the limits of April 2009 eruption.
The thermal contrast information was stacked on the satellite images and the area has been calculated with the help of the DEM (figure 19). The area covered by the April 2009 eruption is of about 6.7 km2 which is a value similar to the 1995 eruption (6.5 km2; Rowland and others, 2003). Unfortunately no thickness measurements are available for the April 2009 lava flows. Nevertheless, considering the similarities between both eruptions, IGEPN scientists used the average thickness calculated by Rowland and others (2003) for the 1995 eruption (8.5 ? 2 m), to calculate the 2009 eruption volume. It gives an approximate volume of 57 ? 13 million m3 of lava emitted. This volume is equivalent to those of 1995 and 1988 but the emission rates were drastically different. This estimation has to be taken carefully as no thickness measurement was done during the fieldwork.
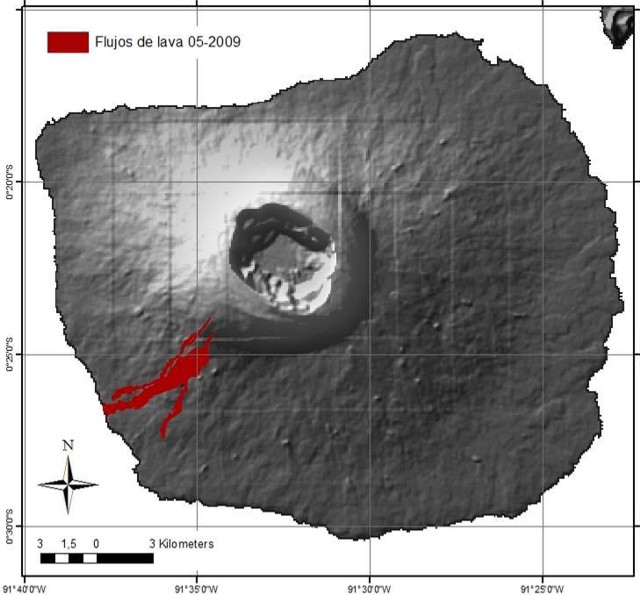 |
Figure 19. Map of Fernandina showing the extent of the April 2009 lava flows extending down the SW flank to the ocean. Courtesy of Bourquin and others (2009). |
Satellite thermal data. As shown in BGVN 34:04, from 11 April to 22 June 2009 MODVOLC detected 789 hot-spots on Fernandina Island with 725 during the time of the eruption and 64 after it. The number of thermal alerts was the highest for 12 April and then decreased until the end of the eruption. At least three episodes of high effusion occurred, during 11-14, 16-19, and 28 April. Comparing these observations with the OMI satellite images, the first two effusive episodes were accompanied by high SO2 emissions, but not the last one. This could be due to an artifact on the OMI satellite image for 28 April. The decreasing number of thermal alerts after 28 April is thought to illustrate the cooling of the lava flows, as they are not associated with SO2 emissions.
Eruption photos. The smugmug.com website shows a number of photos of the April 2009 Fernandina eruption from offshore. According to the website, the vessel carrying the photographers was restricted from sailing to visit the side of Fernandina Island where the volcano was erupting in mid-April. On 19 April the vessel was given permission by the Galapagos National Park to see the volcano. The boat anchored ~ 1.6 km offshore and the photographers boarded small boats to get within ~ 90 m of where the lava was pouring into the sea (figures 20 and 21).
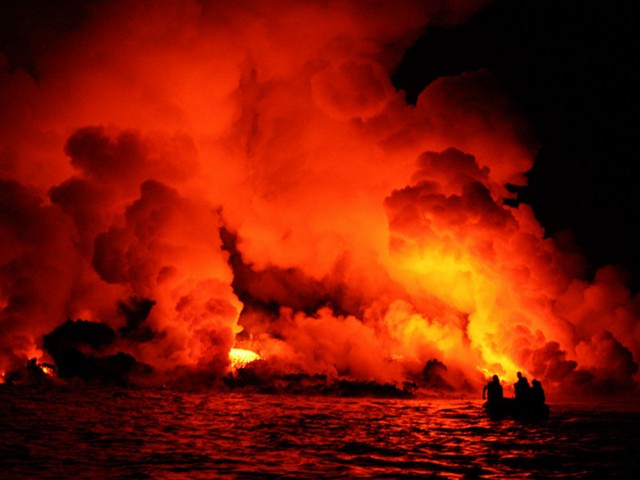 |
Figure 20. Night photo of the ocean entry area at Ferandina taken 19 April 2009. In this photo a small boat is apparent in the right midground, with silhouettes of people highlighed by incandescence in the background. Courtesy of smugmug; the photographer's name was not specified on that website. |
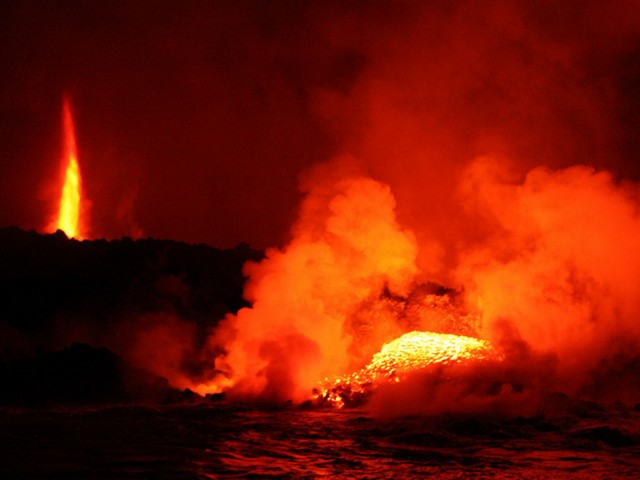 |
Figure 21. Photo of the ocean entry area at Fernandina taken 19 April 2009. In this photo the red-orange lava about to enter the ocean is apparent at right and at elevation on the left appears a a fountain jets towards the night sky. Courtesy of smugmug; the photographer's name was not specified on that website. |
References. Bourquin, J., Hidalgo, S., Bernard, B., Ramón, P., Vallejo, S., and Parmigiani, A, 2009, April 2009 Fernandina volcano eruption, Galápagos Islands, Ecuador: SO2 and thermal field measurements compared with satellite data: Informal report, Instituto Geofisco Escuela Politécnica Nacional (IGEPN).
Rowland, S.K., Harris, A.J.L., Wooster, M.J., Amelung, F., Garbeil, H., Wilson, L, and Mouginis-Mark, P.J., 2003, Volumetric characteristics of lava flows from interferometric radar and multispectral satellite data: The 1995 Fernandina and 1998 Cerro Azul eruptions in the western Galápagos: Bulletin of Volcanology, v. 65, no. 5, p. 311-330.
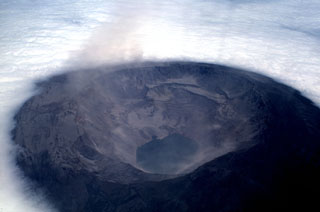
Geological Summary. Fernandina, the most active of Galápagos volcanoes and the one closest to the Galápagos mantle plume, is a basaltic shield volcano with a deep 5 x 6.5 km summit caldera. The volcano displays the classic "overturned soup bowl" profile of Galápagos shield volcanoes. Its caldera is elongated in a NW-SE direction and formed during several episodes of collapse. Circumferential fissures surround the caldera and were instrumental in growth of the volcano. Reporting has been poor in this uninhabited western end of the archipelago, and even a 1981 eruption was not witnessed at the time. In 1968 the caldera floor dropped 350 m following a major explosive eruption. Subsequent eruptions, mostly from vents located on or near the caldera boundary faults, have produced lava flows inside the caldera as well as those in 1995 that reached the coast from a SW-flank vent. Collapse of a nearly 1 km3 section of the east caldera wall during an eruption in 1988 produced a debris-avalanche deposit that covered much of the caldera floor and absorbed the caldera lake.
Information Contacts: Silvana Hidalgo and Patricia Mothes, Instituto Geofisco Escuela Politécnica Nacional (IGEPN) (Geophysical Institute, National Polytechnic School), Casilla 1701-2759, Quito, Ecuador (URL: http://www.igepn.edu.ec/); Hawai'i Institute of Geophysics and Planetology (HIGP) Thermal Alerts System, School of Ocean and Earth Science and Technology (SOEST), Univ. of Hawai'i, 2525 Correa Road, Honolulu, HI 96822, USA (URL: http://modis.higp.hawaii.edu/); Kevin L. Bailey (URL: http://www.wildphotopics.com/International/Galapagos-Islands-and-Quito/Fernandina-Island-La/i-JZ5VQh6).